Oneida county survey - Cornell...
38
Ketterings, Q.M., H. Krol, W.S. Reid and J. Miller (2003). Oneida County Soil Sample Survey 1995-2001. CSS Extension Bulletin E03-17. 38 pages. 1 Soil Sample Survey Oneida Co. Samples analyzed by CNAL in 1995-2001 Farming in Oneida County Summary compiled by Quirine M. Ketterings, Hettie Krol, W. Shaw Reid and Jeff Miller Nutrient Management Spear Program: http://nmsp.css.cornell.edu/
-
Upload
vuongthuan -
Category
Documents
-
view
220 -
download
3
Transcript of Oneida county survey - Cornell...

Ketterings, Q.M., H. Krol, W.S. Reid and J. Miller (2003). Oneida County Soil Sample Survey 1995-2001. CSS Extension Bulletin E03-17. 38 pages.
1
Soil Sample Survey
Oneida Co. Samples analyzed by CNAL in 1995-2001
Farming in Oneida County
Summary compiled by
Quirine M. Ketterings, Hettie Krol, W. Shaw Reid and Jeff Miller
Nutrient Management Spear Program: http://nmsp.css.cornell.edu/

Ketterings, Q.M., H. Krol, W.S. Reid and J. Miller (2003). Oneida County Soil Sample Survey 1995-2001. CSS Extension Bulletin E03-17. 38 pages.
2
Soil Sample Survey
Oneida Co. Samples analyzed by CNAL in 1995-2001
Summary compiled by
Quirine Ketterings and Hettie Krol Nutrient Management Spear Program Department of Crop and Soil Sciences 817 Bradfield Hall, Cornell University
Ithaca NY 14853
W. Shaw Reid Professor Emeritus
Department of Crop and Soil Sciences
Jeff Miller Assistant Director
Cornell Cooperative Extension of Oneida County
July 18, 2003
Correct Citation:
Ketterings, Q.M., H. Krol. W.S. Reid, and J. Miller (2003). Soil samples survey of Oneida County. Samples analyzed by the Cornell Nutrient Analysis Laboratory in 1995-2001. CSS Extension Bulletin E03-17. 38 pages.
Ketterings, Q.M., H. Krol, W.S. Reid and J. Miller (2003). Oneida County Soil Sample Survey 1995-2001. CSS Extension Bulletin E03-17. 38 pages.
3
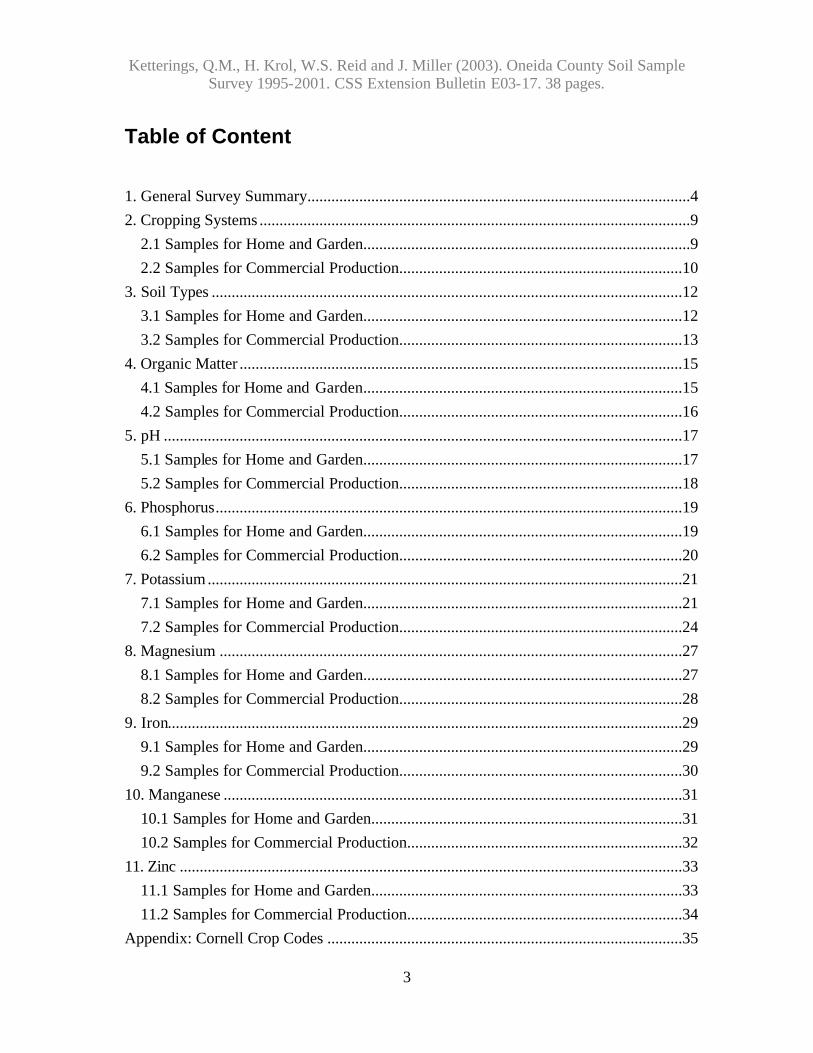
Table of Content
1. General Survey Summary................................................................................................4 2. Cropping Systems ............................................................................................................9
2.1 Samples for Home and Garden..................................................................................9 2.2 Samples for Commercial Production.......................................................................10
3. Soil Types ......................................................................................................................12 3.1 Samples for Home and Garden................................................................................12 3.2 Samples for Commercial Production.......................................................................13
4. Organic Matter ...............................................................................................................15 4.1 Samples for Home and Garden................................................................................15 4.2 Samples for Commercial Production.......................................................................16
5. pH ..................................................................................................................................17 5.1 Samples for Home and Garden................................................................................17 5.2 Samples for Commercial Production.......................................................................18
6. Phosphorus.....................................................................................................................19 6.1 Samples for Home and Garden................................................................................19 6.2 Samples for Commercial Production.......................................................................20
7. Potassium.......................................................................................................................21 7.1 Samples for Home and Garden................................................................................21 7.2 Samples for Commercial Production.......................................................................24
8. Magnesium ....................................................................................................................27 8.1 Samples for Home and Garden................................................................................27 8.2 Samples for Commercial Production.......................................................................28
9. Iron.................................................................................................................................29 9.1 Samples for Home and Garden................................................................................29 9.2 Samples for Commercial Production.......................................................................30
10. Manganese ...................................................................................................................31 10.1 Samples for Home and Garden..............................................................................31 10.2 Samples for Commercial Production.....................................................................32
11. Zinc ..............................................................................................................................33 11.1 Samples for Home and Garden..............................................................................33 11.2 Samples for Commercial Production.....................................................................34
Appendix: Cornell Crop Codes .........................................................................................35

4
1. General Survey Summary
This survey summarizes the soil test results from Oneida County soil samples submitted for analyses to the Cornell Nutrient Analysis Laboratory (CNAL) during 1995-2001. The total number of samples analyzed in these years amounted to 1731. Of these, 1404 samples (81%) were submitted to obtain fertilizer recommendations for commercial production while 327 samples (19%) were submitted as home and garden samples.
0
100
200
300
400
500
Num
ber
of s
ampl
es
1995 1996 1997 1998 1999 2000 2001
Samples for commercial productionSamples for home and garden
Homeowners
Commercial
Total
1995 46 1995 309 355 1996 22 1996 186 208 1997 65 1997 156 221 1998 42 1998 199 241 1999 55 1999 219 274 2000 49 2000 158 207 2001 48 2001 177 225 Total
327 Total 1404 1731

Ketterings, Q.M., H. Krol, W.S. Reid and J. Miller (2003). Oneida County Soil Sample Survey 1995-2001. CSS Extension Bulletin E03-17. 38 pages.
5
Most of the home and garden soil samples submitted in the period 1995-2001 were submitted to request fertilizer recommendations for lawns (39%), vegetable gardens (20%), garden vegetable production (20%) and perennials (12%). People submitting samples for commercial production requested fertilizer recommendations for corn silage or grain (38%) and alfalfa, alfalfa/grass or alfalfa/trefoil mixtures (25%), while a few producers were planning on growing other crops includ ing grass hay and grass for pasture, clover/grass mixtures, small grains and vegetables. Home and garden samples in Oneida County were mostly silty soils belonging to soil management group 2 (39%). Twenty four percent belonged to soil management group 3. Group 4 was represented by 20% of all samples and 17% were classified as group 5 soils. The table below gives descriptions of each of the soil management groups. Soil Management Groups for New York
1
Fine-textured soils developed from clayey lake sediments and medium- to fine-textured soils developed from lake sediments.
2
Medium- to fine-textured soils developed from calcareous glacial till and medium-textured to moderately fine-textured soils developed from slightly calcareous glacial till mixed with shale and medium-textured soils developed in recent alluvium.
3
Moderately coarse textured soil developed from glacial outwash and recent alluvium and medium-textured acid soil developed on glacial till.
4
Coarse- to medium-textured soils formed from glacial till or glacial outwash.
5
Coarse- to very coarse-textured soils formed from gravelly or sandy glacial outwash or glacial lake beach ridges or deltas.
6 Organic or muck soils with more than 80% organic matter.
Of the samples submitted for commercial production, 36% belonged to soil management group 2. Twenty one percent were from soil management group 3. Group four and five were represented by 21 and 20% of the samples, respectively. Only one percent was

Ketterings, Q.M., H. Krol, W.S. Reid and J. Miller (2003). Oneida County Soil Sample Survey 1995-2001. CSS Extension Bulletin E03-17. 38 pages.
6
classified as a muck soil (soil management group 6). The five most common soil series were Alton (15%), Lima (10%), Howard (9%), Honeoye (8%), and Nellis (6%). These soils represent 5% (Alton), 3% (Lima), 2% (Howard), 4% (Honeoye), and 1% (Nellis) of the total 804,630 acres of the county. Organic matter levels, as measured by loss on ignition, ranged from less than 1% to over 36% (muck soils) with median values ranging from 2.6 to 5.1% organic matter for home and garden samples and values ranging from 3.7 to 4.2% for samples submitted for commercial production. Fifty six percent of the home and garden samples had between 2 and 5% organic matter with 12% testing between 2 and 2.9% organic matter, 22% between 3.0 and 3.9% organic matter and 22% between 4.0 and 4.9% organic matter. Thirty five percent of the soils submitted for home and garden tested >4.9% in organic matter while 9% had less than 2% organic matter. Of the samples submitted for commercial production, 35% contained between 3 and 4% organic matter, 31% tested between 4.0 and 4.9% while 11% had organic matter concentrations of 5.0-5.9%. In total, 45% of the samples submitted for commercial production had organic matter levels between 4.0 and 6.9%. Soil pH in water (1:1 extraction ratio) varied from pH 3.4 to 8.6 with the median for home and garden samples ranging from pH 6.8 to pH 7.5 and for samples submitted for commercial production ranging from pH 6.2 to pH 6.6. Of the home and garden samples, 77% tested between pH 6.5 and 7.9. For the samples submitted for commercial production, 47% tested between pH 6.5 and 7.9 while 31% tested between pH 6.0 and 6.4 and 21% tested between pH 5.0 and 5.9. Extractable nutrients such as phosphorus (P), potassium (K), magnesium (Mg), calcium (Ca), iron (Fe), manganese (Mn), and zinc (Zn) were measured using the Morgan solution and extraction method (Morgan, 1941). This solution contains sodium acetate buffered at a pH of 4.8. Soil test P levels of <1 lb P/acre are classified as very low. Between 1-3 lbs P/acre is low. Medium is between 4-8 lbs P/acre. High testing soils have P levels between 9 and 39 lbs P/acre and soils with >39 lbs P/acre are classified as very high. Of the home and garden samples, 15% tested low, 16% tested medium, 44% tested high and 26% tested very high. This meant tha t 70% of the home and garden samples tested high or very high in P.

Ketterings, Q.M., H. Krol, W.S. Reid and J. Miller (2003). Oneida County Soil Sample Survey 1995-2001. CSS Extension Bulletin E03-17. 38 pages.
7
Phosphorus levels for samples for commercial production in Oneida County were lower than the state average (approximately 50% of the soils submitted for commercial production to CNAL in 1995-2001 tested high or very high in P). Four percent of the samples tested very high in P. Twenty nine percent were low in P, 32% tested medium for P while 35% of the submitted samples were classified as high in soil test P. This means that 39% tested high or very high in P. There were no clear trends in P levels over the 6 years. Classifications for potassium depend on soil management group. The fine-textured soils of soil management group 1 have a greater K supplying capacity than the coarse textured sandy soils (soil management group 5). Classification for each of the management groups in the above table represent very low, low, medium, high and very high. For example, for soil management group 5 and 6, a soil test results of <60 lbs K/acre means the soil is very low in K, between 60 and 114 lbs K/acre is low, 115-164 lbs K/acre is medium, 165-269 lbs K/acre is high and >269 lbs K/acre is classified as very high (see the table below). Potassium classifications depend on soil test K levels and soil management group.
Potassium Soil Test Value (Morgan extraction in lbs K/acre)
Soil Management
Group
Very low
Low
Medium
High
Very High
1
<35
35-64
65-94
95-149
>149
2 <40 40-69 70-99 100-164 >164 3 <45 45-79 80-119 120-199 >199 4 <55 55-99 100-149 150-239 >239
5 and 6 <60 60-114 115-164 165-269 >269
Of the home and garden samples, 3% were classified as very low and 13% tested low in potassium. Fourteen percent tested medium, 24% high and 46% very high. For samples submitted for commercial production, 3% tested very low in K, 13% tested low, 20% were medium, 31% tested high and 32% were very high in potassium. As with phosphorus, there were no trends over the 6 years of soil sampling.

Ketterings, Q.M., H. Krol, W.S. Reid and J. Miller (2003). Oneida County Soil Sample Survey 1995-2001. CSS Extension Bulletin E03-17. 38 pages.
8
Soils test very low for magnesium if Morgan extractable Mg is less than 20 lbs Mg/acre. Low testing soils have 20-65 lbs Morgan Mg per acre. Soils with 66-100 lbs Mg/acre test medium for magnesium. High testing soils have 101-199 lbs Mg/acre while soils with more than 200 lbs Mg/acre in the Morgan extraction are classified as very high in Mg. Magnesium levels ranged from less than 10 to more than 2000 lbs Mg/acre (Morgan extraction). There were few samples that tested very low in Mg. Most soils tested high or very high for Mg (93% of the homeowner soils and 87% of the soils of the commercial growers). No more than 21 of the homeowner soils and 13% of the commercial growers’ soil tested very low, low or medium in Mg. Soils with more than 50 lbs Morgan extractable Fe per acre test excessive for Fe. Anything lower than 50 lbs Fe/acre is considered normal. Iron levels fell for 95-96% in the normal range with 5% of the home and garden samples and 4% of the samples for commercial production testing excessive for Fe. Similarly, most soils (93-98%) for both groups tested normal for manganese. Soils with more than 100 lbs Morgan extractable Mn per acre are classified as excessive in Mn. Anything less than 100 lbs Mn per acre is classified as normal. Soils with less than 0.5 lb zinc per acre in the Morgan extraction are classified as low in Zn. Medium testing soils have between 0.5 and 1 lb of Morgan extractable Zn per acre. If more than 1 lb of Zn/acre is extracted with the Morgan solution, the soil tests high in Zn. For the home and garden samples, 91% tested high for zinc while 9% tested medium. Of the samples for commercial production, 5% tested low in zinc, 34% tested medium while 61% was high in zinc. In the following sections, the summary tables for each of the soil fertility indicators described above are given. The appendix contains the crop codes used in section 2.
Reference
• Morgan, M.F. 1941. Chemical soil diagnosis by the universal soil testing system.
Connecticut Agricultural Experimental Station. Bulletin 450.
Ketterings, Q.M., H. Krol, W.S. Reid and J. Miller (2003). Oneida County Soil Sample Survey 1995-2001. CSS Extension Bulletin E03-17. 38 pages.
9
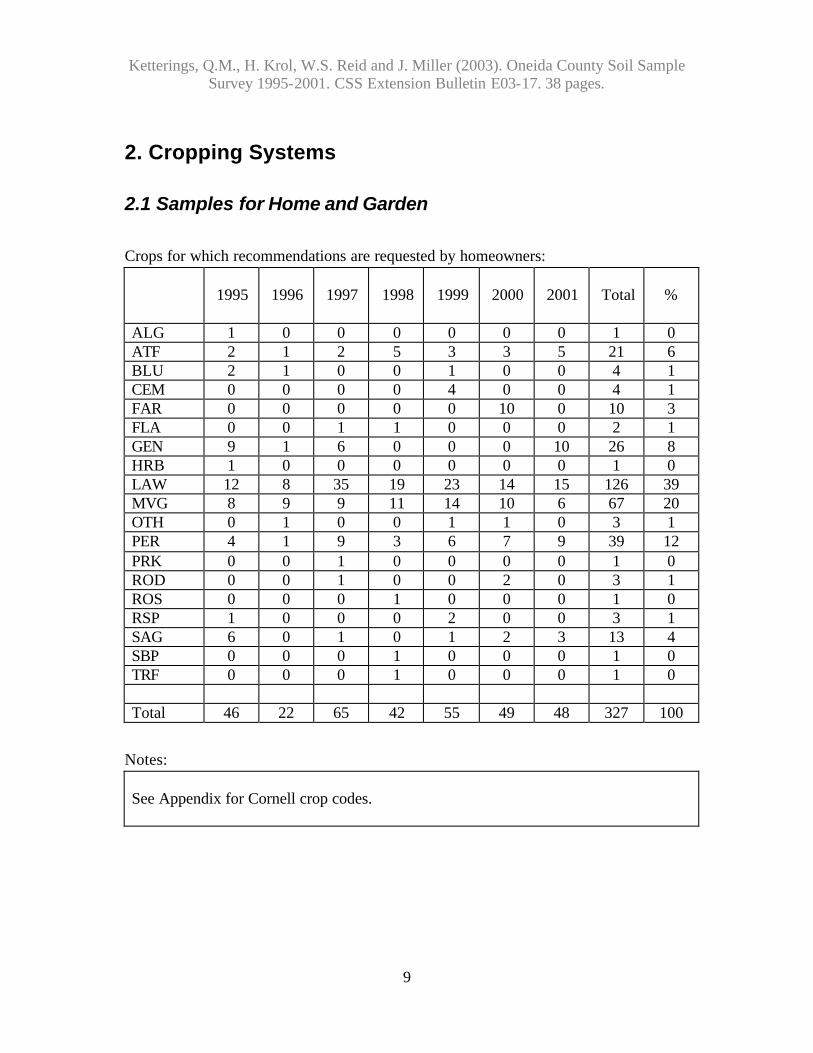
2. Cropping Systems
2.1 Samples for Home and Garden Crops for which recommendations are requested by homeowners:
1995
1996
1997
1998
1999
2000
2001
Total
%
ALG 1 0 0 0 0 0 0 1 0 ATF 2 1 2 5 3 3 5 21 6 BLU 2 1 0 0 1 0 0 4 1 CEM 0 0 0 0 4 0 0 4 1 FAR 0 0 0 0 0 10 0 10 3 FLA 0 0 1 1 0 0 0 2 1 GEN 9 1 6 0 0 0 10 26 8 HRB 1 0 0 0 0 0 0 1 0 LAW 12 8 35 19 23 14 15 126 39 MVG 8 9 9 11 14 10 6 67 20 OTH 0 1 0 0 1 1 0 3 1 PER 4 1 9 3 6 7 9 39 12 PRK 0 0 1 0 0 0 0 1 0 ROD 0 0 1 0 0 2 0 3 1 ROS 0 0 0 1 0 0 0 1 0 RSP 1 0 0 0 2 0 0 3 1 SAG 6 0 1 0 1 2 3 13 4 SBP 0 0 0 1 0 0 0 1 0 TRF 0 0 0 1 0 0 0 1 0 Total 46 22 65 42 55 49 48 327 100
Notes: See Appendix for Cornell crop codes.

Ketterings, Q.M., H. Krol, W.S. Reid and J. Miller (2003). Oneida County Soil Sample Survey 1995-2001. CSS Extension Bulletin E03-17. 38 pages.
10
2.2 Samples for Commercial Production Crops for which recommendations are requested for commercial production: Current year crop
1995
1996
1997
1998
1999
2000
2001
Total
%
ABE/ABT 4 8 3 0 4 0 0 19 1 AGE/AGT 81 46 23 26 42 30 35 283 20 ALE/ALT 18 1 7 4 11 10 0 51 4 APP 3 0 1 0 0 0 0 4 0 BCE/BCT 1 0 0 0 0 0 0 1 0 BGE/BGT 4 4 1 3 0 0 0 12 1 BLB 1 0 0 0 0 0 4 5 0 BNS 1 0 0 0 0 0 0 1 0 BSP 0 0 2 0 0 7 0 9 1 BUK 1 0 0 0 0 0 0 1 0 CGE/CGT 5 2 4 10 3 4 3 31 2 CKP 0 0 0 0 0 1 0 1 0 CLE/CLT 1 0 0 0 1 1 0 3 0 COG/COS 82 94 72 60 89 60 78 535 38 GIE/GIT 1 3 0 2 1 0 0 7 0 GRE/GRT 2 8 12 33 13 2 3 73 5 IDL 0 1 3 0 0 0 0 4 0 MIL 0 0 0 0 0 0 1 1 0 MIX 4 1 1 1 5 1 0 13 1 OAS 34 6 4 4 4 4 2 58 4 OAT 3 2 3 2 3 0 1 14 1 OTH 2 0 2 6 0 1 0 11 1 PEP 0 0 0 0 0 1 0 1 0 PGE/PGT 29 0 0 1 0 2 3 35 2 PIE/PIT 9 0 4 2 22 0 2 39 3 PLE/PLT 3 1 1 26 0 1 0 32 2 PNE/PNT 3 0 2 8 1 0 0 14 1 POT 3 0 0 1 0 0 0 4 0 PSL 1 0 0 0 0 0 0 1 0 PUM 1 2 1 2 1 2 0 9 1 RSS 0 0 1 0 0 0 0 1 0 RYC 0 1 0 0 0 0 0 1 0 RYS 0 0 0 0 0 1 0 1 0 SOF 0 0 1 0 0 0 0 1 0 SOY 1 0 4 4 0 0 11 20 1

Ketterings, Q.M., H. Krol, W.S. Reid and J. Miller (2003). Oneida County Soil Sample Survey 1995-2001. CSS Extension Bulletin E03-17. 38 pages.
11
Current year crop
1995
1996
1997
1998
1999
2000
2001
Total
%
SQW 1 0 0 0 0 0 0 1 0 SSH 0 0 0 1 0 0 1 2 0 STS 0 0 0 1 0 0 0 1 0 SWC 1 2 0 0 7 6 0 16 1 TOM 0 0 0 0 1 0 0 1 0 TRE/TRT 5 1 1 0 5 3 2 17 1 TRP 0 0 2 2 2 0 0 6 0 WHS 0 0 0 0 0 1 0 1 0 WHT 3 1 0 0 1 0 1 6 0 Unknown 1 2 1 0 3 20 30 57 4 Total 309 186 156 199 219 158 177 1404 100
Notes: See Appendix for Cornell crop codes.

Ketterings, Q.M., H. Krol, W.S. Reid and J. Miller (2003). Oneida County Soil Sample Survey 1995-2001. CSS Extension Bulletin E03-17. 38 pages.
12
3. Soil Types
3.1 Samples for Home and Garden Soil types (soil management groups) for home and garden samples:
1995 1996
1997
1998
1999
2000
2001
Total
SMG 1 (clayey) 0 0 0 0 0 0 0 0 SMG 2 (silty) 10 1 40 10 19 25 23 128 SMG 3 (silt loam) 13 8 10 19 10 3 16 79 SMG 4 (sandy loam) 13 7 9 8 12 11 6 66 SMG 5 (sandy) 10 6 6 5 14 10 3 54 SMG 6 (mucky) 0 0 0 0 0 0 0 0 Total 46 22 65 42 55 49 48 327

Ketterings, Q.M., H. Krol, W.S. Reid and J. Miller (2003). Oneida County Soil Sample Survey 1995-2001. CSS Extension Bulletin E03-17. 38 pages.
13
3.2 Samples for Commercial Production
Soil series for samples submitted for commercial production: Name
SMG
1995
1996
1997
1998
1999
2000
2001
Total
Adams 5 0 0 1 0 0 3 0 4 Alton 5 42 19 30 25 44 34 15 209 Amenia 4 0 28 11 1 14 5 0 59 Appleton 2 3 9 6 3 22 3 0 46 Aurora 2 0 0 0 1 0 0 0 1 Berkshire 5 0 0 0 1 0 0 0 1 Bice 5 8 0 2 10 0 0 0 20 Camroden 3 11 1 2 0 1 0 0 15 Canadaigua 3 1 0 0 0 1 0 1 3 Castile 4 2 0 1 0 3 2 3 11 Cazenovia 2 25 12 7 11 4 2 16 77 Chadakoin 3 0 0 1 0 2 6 1 10 Chenango 3 1 3 3 0 11 1 3 22 Colosse 4 3 0 2 0 0 0 0 5 Conesus 2 8 8 5 5 5 3 7 41 Covert 4 0 8 1 0 5 1 6 21 Croghan 5 0 0 1 0 0 0 0 1 Empeyville 4 7 0 0 1 1 1 1 11 Farmington 3 2 0 1 0 0 0 0 3 Fredon 4 1 0 0 1 1 0 0 3 Galway 4 0 0 4 1 0 0 0 5 Greene 3 0 1 0 1 0 0 0 2 Hamlin 2 0 0 0 0 0 1 2 3 Herkimer 3 1 0 0 1 0 0 0 2 Honeoye 2 35 18 23 14 5 2 16 113 Howard 3 23 5 11 14 13 18 47 131 Jebavy 5 0 0 0 0 0 12 0 12 Kalurah 4 0 0 2 11 4 0 1 18 Kendaia 2 8 4 4 11 4 2 1 34 Knickerboc 5 1 0 1 6 6 2 0 16 Lansing 2 12 2 2 9 9 0 1 35 Lima 2 30 39 5 34 18 4 8 138 Lyons 2 0 1 0 0 1 0 0 2 Malone 4 0 6 0 8 2 0 0 16 Manlius 3 0 0 0 1 1 0 0 2 Marcy 3 0 0 1 0 2 0 0 3

Ketterings, Q.M., H. Krol, W.S. Reid and J. Miller (2003). Oneida County Soil Sample Survey 1995-2001. CSS Extension Bulletin E03-17. 38 pages.
14
Name
SMG
1995
1996
1997
1998
1999
2000
2001
Total
Mardin 3 1 0 0 0 0 0 0 1 Minoa 4 1 1 0 0 0 0 0 2 Mongaup 3 1 0 0 0 0 0 0 1 Muck 6 0 1 0 0 0 0 0 1 Naumburg 5 0 0 0 0 0 0 1 1 Nellis 4 14 2 7 8 16 40 1 88 Niagara 3 10 0 0 0 2 0 3 15 Otego 2 0 1 0 0 2 0 3 6 Otsego 3 0 0 0 0 0 2 0 2 Ovid 2 4 0 0 0 0 0 1 5 Phelps 3 1 6 8 0 1 0 10 26 Pinckney 3 23 4 6 6 9 0 0 48 Pittsfield 4 2 0 0 2 2 0 19 25 Pyrities 4 0 0 3 3 0 0 1 7 Raynham 3 0 1 1 0 0 0 0 2 Rhinebeck 2 0 0 1 0 0 0 1 2 Schoharie 1 2 1 0 0 0 2 1 6 Scio 3 0 1 1 0 2 0 0 4 Unadilla 3 0 0 0 0 2 0 0 2 Venango 3 1 0 0 0 0 0 0 1 Wakeville 3 0 0 0 1 0 0 0 1 Wareham 5 0 0 1 0 0 0 0 1 Wayland 2 0 0 0 0 0 1 1 2 Wenonah 4 0 3 1 0 3 0 0 7 Westbury 4 3 0 0 0 0 0 0 3 Windsor 5 4 1 0 6 1 0 5 17 Worth 4 18 0 0 1 0 0 0 19 Unknown - 0 0 0 2 0 11 1 14 total - 309 186 156 199 219 158 177 1404
Ketterings, Q.M., H. Krol, W.S. Reid and J. Miller (2003). Oneida County Soil Sample Survey 1995-2001. CSS Extension Bulletin E03-17. 38 pages.
15
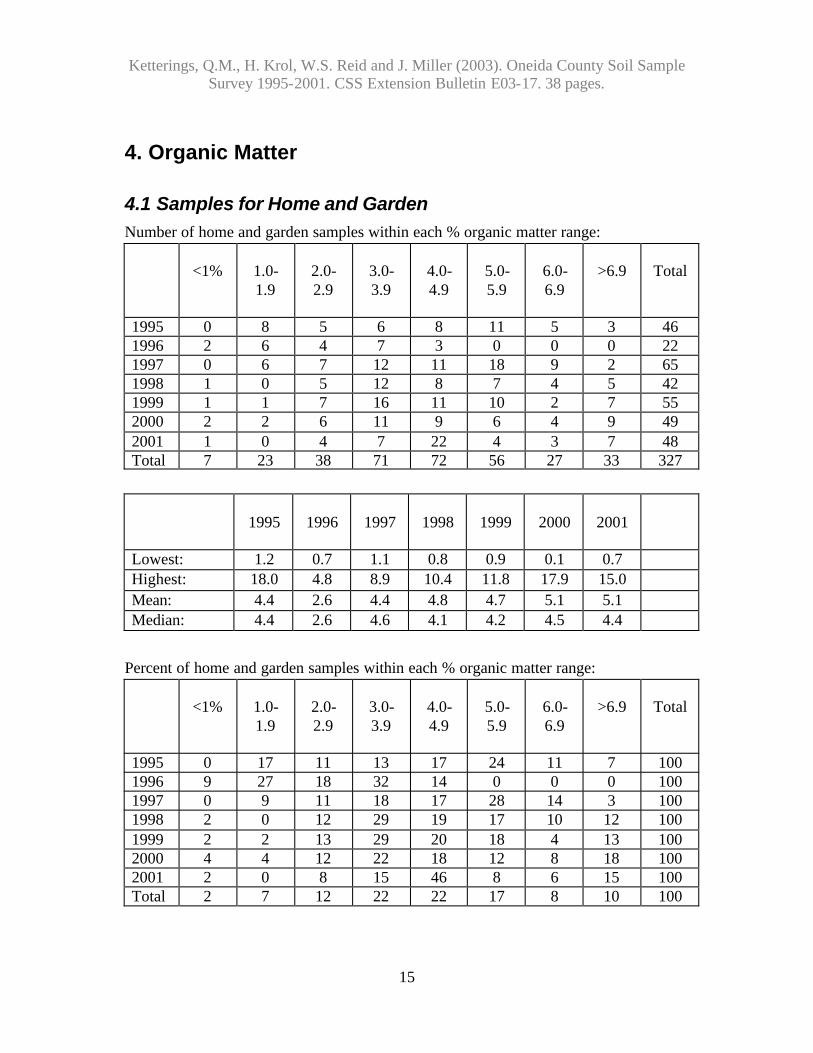
4. Organic Matter
4.1 Samples for Home and Garden Number of home and garden samples within each % organic matter range:
<1%
1.0-1.9
2.0-2.9
3.0-3.9
4.0-4.9
5.0-5.9
6.0-6.9
>6.9
Total
1995 0 8 5 6 8 11 5 3 46 1996 2 6 4 7 3 0 0 0 22 1997 0 6 7 12 11 18 9 2 65 1998 1 0 5 12 8 7 4 5 42 1999 1 1 7 16 11 10 2 7 55 2000 2 2 6 11 9 6 4 9 49 2001 1 0 4 7 22 4 3 7 48 Total 7 23 38 71 72 56 27 33 327
1995
1996
1997
1998
1999
2000
2001
Lowest: 1.2 0.7 1.1 0.8 0.9 0.1 0.7 Highest: 18.0 4.8 8.9 10.4 11.8 17.9 15.0 Mean: 4.4 2.6 4.4 4.8 4.7 5.1 5.1 Median: 4.4 2.6 4.6 4.1 4.2 4.5 4.4
Percent of home and garden samples within each % organic matter range:
<1%
1.0-1.9
2.0-2.9
3.0-3.9
4.0-4.9
5.0-5.9
6.0-6.9
>6.9
Total
1995 0 17 11 13 17 24 11 7 100 1996 9 27 18 32 14 0 0 0 100 1997 0 9 11 18 17 28 14 3 100 1998 2 0 12 29 19 17 10 12 100 1999 2 2 13 29 20 18 4 13 100 2000 4 4 12 22 18 12 8 18 100 2001 2 0 8 15 46 8 6 15 100 Total 2 7 12 22 22 17 8 10 100

Ketterings, Q.M., H. Krol, W.S. Reid and J. Miller (2003). Oneida County Soil Sample Survey 1995-2001. CSS Extension Bulletin E03-17. 38 pages.
16
4.2 Samples for Commercial Production Number of samples for commercial production within each % organic matter range:
<1%
1.0-1.9
2.0-2.9
3.0-3.9
4.0-4.9
5.0-5.9
6.0-6.9
>6.9
Total
1995 1 1 34 104 109 44 8 8 309 1996 3 8 30 66 55 22 2 0 186 1997 0 4 11 50 58 26 3 4 156 1998 0 0 20 62 64 37 11 5 199 1999 2 16 31 73 65 15 8 9 219 2000 1 3 34 53 45 12 3 7 158 2001 1 5 39 85 38 3 1 5 177 Total 8 37 199 493 434 159 36 38 1404
1995
1996
1997
1998
1999
2000
2001
Lowest: 0.4 0.8 1.7 2.1 0.6 0.7 0.3 Highest: 14.5 6.6 9.8 11.1 8.5 36.1 17.6 Mean: 4.2 3.7 4.2 4.3 3.9 4.2 3.7 Median: 4.0 3.8 4.1 4.2 3.8 3.7 3.5
Percent of samples for commercial production within each % organic matter range:
<1%
1.0-1.9
2.0-2.9
3.0-3.9
4.0-4.9
5.0-5.9
6.0-6.9
>6.9
Total
1995 0 0 11 34 35 14 3 3 100 1996 2 4 16 35 30 12 1 0 100 1997 0 3 7 32 37 17 2 3 100 1998 0 0 10 31 32 19 6 3 100 1999 1 7 14 33 30 7 4 4 100 2000 1 2 22 34 28 8 2 4 100 2001 1 3 22 48 21 2 1 3 100 Total 1 3 14 35 31 11 3 3 100

Ketterings, Q.M., H. Krol, W.S. Reid and J. Miller (2003). Oneida County Soil Sample Survey 1995-2001. CSS Extension Bulletin E03-17. 38 pages.
17
5. pH
5.1 Samples for Home and Garden Number of home and garden samples within each pH range:
1995
1996
1997
1998
1999
2000
2001
Lowest: 4.9 5.3 4.6 4.5 4.9 5.0 3.9 Highest: 8.5 7.8 8.2 7.7 7.9 8.6 8.6 Mean: - - - - - - - Median: 7.2 7.0 7.1 6.8 7.2 7.5 7.3
Percent of home and garden samples within each pH range:
<4.5
4.5-4.9
5.0-5.4
5.5-5.9
6.0-6.4
6.5-6.9
7.0-7.4
7.5-7.9
8.0-8.4
>8.4
Total
1995 0 2 4 9 7 20 24 30 2 2 100 1996 0 0 5 5 23 18 23 27 0 0 100 1997 0 3 0 2 8 15 63 6 3 0 100 1998 0 2 2 17 7 24 24 24 0 0 100 1999 0 5 5 15 9 9 27 29 0 0 100 2000 0 0 4 6 0 10 29 43 6 2 100 2001 2 0 0 2 6 10 46 29 2 1 100 Total 0 2 3 8 7 15 36 26 2 1 100
<4.5
4.5-4.9
5.0-5.4
5.5-5.9
6.0-6.4
6.5-6.9
7.0-7.4
7.5-7.9
8.0-8.4
>8.4
Total
1995 0 1 2 4 3 9 11 14 1 1 46 1996 0 0 1 1 5 4 5 6 0 0 22 1997 0 2 0 1 5 10 41 4 2 0 65 1998 0 1 1 7 3 10 10 10 0 0 42 1999 0 3 3 8 5 5 15 16 0 0 55 2000 0 0 2 3 0 5 14 21 3 1 49 2001 1 0 0 1 3 5 22 14 1 1 48 Total 1 7 9 25 24 48 118 85 7 3 327

Ketterings, Q.M., H. Krol, W.S. Reid and J. Miller (2003). Oneida County Soil Sample Survey 1995-2001. CSS Extension Bulletin E03-17. 38 pages.
18
5.2 Samples for Commercial Production Number of samples for commercial production within each pH range:
<4.5
4.5-4.9
5.0-5.4
5.5-5.9
6.0-6.4
6.5-6.9
7.0-7.4
7.5-7.9
8.0-8.4
>8.4
Total
1995 0 0 10 45 90 104 52 6 2 0 309 1996 0 0 10 24 76 53 19 40 0 0 186 1997* 0 0 11 28 58 38 10 1 0 0 146 1998 1 0 9 47 59 41 38 4 0 0 199 1999 0 2 15 46 69 61 22 4 0 0 219 2000 4 2 10 11 35 47 39 10 0 0 158 2001 4 0 3 25 40 59 31 15 0 0 177 Total 9 4 68 226 427 403 211 44 2 0 1394
*Ten were not analyzed for pH in 1997.
1995
1996
1997
1998
1999
2000
2001
Lowest: 5.2 5.0 5.0 4.4 4.8 3.7 3.4 Highest: 8.1 7.7 7.5 7.9 7.7 7.8 7.7 Mean: - - - - - - - Median: 6.5 6.3 6.2 6.3 6.3 6.6 6.6
Percent of samples for commercial production within each pH range:
<4.5
4.5-4.9
5.0-5.4
5.5-5.9
6.0-6.4
6.5-6.9
7.0-7.4
7.5-7.9
8.0-8.4
>8.4
Total
1995 0 0 3 15 29 34 17 2 1 0 100 1996 0 0 5 13 41 28 10 2 0 0 100 1997 0 0 8 19 40 26 7 1 0 0 100 1998 1 0 5 24 30 21 19 2 0 0 100 1999 0 1 7 21 32 28 10 2 0 0 100 2000 3 1 6 7 22 30 25 6 0 0 100 2001 2 0 2 14 23 33 18 8 0 0 100 Total 1 0 5 16 31 29 15 3 0 0 100

Ketterings, Q.M., H. Krol, W.S. Reid and J. Miller (2003). Oneida County Soil Sample Survey 1995-2001. CSS Extension Bulletin E03-17. 38 pages.
19
6. Phosphorus
6.1 Samples for Home and Garden Number of home and garden samples within each range Morgan extractable P range (lbs/acre Morgan P):
<1
1-3
4-8
9-39
40-60
61-80
81-100
101-150
151-200
>200
Total
VL L M H VH VH VH VH VH VH 1995 0 11 6 15 3 4 1 1 2 3 46 1996 0 9 7 4 0 1 0 1 0 0 22 1997 0 5 6 38 5 2 2 1 1 5 65 1998 0 6 9 18 3 1 3 1 0 1 42 1999 0 7 13 22 2 2 2 3 1 3 55 2000 0 2 7 21 4 1 4 2 1 7 49 2001 0 8 5 26 1 1 0 5 1 1 48 Total 0 48 53 144 18 12 12 14 6 20 327
VL = very low, L = low, M = medium, H = high, VH = very high.
1995 1996 1997 1998 1999 2000 2001 Lowest: 1 1 2 1 1 1 1 Highest: 601 135 392 336 300 650 235 Mean: 56 16 46 33 42 94 36 Median: 19 4 17 15 13 27 18
Percent of home and garden samples within each Morgan extractable phosphorus range:
<1
1-3
4-8
9-39
40-60
61-80
81-100
101-150
151-200
>200
Total
VL L M H VH VH VH VH VH VH 1995 0 24 13 33 7 9 2 2 4 7 100 1996 0 41 32 18 0 5 0 5 0 0 100 1997 0 8 9 58 8 3 3 2 2 8 100 1998 0 14 21 43 7 2 7 2 0 2 100 1999 0 13 24 40 4 4 4 5 2 5 100 2000 0 4 14 43 8 2 8 4 2 14 100 2001 0 17 10 54 2 2 0 10 2 2 100 Total 0 15 16 44 6 4 4 4 2 6 100
VL = very low, L = low, M = medium, H = high, VH = very high.

Ketterings, Q.M., H. Krol, W.S. Reid and J. Miller (2003). Oneida County Soil Sample Survey 1995-2001. CSS Extension Bulletin E03-17. 38 pages.
20
6.2 Samples for Commercial Production Number of samples submitted for commercial production within each Morgan extractable phosphorus (lbs P/acre) range:
<1
1-3
4-8
9-39
40-60
61-80
81-100
101-150
151-200
>200
Total
VL L M H VH VH VH VH VH VH 1995 0 130 86 87 3 0 0 0 1 2 309 1996 0 62 54 63 7 0 0 0 0 0 186 1997 0 43 48 55 5 2 0 1 2 0 156 1998 0 45 78 67 4 1 3 1 0 0 199 1999 0 48 75 92 3 0 0 0 0 1 219 2000 0 39 55 57 2 1 3 0 1 0 158 2001 0 44 48 72 9 3 1 0 0 0 177 Total 0 411 444 493 33 7 7 2 4 3 1404
VL = very low, L = low, M = medium, H = high, VH = very high.
1995
1996
1997
1998
1999
2000
2001
Lowest: 1 1 1 1 1 1 1 Highest: 411 53 187 143 708 187 85 Mean: 10 10 13 11 13 14 13 Median: 5 6 7 7 8 7 8
Percent of samples submitted for commercial production within each Morgan P range:
<1
1-3
4-8
9-39
40-60
61-80
81-100
101-150
151-200
>200
Total
VL L M H VH VH VH VH VH VH 1995 0 42 28 28 1 0 0 0 0 1 100 1996 0 33 29 34 4 0 0 0 0 0 100 1997 0 28 31 35 3 1 0 1 1 0 100 1998 0 23 39 34 2 1 2 1 0 0 100 1999 0 22 34 42 1 0 0 0 0 0 100 2000 0 25 35 36 1 1 2 0 0 0 100 2001 0 25 27 41 5 2 1 0 0 0 100 Total 0 29 32 35 2 0 0 0 0 0 100
VL = very low, L = low, M = medium, H = high, VH = very high.

Ketterings, Q.M., H. Krol, W.S. Reid and J. Miller (2003). Oneida County Soil Sample Survey 1995-2001. CSS Extension Bulletin E03-17. 38 pages.
21
7. Potassium
7.1 Samples for Home and Garden Number of home and garden samples within each K range (lbs K/acre Morgan extraction):
Soil Management Group 1 <35 35-64 65-94 95-149 >149 Total Very Low Low Medium High Very High 1995 0 0 0 0 0 0 1996 0 0 0 0 0 0 1997 0 0 0 0 0 0 1998 0 0 0 0 0 0 1999 0 0 0 0 0 0 2000 0 0 0 0 0 0 2001 0 0 0 0 0 0 Total (#) 0 0 0 0 0 0 Total (%) - - - - - -
Soil Management Group 2 <40 40-69 70-99 100-164 >164 Total Very Low Low Medium High Very High 1995 0 0 1 3 6 10 1996 0 0 0 1 0 1 1997 0 2 3 3 32 40 1998 0 0 0 4 6 10 1999 0 0 0 7 12 19 2000 0 2 2 7 14 25 2001 0 2 2 6 13 23 Total (#) 0 6 8 31 83 128 Total (%) 0 5 6 24 65 100
Soil Management Group 3 <45 45-79 80-119 120-199 >199 Total Very Low Low Medium High Very High 1995 0 1 2 4 6 13 1996 0 4 1 2 1 8 1997 0 2 1 1 6 10 1998 0 1 3 3 12 19 1999 0 0 1 2 7 10 2000 0 0 1 0 2 3 2001 1 5 6 2 2 16 Total (#) 1 13 15 14 36 79 Total (%) 1 16 19 18 46 100

Ketterings, Q.M., H. Krol, W.S. Reid and J. Miller (2003). Oneida County Soil Sample Survey 1995-2001. CSS Extension Bulletin E03-17. 38 pages.
22
Soil Management Group 4 <55 55-99 100-149 150-239 >239 Total Very
Low Low Medium High Very
High
1995 0 2 1 5 5 13 1996 1 1 3 1 1 7 1997 0 4 1 4 0 9 1998 0 0 1 2 5 8 1999 0 2 1 6 3 12 2000 0 1 1 0 9 11 2001 0 0 1 1 4 6 Total (#) 1 10 9 19 27 66 Total (%) 2 15 14 29 41 100
Soil Management Group 5
<60 60-114 115-164 165-269 >269 Total Very
Low Low Medium High Very
High
1995 2 1 0 4 3 10 1996 3 2 1 0 0 6 1997 0 3 1 1 1 6 1998 0 0 2 3 0 5 1999 1 5 5 2 1 14 2000 3 0 4 3 0 10 2001 0 2 0 1 0 3 Total (#) 9 13 13 14 5 54 Total (%) 17 24 24 26 9 100
Soil Management Group 6
<60 60-114 115-164 165-269 >269 Total Very
Low Low Medium High Very
High
1995 0 0 0 0 0 0 1996 0 0 0 0 0 0 1997 0 0 0 0 0 0 1998 0 0 0 0 0 0 1999 0 0 0 0 0 0 2000 0 0 0 0 0 0 2001 0 0 0 0 0 0 Total (#) 0 0 0 0 0 0 Total (%) - - - - - -

Ketterings, Q.M., H. Krol, W.S. Reid and J. Miller (2003). Oneida County Soil Sample Survey 1995-2001. CSS Extension Bulletin E03-17. 38 pages.
23
Number of home and garden samples within each potassium classification: Summary (#)
Very Low
Low
Medium
High
Very High
Total
1995 2 4 4 16 20 46 1996 4 7 5 4 2 22 1997 0 11 6 9 39 65 1998 0 1 6 12 23 42 1999 1 7 7 17 23 55 2000 3 3 8 10 25 49 2001 1 9 9 10 19 48 Total # 11 42 45 78 151 327
1995
1996
1997
1998
1999
2000
2001
Lowest: 40 38 59 68 29 3 31 Highest: 1898 369 528 955 975 5899 598 Mean: 311 117 208 260 241 387 190 Median: 188 91 219 219 173 194 155
Percent of samples submitted for home and garden within each potassium classification. Summary (%)
Very Low
Low
Medium
High
Very High
Total
1995 4 9 9 35 43 100 1996 18 32 23 18 9 100 1997 0 17 9 14 60 100 1998 0 2 14 29 55 100 1999 2 13 13 31 42 100 2000 6 6 16 20 51 100 2001 2 19 19 21 40 100 Grand Total 3 13 14 24 46 100

Ketterings, Q.M., H. Krol, W.S. Reid and J. Miller (2003). Oneida County Soil Sample Survey 1995-2001. CSS Extension Bulletin E03-17. 38 pages.
24
7.2 Samples for Commercial Production Number of samples submitted for commercial production within each potassium (lbs K/acre Morgan extraction) range:
Soil Management Group 1 <35 35-64 65-94 95-149 >149 Total Very Low Low Medium High Very High 1995 0 0 0 2 0 2 1996 1 0 0 0 0 1 1997 0 0 0 0 0 0 1998 0 0 0 0 0 0 1999 0 0 0 0 0 0 2000 0 0 0 1 1 2 2001 0 1 0 0 0 1 Total (#) 1 1 0 3 1 6 Total (%) 17 17 0 50 17 100
Soil Management Group 2 <40 40-69 70-99 100-164 >164 Total Very Low Low Medium High Very High 1995 0 6 29 49 41 125 1996 1 12 19 35 27 94 1997 0 2 7 14 30 53 1998 0 1 14 26 47 88 1999 1 1 7 30 31 70 2000 0 1 6 4 7 18 2001 1 4 8 20 24 57 Total (#) 3 27 90 178 207 505 Total (%) 1 5 18 35 41 100
Soil Management Group 3 <45 45-79 80-119 120-199 >199 Total Very Low Low Medium High Very High 1995 10 20 14 22 10 76 1996 1 3 6 8 4 22 1997 0 2 11 12 10 35 1998 0 1 4 6 13 24 1999 1 3 10 14 19 47 2000 0 0 1 12 14 27 2001 0 6 17 14 28 65 Total (#) 12 35 63 88 98 296 Total (%) 4 12 21 30 33 100
Ketterings, Q.M., H. Krol, W.S. Reid and J. Miller (2003). Oneida County Soil Sample Survey 1995-2001. CSS Extension Bulletin E03-17. 38 pages.
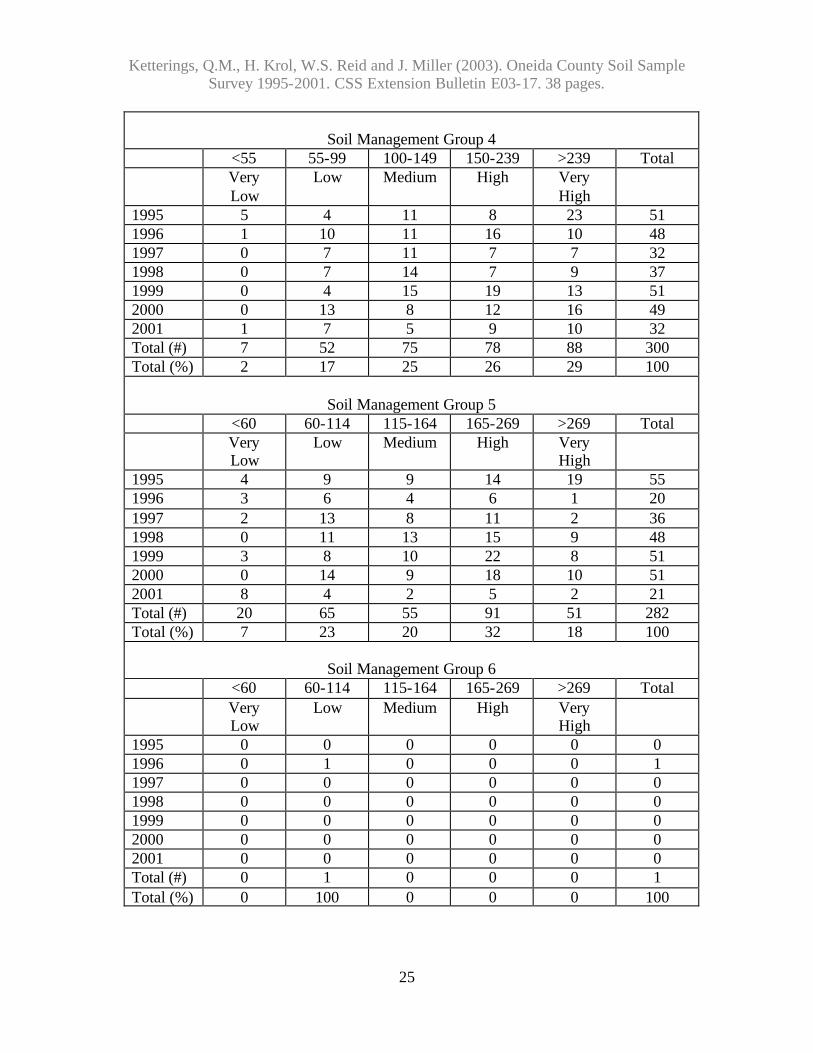
25
Soil Management Group 4
<55 55-99 100-149 150-239 >239 Total Very
Low Low Medium High Very
High
1995 5 4 11 8 23 51 1996 1 10 11 16 10 48 1997 0 7 11 7 7 32 1998 0 7 14 7 9 37 1999 0 4 15 19 13 51 2000 0 13 8 12 16 49 2001 1 7 5 9 10 32 Total (#) 7 52 75 78 88 300 Total (%) 2 17 25 26 29 100
Soil Management Group 5
<60 60-114 115-164 165-269 >269 Total Very
Low Low Medium High Very
High
1995 4 9 9 14 19 55 1996 3 6 4 6 1 20 1997 2 13 8 11 2 36 1998 0 11 13 15 9 48 1999 3 8 10 22 8 51 2000 0 14 9 18 10 51 2001 8 4 2 5 2 21 Total (#) 20 65 55 91 51 282 Total (%) 7 23 20 32 18 100
Soil Management Group 6
<60 60-114 115-164 165-269 >269 Total Very
Low Low Medium High Very
High
1995 0 0 0 0 0 0 1996 0 1 0 0 0 1 1997 0 0 0 0 0 0 1998 0 0 0 0 0 0 1999 0 0 0 0 0 0 2000 0 0 0 0 0 0 2001 0 0 0 0 0 0 Total (#) 0 1 0 0 0 1 Total (%) 0 100 0 0 0 100

Ketterings, Q.M., H. Krol, W.S. Reid and J. Miller (2003). Oneida County Soil Sample Survey 1995-2001. CSS Extension Bulletin E03-17. 38 pages.
26
Number of samples submitted for commercial production within each potassium classification. Summary (#)
Very Low
Low
Medium
High
Very High
Un-
known
Total
1995 19 39 63 95 93 0 309 1996 7 32 40 65 42 0 186 1997 2 24 37 44 49 0 156 1998 0 20 45 54 78 2 199 1999 5 16 42 85 71 0 219 2000 0 28 24 47 48 11 158 2001 10 22 32 48 64 1 177 Grand Total 43 181 283 438 445 14 1404
1995
1996
1997
1998
1999
2000
2001
Lowest: 23 34 40 62 28 60 12 Highest: 2023 679 1243 1333 1416 623 756 Mean: 191 156 187 212 200 194 188 Median: 139 133 142 169 164 165 155
Percent of samples submitted for commercial production within each potassium classification.
% summary
Very Low
Low
Medium
High
Very High
Un-
known
Total
1995 6 13 20 31 30 0 100 1996 4 17 22 35 23 0 100 1997 1 15 24 28 31 0 100 1998 0 10 23 27 39 1 100 1999 2 7 19 39 32 0 100 2000 0 18 15 30 30 7 100 2001 6 12 18 27 36 1 100 Grand Total 3 13 20 31 32 1 100

Ketterings, Q.M., H. Krol, W.S. Reid and J. Miller (2003). Oneida County Soil Sample Survey 1995-2001. CSS Extension Bulletin E03-17. 38 pages.
27
8. Magnesium
8.1 Samples for Home and Garden
Number of home and garden samples within each Mg range (lbs Morgan Mg/acre):
<20
20-65
66-100
101-199
>199
Total
Very Low
Low Medium High Very High
1995 1 1 2 7 35 46 1996 0 3 0 5 14 22 1997 0 1 0 8 56 65 1998 0 1 4 8 29 42 1999 1 2 2 10 40 55 2000 0 2 0 7 40 49 2001 0 0 1 11 36 48 Total 2 10 9 56 250 327
1995
1996
1997
1998
1999
2000
2001
Lowest: 18 42 58 54 10 24 87 Highest: 2114 663 1927 736 1188 1819 999 Mean: 435 294 423 349 357 478 433 Median: 408 277 422 338 267 437 435
Percent of home and garden samples within each Mg range (lbs Morgan Mg/acre):
<20
20-65
66-100
101-199
>199
Total
Very Low
Low Medium High Very High
1995 2 2 4 15 76 100 1996 0 14 0 23 64 100 1997 0 2 0 12 86 100 1998 0 2 10 19 69 100 1999 2 4 4 18 73 100 2000 0 4 0 14 82 100 2001 0 0 2 23 75 100 Total 1 3 3 17 76 100

Ketterings, Q.M., H. Krol, W.S. Reid and J. Miller (2003). Oneida County Soil Sample Survey 1995-2001. CSS Extension Bulletin E03-17. 38 pages.
28
8.2 Samples for Commercial Production Number of samples submitted for commercial production within each Mg range (lbs Mg/acre Morgan extraction):
<20
20-65
66-100
101-199
>199
Total
Very Low
Low Medium High Very High
1995 2 23 21 96 167 309 1996 0 10 17 48 111 186 1997 0 7 15 30 103 156 1998 0 6 11 47 135 199 1999 1 15 22 49 132 219 2000 0 3 11 45 99 158 2001 1 7 12 37 120 177 Total 5 71 109 352 867 1404
1995
1996
1997
1998
1999
2000
2001
Lowest: 9 29 14 38 9 28 10 Highest: 1647 1217 754 1130 1850 993 913 Mean: 285 285 285 310 277 273 300 Median: 212 244 274 282 237 246 273
Percent of samples submitted for commercial production within each magnesium range (lbs Mg/acre Morgan extraction):
<20
20-65
66-100
101-199
>199
Total
Very Low
Low Medium High Very High
1995 1 7 7 31 54 100 1996 0 5 9 26 60 100 1997 1 4 10 19 66 100 1998 0 3 6 24 68 100 1999 0 7 10 22 60 100 2000 0 2 7 28 63 100 2001 1 4 7 21 68 100 Total 0 5 8 25 62 100

Ketterings, Q.M., H. Krol, W.S. Reid and J. Miller (2003). Oneida County Soil Sample Survey 1995-2001. CSS Extension Bulletin E03-17. 38 pages.
29
9. Iron
9.1 Samples for Home and Garden Iron (lbs Fe/acre Morgan extraction) in samples for home and garden: Total number of samples: Percentages:
0-49
>49
Total
0-49
>49
Total
Normal Excessive Normal Excessive 1995 43 3 46 93 7 100 1996 18 4 22 82 18 100 1997 63 2 65 97 3 100 1998 38 4 42 90 10 100 1999 53 2 55 96 4 100 2000 49 0 49 100 0 100 2001 47 1 48 98 2 100 Total 311 16 327 95 5 100
1995
1996
1997
1998
1999
2000
2001
Lowest: 1 2 2 1 1 1 1 Highest: 94 137 240 130 209 42 507 Mean: 13 26 13 15 14 8 15 Median: 6 11 6 6 7 4 3

Ketterings, Q.M., H. Krol, W.S. Reid and J. Miller (2003). Oneida County Soil Sample Survey 1995-2001. CSS Extension Bulletin E03-17. 38 pages.
30
9. Samples for Commercial Production Iron (lbs Fe/acre Morgan extraction) in samples submitted for commercial production: Total number of samples: Percentages:
0-49
>49
Total
0-49
>49
Total
Normal Excessive Normal Excessive 1995 302 7 309 98 2 100 1996 180 6 186 97 3 100 1997 155 1 156 99 1 100 1998 189 10 199 95 5 100 1999 210 9 219 96 4 100 2000 150 8 158 95 5 100 2001 168 9 177 95 5 100 Total 1354 50 1404 96 4 100
1995
1996
1997
1998
1999
2000
2001
Lowest: 1 1 1 1 1 1 1 Highest: 89 104 54 178 120 219 337 Mean: 10 10 9 13 12 14 14 Median: 7 6 6 7 7 5 4

Ketterings, Q.M., H. Krol, W.S. Reid and J. Miller (2003). Oneida County Soil Sample Survey 1995-2001. CSS Extension Bulletin E03-17. 38 pages.
31
10. Manganese
10.1 Samples for Home and Garden Manganese (lbs Mn/acre Morgan extraction) in samples for home and garden: Total number of samples: Percentages:
0-99
>99
Total
0-99
>99
Total
Normal Excessive Normal Excessive 1995 42 4 46 91 9 100 1996 19 3 22 86 14 100 1997 58 7 65 89 11 100 1998 39 3 42 93 7 100 1999 52 3 55 95 5 100 2000 46 3 49 94 6 100 2001 47 1 48 98 2 100 Total 303 24 327 93 7 100
1995
1996
1997
1998
1999
2000
2001
Lowest: 3 5 10 2 4 3 7 Highest: 155 152 193 131 779 214 113 Mean: 45 44 57 44 59 42 41 Median: 33 30 48 40 41 34 35

Ketterings, Q.M., H. Krol, W.S. Reid and J. Miller (2003). Oneida County Soil Sample Survey 1995-2001. CSS Extension Bulletin E03-17. 38 pages.
32
10.2 Samples for Commercial Production Manganese (lbs Mn/acre Morgan extraction) in samples for commercial production: Total number of samples: Percentages:
0-99
>99
Total
0-99
>99
Total
Normal Excessive Normal Excessive 1995 306 3 309 99 1 100 1996 182 4 186 98 2 100 1997 155 1 156 99 1 100 1998 195 4 199 98 2 100 1999 216 3 219 99 1 100 2000 147 11 158 93 7 100 2001 176 1 177 99 1 100 Total 1377 27 1404 98 2 100
1995
1996
1997
1998
1999
2000
2001
Lowest: 3 6 5 6 4 8 5 Highest: 182 134 107 113 147 505 119 Mean: 31 36 39 36 38 46 34 Median: 28 34 35 33 34 34 33

Ketterings, Q.M., H. Krol, W.S. Reid and J. Miller (2003). Oneida County Soil Sample Survey 1995-2001. CSS Extension Bulletin E03-17. 38 pages.
33
11. Zinc
11.1 Samples for Home and Garden Zinc (lbs Zn/acre Morgan extraction) in samples for home and garden: Total number of samples: Percentages:
1995
1996
1997
1998
1999
2000
2001
Lowest: 0.6 0.8 1.3 0.5 0.6 0.6 0.5 Highest: 56.0 11.4 149.5 61.7 90.7 74.2 32.0 Mean: 6.5 2.7 7.1 7.1 8.1 8.2 4.5 Median: 4.2 1.9 3.7 2.9 3.0 3.1 3.0
<0.5
0.5-1.0
>1
Total
<0.5
0.5-1.0
>1
Total
Low Medium High Low Medium High 1995 0 8 38 46 0 17 83 100 1996 0 6 16 22 0 27 73 100 1997 0 0 65 65 0 0 100 100 1998 0 4 38 42 0 10 90 100 1999 0 6 49 55 0 11 89 100 2000 0 3 46 49 0 6 94 100 2001 0 4 44 48 0 8 92 100 Total 0 31 296 327 0 9 91 100

Ketterings, Q.M., H. Krol, W.S. Reid and J. Miller (2003). Oneida County Soil Sample Survey 1995-2001. CSS Extension Bulletin E03-17. 38 pages.
34
11.2 Samples for Commercial Production Zinc (lbs Zn/acre Morgan extraction) in samples for commercial production: Total number of samples: Percentages:
<0.5
0.5-1.0
>1
Total
<0.5
0.5-1.0
>1
Total
Low Medium High Low Medium High 1995 22 111 176 309 7 36 57 100 1996 7 84 95 186 4 45 51 100 1997 4 52 100 156 3 33 64 100 1998 6 73 120 199 3 37 60 100 1999 14 63 142 219 6 29 65 100 2000 5 48 105 158 3 30 66 100 2001 9 50 118 177 5 28 67 100 Total 67 481 856 1404 5 34 61 100
1995
1996
1997
1998
1999
2000
2001
Lowest: 0.1 0.2 0.3 0.3 0.1 0.1 0.1 Highest: 69.7 7.3 29.5 27.9 21.0 14.5 75.8 Mean: 2.5 1.4 1.9 1.9 1.6 2.2 2.2 Median: 1.2 1.1 1.2 1.2 1.3 1.4 1.3

Ketterings, Q.M., H. Krol, W.S. Reid and J. Miller (2003). Oneida County Soil Sample Survey 1995-2001. CSS Extension Bulletin E03-17. 38 pages.
35
Appendix: Cornell Crop Codes
Crop codes are used in the Cornell Nutrient Analyses Laboratory.
Crop Code
Crop Description
Alfalfa
ABE Alfalfa trefoil grass, Establishment ABT Alfalfa trefoil grass, Established AGE Alfalfa grass, Establishment AGT Alfalfa grass, Established ALE Alfalfa, Establishment ALT Alfalfa, Established
Birdsfoot BCE Birdsfoot trefoil clover, Establishment BCT Birdsfoot trefoil clover, Established BGE Birdsfoot trefoil grass, Establishment BGT Birdsfoot trefoil grass, Established BSE Birdsfoot trefoil seed, Establishment BST Birdsfoot trefoil seed, Established BTE Birdsfoot trefoil, Establishment BTT Birdsfoot trefoil, Established
Barley
BSP Spring barley BSS Spring barley with legumes BUK Buckwheat BWI Winter barley BWS Winter barley with legumes
Clover
CGE Clover grass, Establishment CGT Clover grass, Established CLE Clover, Establishment CLT Clover, Established CSE Clover seed production, Establishment CST Clover seed production, Established

Ketterings, Q.M., H. Krol, W.S. Reid and J. Miller (2003). Oneida County Soil Sample Survey 1995-2001. CSS Extension Bulletin E03-17. 38 pages.
36
Crop Code
Crop Description
Corn COG Corn grain COS Corn silage
Grasses, pastures, covercrops
GIE Grasses intensively managed, Establishment GIT Grasses intensively managed, Established GRE Grasses, Establishment GRT Grasses, Established PGE Pasture, Establishment PGT Pasture improved grasses, Established PIE Pasture intensively grazed, Establishment PIT Pasture intensively grazed, Established PLE Pasture with legumes, Establishment PLT Pasture with legumes, Established PNT Pasture native grasses PNE Pasture native grasses, Established RYC Rye cover crop RYS Rye seed production TRP Triticale peas
Small grains MIL Millet OAS Oats with legume OAT Oats SOF Sorghum forage SOG Sorghum grain SOY Soybeans SSH Sorghum sudan hybrid SUD Sudangrass WHS Wheat with legume WHT Wheat
Others ALG APP ATF
Azalea Apples Athletic Field

Ketterings, Q.M., H. Krol, W.S. Reid and J. Miller (2003). Oneida County Soil Sample Survey 1995-2001. CSS Extension Bulletin E03-17. 38 pages.
37
Crop Code
Crop Description
ASP BDR/BND BLU/BLB BNS BSP CEM CKP END FAR FLA GRA GEN HRB IDL LAW LET MIX/MVG MML ONS OTH PAR PEP PER POP POT/PTO PRK PSL PUM ROD ROS ROU RSF RSP RSS SAG SPB SQS SQW STE
Asparagus Beans-dry Blueberries Beans, Snap Barley, Spring Cemetery Cucumber, Transplanted Endives Fairway Flowering Annuals Grapes Green Herbs Idle land Lawn Lettuce Mixed vegetables Muskmelon Onion-seeded Other Pears Peppers Perennials Popcorn Potatoes Park Parsley Pumpkins Roadside Roses Rough Raspberries, Fall Raspberries (homeowners) Raspberries, Summer Ornamentals adapted to pH 6.0 to 7.5 Spring flowering bulbs Squash, Summer Squash, Winter Strawberries, Ever

Ketterings, Q.M., H. Krol, W.S. Reid and J. Miller (2003). Oneida County Soil Sample Survey 1995-2001. CSS Extension Bulletin E03-17. 38 pages.
38
Crop Code
Crop Description
STR STS SUN SWC TOM TRE TRF TRT
Strawberries (homeowners) Strawberries, Spring Sunflowers Sweet corn Tomatoes Christmas trees, Established Tree fruits Christmas trees, Topdressing