
Oneclick Presentation DGEI Expert Workshop, JRC-IPTS Seville

OneClick Console User Guide (5130)
r9.1
SPECTRUM®

This documentation and any related computer software help programs (hereinafter referred to as the
―Documentation‖) is for the end user‘s informational purposes only and is subject to change or withdrawal by CA at
any time.
This Documentation may not be copied, transferred, reproduced, disclosed, modified or duplicated, in whole or in
part, without the prior written consent of CA. This Documentation is confidential and proprietary information of CA
and protected by the copyright laws of the United States and international treaties.
Notwithstanding the foregoing, licensed users may print a reasonable number of copies of the Documentation for
their own internal use, and may make one copy of the related software as reasonably required for back-up and
disaster recovery purposes, provided that all CA copyright notices and legends are affixed to each reproduced copy.
Only authorized employees, consultants, or agents of the user who are bound by the provisions of the license for
the Product are permitted to have access to such copies.
The right to print copies of the Documentation and to make a copy of the related software is limited to the period
during which the applicable license for the Product remains in full force and effect. Should the license terminate for
any reason, it shall be the user‘s responsibility to certify in writing to CA that all copies and partial copies of the
Documentation have been returned to CA or destroyed.
EXCEPT AS OTHERWISE STATED IN THE APPLICABLE LICENSE AGREEMENT, TO THE EXTENT PERMITTED BY
APPLICABLE LAW, CA PROVIDES THIS DOCUMENTATION ―AS IS‖ WITHOUT WARRANTY OF ANY KIND, INCLUDING
WITHOUT LIMITATION, ANY IMPLIED WARRANTIES OF MERCHANTABILITY, FITNESS FOR A PARTICULAR PURPOSE
OR NONINFRINGEMENT. IN NO EVENT WILL CA BE LIABLE TO THE END USER OR ANY THIRD PARTY FOR ANY LOSS
OR DAMAGE, DIRECT OR INDIRECT, FROM THE USE OF THIS DOCUMENTATION, INCLUDING WITHOUT
LIMITATION, LOST PROFITS, BUSINESS INTERRUPTION, GOODWILL, OR LOST DATA, EVEN IF CA IS EXPRESSLY
ADVISED OF SUCH LOSS OR DAMAGE.
The use of any product referenced in the Documentation is governed by the end user‘s applicable license
agreement.
The manufacturer of this Documentation is CA.
Provided with ―Restricted Rights.‖ Use, duplication or disclosure by the United States Government is subject to the
restrictions set forth in FAR Sections 12.212, 52.227-14, and 52.227-19(c)(1) - (2) and DFARS Section
252.227-7014(b)(3), as applicable, or their successors.
All trademarks, trade names, service marks, and logos referenced herein belong to their respective companies.
Copyright © 2009 CA. All rights reserved.

CA Product References
This guide references SPECTRUM®
Contact CA
Contact Technical Support
For your convenience, CA provides one site where you can access the
information you need for your Home Office, Small Business, and Enterprise CA
products. At http://ca.com/support, you can access the following:
■ Online and telephone contact information for technical assistance and
customer services
■ Information about user communities and forums
■ Product and documentation downloads
■ CA Support policies and guidelines
■ Other helpful resources appropriate for your product
Provide Feedback
If you have comments or questions about CA product documentation, you can
send a message to [email protected].
If you would like to provide feedback about CA product documentation,
complete our short customer survey, which is also available on the CA support
website, found at http://ca.com/support.


Contents 5
Contents
Chapter 1: Getting Started with the OneClick Console 9
OneClick and SPECTRUM Overview .............................................................. 9
Before You Begin ............................................................................. 10
OneClick Client Minimum Requirements for Solaris .............................................. 11
OneClick Client Minimum Requirements for Linux ............................................... 11
OneClick Client Minimum Requirements for Windows ............................................ 11
Java Applications and OneClick ................................................................ 12
Install JRE, Java Web Start, and the Java Plug-in on Solaris ..................................... 12
Install JRE and Java Web Start on Linux ........................................................ 13
Install JRE and Java Web Start on Windows .................................................... 14
Verify .jnlp File Mapping ....................................................................... 16
Start OneClick Using the Command Line on Solaris .............................................. 17
Start OneClick Using a Browser ................................................................ 17
Troubleshoot Solaris Problems ................................................................. 18
oneclick.jnlp File Download Dialog Opens ................................................... 18
The Opening oneclick.jnlp Dialog Opens .................................................... 19
Troubleshoot Linux Problems .................................................................. 19
Firefox Download Error Dialog ............................................................. 19
Troubleshoot Windows Problems ............................................................... 20
Verify JRE Installation ..................................................................... 20
Chapter 2: OneClick Console User Interface 21
OneClick Console User Interface Overview ...................................................... 22
Navigation Panel .............................................................................. 23
Explorer Tab .............................................................................. 23
Locater Tab ............................................................................... 24
Contents Panel ............................................................................... 24
Component Detail Panel ....................................................................... 25
OneClick Tabs ................................................................................ 25
Alarms Tab ............................................................................... 27
Topology Tab ............................................................................. 28
List Tab .................................................................................. 29
Results Tab ............................................................................... 29
Events Tab ............................................................................... 30
Information Tab........................................................................... 30
OneClick Toolbars ............................................................................. 30
Hide Toolbars ............................................................................. 30

6 OneClick Console User Guide (5130)
Main Toolbar .............................................................................. 31
Alarms Toolbar ........................................................................... 32
Topology Toolbar ......................................................................... 33
Neighbors Toolbar ......................................................................... 34
Tooltips .................................................................................. 34
OneClick Status Bar ........................................................................... 34
Chapter 3: Using and Customizing OneClick 35
Set OneClick Preferences ...................................................................... 35
Alarms Tab Preferences ................................................................... 36
Events Tab Preferences .................................................................... 38
Create Email Templates ................................................................... 40
Modify Email Templates ................................................................... 41
Explorer Tab Preferences .................................................................. 41
General Preferences ....................................................................... 42
Topology Tab Preferences ................................................................. 43
Customize Columns ........................................................................... 44
Select Landscapes ............................................................................ 44
Filter OneClick Lists ........................................................................... 45
OneClick Panels ............................................................................... 45
Dock and Undock Panels ................................................................... 45
Clone Panels .............................................................................. 46
Global Collections ............................................................................. 46
Favorites Folder .............................................................................. 46
Change Your OneClick Password ............................................................... 47
Copy Text from the Component Detail Panel .................................................... 47
Insert URLs in OneClick ....................................................................... 48
Set SPECTRUM_BROWSER Variable ............................................................ 48
Chapter 4: Monitoring Your Network with OneClick 49
Network Searches ............................................................................ 49
Search Your Network .......................................................................... 50
Alarm Filter Dialog ............................................................................ 50
Manage Alarms ............................................................................... 53
Filter Alarms .............................................................................. 53
Filter With Advanced Alarm Filter ........................................................... 54
Alarm Troubleshooters .................................................................... 56
Manage Events ............................................................................... 58
Email Events .............................................................................. 59
Event Filtering ............................................................................ 59
Event Filter Dialog ........................................................................ 59

Contents 7
Interface Information ......................................................................... 63
Subinterfaces ............................................................................. 66
Interface Component Detail Window ........................................................ 66
Spotlighting Model Relationships ............................................................... 69
Spotlight Model Relationships in the Topology Tab .............................................. 69
Highlight Modeled Devices ..................................................................... 70
Connection Status Indicator ................................................................... 71
Connection Status Dialog ...................................................................... 71
Check OneClick Messages ..................................................................... 72
Check Connection Status ...................................................................... 72
OneClick Schedules ........................................................................... 72
Access Schedules ......................................................................... 73
Create Schedules ......................................................................... 74
OneClick Schedules in a DSS Environment .................................................. 75
Recurring Schedules ...................................................................... 76
Chapter 5: Maintenance and Hibernation Mode for Devices 77
Maintenance and Hibernation Mode ............................................................ 77
Order of Precedence ....................................................................... 77
Place Devices in Maintenance Mode ........................................................ 77
Schedule Maintenance Mode ............................................................... 78
Place Devices in Hibernation Mode ......................................................... 79
Hibernate After Maintenance ............................................................... 80
Place Interface Models in Maintenance or Hibernation Mode .................................. 80
Recognize Model Devices in Maintenance or Hibernation Mode ................................... 81
Show Brown Alarms for Interfaces and Applications ......................................... 81
Suppress Events and Alarms for Devices in Maintenance or Hibernation .......................... 82
Secondary Alarms and Devices in Maintenance Mode ........................................ 82
Chapter 6: Exporting Data and Images from OneClick 83
Export Table Data ............................................................................ 83
Fix Exported CSV Files Containing Board.Port Data .......................................... 84
Copy and Paste Table Data .................................................................... 85
Export Topology Views as Image Files .......................................................... 85
Appendix A: Keyboard Shortcuts 87
Index 89


Chapter 1: Getting Started with the OneClick Console 9
Chapter 1: Getting Started with the
OneClick Console
This section contains the following topics:
OneClick and SPECTRUM Overview (see page 9)
Before You Begin (see page 10)
OneClick Client Minimum Requirements for Solaris (see page 11)
OneClick Client Minimum Requirements for Linux (see page 11)
OneClick Client Minimum Requirements for Windows (see page 11)
Java Applications and OneClick (see page 12)
Install JRE, Java Web Start, and the Java Plug-in on Solaris (see page 12)
Install JRE and Java Web Start on Linux (see page 13)
Install JRE and Java Web Start on Windows (see page 14)
Verify .jnlp File Mapping (see page 16)
Start OneClick Using the Command Line on Solaris (see page 17)
Start OneClick Using a Browser (see page 17)
Troubleshoot Solaris Problems (see page 18)
Troubleshoot Linux Problems (see page 19)
Troubleshoot Windows Problems (see page 20)
OneClick and SPECTRUM Overview
OneClick delivers SPECTRUM information to network operators and
troubleshooters using an intuitive graphical user interface. It provides
customized access to information and tools for users who monitor or
troubleshoot specific portions of a network managed by SPECTRUM.

Before You Begin
10 OneClick Console User Guide (5130)
The OneClick architecture uses the Java Network Launch Protocol (JNLP) and
the Java Web Start application to allow remote systems and users to access
the OneClick server. JNLP is a standard for application delivery that does not
require traditional installers or the launching of executable code. After
installation, the OneClick Console communicates with the web server on the
OneClick server using port 80 by default for Windows, or port 8080 for UNIX
and Solaris. The web server communicates as a single client of the
SpectroSERVER using the CORBA interface, as illustrated by the following
diagram:
The following SPECTRUM and OneClick guides provide information related to
installing, customizing, and maintaining OneClick. All of these guides are
intended for SPECTRUM administrators:
■ Installation Guide (5136) provides detailed instructions for installing the
OneClick server.
■ OneClick Administration Guide (5166) provides information about how to
configure the OneClick environment, applications, and users.
■ OneClick Customization Guide (5160) provides information about
customizing the OneClick interface by modifying XML files and other
techniques.
■ Modeling Your IT Infrastructure Administrator Guide (5167) describes how
to configure OneClick to discover and model the elements on the network.
Before You Begin
To run the SPECTRUM OneClick Console and OneClick add-on applications, you
must install the Java Runtime Environment (JRE). The JRE includes the Java
Web Start client, which is required to run Java Network Launching Protocol
(JNLP) applications like SPECTRUM OneClick. After you install the JRE, you can
start the OneClick Console.
Verify that your workstation meets the minimum requirements listed in the
following tables before installing or running the OneClick Console.

OneClick Client Minimum Requirements for Solaris
Chapter 1: Getting Started with the OneClick Console 11
OneClick Client Minimum Requirements for Solaris
Component Requirement
Operating System Solaris 9 or 10
Processor 360 MHz Ultra II
RAM 512 MB
Java Components Java 2 Runtime Environment (JRE) version
1.6.0
Web Browser Firefox v1.5
OneClick Client Minimum Requirements for Linux
Component Requirement
Operating System and
Desktop Environment
Red Hat Enterprise Linux 3 KDE (K Desktop
Environment)
Processor 1 GHz Pentium III
RAM 512 MB
Service Pack Update 6 or greater
Java Components Java 2 Runtime Environment (JRE) version
1.6.0
Web Browser Firefox v1.5
OneClick Client Minimum Requirements for Windows
Component Requirement
Operating System Microsoft Windows Vista, Windows XP, Windows
2003, and Windows 2000 Intel-based systems
Processor 1 GHz Pentium III
RAM 512 MB
Service Pack Windows 2000—Service Pack 2 or later
Java Components Java 2 Runtime Environment (JRE) version 1.6.0
Web Browser Internet Explorer v5.x
Java Applications and OneClick
12 OneClick Console User Guide (5130)
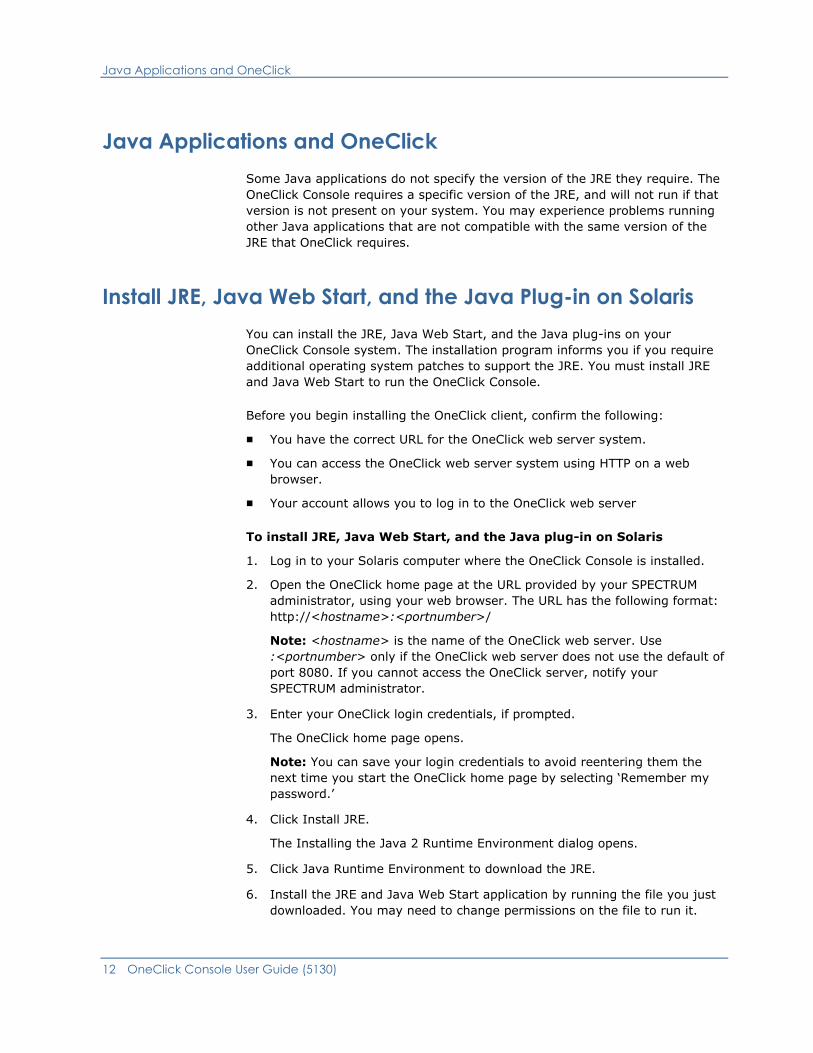
Java Applications and OneClick
Some Java applications do not specify the version of the JRE they require. The
OneClick Console requires a specific version of the JRE, and will not run if that
version is not present on your system. You may experience problems running
other Java applications that are not compatible with the same version of the
JRE that OneClick requires.
Install JRE, Java Web Start, and the Java Plug-in on Solaris
You can install the JRE, Java Web Start, and the Java plug-ins on your
OneClick Console system. The installation program informs you if you require
additional operating system patches to support the JRE. You must install JRE
and Java Web Start to run the OneClick Console.
Before you begin installing the OneClick client, confirm the following:
■ You have the correct URL for the OneClick web server system.
■ You can access the OneClick web server system using HTTP on a web
browser.
■ Your account allows you to log in to the OneClick web server
To install JRE, Java Web Start, and the Java plug-in on Solaris
1. Log in to your Solaris computer where the OneClick Console is installed.
2. Open the OneClick home page at the URL provided by your SPECTRUM
administrator, using your web browser. The URL has the following format:
http://<hostname>:<portnumber>/
Note: <hostname> is the name of the OneClick web server. Use
:<portnumber> only if the OneClick web server does not use the default of
port 8080. If you cannot access the OneClick server, notify your
SPECTRUM administrator.
3. Enter your OneClick login credentials, if prompted.
The OneClick home page opens.
Note: You can save your login credentials to avoid reentering them the
next time you start the OneClick home page by selecting ‗Remember my
password.‘
4. Click Install JRE.
The Installing the Java 2 Runtime Environment dialog opens.
5. Click Java Runtime Environment to download the JRE.
6. Install the JRE and Java Web Start application by running the file you just
downloaded. You may need to change permissions on the file to run it.

Install JRE and Java Web Start on Linux
Chapter 1: Getting Started with the OneClick Console 13
7. Install the Java plug-in on your Solaris OneClick Console system. To see
the instructions to install the Java plug-in for J2SE, access the following
web address:
http://java.sun.com
8. Associate the .jnlp file type with the Java Web Start application, javaws,
using Firefox:
a. Click Start Console in Firefox.
b. Click Open with and select javaws, in the JRE directory
(<JRE>/bin/javaws).
c. Click OK.
Note: You must associate the .jnlp file with the Java Web Start application
for the OneClick Console to launch.
The JRE, Java Web Start, and the Java plug-ins are installed.
9. Click Start Console in the OneClick home page to open the OneClick home
page. See Start OneClick Using a Browser (see page 17) for more
information. If you encounter problems starting the OneClick Console, see
Troubleshoot Solaris Problems (see page 18).
Install JRE and Java Web Start on Linux
You must install the JRE and Java Web Start on your Linux computer where
the OneClick Console is installed to run the OneClick Console.
Before you begin installing the JRE and Java Web Start, confirm the following:
■ You have the correct URL for the OneClick web server system.
■ You can access the OneClick web server system using HTTP on a web
browser.
■ Your account allows you to log in to the OneClick web server.
To install the JRE and Java Web Start on Linux
1. Log in to your Linux OneClick Console system.
2. Open the OneClick home page at the URL provided by your SPECTRUM
administrator, using your web browser. The URL has the following format:
http://<hostname>:<portnumber>/
Note: <hostname> is the name of the OneClick server. Use
:<portnumber> only if the OneClick web server does not use the default of
port 8080. If you cannot access the OneClick web server, notify your
SPECTRUM administrator.

Install JRE and Java Web Start on Windows
14 OneClick Console User Guide (5130)
3. Enter your OneClick login credentials, if prompted.
Note: You can save your login credentials to avoid reentering them the
next time you start the OneClick home page by selecting ‗Remember my
password.‘
The OneClick home page opens.
4. Click Install JRE.
The Installing the Java 2 Runtime Environment dialog opens.
5. Click Java Runtime Environment to download the JRE.
6. Save the JRE file to your system when prompted.
7. Install the JRE and Java Web Start application by running the file you just
downloaded. You may need to change permissions on the file to run it.
8. Associate the .jnlp file type with the Java Web Start application, javaws,
using Firefox:
a. Click Start Console in Firefox.
b. Click Open with and select javaws, in the JRE directory
(<JRE>/bin/javaws).
c. Click OK.
Note: You must associate the .jnlp file type with the Java Web Start
application for the OneClick Console to launch.
JRE and Java Web Start are installed.
9. Click Start Console in the OneClick home page to open the OneClick home
page. See Start OneClick Using a Browser (see page 17) for a detailed
explanation. If you encounter problems starting the OneClick Console, see
Troubleshoot Linux Problems (see page 19).
Install JRE and Java Web Start on Windows
You can install the JRE and Java Web Start on your Windows OneClick Console
system. You must install JRE and Java Web Start to run the OneClick Console.
Before you begin installing the JRE and Java Web Start, confirm the following:
■ You have the correct URL for the OneClick web server system.
■ You can access the OneClick web server system using HTTP on a web
browser.
■ Your account allows you to log in to the OneClick web server.

Install JRE and Java Web Start on Windows
Chapter 1: Getting Started with the OneClick Console 15
To install the JRE and Java Web Start on Windows
1. Log in to your Windows OneClick Console system.
2. Open the OneClick home page at the URL provided by your SPECTRUM
administrator, using your Web browser. The URL has the following format:
http://<hostname>:<portnumber>/
Note: <hostname> is the name of the OneClick server.
Use :<portnumber> only if the OneClick server does not use the default of
port 80. If you cannot access the OneClick server, notify your SPECTRUM
administrator.
3. Enter your OneClick login credentials if prompted.
Note: You can save your login credentials to avoid reentering them the
next time you start the OneClick home page by selecting ‗Remember my
password.‘
The OneClick home page opens.
4. Click Install JRE.
The Installing the Java 2 Runtime Environment dialog opens.
5. Click Java Runtime Environment to download the JRE.
6. Click Run or Open in the File Download dialog.
After file download completes, the Internet Explorer Security Warning
dialog opens.
7. Click Run.
The J2SE License Agreement dialog opens.
8. Select Typical setup and click Accept to accept the License Agreement.
Note: If you do not accept the license agreement and click Decline, you
will not be able to download and install the JRE, and you will not be able to
run the OneClick Console.
The J2SE installer begins.
9. Click Finish when the installation completes.
The JRE and Java Web Start are installed.
10. You can now click Start Console from the OneClick home page to start the
OneClick Console. See Start OneClick Using a Browser (see page 17) for
information about starting the OneClick Console for the first time. If you
encounter problems starting the OneClick Console, see Troubleshoot
Windows Problems (see page 20).
Verify .jnlp File Mapping
16 OneClick Console User Guide (5130)
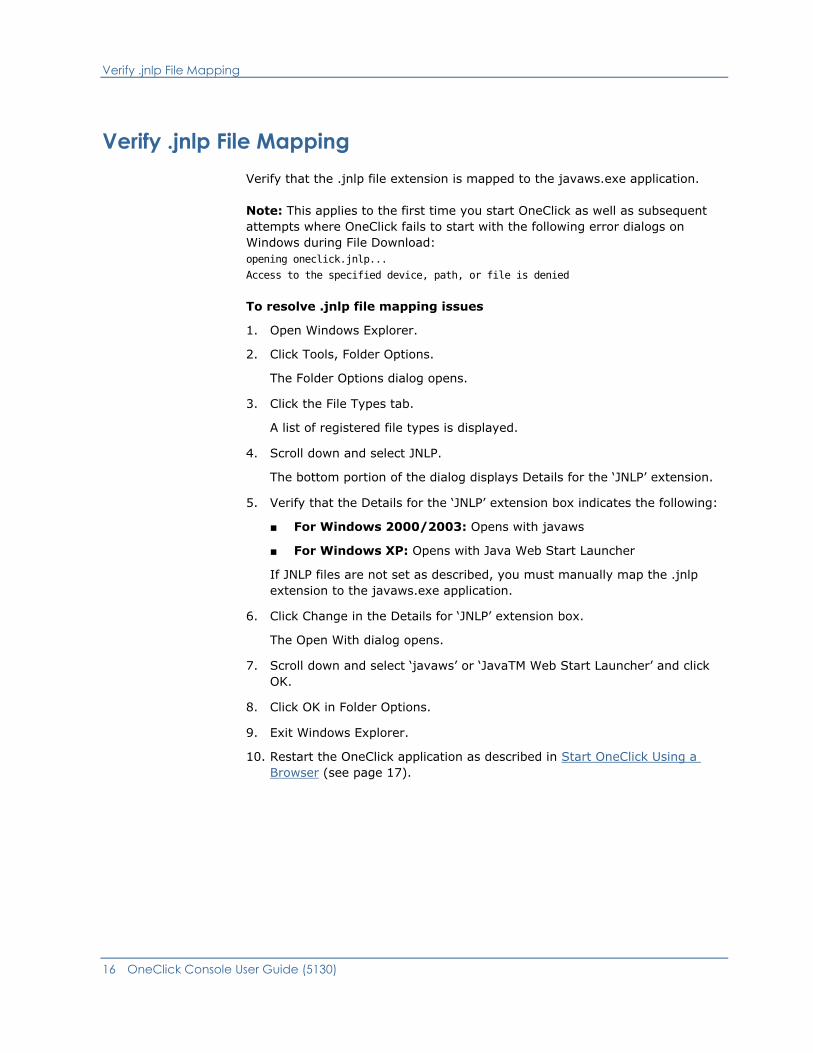
Verify .jnlp File Mapping
Verify that the .jnlp file extension is mapped to the javaws.exe application.
Note: This applies to the first time you start OneClick as well as subsequent
attempts where OneClick fails to start with the following error dialogs on
Windows during File Download:
opening oneclick.jnlp...
Access to the specified device, path, or file is denied
To resolve .jnlp file mapping issues
1. Open Windows Explorer.
2. Click Tools, Folder Options.
The Folder Options dialog opens.
3. Click the File Types tab.
A list of registered file types is displayed.
4. Scroll down and select JNLP.
The bottom portion of the dialog displays Details for the ‗JNLP‘ extension.
5. Verify that the Details for the ‗JNLP‘ extension box indicates the following:
■ For Windows 2000/2003: Opens with javaws
■ For Windows XP: Opens with Java Web Start Launcher
If JNLP files are not set as described, you must manually map the .jnlp
extension to the javaws.exe application.
6. Click Change in the Details for ‗JNLP‘ extension box.
The Open With dialog opens.
7. Scroll down and select ‗javaws‘ or ‗JavaTM Web Start Launcher‘ and click
OK.
8. Click OK in Folder Options.
9. Exit Windows Explorer.
10. Restart the OneClick application as described in Start OneClick Using a
Browser (see page 17).
Start OneClick Using the Command Line on Solaris
Chapter 1: Getting Started with the OneClick Console 17
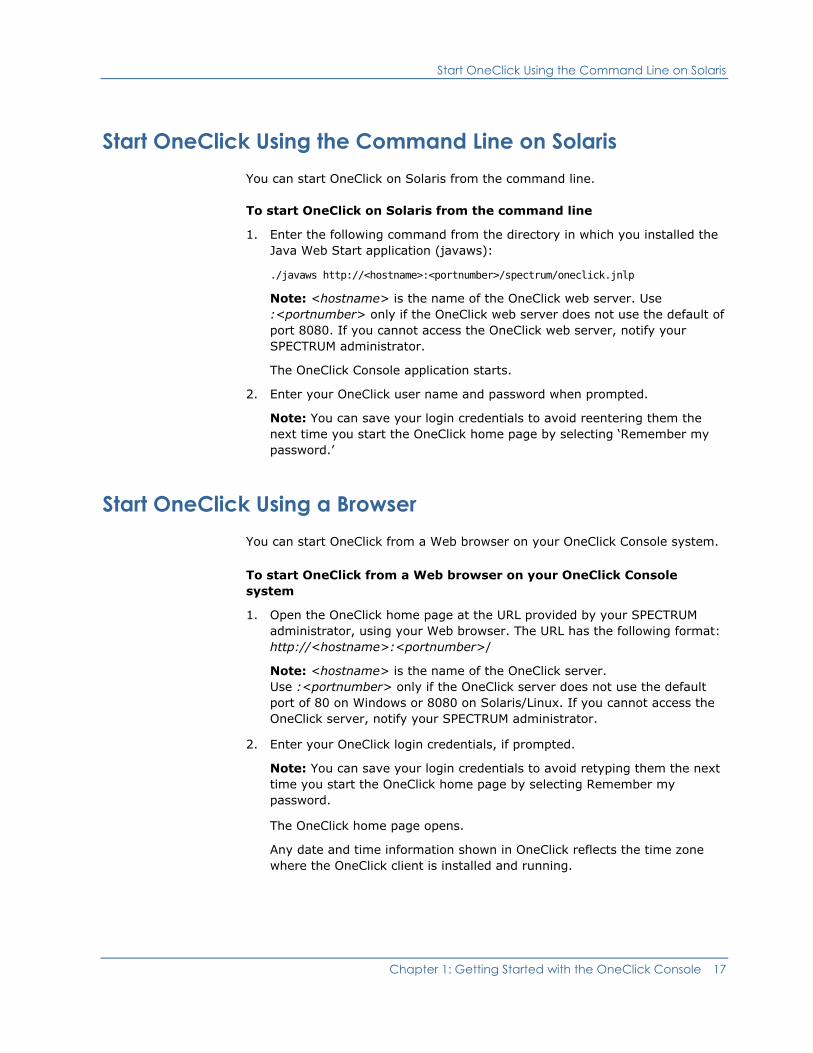
Start OneClick Using the Command Line on Solaris
You can start OneClick on Solaris from the command line.
To start OneClick on Solaris from the command line
1. Enter the following command from the directory in which you installed the
Java Web Start application (javaws):
./javaws http://<hostname>:<portnumber>/spectrum/oneclick.jnlp
Note: <hostname> is the name of the OneClick web server. Use
:<portnumber> only if the OneClick web server does not use the default of
port 8080. If you cannot access the OneClick web server, notify your
SPECTRUM administrator.
The OneClick Console application starts.
2. Enter your OneClick user name and password when prompted.
Note: You can save your login credentials to avoid reentering them the
next time you start the OneClick home page by selecting ‗Remember my
password.‘
Start OneClick Using a Browser
You can start OneClick from a Web browser on your OneClick Console system.
To start OneClick from a Web browser on your OneClick Console
system
1. Open the OneClick home page at the URL provided by your SPECTRUM
administrator, using your Web browser. The URL has the following format:
http://<hostname>:<portnumber>/
Note: <hostname> is the name of the OneClick server.
Use :<portnumber> only if the OneClick server does not use the default
port of 80 on Windows or 8080 on Solaris/Linux. If you cannot access the
OneClick server, notify your SPECTRUM administrator.
2. Enter your OneClick login credentials, if prompted.
Note: You can save your login credentials to avoid retyping them the next
time you start the OneClick home page by selecting Remember my
password.
The OneClick home page opens.
Any date and time information shown in OneClick reflects the time zone
where the OneClick client is installed and running.
Troubleshoot Solaris Problems
18 OneClick Console User Guide (5130)
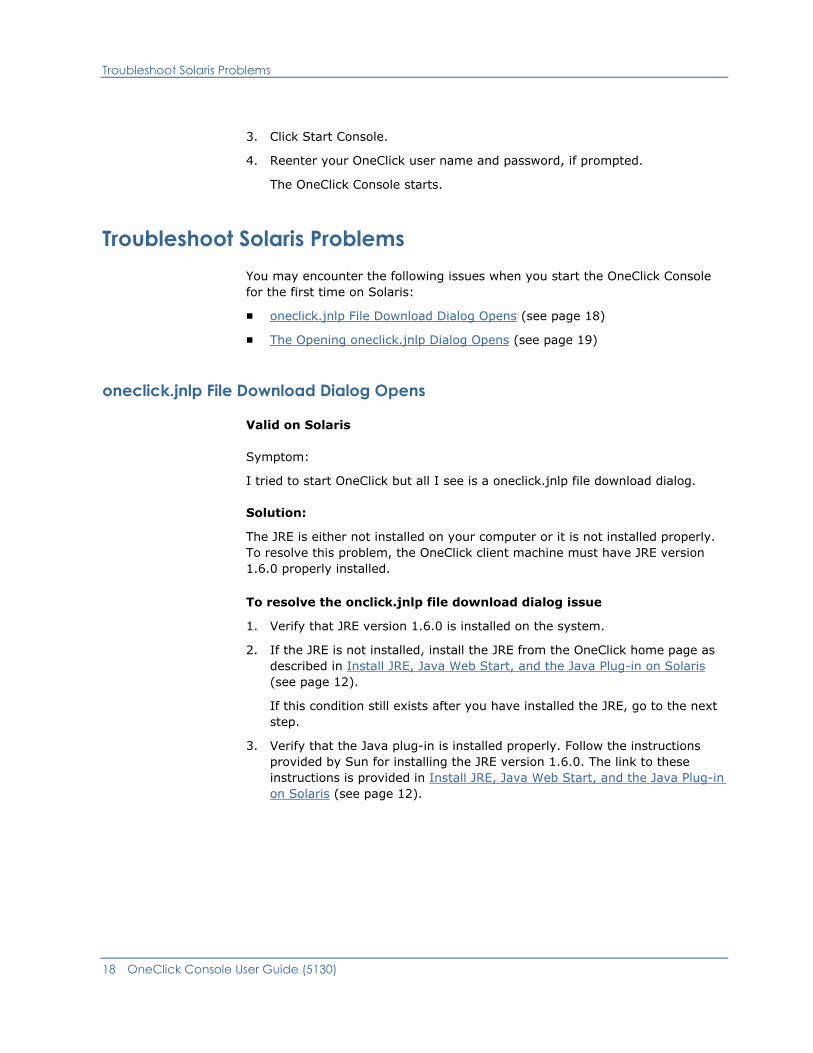
3. Click Start Console.
4. Reenter your OneClick user name and password, if prompted.
The OneClick Console starts.
Troubleshoot Solaris Problems
You may encounter the following issues when you start the OneClick Console
for the first time on Solaris:
■ oneclick.jnlp File Download Dialog Opens (see page 18)
■ The Opening oneclick.jnlp Dialog Opens (see page 19)
oneclick.jnlp File Download Dialog Opens
Valid on Solaris
Symptom:
I tried to start OneClick but all I see is a oneclick.jnlp file download dialog.
Solution:
The JRE is either not installed on your computer or it is not installed properly.
To resolve this problem, the OneClick client machine must have JRE version
1.6.0 properly installed.
To resolve the onclick.jnlp file download dialog issue
1. Verify that JRE version 1.6.0 is installed on the system.
2. If the JRE is not installed, install the JRE from the OneClick home page as
described in Install JRE, Java Web Start, and the Java Plug-in on Solaris
(see page 12).
If this condition still exists after you have installed the JRE, go to the next
step.
3. Verify that the Java plug-in is installed properly. Follow the instructions
provided by Sun for installing the JRE version 1.6.0. The link to these
instructions is provided in Install JRE, Java Web Start, and the Java Plug-in
on Solaris (see page 12).

Troubleshoot Linux Problems
Chapter 1: Getting Started with the OneClick Console 19
The Opening oneclick.jnlp Dialog Opens
If the Opening oneclick.jnlp dialog opens, and the ‗Open with‘ option is not
available, the .jnlp file type has not been associated with the javaws
application on the system. Verify that .jnlp file types are associated with JWS
by following the instructions in the Installing JRE procedure for your platform.
If the Opening oneclick.jnlp dialog continues to open after verifying that you
have associated .jnlp files with JWS, complete the following procedure.
To resolve the ‘Opening oneclick.jnlp’ dialog issue
1. Open the javaws console.
2. Select Edit, Preferences, Advanced, JNLP File/Mime Association.
3. Select Prompt user.
4. Click Apply.
5. Click OK.
6. Start the OneClick Console.
If the condition persists after completing the previous steps, see your
OneClick administrator.
Troubleshoot Linux Problems
This section describes some common problems you may encounter while trying
to start the OneClick Console on a Linux system, with steps to resolve each
problem.
Firefox Download Error Dialog
The Firefox Download Error dialog opens when you attempt to start the
OneClick Console due to one of the following conditions:
■ the JRE version 1.6.0 is not installed on the Linux system
■ the JRE version 1.6.0 is not configured properly
■ the .jnlp file type is not associated with the JavaWS application

Troubleshoot Windows Problems
20 OneClick Console User Guide (5130)
To resolve the FireFox download error dialog issue
1. Verify that the JRE v1.6.0 is installed on the Linux OneClick Console
system. If the JRE is installed, go to the next step. If it is not, follow the
instructions in Install JRE and Java Web Start on Linux (see page 13) to
install the JRE.
2. Configure the Firefox browser to associate .jnlp file types with the JavaWS
application. In a Firefox browser window, choose Edit, Preferences.
The Preferences dialog opens.
3. Click Downloads.
4. Click View & Edit Actions in the Download Actions section.
The Download Actions dialog opens.
5. Locate the entry for the JNLP extension. Verify that the action associated
with the file type is Open with JavaTM Web Start Launcher. This
association is made when installing the JRE. If a different associations is
listed, click Change Action.
The Change Action dialog opens.
6. Select 'Open them with this application' and click Browse if necessary.
The Select Helper Application dialog opens.
7. Select javaws from the location you installed it and click OK.
8. Click Close.
9. Click OK.
Troubleshoot Windows Problems
Use the following process to troubleshoot problems when trying to start the
OneClick Console for the first time on Windows:
1. Verify JRE Installation (see page 20).
2. Verify .jnlp File Mapping (see page 16).
Verify JRE Installation
Verify that version 1.6.0 of the JRE is installed on the OneClick Console
Windows system. See Install JRE and Java Web Start on Windows (see
page 14) for details.

Chapter 2: OneClick Console User Interface 21
Chapter 2: OneClick Console User
Interface
This section contains the following topics:
OneClick Console User Interface Overview (see page 22)
Navigation Panel (see page 23)
Contents Panel (see page 24)
Component Detail Panel (see page 25)
OneClick Tabs (see page 25)
OneClick Toolbars (see page 30)
OneClick Status Bar (see page 34)

OneClick Console User Interface Overview
22 OneClick Console User Guide (5130)
OneClick Console User Interface Overview
The OneClick Console user interface is comprised of three distinct panels that
display information about your network assets: the Navigation panel, the
Contents panel, and the Component Detail panel. The following image shows
an example of the OneClick Console user interface:
The information displayed in each of the panels depends on what is selected in
the Navigation panel. The context of each panel depends on the selected item
and context of the other panels. The context of the Contents panel is set by
the item selected in the Navigation panel. The context of the Component Detail
panel is set by the content and selected item in the Contents panel. The title
line of the Content and Component Detail panels describes the context of the
displayed information. Tabs in the Contents and Component Detail panels
provide detailed lists of devices, alarms, events, and other information about
specific items. For more information, see OneClick Tabs (see page 25).
You can customize how you view these panels by docking, cloning, or
removing them. For more information, see View and Move OneClick Panels
(see page 45).

Navigation Panel
Chapter 2: OneClick Console User Interface 23
Note: For more information about using the OneClick Console with any
OneClick add-on application such as VPN Manager, Service Performance
Manager, Multicast Manager, or Service Manager, see the user documentation
provided with those applications.
Navigation Panel
You can use the Navigation panel to access information about your network
assets. The Navigation panel includes the following:
■ Alarm views
■ Topology views
■ Device lists
■ Event views
■ Detailed device information
■ Containers
■ Landscapes
■ OneClick applications
■ Searches
The Navigation panel is located on the left side of the default OneClick user
interface. Two of its tabs are available to OneClick operators: the Explorer tab
and the Locater tab.
Explorer Tab
The Explorer tab in the Navigation panel displays a hierarchical view of
landscapes, containers, OneClick applications, and device models. In this view,
container and device icons indicate the model class and status of each
container and device model. The views you see in the Explorer tab were
modeled by your OneClick administrator to reflect your network infrastructure
and its traffic.
Note: OneClick may filter containers and devices from the Explorer view if
they are children of a higher-level container for which you do not have view
permissions.
The Explorer tab shows a high-level view of alarms that are active for devices
in each container and application in the columns to the right of each line item.
You can modify the default alarm view in the Explorer tab. See Customize
Columns (see page 44) for more information.

Contents Panel
24 OneClick Console User Guide (5130)
Use the Explorer tab to select a container or OneClick application in the Name
column, and then view information, alarms, events, lists, and topologies
available for that selection in the Contents panel. You can also use the plus
and minus icons to expand and collapse containers and applications in the
Explorer tab as necessary.
Locater Tab
The Locater tab provides search functionality for locating network assets
(device and application models) and viewing details about them. Search results
appear in the Results tab of the Contents panel. Detailed information about
network assets selected in the results list appears in the Component Detail
panel.
Contents Panel
The Contents panel is located in the upper right side of the OneClick interface.
The information displayed in the Contents panel depends on the context set
from the Navigation panel. If the Locater tab in the Navigation panel is the
active tab, then the Results tab appears in the Contents panel, showing the
results of the last search performed in the current user session. If the Explorer
tab is the active tab in the Navigation panel, the Contents panel displays the
Alarms, Topology, List, Events, and Information tabs for the device, container,
or application selected. By default, the Alarms tab is the active tab in the
Contents panel.

Component Detail Panel
Chapter 2: OneClick Console User Interface 25
Component Detail Panel
The Component Detail panel displays additional detailed information for the
item that is selected in the Contents panel. The following image shows an
example of the Component Detail panel.
OneClick Tabs
OneClick categorizes information by tabs that appear in both the Contents and
Component Detail panels. Depending on the context set by the current
selection in the Navigation panel, all or some of the tabs appear. Some tabs
appear in either the Contents or the Component detail panel depending on the
context set by selections in the Navigation and Contents panels. The following
list describes these OneClick tabs in detail.
Alarms tab
Appears in either the Contents or Component Detail panel depending on
context.
Alarm Details tab
Appears in the Component Detail panel, shows detailed information about
the alarm selected in the Alarms tab.
Topology tab
Displays network topology models created manually or by Discovery.
List tab
Displays all models of the container currently selected in the Explorer tab.
OneClick Tabs
26 OneClick Console User Guide (5130)
Events tab
Displays events for the container, model, or application currently selected
in either the Explorer tab or the Contents panel. This includes all alarms
and events for the selected model.
Information tab
Displays details about the container, device, or application selected.
Host Configuration
Capture, view, upload, and export device configuration files. For more
information, see Network Configuration Manager User Guide (5180).
Impact tab
Displays the impact and symptoms for a selected alarm.
Root Cause tab
Displays the root cause for a device that is down which can be helpful
when a device has multiple alarms.
Interfaces tab
Displays interface information for the selected alarm or device.
Performance tab
Displays performance information for the selected device, including CPU &
Memory Utilization.
Alarm History tab
Displays the historical information for the selected alarm including
associated events, status, when created, and cleared. For general alarm
history for a device, use the Events tab.
Neighbors tab
Displays the model selected from either the Explorer tab or the Contents
panel and any models that are directly connected to it.
More information:
Information Tab (see page 30)
List Tab (see page 29)
Topology Tab (see page 28)
Alarms Tab (see page 27)
Events Tab (see page 30)
Interface Information (see page 63)

OneClick Tabs
Chapter 2: OneClick Console User Interface 27
Alarms Tab
The Alarms tab displays any alarms that exist for the device, container, or
application selected in the Explorer tab in the Navigation panel. Your view of
the alarms may have been preconfigured by your OneClick administrator to
show only a subset of alarms available.
Select an alarm in the Alarms tab to display detailed information for that alarm
in the Component Detail panel. The toolbar displayed at the top of the Alarms
tab lets you quickly process alarms in OneClick. See Alarms Toolbar (see
page 32) for more information about the toolbar functionality.
Alarm Severity Colors
OneClick uses colors, along with audible alerts, to identify the severity of
alarms. The following table displays OneClick alarm severity colors and their
definitions.
Color Severity Description
Blue Initial Contact with device is not
established.
Gray Suppressed Device cannot be reached due to a
known error condition that exists on
another device.
Brown Maintenance Device is offline for maintenance
purposes.
Red Critical A loss of service has occurred;
immediate action is required.
Orange Major A loss of service has occurred or is
impending; action is required within a
short period of time.
Yellow Minor A situation has occurred, but no
immediate action is required.
This severity is also used for alarms
created to convey information only,
such as "Duplicate IP."
Green Normal Contact has been made with the
device. Device is operating normally.
There are no alarms associated with
this device.

OneClick Tabs
28 OneClick Console User Guide (5130)
More information:
Place Devices in Maintenance Mode (see page 77)
Alarms List Columns
Information for each alarm displayed in the Alarms tab is categorized by the
columns in the table. The default alarm information categories include
Severity, Date/Time, Name, Network Address, Type, Acknowledged, Alarm
Type, and Landscape. There may be other categories if there are OneClick
add-on applications installed and if your OneClick administrator has created
any alarm categories.
You can select which columns to display in the Alarms list. As with all table
columns in OneClick, you can sort on the content for each Alarms list column
by clicking that column heading. For example, to sort the alarms by severity,
click the Severity column header. Clicking the column header toggles the
sorting of the list between ascending order and descending order. The triangle
icon displayed in the column header points up or down depending on
ascending or descending sort order, respectively. For more information about
customizing columns in the Alarms list, see Customize Columns (see page 44).
Filter the Alarms List
You can filter the alarms list as follows:
■ You can enter text in the Filter field. As you type, the Alarms list displays
only those alarms with attributes that match the current text in the Filter
field. For example, you could view only critical alarms by typing crit in the
Filter field.
■ You can also create alarm filters to save and reuse.
More information:
Filter OneClick Lists (see page 45)
Filter Alarms (see page 53)
Topology Tab
The Topology tab appears in the Contents panel and shows network topology
diagrams for selected containers and collections. If you expand the view of a
container or collection in the Explorer tab and then select a specific device in
that container, the Topology view shifts to show that device in the Contents
panel. If you double-click an icon in a topology view, the context of the
Navigation panel shifts to select and display that device, container, or
application. The Topology tab is not available if either My SPECTRUM or a
landscape is selected in the Explorer tab.

OneClick Tabs
Chapter 2: OneClick Console User Interface 29
The following image shows an example of the Topology tab view:
More information:
Topology Toolbar (see page 33)
List Tab
The List tab displays all models of the container currently selected in the
Explorer tab.
If a device is selected in the Explorer tab, all models are displayed for that
device‘s container. This view is updated dynamically, for example, when
models are added or removed or when attributes are updated. You can
double-click an entry in the List tab to select that model in the Explorer tab.
This tab is not available when My SPECTRUM or any landscapes are selected in
the Explorer tab.
Results Tab
The Results tab displays the results of searches performed in the Locater tab in
the Navigation panel.

OneClick Toolbars
30 OneClick Console User Guide (5130)
Events Tab
The Events tab appears in either the Contents or Component Detail panel. It
displays all the events for the item selected in either the Explorer tab or the
Contents panel. If you have selected My SPECTRUM, the Events tab appears
only in the Component Detail panel.
More information:
Events Tab Preferences (see page 38)
Manage Events (see page 58)
Information Tab
The Information tab appears in either the Contents or Component Detail panel,
depending on the context set. The Information tab displays detailed device
configuration information, VLAN and VPN configuration settings, and more. The
Information tab is not available when My SPECTRUM or any landscapes are
selected in the Explorer tab.
OneClick Toolbars
There are toolbars available in several OneClick panels and tabs. OneClick
toolbars use graphical buttons and icons to provide you with quick access to
features and functionality.
Hide Toolbars
By default, all available toolbars are shown in the OneClick Console, but you
can hide them as needed.
To hide toolbars
1. Select View, Toolbars.
A submenu opens which lists the available toolbars. A checkmark beside a
toolbar name indicates that it is currently visible in OneClick.
2. Click the toolbar you want to hide.
The menu closes and the toolbar is removed from the applicable view.

OneClick Toolbars
Chapter 2: OneClick Console User Interface 31
Main Toolbar
The Main toolbar, which appears at the top of the OneClick Console, contains
buttons for completing tasks common to many OneClick applications. The
following table describes the Main toolbar‘s buttons:
Button Description
Navigation: Use the toolbar‘s navigation buttons to
move back and forth through the Console to the views
you‘ve recently accessed. You can also click the
down-arrows next to each navigation button to select
the desired view from a list of the views you most
recently accessed.
Go Up: Click to move up to the next level in the
hierarchy. Hovering your mouse‘s cursor over this button
displays a tooltip indicating what the next level is.
Ping: Click to send an ICMP Ping to the selected device
from the SpectroSERVER modeling the device.
Telnet: Click to establish a communication session with
the selected device using Telnet from the
SpectroSERVER modeling the device.
Secure Shell: Click to establish an encrypted
communication session with the selected device using
Secure Shell (SSH), from the SpectroSERVER modeling
the device.
Poll: Click to poll the selected device, from the
SpectroSERVER modeling the device.
Web Administration: Click to open a browser using the
IP address of the selected device. Available only for
models that have the WebAdminURL attribute.
Note: You can also access the functions performed by the buttons in the Main
toolbar from the File, View, and Tools menus or, depending on the view you
are working in, from the right-click menu.

OneClick Toolbars
32 OneClick Console User Guide (5130)
Alarms Toolbar
The Alarms toolbar lets you quickly process alarms in OneClick. The following
table describes the buttons and functionality available in the Alarms toolbar.
Button Description
Clear selected alarms: Click to clear the selected alarms.
Cleared alarms are removed from the Alarms table.
Acknowledge selected alarms: Click to acknowledge the
selected alarms.
Unacknowledge selected alarms: Click to unacknowledge the
selected alarms.
Assign a troubleshooter: Click to assign a troubleshooter to the
selected alarms.
Unassign the troubleshooter: Click to unassign a
troubleshooter from the selected alarms.
Write attributes: Click to write in values for writable alarm
attributes, such as a trouble ticket number or an acknowledgment.
If your SPECTRUM administrator has configured them, other alarm
attributes may be writable.
Mail: Click to email alarms to a recipient.
Alarm Filter: Click to open the Alarm Filter dialog from which you
can create an alarm filter.
Export: Click to open the ‗Export table data to file‘ dialog. In this
dialog, you can specify a file format and location to export the
Alarms list to.
Filter
text
box
Filter: The Filter text box lets you quickly filter the current Alarms
list view by text.
OneClick Toolbars
Chapter 2: OneClick Console User Interface 33
More information:
Assign and Unassign Troubleshooters (see page 57)
Alarm Filter Dialog (see page 50)
Email Alarms to a Troubleshooter (see page 58)
Export Table Data (see page 83)
Filter the Alarms List (see page 28)
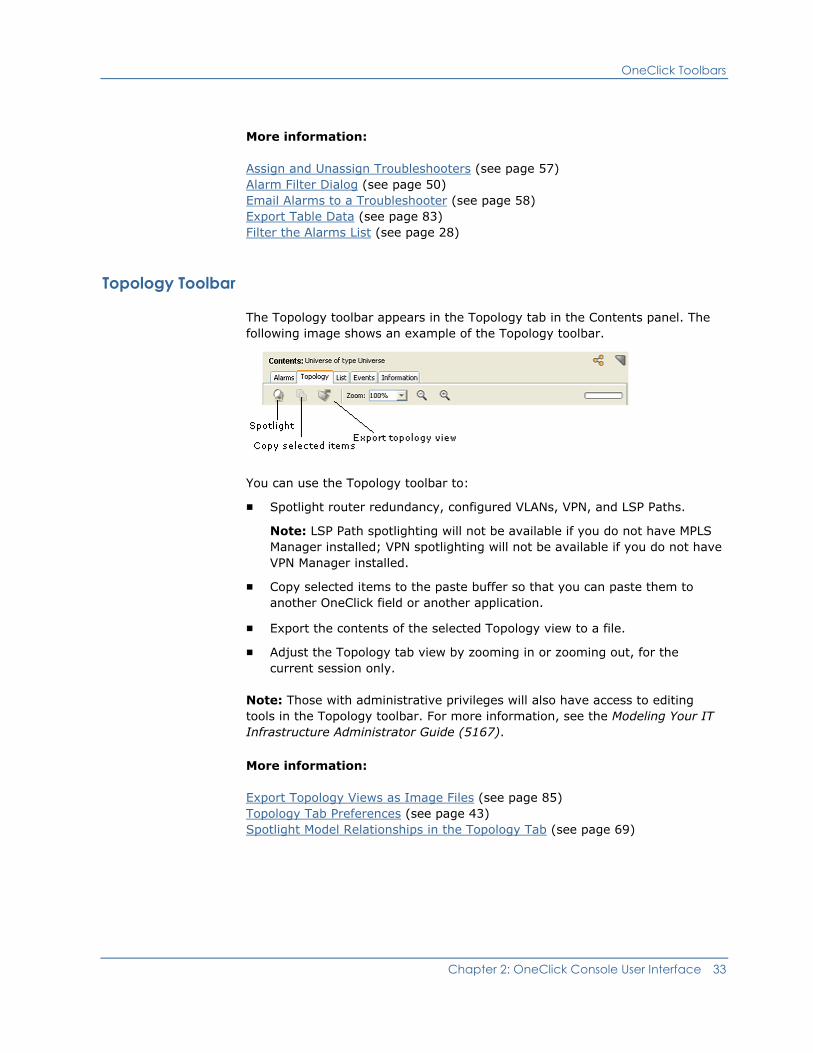
Topology Toolbar
The Topology toolbar appears in the Topology tab in the Contents panel. The
following image shows an example of the Topology toolbar.
You can use the Topology toolbar to:
■ Spotlight router redundancy, configured VLANs, VPN, and LSP Paths.
Note: LSP Path spotlighting will not be available if you do not have MPLS
Manager installed; VPN spotlighting will not be available if you do not have
VPN Manager installed.
■ Copy selected items to the paste buffer so that you can paste them to
another OneClick field or another application.
■ Export the contents of the selected Topology view to a file.
■ Adjust the Topology tab view by zooming in or zooming out, for the
current session only.
Note: Those with administrative privileges will also have access to editing
tools in the Topology toolbar. For more information, see the Modeling Your IT
Infrastructure Administrator Guide (5167).
More information:
Export Topology Views as Image Files (see page 85)
Topology Tab Preferences (see page 43)
Spotlight Model Relationships in the Topology Tab (see page 69)

OneClick Status Bar
34 OneClick Console User Guide (5130)
Neighbors Toolbar
The Neighbors toolbar appears in the Neighbors tab in the Component Detail
panel. It functions exactly like the Topology tab toolbar with the exception that
it does not have a Spotlight button. See the button descriptions in Topology
Toolbar (see page 33) for more information about the buttons on the
Neighbors toolbar.
Tooltips
OneClick toolbars use tooltips to briefly describe the function of each button.
Many other elements of the OneClick interface also have tooltips. You can set
the length of time a tooltip displays in the user interface from the Set
Preferences dialog. See General Preferences (see page 42) for more
information.
OneClick Status Bar
Located at the bottom of the OneClick Console, the status bar provides the
following functionality:
■ Displays information about the OneClick infrastructure including the
connection status of the servers and services required by OneClick to
provide accurate, real-time network information.
■ Allows you to view messages from OneClick administrators.
■ Identifies the username used to log on to the current OneClick session,
and the name of the OneClick server the current client is connected to.
■ Allows you to change your password using a "Change Password" link.

Chapter 3: Using and Customizing OneClick 35
Chapter 3: Using and Customizing
OneClick
This section contains the following topics:
Set OneClick Preferences (see page 35)
Customize Columns (see page 44)
Select Landscapes (see page 44)
Filter OneClick Lists (see page 45)
OneClick Panels (see page 45)
Global Collections (see page 46)
Favorites Folder (see page 46)
Change Your OneClick Password (see page 47)
Copy Text from the Component Detail Panel (see page 47)
Insert URLs in OneClick (see page 48)
Set SPECTRUM_BROWSER Variable (see page 48)
Set OneClick Preferences
Many of the customizations that you can make to your view of OneClick are
done using the Set Preferences dialog. You can set preferences in OneClick for
a number of categories and add-on applications such as General settings, the
Alarms tab, and the Explorer tab. The Set Preferences dialog provides access
to these settings. Additionally, there are preferences that can be
administratively set for all users or categories of users which cannot be
changed by users without administrative privileges. When the top-level
preferences group is selected in the left-side panel in the Set Preferences
dialog, all available preferences and the tools to edit them are shown in the
right-side panel. Some of the preferences available to you as a OneClick
operator are described in this chapter.
To set OneClick preferences
1. Click View, Preferences.
2. The Set Preferences dialog opens.
3. Expand the folder for the individual preference or preference group that
you want to change in the Name column.

Set OneClick Preferences
36 OneClick Console User Guide (5130)
4. Set new values for the selected preference in the right-side panel as
desired.
Note: If Make Changes Permanent is selected at the bottom of the dialog,
any preferences you set will become your default settings. If you make
changes and deselect Make Changes Permanent before clicking Apply or
OK, your changes will be in effect only for the current session.
5. Click Apply.
6. Click OK.
The preferences are set and the Set Preferences dialog closes.
Alarms Tab Preferences
You can use the Alarms Tab in the Set Preferences dialog to specify a number
of different settings for your OneClick alarms. Alarm preferences and
categories available for modification include the following:
Acknowledge When Assign
Specifies whether or not to automatically acknowledge alarms when
assignments are made.
Alarm Filter
Sets the filter that is used for all displayed alarms tables. Click Set Alarm
Filter to access the Alarm Filter dialog.
Alarm Notification
Specifies settings for alarm popup alerts and sounds:
New Alarm Popup Alert
Specifies whether you get a popup alert for new alarms. You can also
specify the duration and transparency of the popup.
New Alarm Sound
Enables or disables sound notification of new alarms. Sound
notification is a male, English-speaking voice announcing the number
and severity of alarms when they are generated.
Alarms Table
Specifies settings for how the alarms table displays including column order,
available columns, sorting, and font.
Email Templates
Specifies the available templates that can be selected from to include in an
email message. For more information, see Create Email Templates (see
page 40).

Set OneClick Preferences
Chapter 3: Using and Customizing OneClick 37
Expert Clear
When set, confirmation for clearing selected alarms is not displayed.
Show secondary when in maintenance
Specifies whether to show secondary alarms for a device that is in
maintenance.
Trouble Ticket URL
Specifies a URL in which to enclose the trouble ticket ID. Set the URL for
an existing trouble ticket management system in use at your location. If
specified, the trouble ticket number for an alarm appears as a hyperlink
that opens a Web browser to the trouble ticket system URL. The trouble
ticket ID can be substituted into the URL at run time by specifying ―{0}‖ in
the URL string as shown in the following example:
http://acme/ticket?id={0}
More information:
Filter Alarms (see page 53)
Display Initial and Suppressed Alarms
Important! In general, displaying Initial and Suppressed alarms is not
recommended in OneClick due to the volume of network traffic it can
potentially add to your network.
You can view initial and suppressed alarm conditions if the Disable Initial
Alarms and Disable Suppressed Alarms settings for the Virtual Network
Machine (VNM) managing your network are set to No. Only users with
OneClick administrator privileges can change these settings. Go to the Disable
Initial and Suppressed Alarms attributes in the Alarm Management submenu
for the VNM you are working with.
To display Initial or Suppressed alarms
1. Click View, Preferences.
The Set Preferences dialog opens.
2. Expand the Alarms Tab folder, select Alarm Filter, and click Set Alarm
Filter.
The Alarm Filter dialog opens.
3. Click Add.
The Enter Filter Name dialog opens so you can add a new filter.
4. Enter a name for the new alarm filter and click OK.
5. Click the Severity tab in the Alarm Filter dialog.

Set OneClick Preferences
38 OneClick Console User Guide (5130)
6. Select the Initial and Suppressed alarm categories and click the single-left
arrow button to move them to the Show list.
Click OK.
7. The Alarm Filter dialog closes.
8. Click OK.
The Set Preferences dialog closes.
9. Right-click the Name column header in the Explorer tab.
The Table Preferences dialog opens.
10. Select the Initial Alarm Count and Suppressed Alarm Count check boxes.
11. Click OK.
Initial and Suppressed alarms will now be displayed in OneClick.
Events Tab Preferences
Select Events in the Set Preferences dialog to set Events tab preferences. The
types of preferences you can set are:
Default Time Interval
Specifies the default time interval used to retrieve events displayed in the
Events tab. OneClick uses this value initially to display events for a model.
You can change this value using the Event Filter Dialog (see page 59).
Email Templates
Specifies the available templates that can be selected from to include in an
email message.
Events Table
Columns
Specifies the columns of information to display in the Events table.
Font
Specifies the font family and type size used in the Events table.
Sort
Specifies the default sorting methodology for the Events table.
Set OneClick Preferences
Chapter 3: Using and Customizing OneClick 39
Filtered Event Types
Select the types of events to exclude from the Events table.
Show events for subcomponents
Specifies whether to show events for the subcomponents of the selected
model in the Events tab, for example ports. OneClick uses this value
initially to display events for a model. You can change this value in the
Event Filter Dialog (see page 59).
More information:
Create Email Templates (see page 40)
Exclude Event Types (see page 39)
Exclude Event Types
You can exclude event types from displaying in the Events table.
To add filtered event types to the Excluded event types list
1. Click View, Preferences.
The Set Preferences dialog opens.
2. Expand the Events Tab folder in the Name column and click Filtered Event
Types.
3. Click Browse under the Excluded event types list.
The Select Event Type dialog opens displaying all the available event
types.
Note: If you already know the event code for the event type you want to
exclude, you can enter it in the Filter box beneath the list of excluded
event types and click Add.
4. Select the desired event from the Select Event Type dialog and click OK.
The Select Event Type dialog closes and the excluded event type‘s event
code appears in the text box beneath the list of excluded event types.
5. Click Add.
The event type is added to the Excluded event types list.
6. Click Apply in the Set Preferences dialog.
The event types you selected are now excluded and will no longer be
displayed in the Events table.
Set OneClick Preferences
40 OneClick Console User Guide (5130)
To remove filtered event types from the Excluded event types list
1. Click View, Preferences.
The Set Preferences dialog opens.
2. Expand the Events Tab folder in the Name column and click Filtered Event
Types.
3. Select the excluded event type that you want to remove from this list.
4. Click Remove.
5. Repeat for other event types that you do not want excluded from
displaying in the Events table.
The event types you selected are no longer excluded and will now be
displayed in the Events table.
Create Email Templates
You can create new email templates.
Note: The following procedure describes how to create email templates for
alarms, however, the same steps apply to setting up email templates for
events. For more information about event preferences, see Events Tab
Preferences (see page 38).
To create an email template
1. Click View, Preferences.
The Set Preferences dialog opens.
2. Expand the Alarms Tab folder in the Name column and click Email
Templates.
3. Select a template from the Templates drop-down list.
The Pager and Email templates are the default templates.
4. Click Edit to modify the selected template.
The Edit Template dialog opens.
5. Enter a name for this new template in the Save As field.
6. Select the information you want to display in the new message template.
7. (Optional) Click Move Up or Move Down to change the order in which the
information appears in the message.
8. Click OK when you have finished creating the template.
The new template is created and appears in the Templates drop-down list.
Set OneClick Preferences
Chapter 3: Using and Customizing OneClick 41
Modify Email Templates
You can modify existing email templates.
Note: The following procedure describes how to modify email templates for
alarms, however, the same steps apply to setting up email templates for
events.
To modify an email template
1. Click View, Preferences.
The Set Preferences dialog opens.
2. Expand the Alarms Tab folder in the Name column and click Email
Templates.
3. Select a template from the Templates drop-down list.
4. Click Edit to modify the selected template.
The Edit Template dialog opens.
5. Select the information you want to display in the message template.
6. (Optional) Click Move Up or Move Down to change the order in which the
information appears in the message.
7. Click OK when you have finished modifying the template.
The modified template appears in the Templates drop-down list.
Explorer Tab Preferences
The following Explorer preference options are available in the Set Preferences
dialog in the Explorer Tab section.
Expansion Limit
When set, a warning is displayed if you expand an Explorer node whose
number of elements exceeds the limit specified.
Explorer Table
Specifies the following preferences for the Explorer tab:
Columns
Specifies which Alarm category columns appear in the Explorer.
Note: See Display Initial and Suppressed Alarms (see page 37) for
information about the Initial Alarm Count and Suppressed Alarm Count
settings.

Set OneClick Preferences
42 OneClick Console User Guide (5130)
Fonts
Specifies the font and type size used to display text in the Explorer.
Sort
Specifies the default sorting used in the Explorer.
Initial View
Specifies how the Explorer tab appears in the OneClick Console each time
you start the application.
General Preferences
This section describes the general preferences available in the Set Preferences
dialog. Depending on your access rights, you may not have access to all of the
following settings.
Community Strings List
Edit the stored community strings list. This is useful if you want to add new
community strings to the list, remove stored community strings that may
have been typed incorrectly, or clear the entire list.
Note: This preference may have been locked by your OneClick
administrator.
Default Field Font
Specifies the default font to be used for all field views in the Information
panels.
Default Table Font
Specifies the default font used in all OneClick tables. This setting can be
overridden for a specific table by using the Table Preferences dialog.
Locale
Specifies the regional locale used to format dates, time, and numbers. This
setting overrides the operating system setting. This is useful if you want
the same locale setting independent of what system you are logged on to.
You must restart the OneClick client to fully apply this setting.
Look and Feel
Specifies the look and feel for the OneClick client. The default setting is the
native look and feel for the system running the client, such as Windows. If
you choose to override the system default, OneClick attempts to use the
same look and feel setting independent of the system you are logged on
to. If the system does not support the specified look and feel, OneClick
uses the system default.
Note: You must restart the OneClick client to fully apply this setting.

Set OneClick Preferences
Chapter 3: Using and Customizing OneClick 43
New Message Sound
Specifies whether there is a sound indicator when you receive a new
message from OneClick administrators.
Scrollbar Increment
Specifies the amount that each scrollbar adjusts to when you click the
scrollbar arrow.
Time Format
Specifies the time format in OneClick as either 12-hour or 24-hour.
Time Zone
Specifies whether to use Coordinated Universal Time (UTC) to display
dates and time in OneClick. By default, OneClick uses the local system
time zone.
Tool Tip Delay
Specifies the amount of time, in seconds, that you want your cursor to
remain over a button, field, or other component in the OneClick interface
before a tooltip displays.
More information:
Tooltips (see page 34)
Topology Tab Preferences
This section describes the Topology tab preferences available in the Set
Preferences dialog. Depending on your access rights, you may not have access
to all the following settings.
Annotation Font
Specifies the default font settings for topology annotation text. You can
modify font, style, size, and background and foreground colors.
Grid Properties
These preference settings are only visible when the topology view is in edit
mode. Only administrators can place OneClick topologies into edit mode.
Customize Columns
44 OneClick Console User Guide (5130)
Initial Zoom
You can choose one of the following three settings for the default view of
the Topology tab:
■ The system default zoom percentage, which is set by the OneClick
administrator
■ A custom zoom percentage
■ Fit topology into visible window with the zoom level not dropping below
a minimum setting
Show Pipe Label
Specifies whether to show pipe (connection) labels in the Topology tab.
Default: No
Note: If you change any of the Topology preferences, and ‗Make Changes
Permanent‘ is selected, the changes are in effect each time you use OneClick.
Customize Columns
You can change the way columns appear in OneClick by right-clicking a column
heading to open the Table Preferences dialog. In the Table Preferences dialog
you can select the columns you want to display. The choices available vary
depending on the OneClick application you are using.
You can resize a column by clicking and dragging a column header to the left
or right. You can resize a column to fit the longest text by double-clicking the
column header boundary to the right of the column. You can also sort a list by
the attribute values in a particular column by clicking the column heading.
Alternatively, you can set table preferences in each of the Set Preferences
dialog categories that support tables.
Select Landscapes
A SPECTRUM landscape is the network view of a specific SPECTRUM server. In
a distributed SPECTRUM environment, multiple SPECTRUM servers are used to
manage the network. Each server has its own view of the network. Depending
on how your SPECTRUM environment is configured, you may have access to
more than one SPECTRUM server.

Filter OneClick Lists
Chapter 3: Using and Customizing OneClick 45
As such, the ‗Select landscapes to search‘ dialog may appear when you
perform certain actions. This dialog asks you to select which landscapes you
want to perform the action in. It lists the included landscapes on the left, and
the excluded landscapes on the right. If you have only a single landscape, that
single landscape appears in the list of included landscapes.
Filter OneClick Lists
You can filter items displayed in OneClick lists using the Filter field. The Filter
text box appears in many OneClick panels and tabs and lets you enter text to
filter the data that appears in columns and lists. As you type in the Filter text
box, the list you are working with displays only the items that contain the text
you entered in the Filter text box.
OneClick Panels
By default all three panels appear in the OneClick interface, however, you can
modify your view of the panels as needed.
■ View menu: Each panel is listed in the View menu. If the panel has a
checkmark next to it, it is viewable. If the panel does not have a
checkmark next to it, it is not currently viewable in the OneClick Console
interface.
■ Docking and Cloning: Each OneClick panel can be docked, undocked, or
cloned using the following buttons:
– Undock: Click to undock a OneClick Console panel.
– Dock: Click to dock a previously undocked OneClick Console
panel.
– Clone: Click to clone a OneClick Console panel.
Dock and Undock Panels
Undocking a panel opens it in its own window, at the same time removing it
from the main OneClick Console view. Undocking panels can help you to make
better use of your screen space.
You can dock an undocked panel by clicking Dock or by using the View menu.
To display panels that you have closed, click the View menu and select the
panel to display.
Global Collections
46 OneClick Console User Guide (5130)
Clone Panels
Click Clone in either the Contents panel or the Component Detail panel to open
a separate window containing another instance of the panel. Clicking Clone in
the Contents panel while the Component Detail panel is visible opens a new
window containing instances of both panels.
Use cloning to simultaneously view more than one area of your network. A
cloned window‘s display of information is not affected if you subsequently
navigate away from the original source to view other network assets.
Global Collections
Global Collections help organize operator views of network devices which span
containers and which may span landscapes. SPECTRUM administrators create
Global Collections, and operators monitor Global Collections by selecting them
in the Explorer tab, and then viewing the Alarms, Events, and List tabs in the
Contents panel.
A Global Collection may be empty for several reasons. There may not be any
collections configured, you may not have access to existing collections, or
there may be dynamic collections that do not currently have any models in
them. OneClick administrators maintain Global Collections and grant or restrict
access to them.
For information about creating and maintaining Global Collections, see the
Modeling Your IT Infrastructure Administrator Guide (5167).
Favorites Folder
The Favorites folder is something all OneClick users can populate and maintain
for their own benefit, without administrator assistance.
In the OneClick Navigation panel‘s Explorer tab, you can add any OneClick
element below the landscape level to your Favorites folder by right-clicking the
element and choosing Add To, Favorites. You can also add Global Collections to
your favorites by right-clicking your Favorites folder and choosing Add
Collections.
You can create sub-folders by right-clicking Favorites (or a sub-folder within
Favorites) and choosing New Folder. Use the right-click menu to cut, copy,
paste, rename, and delete sub-folders.

Change Your OneClick Password
Chapter 3: Using and Customizing OneClick 47
Change Your OneClick Password
You can change your OneClick password from the OneClick home page or the
status bar in the OneClick Console.
To change your OneClick password
1. Navigate to one of the following locations:
■ The bottom of the OneClick home page.
■ The status bar at the bottom of the OneClick Console.
2. Click the 'Change Password' link.
3. Enter your current password, your new password, and re-enter your new
password.
Your password is changed.
Copy Text from the Component Detail Panel
You can copy text from the Component Detail panel.
To copy text from the Component Detail panel
1. Select the text in the Component Detail panel you want to copy by doing
one of the following:
■ Place the cursor over the beginning of the range of text you want to
copy, press and hold the left mouse and drag the cursor across the
range of text.
■ Double-click a word you want to select, or triple-click to select an
entire line of text.
The text range is highlighted.
2. Do one of the following with the text range highlighted:
■ Right-click and select Copy.
■ Press CTRL+C.
3. Paste the text into the writable field in OneClick or in another document or
email program.
You have now copied text from the Component Detail panel.

Insert URLs in OneClick
48 OneClick Console User Guide (5130)
Insert URLs in OneClick
You can insert URLs into writable fields in the Component Detail panel.
To insert URLs into OneClick
1. Find the field in the Component Detail panel where you want to add a URL.
For example, select the Notes field from the General Information submenu
and click the set hyperlink.
2. Enter the text and the URL you want to include in the note. For example:
Issue is described at http://internal.info.xyz.com
3. Click Save.
Note: Including spaces or commas in a URL may cause some browsers to have
problems locating the web resource. If you need to include spaces or commas
in a URL that you are including in the Component Detail panel, use the
hexadecimal equivalent and proper encoding:
■ For a comma, use %2C
■ For a space, use %20
See your OneClick administrator for more information about URL formatting.
Also, see the OneClick Customization Guide (5160) for details about URL
formatting in OneClick.
Set SPECTRUM_BROWSER Variable
By default, OneClick uses the Netscape browser on Solaris and Linux systems.
For Windows systems, OneClick uses the default browser as defined on the
system. You can override the default OneClick settings with the
SPECTRUM_BROWSER environment variable.
Define SPECTRUM_BROWSER as part of your environment. Include the full
path for the command that opens the browser of your choice. Use a
placeholder to specify the URL in the SPECTRUM_BROWSER variable using {0}
(<full_path_browser>/firefox.exe {0}).
When you click a link in OneClick, the {0} is replaced by the URL link.
The SPECTRUM_BROWSER variable overrides other platform or system
browser selection variables.

Chapter 4: Monitoring Your Network with OneClick 49
Chapter 4: Monitoring Your Network with
OneClick
This section contains the following topics:
Network Searches (see page 49)
Search Your Network (see page 50)
Alarm Filter Dialog (see page 50)
Manage Alarms (see page 53)
Manage Events (see page 58)
Interface Information (see page 63)
Spotlighting Model Relationships (see page 69)
Spotlight Model Relationships in the Topology Tab (see page 69)
Highlight Modeled Devices (see page 70)
Connection Status Indicator (see page 71)
Connection Status Dialog (see page 71)
Check OneClick Messages (see page 72)
Check Connection Status (see page 72)
OneClick Schedules (see page 72)
Network Searches
Searching your network with SPECTRUM is a fundamental network
management task. As an operator, you can run predefined searches using the
Locater tab to identify specific models or groups of models on your network.
You can choose from several categories of search criteria when performing a
search. For example, not only can you search for network assets, but you can
search for items such as schedules configured in OneClick to see if they are in
effect and determine the number of models to which each schedule is applied.
Some searches that may be available to you in the Locater tab include the
following:
■ All Devices
■ Devices > By IP Address
■ All Application Models

Search Your Network
50 OneClick Console User Guide (5130)
■ All SNMPv3 Devices
■ All Schedules
If you are operating in a Distributed SpectroSERVER (DSS) environment, some
searches require you to select the landscapes to include in your search using
the landscape selection dialog. For more information, see Select Landscapes
(see page 44).
Note: For information about creating and managing searches, see the
OneClick Administration Guide (5166).
Search Your Network
You can run predefined searches of your network from the Locater tab.
To search the network
1. Click the Locater tab in the Navigation panel.
2. Find the search you want to run in the Locater tab and do one of the
following:
■ Double-click the search.
■ Select the search and click (Launch the selected search).
If additional input is not required, the search runs immediately.
3. Enter any additional information if prompted, depending on the type of
search you are running and click OK.
The search results appear in the Results tab of the Contents panel.
Alarm Filter Dialog
The Alarm Filter dialog lets you create alarm filters to determine how alarms
appear in your OneClick Alarms tab. It contains the following tabs:
Landscape
Defines which landscapes to display alarms for.
Severity
Defines which alarm severities will be applied to this filter.

Alarm Filter Dialog
Chapter 4: Monitoring Your Network with OneClick 51
State
Specifies which states you want to show. Options are as follows:
Acknowledged State
Acknowledged, Not Acknowledged, Both.
Clearable State
Clearable, Not Clearable, Both.
Primary/Secondary State
Show Primary For Containers/All For Devices, Show Only Primary,
Show All Alarms.
Note: Selecting Both under Acknowledged State or Clearable State
means that you will see both of the other available options in that
particular group box (both Acknowledged and Not Acknowledged or
both Clearable and Not Clearable).
Symptoms
Specifies whether to show alarms that are determined to be the cause
of symptoms.
Network Address
Specifies a range of network addresses for which to show or hide alarms.
Assignment
Specifies which assigned owners can view alarms.
Model Class
Specifies which model classes you do not want to display alarms for.
Model Type
Specifies the model types for which you do not want to display alarms.
Alarm Filter Dialog
52 OneClick Console User Guide (5130)
Alarm Type
Specifies the alarm types for which you do not want to display alarms.
Attribute
Attribute: Select an attribute of a device to filter.
Comparison Type: Specifies how to compare the value of the attribute ID
with the value in the Attribute Value field. Only the comparison types
appropriate to the attribute‘s data type will be displayed.
Ignore Case: Select the Ignore Case check box if you do not want the
comparison to be case-sensitive. This selection is only enabled when it is
appropriate for the data type of the attribute you selected.
Attribute Value: Enter or select the desired attribute value you want to
use in the comparison.
The Show Advanced button in this tab lets you use complex attribute
filtering.
The following buttons are available in the Alarm Filter dialog from every tab:
Clear Tabs
Clears all fields in all tabs, effectively clearing any filters set in the tabs.
Clear All
Clears all fields in all tabs and in the Advanced filter section. If you click
Clear All and click OK, all alarms appear because no filters are set.
Show Advanced
Opens the Advanced Filter panel. For more information, see Advanced
Alarm Filter.
Available Filters
Contains saved filters so that you can apply, edit, or delete them.
Add
Creates a new alarm filter using the Enter Filter Name dialog. The new
alarm filter will display in the Available Filters drop-down list.
Delete
Removes the selected filter from the Available Filters list.
More information:
Create and Save Alarm Filters (see page 53)

Manage Alarms
Chapter 4: Monitoring Your Network with OneClick 53
Manage Alarms
OneClick provides tools to help you identify and manage alarms displayed in
the Alarms tab, along with settings used by administrators to tailor the alarms
generated in OneClick.
Filter Alarms
You can determine how alarms appear in your OneClick view using alarm filters
created in the Alarm Filters dialog.
To open the Alarm Filter dialog, do one of the following:
■ In the Set Preferences dialog, select Alarm Filter from the Alarms Tab
folder and click Set Alarm Filter.
■ Click (Filter) in the Alarms tab toolbar.
You can create alarm filters to customize which alarms OneClick displays in the
Alarms tab. You can also create advanced alarm filters, as described in
Advanced Alarm Filter.
Multiple Alarm Filters
You can create multiple alarm filters to screen for specific alarm conditions on
specific devices, containers, or other models. You can use these filters to view
different alarm conditions simultaneously in multiple Alarm views. Create
multiple Alarm views by cloning the Component Detail or Contents panel, and
displaying the Alarm tab in each panel. Select a different alarm filter you have
created to troubleshoot or watch for specific conditions in each Alarm view.
See Clone Panels (see page 46) for more information.
Create and Save Alarm Filters
You can create and save alarm filters so that you can retrieve and use them
later.
To create and save an alarm filter
1. Click the Alarms tab in the Contents panel.
2. Click (Filter) in the Alarms tab toolbar.
The Alarm Filter dialog opens.
3. Click Add.
The Enter Filter Name dialog opens.

Manage Alarms
54 OneClick Console User Guide (5130)
4. Enter the name of the filter you want to create and click OK.
5. Click the tab you want to use to configure the filtering criteria. These tabs
are described in Advanced Alarm Filter.
6. Click Apply.
The filter settings are saved and the filter is applied to the Alarms tab
view.
7. Click OK.
The alarm filter is now created and saved and the Alarm Filter dialog
closes.
Filter With Advanced Alarm Filter
The Advanced Filter provides more flexibility compared to simple filtering
because it lets you make multiple selections of the types of filters you want to
apply. Simple filtering, on the other hand, simply groups all filter selections
and applies them in a linear fashion, (for example, Filter by Landscape and
Secondary Alarms and Model Type). In simple filtering, all criteria must be
met; in advanced filtering, any of the criteria you define can be met.
You must have at least two sets of filter criteria for an advanced filter to be
applied and then filter alarms in an ―either/or‖ fashion.
For example, with advanced filtering, you can display red (Critical)
HubCat5000 model types or yellow (Minor) Pingable model types. In this case,
neither red (Critical) Pingable model types nor yellow (Minor) HubCat5000
model types will show up in the Alarms list. With simple filtering, you cannot
make this fine a distinction. Instead, you would see all Minor and Critical
Pingables and all Minor and Critical HubCat5000.
This example describes the procedure you can use to achieve advanced
filtering for the previous selections.
To filter on critical HubCat5000 model types or minor pingable model
types
1. Click View, Preferences.
The Set Preferences dialog opens.
2. Expand the Alarms Tab folder in the Name column and click Alarm Filter,
Set Alarm Filter.
The Alarm Filter dialog opens.

Manage Alarms
Chapter 4: Monitoring Your Network with OneClick 55
3. Click the Model Type tab and hide all model types except HubCat5000
models by doing the following:
a. Click the double-right arrow button to move all model types from the
Show list to the Hide list.
b. Type HubCat5000 in the Filter field on the right side of the dialog.
Note: You may need to scroll down to see the Filter field.
c. With the HubCat5000 model type selected, click the single-left arrow
button.
HubCat5000 is moved to the Show list.
4. Click the Severity tab and move Major and Minor alarms to the Hide list.
5. Click Show Advanced.
The Alarm Filter dialog expands to display the Advanced Filter section.
6. Click Add in the Advanced Filter section.
Your selections are placed into the Advanced Filter panel; the panel now
displays the following filter:
Severity (Hide Suppressed, Major, Minor, Initial, Maintenance) AND Model Type
(Show HubCat5000)
7. Click Clear Tabs.
The filters you just set are cleared.
Note: The filter you created still appears in the Advanced Filter panel, but
now you are going to add to it.
8. Click the Model Type tab and move all model types to the Hide list except
Pingable.
9. Click the Severity tab and move Major, Critical, Initial, and Suppressed
alarms to the Hide list.
10. Click Add in the Advanced Filter panel to move your selections to the
Advanced Filter panel.
The panel now displays the following filter:
Severity (Hide Suppressed, Major, Minor, Initial, Maintenance) AND Model Type
(Show HubCat5000)
OR Severity (Hide Critical, Suppressed, Major, and Initial) AND Model Type (Show
Pingable).”
11. Click Add next to the Available Filters list.
Your settings are saved and the Enter Filter Name dialog opens.
12. Enter a name for the filter you want to save.
Manage Alarms
56 OneClick Console User Guide (5130)
13. Click OK.
The Enter Filter Name dialog closes and the filter you saved appears in the
Available Filters drop-down list.
14. Click OK.
The Alarm Filter dialog closes.
15. Click OK.
The Set Preferences dialog closes.
Alarm Troubleshooters
You can assign individuals, called troubleshooters, the responsibility of
investigating alarms and solving problems. Troubleshooters are assigned to
alarms using the Alarms Toolbar (see page 32).
Create Troubleshooters
You must first create troubleshooters before you can assign an alarm to them.
To create troubleshooters
1. Click Tools, Utilities, Troubleshooters.
The Troubleshooters dialog opens.
2. Click Create.
The Create Troubleshooter dialog opens.
3. Enter the troubleshooter‘s name and email address.
4. Select the landscapes to which you are assigning the troubleshooter.
5. Click OK in the Create Troubleshooter dialog.
6. Click Close in the Troubleshooters dialog.
The troubleshooter is now created and you can now assign this
troubleshooter to an alarm.

Manage Alarms
Chapter 4: Monitoring Your Network with OneClick 57
Assign and Unassign Troubleshooters
You can assign and unassign troubleshooters to alarms displayed in the Alarms
list using the Alarms toolbar. Troubleshooters must already exist in OneClick to
assign them. For information about creating troubleshooters, see Create
Troubleshooters (see page 56).
Note: Email services must be configured on the OneClick server so that
OneClick can send an email message to the assigned troubleshooter. See the
OneClick Administration Guide (5166) for information about configuring email
services in OneClick.
To assign a troubleshooter and send a notification email
1. Click the Alarms tab in the Contents panel.
2. Select the alarms you want to assign a troubleshooter to.
3. Click (Assign Troubleshooter).
The Select Troubleshooter dialog opens.
4. Select a troubleshooter from the list.
5. (Optional) Click Edit Mail to edit the message before sending it to the
troubleshooter. See Email Alarms to a Troubleshooter for more
information.
6. Click OK.
The Select Troubleshooter dialog closes and an alarm notification email is
sent to the troubleshooter you selected.
To unassign a troubleshooter
1. Click the Alarms tab in the Contents panel.
2. Select the alarms to unassign a troubleshooter from.
3. Click (Unassign Troubleshooter).
4. Confirm that you want to unassign the troubleshooter from the alarm.
OneClick sends a message to the troubleshooter stating that they have
been unassigned from the alarm.

Manage Events
58 OneClick Console User Guide (5130)
View Troubleshooter Assignments
You can display the Assignment column in the Alarms list to see the names of
troubleshooters assigned to each alarm.
To view troubleshooter assignments
1. Click the Alarms tab in the Contents panel.
2. Right-click the column header in the Alarms list.
The Table Preferences dialog opens.
3. Select Assignment in the Columns tab and click OK.
The Assignment column now appears in the Alarms list, displaying the
names of troubleshooters assigned to alarms.
Email Alarms to a Troubleshooter
You can send email messages to troubleshooters which contain alarm details.
To send an email message with information about an alarm
1. Click the Alarms tab in the Contents panel.
2. Select the alarms you want to send in an email to a troubleshooter.
3. Click (Email).
The Mail Selected Alarms dialog opens.
4. Type a recipient email address in the To field or select one from the
drop-down list. Entries made here are stored in the drop-down list.
5. (Optional) Type a recipient email address in the Cc field or select one from
the drop-down list. Entries made here are stored in the drop-down list.
6. Type a subject or select one from the drop-down list. Subject line entries
are stored in the Subject drop-down list.
7. Select the message template to use from the Templates drop-down list, or
edit the template as described in Create Email Templates (see page 40).
8. Click OK.
The message is sent.
Manage Events
You can view events for containers and modeled devices by selecting the
container or device in the Explorer tab, and then clicking the Events tab in the
Contents panel or the Component Detail panel. You can filter the Events tab
using the Event Filter dialog.

Manage Events
Chapter 4: Monitoring Your Network with OneClick 59
Email Events
You can email events using the same steps you use to email alarms. For
details, see Email Alarms to a Troubleshooter (see page 58).
Event Filtering
You can filter the events displayed in the Events tab by entering text to filter
on in the Filter field, as described in Filter OneClick Lists (see page 45). Events
that contain the text string you enter appear in the Events list. You can also
create event filters to save and reuse.
Event Filter Dialog
The Event Filter dialog lets you set additional conditions for filtering events.
You can access this dialog from the Events tab by clicking (Filter) in the
toolbar, or by right-clicking an event in the Events list and selecting Filter from
the menu.
You can filter your current view of the Events list as follows:
■ Display Events for a Date and Time Range
■ Display Events for a Range of Hours
■ Display Events for Ports and Applications
■ Exclude and Include Events in the Event Table by Type
■ Advanced Event Filter
When you change many of these settings in the Event Filter dialog, the change
only applies to the current instance of the Events tab. Default values for the
Date/Time and Show events for subcomponents options are applied each time
you select the Events tab for a model. These default values can be set using
the Set Preferences dialog (View, Preferences). Default preference values for
these and other options can be set globally for all users by the OneClick
administrator using the Set Preferences dialog.
Display Events for a Date and Time Range
In the Date/Time section of the General tab in the Event Filter dialog, you can
limit the events shown in the Events tab to a particular range by selecting the
‗Show events for a time range‘ option. Enter a start date and time for the
range. If you do not select an end date and time for the range, OneClick
displays all the events starting for that date and time onward. Create an end
date and time for the range by selecting the End check box, and entering a
date and time.

Manage Events
60 OneClick Console User Guide (5130)
When you select the ‗Show events for a time range‘ option, the Events tab
shows the time range for which events are currently being displayed just
above the Events list.
Display Events for a Range of Hours
You can show only those events that fall within the range of specific hours.
To display events for a range of hours
1. Click the Events tab in the Contents panel.
2. Click (Filter) in the Events tab toolbar.
The Event Filter dialog opens.
3. Select ‗Show events for the last <X> hours.‘
4. Enter a number in the selection box to indicate how many hours of recent
events you want to see in the Events list.
5. Click OK.
The Events list now displays only those events from the past number of
hours you specified.
Note: When you select ‗Show events for the last <X> hours,‘ the Events
tab shows the time range for which events are currently being displayed
just above the Events table.
Display Events for Ports and Applications
You can show events for device model subcomponents including port and
application models by selecting the ‗Show events for subcomponents‘ option.
By default, this option is not selected.
Exclude and Include Events in the Event Table by Type
You can add and remove events that are in the Exclude Event Types List.
Events listed in the Exclude Event Types list are not displayed in the Events
table.
Note: The following procedures only impact the Events tab view in the context
in which you perform the task. You cannot save event view settings to use at a
later time.
You can exclude event types directly from the Events table.
To exclude event types from being displayed in OneClick, right-click the event
you want to exclude in the Events table and select Exclude from the menu.
The event is removed from the Events table.

Manage Events
Chapter 4: Monitoring Your Network with OneClick 61
To exclude event types from being displayed in OneClick using the
Event Filter dialog
1. Click the Events tab in the Contents panel.
2. Click (Filter) in the Events tab toolbar.
The Event Filter dialog opens.
3. Click the Event Type tab.
4. Do one of the following:
■ Enter the value for the event type directly in the text field.
■ Click Browse, select the desired event value from the list that appears,
and click OK.
The selected event value is entered in the text field.
5. Click Add.
The event is added to the ‗Excluded event types‘ list.
To include event types in the Events table
1. Click the Events tab in the Contents panel.
2. Click (Filter) in the Events tab toolbar.
The Event Filter dialog opens.
3. Select the Event Type tab.
4. Select the event type you want to display in the Events table from the
‗Excluded event types‘ list.
5. Click Remove.
The event type is removed from the ‗Excluded event types‘ list and will
now display in the Events table when it is generated.
Note: OneClick administrators can also use the Set Preferences dialog to
specify whether any event types should be excluded from the Events table.
More information:
Events Tab Preferences (see page 38)

Manage Events
62 OneClick Console User Guide (5130)
Advanced Event Filter
You can select or create advanced event filters using the Advanced tab in the
Event Filter dialog. To use an existing advanced filter, select one from the
Available Filters drop-down list.
To create an advanced event filter
1. Click the Events tab in the Contents panel.
2. Click (Filter) in the Events tab toolbar.
The Event Filter dialog opens.
3. Click the Advanced tab.
4. Select the Attribute from the drop-down list.
5. Select the Comparison Type from the drop-down list.
6. Enter the Attribute Value in the text box.
7. If you selected either Event Type or Model Type Name as the Attribute and
you do not know the attribute value, click Browse.
Either the Select Event Type or Select Model Type dialog opens.
8. Select the desired Event Type or Model Type from the dialog, and click OK.
The Attribute value appears in Attribute Value field.
9. Click Add.
The Enter Filter Name dialog opens.
10. Enter a name for the filter, and click OK.
11. Do one of the following:
■ Click OK to apply the filter and close the Event Filter dialog.
■ Click Show Advanced to continue and create a complex filter by using
And/Or relationships between multiple advanced filters.
To clear advanced event filters
1. Click the Events tab in the Contents panel.
2. Click (Filter) in the Events tab toolbar.
The Event Filter dialog opens.
3. Click the Advanced tab.
4. Click Clear.
5. Click OK.

Interface Information
Chapter 4: Monitoring Your Network with OneClick 63
To delete an advanced event filter
1. Click the Events tab in the Contents panel.
2. Click (Filter) in the Events tab toolbar.
The Event Filter dialog opens.
3. Click the Advanced tab.
4. Select the filter you want to delete from the Available Filters drop-down
list.
5. Click (Delete).
6. Click OK.
Interface Information
You can view information about a device model‘s interfaces by selecting the
model and selecting the Interfaces tab in the Component Detail panel. The
Interfaces tab displays a list of the configured interfaces and subinterfaces for
the selected device, along with the parameters defined in this section.
Note: Icon colors used in the Name, Condition, and Status fields have the
same meaning as the colors used to indicate device model status throughout
OneClick.
Not all the parameters listed here appear in the default Interfaces tab view.
See Customize Columns (see page 44) for information about displaying hidden
columns in tables.
Name
Specifies the name of the interface.
Condition
Specifies the contact status for the device, in addition to any alarm
conditions in effect for the device model.
Status
Indicates whether the interface is operational or non-operational. An
interface may be non-operational for a variety of reasons including being
administratively disabled. Some of the possible values include up, down,
off, and dormant.
Type
Identifies the physical layer interface standard that the interface uses,
such as Ethernet, SONET, and V.35.

Interface Information
64 OneClick Console User Guide (5130)
Description
Describes whether the interface is physical or logical, and the interface ID,
such as et.2.1
Device Connected
Specifies the name and status (green for up or red for down) of the device
that the current interface is connected to. The device name is a hyperlink
that displays the Information tab for the connected device.
Port Connected
The name of the port on the device that the current port is connected to.
The port name is a hyperlink that displays the Interfaces tab for the device
that the current port is connected to.
QoS Policy
Specifies the QoS policy name that applies to this interface.
Index
Specifies the value of the index object in the standard RFC or proprietary
MIB that uniquely identifies this interface within the device.
Board.Port
Identifies the board and port number on the device for the corresponding
port. For example if the port is port 4 on a module in the device‘s third
slot, the Board.Port value is 3.4.
MAC Address
Specifies the MAC address of the corresponding interface.
IP Address
Specifies the IP address of the corresponding interface.
Port Speed
Specifies the connection speed of the corresponding interface.
Duplex Status
Specifies the duplex state of the corresponding interface, either full, half,
unknown, or N/A.
Trunk Membership
Identifies if an interface is a member of an 802.3ad trunk. Trunk
Membership displays either the trunk ID that the interface is a member of,
or a zero for no membership.

Interface Information
Chapter 4: Monitoring Your Network with OneClick 65
Network Link Type
Describes the type of network device the interface is connected to. Possible
values are:
■ End Station Link
■ Internal Link
■ No Link
■ Router Link
■ Shared Access Link
■ Switch Link
■ Unknown Link
% Total Utilization
Utilization rate of the corresponding interface expressed as percentage of
the interface‘s total capacity. For interfaces that share bandwidth between
inbound and outbound traffic (such as Ethernet interfaces in half
duplex-mode) thresholds against % Total Utilization are helpful in
monitoring the ―load‖ on the interface.
% In Utilization
Utilization rate of the corresponding interface expressed as percentage of
the interface‘s total inbound capacity. For interfaces that provide dedicated
bandwidth to inbound and outbound traffic separately (such as Ethernet
interfaces in full-duplex mode) individual thresholds against % Inbound
Utilization and % Outbound Utilization may be more helpful in monitoring
the ―load‖ on the interface. This type of threshold configuration may also
prove useful when an interface is expected to experience predominantly
outbound or inbound traffic (such as one on a web server or a load
balancer).
% Out Utilization
Utilization rate of the corresponding interface expressed as percentage of
the interface‘s total outbound capacity.
IF Alias
Specifies the value of the MIB II object ifAlias for the corresponding
interface.
IF Name
Specifies the value of the MIB II object ifName for the corresponding
interface.
Note: For performance reasons, clicking (Refresh) in the Interfaces tab
does not update external attributes (like ifAlias, for example). To update all
values, you must instead select the specific rows in the list that you would like
to update and click Refresh.

Interface Information
66 OneClick Console User Guide (5130)
Subinterfaces
When a device supports virtual or subinterfaces, and subinterface modeling is
enabled for the device model, SPECTRUM models the endpoints associated with
multiplexed physical connections as subinterfaces. This includes, for example,
Cisco IPSEC tunneling on a physical Ethernet interface, Permanent Virtual
Circuits (PVCs) on a physical ATM interface, and DCL circuits on a physical
Frame Relay interface.
A modeled interface has subinterfaces available for viewing in OneClick if a ―+‖
symbol appears next to the interface name. To view the subinterfaces, click
the ―+‖ sign to expand the view of the interface. Modeling of subinterfaces
must be enabled on a model or device by a network administrator. See the
Modeling Your IT Infrastructure Administrator Guide (5167) for information
about enabling subinterface modeling.
Interface Component Detail Window
The interface Component Detail window provides access to tabs and subviews
displaying information about the selected interface and its parent device. To
display the interface Component Detail window, select the interface in the
Interfaces tab and click (Information).
Interface Thresholds Subview
The Thresholds subview displays the current settings of pairs of parameters
used to define interface alarm trigger and reset levels. Each parameter has the
following threshold settings:
■ A threshold level above which an alarm may be generated.
■ A reset level that defines the value below which an existing threshold
alarm condition is cleared.
■ An allowed threshold violation duration which defines the duration, in
seconds, that a threshold level can be violated before generating an alarm.
The following interface thresholds parameters appear in the Thresholds
subview:
■ % Total Utilization: Defines the level of port capacity used that triggers an
alarm condition for a port.
■ % Inbound Utilization: Defines the level of inbound port capacity used that
triggers an alarm condition for a port.
■ % Outbound Utilization: Defines the level of outbound port capacity used
that triggers an alarm condition for a port.

Interface Information
Chapter 4: Monitoring Your Network with OneClick 67
■ Total Packet Rate (packets/sec): Defines the number of packets per second
that triggers an alarm condition for a port.
■ % Errors: Defines the error rate on a port that triggers an alarm condition.
■ % Discarded: Defines the percentage of discarded packets on a port that
triggers an alarm condition.
Network administrators can set the values for these parameters. See the
Modeling Your IT Infrastructure Administrator Guide (5167) for more
information.

Interface Information
68 OneClick Console User Guide (5130)
Interface Performance View
The Performance view for the selected interface displays real-time graphs of
interface utilization, throughput, and errors and discards. You can select from
the performance views available using the drop-down list. You can set the
zoom level for the X and Y scales for each graph, and each graph includes a
legend explaining the data that appears in the graph. The following image
shows an example of the interface Performance view:
Spotlighting Model Relationships
Chapter 4: Monitoring Your Network with OneClick 69
Spotlighting Model Relationships
The spotlighting feature in OneClick lets you isolate and visualize the following
model relationships within your network that are not readily visible from the
Topology view:
■ Router redundancy
■ VPNs
■ VLANs
■ LSP Paths
The Topology view does not visually distinguish these model relationships,
making it more difficult to picture them within the context of your network.
With spotlighting, these model relationships are accentuated, showing you
where they appear in the network topology.
For example, you can use the spotlighting feature to select an LSP Path to view
in the Topology view. Viewing LSP Path information from this view can help
you more easily understand which devices make up a Path in an MPLS
environment. From this view, you can also see if any alarming devices are
impacting a Path's performance.
Note: LSP Path spotlighting will not be available if you do not have MPLS
Manager installed; VPN spotlighting will not be available if you do not have
VPN Manager installed.
Spotlight Model Relationships in the Topology Tab
You can use the spotlighting feature in OneClick to see the VLANs, VPNs, LSP
Paths, and router redundancy groups configured on your network. You can
only spotlight these items if they have been enabled and configured on your
network. For example, VLANs are configured by network administrators.
The following example describes how to spotlight VLANs, however, this
procedure also applies to VPNs, LSP Paths, and router redundancy groups.
To spotlight a VLAN
1. Select the desired Topology or container in the Navigation panel.
2. Click the Topology tab.
3. Click (Spotlight View), VLAN List in the Topology tab toolbar.
The Topology tab view highlights the VLANs in the network and the VLAN
List dialog opens, listing all the VLANs in the selected topology.
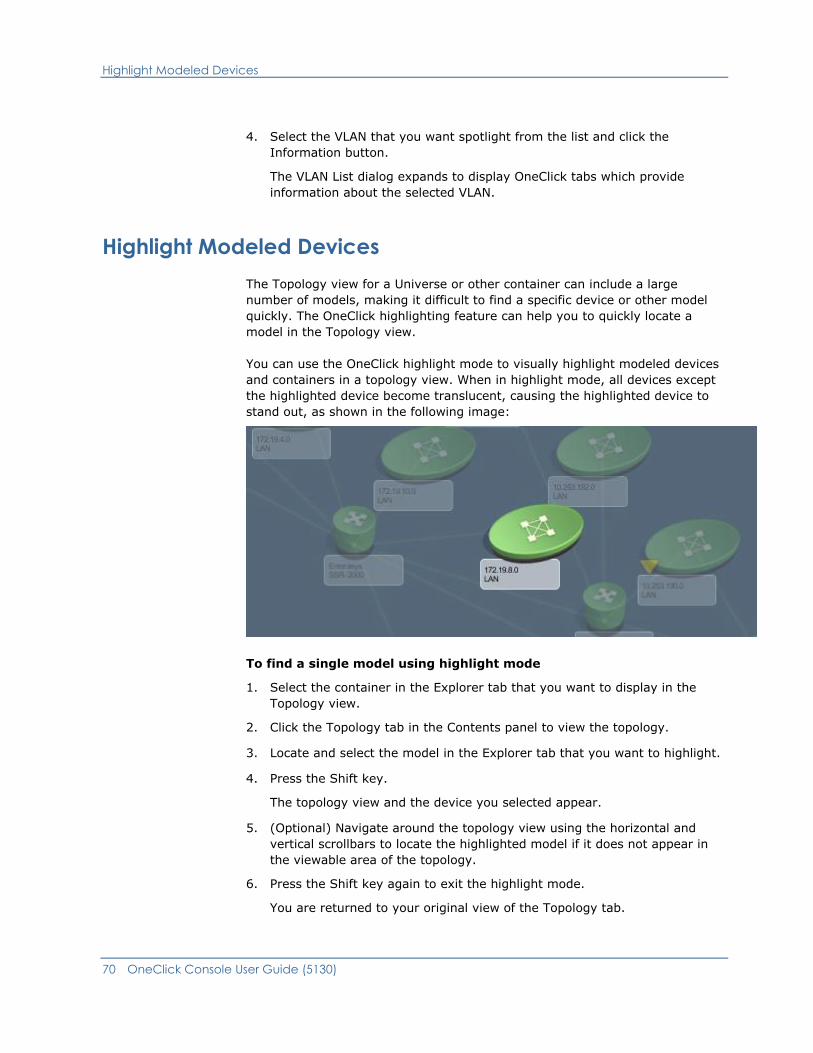
Highlight Modeled Devices
70 OneClick Console User Guide (5130)
4. Select the VLAN that you want spotlight from the list and click the
Information button.
The VLAN List dialog expands to display OneClick tabs which provide
information about the selected VLAN.
Highlight Modeled Devices
The Topology view for a Universe or other container can include a large
number of models, making it difficult to find a specific device or other model
quickly. The OneClick highlighting feature can help you to quickly locate a
model in the Topology view.
You can use the OneClick highlight mode to visually highlight modeled devices
and containers in a topology view. When in highlight mode, all devices except
the highlighted device become translucent, causing the highlighted device to
stand out, as shown in the following image:
To find a single model using highlight mode
1. Select the container in the Explorer tab that you want to display in the
Topology view.
2. Click the Topology tab in the Contents panel to view the topology.
3. Locate and select the model in the Explorer tab that you want to highlight.
4. Press the Shift key.
The topology view and the device you selected appear.
5. (Optional) Navigate around the topology view using the horizontal and
vertical scrollbars to locate the highlighted model if it does not appear in
the viewable area of the topology.
6. Press the Shift key again to exit the highlight mode.
You are returned to your original view of the Topology tab.

Connection Status Indicator
Chapter 4: Monitoring Your Network with OneClick 71
To find multiple models using highlight mode
1. Select the container in the Explorer tab that you want to display in the
Topology view.
2. Click the Topology tab in the Contents panel to view the topology.
3. Press and hold the Shift key. The icons in the topology view become
translucent.
4. Place the cursor over the model you want to highlight in the Explorer tab,
without selecting it.
The model is highlighted in the topology view.
Note: You may need to use the scroll bars in the Topology tab to locate
the highlighted device, as the topology view does not adjust to show the
highlighted device because it is not selected.
5. Move the cursor to the next model you want to highlight. As you move the
cursor over any model in the Explorer tab, it becomes highlighted in the
topology view.
■ If you place the cursor over a model that contains other models, such
as a global collection, the devices in the global collection that are
visible in the topology are highlighted.
■ If you place the cursor over a device that is part of a multicast group
configured in OneClick, all of the devices in that multicast group that
are visible in the topology are highlighted.
6. Release the Shift key to exit the highlight mode.
You are returned to your original view of the Topology tab.
Connection Status Indicator
The OneClick Console provides visual indicators when the connection status to
the SpectroSERVER changes. If the connection is lost, the borders around the
OneClick Console turn red. If the connection has switched to a secondary
SpectroSERVER, the borders turn yellow. The Information, Interfaces, and
Performance tabs also display an orange border if the connection is lost to the
selected device and a brown border if the selected device model is in
maintenance mode.
Connection Status Dialog
OneClick provides the status of connections to servers and services using the
Connection Status dialog and visual indicators in the OneClick Console when a
connection state changes.

Check OneClick Messages
72 OneClick Console User Guide (5130)
The Connection Status dialog provides connection status and shows status logs
for the servers and services used by the OneClick Console and OneClick add-on
applications. It provides the following information:
■ Web services provided by the OneClick server
■ Landscape service provided by the SpectroSERVER
■ Events services provided by the SpectroSERVER
The status of other services and server connections may be available when you
view the Connection Status dialog from other OneClick applications.
Check OneClick Messages
You can receive messages from OneClick administrators if your SPECTRUM
environment is configured to support this option.
The Messages icon ( ) appears in the status bar. You will know you have
unread messages when the Messages icon displays a + sign next to it. Retrieve
your messages by clicking the Messages icon, which opens the Messages
dialog from which you can access messages sent to you by a OneClick
administrator.
Check Connection Status
To check OneClick‘s connection status, click (Connection <status>) in the
OneClick status bar.
The Connection Status dialog opens, showing the current status of web,
landscape, and event services.
OneClick Schedules
You can schedule OneClick actions to occur at a future time with a recurrence
frequency if desired. Schedules include the following information:
■ Start date
■ Start and end times
■ Total duration in hours
■ Recurrence frequency
■ Description

OneClick Schedules
Chapter 4: Monitoring Your Network with OneClick 73
The time zone local to the OneClick client appears with the start and end
times. This is not the time zone of the modeled device or the SpectroSERVER
that manages the device. When you apply a schedule to a modeled device, the
event starts and ends at the start and end times specified in the time zone of
the SpectroSERVER managing the device.
Access Schedules
You can locate existing schedules in OneClick by using the Schedules search
function in the Locater tab. See Search Your Network (see page 50) for
information about how to search for schedules. Once you have performed a
search and one or more schedules appear in the Results list, you can access
information about a schedule.
Schedule Information View
The schedule Information tab contains subviews which display schedule
parameters. The schedule information that appears depends on the OneClick
add-on applications that are installed as part of your SPECTRUM environment.
You can access the schedule Information view after running a search for
schedules. Select a schedule from the Results list and select the Information
tab in the Component Detail panel.
Schedule General Information Subview
The following parameters appear in the General Information subview in the
Information tab for the selected schedule.
Creation Author
Identifies the user who created the schedule. Schedules that ship with
SPECTRUM show CA as the author.
Creation Time
Identifies when the schedule was created.
In Effect
Identifies whether or not the schedule is currently applied to any devices,
services, or other models.
Usage Count
Identifies the number of models the schedule applies to.
Description
Optional text describing the schedule.

OneClick Schedules
74 OneClick Console User Guide (5130)
Items Scheduled for Maintenance Subview
The Items Scheduled for Maintenance subview displays all the devices that the
schedule is applied to as a maintenance schedule. You can right-click any of
the table headings to display a list of other columns available for viewing in
this table.
Discoveries Planned with this Schedule Subview
The Discoveries Planned with this Schedule subview displays all the Discovery
configurations to which this schedule is applied. See the Modeling Your IT
Infrastructure Administrator Guide (5167) for more information about OneClick
discovery and modeling configurations.
Create Schedules
You can create your own schedule by clicking the Schedule button wherever it
is found, for example, in the In Maintenance field in the General Information
subview.
To create a schedule
1. Click Schedule.
The Add/Remove Schedules dialog opens.
2. Click Create.
The Create Schedule dialog opens.
3. Complete the fields as desired.
4. Click OK.
The Create Schedule dialog closes and the schedule you created appears in
the Current Schedules list.
5. Click OK.
The Modifying Schedules dialog opens, indicating that the changes you
made are being applied.

OneClick Schedules
Chapter 4: Monitoring Your Network with OneClick 75
OneClick Schedules in a DSS Environment
In a Distributed SpectroSERVER (DSS) environment, there are likely to be
SpectroSERVERs located in different time zones. Each SpectroSERVER
interprets all schedules as local time. When you create schedules and apply
them to devices that are managed in different landscapes, the scheduled item
will begin and end at the specified times local to each time zone. OneClick and
SPECTRUM do not correlate schedules so that they start and end
simultaneously across time zones. The following example illustrates how time
zones and schedules work in a DSS environment.
Apply a schedule to devices in different time zones
A schedule named My_Maintenance_Schedule specifies putting a device into
maintenance mode starting at 10:00 PM and ending at 3:00 AM.
My_Maintenance_Schedule is applied to Router_5 in the GMT time zone, and
to Router_4 in the GMT+1 hour time zone.
Applying My_Maintenance_Schedule to these two devices results in the
following:
■ Router_5 enters maintenance mode at 10:00 PM GMT and exits
maintenance mode at 3:00 AM GMT.
■ Router_4 enters maintenance mode at 10:00 PM GMT+1 (11:00 PM GMT)
and exits maintenance mode at 3:00 AM GMT+1 (4:00 AM GMT).

OneClick Schedules
76 OneClick Console User Guide (5130)
The following diagram illustrates this example:
Recurring Schedules
If you create a recurring schedule, OneClick ignores any Start Date entry and
applies the schedule on the first instance of the day of the week specified after
creating the schedule.

Chapter 5: Maintenance and Hibernation Mode for Devices 77
Chapter 5: Maintenance and
Hibernation Mode for Devices
This section contains the following topics:
Maintenance and Hibernation Mode (see page 77)
Recognize Model Devices in Maintenance or Hibernation Mode (see page 81)
Suppress Events and Alarms for Devices in Maintenance or Hibernation (see
page 82)
Maintenance and Hibernation Mode
Maintenance and hibernation modes in OneClick let you suspend management
traffic to a modeled device and its components. After placing a modeled device
into maintenance or hibernation mode, the SpectroSERVER continues to
receive and process all SNMP traps for the that device, however, it will not
generate any events or alarms for the device or its components while the
device is in maintenance or hibernation mode.
The only difference between maintenance and hibernation mode is that
maintenance mode requires you to disable the maintenance mode option
before the device can resume normal management traffic. Hibernation mode
automatically resumes normal management traffic as soon as the
SpectroSERVER determines it can successfully communicate with the device
after a set of successful polls are met.
Order of Precedence
Hibernation mode takes precedence over maintenance mode on a device
model; however, if the device model has interface models in maintenance
mode they remain in maintenance mode after the hibernation device model
resumes normal management communication.
Place Devices in Maintenance Mode
The device maintenance mode setting is in the General Information subview of
the Information view accessible in either the Contents panel or the Component
Detail panel.

Maintenance and Hibernation Mode
78 OneClick Console User Guide (5130)
To place a device into maintenance mode
1. Select the device in either the Navigation panel, a Topology view, or a List
view.
2. Click the Information tab in either the Contents or Component Detail
panel.
3. Expand the General Information subview.
4. Click set next to the In Maintenance setting and select Yes from the
drop-down list.
The device is now in maintenance mode, and its icon changes to brown.
Schedule Maintenance Mode
You can schedule when a device is in maintenance mode by applying a
maintenance schedule to the device. You can apply an existing schedule or
create a new maintenance mode schedule. See OneClick Schedules (see
page 72) for information about how OneClick and SPECTRUM apply schedules
across time zones in DSS environments.
To schedule maintenance mode for a device
1. Select the device for which you want to set up a maintenance mode
schedule.
2. Click the Information tab in either the Contents or Component Detail
panel.
3. Expand the General Information subview if necessary, locate In
Maintenance, and click Schedule.
The Add/Remove Schedules dialog opens. Any maintenance schedules
applied to the device appear in the Current Schedules column.
Note: You can also open the Add/Remove Schedules dialog by clicking
Tools, Utilities, Schedule Maintenance.
4. Do one of the following:
■ To apply an existing schedule to the device, select the schedule
from the Available Schedules column, and click the left arrow button to
move it to the Current Schedules column.
A device can have more than one schedule applied to it.
■ To remove an existing schedule from the device, select the
schedule from the Current Schedules column and click the right arrow
button to move it to the Available Schedules column.

Maintenance and Hibernation Mode
Chapter 5: Maintenance and Hibernation Mode for Devices 79
■ To create a new schedule, click Create; the Create Schedule dialog
opens. Configure a schedule by selecting a Start Date, a Start Time,
and either an End Time or Duration. Select the Recurrence factor.
Note: You can create a one-time maintenance mode window by
leaving the Recurrence set to None. Enter a Description that
adequately identifies the schedule you are creating.
5. Click OK.
The Create Schedule dialog closes and the new schedule appears in the
Available Schedules column in the Add/Remove Schedules dialog.
6. Click OK.
The maintenance mode scheduling changes are applied to the device.
Place Devices in Hibernation Mode
In the Component Detail panel for a modeled device, setting the In Hibernation
attribute to Yes places the device model into hibernation mode, suspending
management traffic to the device and its components until a predefined
number of successful communication attempts with the device succeed. After
the predefined number of communication attempts to the device succeed, the
device model automatically resumes normal management communication.
Change the Number of Communication Attempts
The default number of successful communication attempts is 3 with the polling
interval time (default 60 seconds) between each attempt. You can change the
default number of successful communication attempts using the SPECTRUM
Command Line Interface (CLI) or the OneClick Attribute Editor.
Either method requires changing the GlobalConfig mtype 0x00010470;
attribute HibernationCommSuccessTries 0x12acb that is initially set to the
default value of 3.
See Modeling Your IT Infrastructure Administrator Guide (5167) for a detailed
example of how to change this value using the Attribute Editor. For more
information about the SPECTRUM CLI, see the Command Line Interface User
Guide (0664).
Maintenance and Hibernation Mode
80 OneClick Console User Guide (5130)
Hibernate After Maintenance
You can specify whether a device should be placed in hibernation after it
comes out of a scheduled maintenance.
To automatically place devices in hibernation after scheduled
maintenance
1. Select the device you want to put into hibernation after maintenance.
2. Set up the maintenance mode schedule for the device as described in
Maintenance Mode Schedules (see page 78).
3. Click the Information tab in either the Contents or Component Detail panel
and expand the General Information subview if necessary.
4. Locate the Hibernate After Maintenance setting, click the set hyperlink, and
select Yes from the drop-down list.
The device will now automatically hibernate after a scheduled maintenance
completes. In hibernation, the device is polled 3 times and, if successful,
the device comes out of maintenance.
Place Interface Models in Maintenance or Hibernation Mode
In the Component Detail panel of a device interface, setting the In
Maintenance or In Hibernation setting to YES places the interface model into
maintenance mode or hibernation mode, suspending management of the
interface while still performing regular management on the rest of the device.
When in maintenance or hibernation mode the following conditions are true for
the interface model:
■ Brown alarms are shown for interfaces in hibernation mode.
■ Alarms will not be created for the port.
■ Events are logged for the port.
■ No polling, logging, or other device communication is performed on behalf
of the port model until the interface resumes normal management.
■ Link down traps sent are ignored and no alarms are generated.
■ If the Live Pipes option is enabled for a connection and one of its end
points is in hibernation mode, the color of the pipe in the topology view
turns brown. Status polling for that port is discontinued.
If a connection is modeled with a WA_Link model connection to two ports, and
one of those ports is in hibernation mode (or maintenance mode), an alarm is
created on the WA_Link and WA_Segment models. The WA_Link icon in the
OneClick topology views turns brown. If Live Pipes are enabled on this link, the
pipe remains green as long one port is up. If the second port goes down or
becomes unreachable, the pipe condition color turns gray.

Recognize Model Devices in Maintenance or Hibernation Mode
Chapter 5: Maintenance and Hibernation Mode for Devices 81
If SPECTRUM loses contact with a device model connected to the port in
hibernation mode (or maintenance mode), the ‗Device Has Stopped
Responding to Polls‘ alarm will be suppressed for that device and all adjacent
devices. If device_contact_lost alarms are suppressed because of their position
relative to a port in hibernation (or maintenance) mode, the hibernation (or
maintenance) mode alarm reflects these lost devices in its Impact and Severity
attributes. These lost devices are viewable in the Impact tab of the Alarm
Details panel for that maintenance alarm.
Recognize Model Devices in Maintenance or Hibernation
Mode
By default, placing a device model into maintenance or hibernation mode also
places its interface models and application models into maintenance or
hibernation mode. After placing a modeled device in maintenance or
hibernation mode, its topology icon displays a brown condition color. Brown
alarms are shown for all device models in maintenance or hibernation mode
but they are not shown on the application and interface models that have
inherited the maintenance or hibernation mode from the device model.
Show Brown Alarms for Interfaces and Applications
You can display brown alarms for interfaces and applications that have
inherited maintenance or hibernation mode from the device model by using the
SPECTRUM Command Line Interface (CLI).
To generate brown alarms on interface models that have inherited
maintenance mode, set the device model attribute 0x00012a7a
(rollDownAlarmToIF) to TRUE.
To generate brown alarms on application models that have inherited
maintenance mode, set the device model attribute 0x00012a7b
(rollDownAlarmToApp) to TRUE.
For more information about using the CLI, see the Command Line Interface
User Guide (0664).

Suppress Events and Alarms for Devices in Maintenance or Hibernation
82 OneClick Console User Guide (5130)
Suppress Events and Alarms for Devices in Maintenance or
Hibernation
When a model is in maintenance or hibernation mode, no events are processed
for that model. That includes events that would normally clear an alarm on the
model, as well as events that would create an alarm. For example:
If a link_down event generated an alarm on a device model prior to the model
being placed in maintenance mode and a link_up event occurred while the
device model is in maintenance mode, the SpectroSERVER will not clear the
alarm since the link_up event would not be processed.
In this example, the SpectroSERVER would not resume normal management
traffic to the maintenance modeled device until you manually disable the
maintenance mode option for this device in the Component Detail panel.
If, in this example, the modeled device was placed in hibernation mode instead
of maintenance mode, the SpectroSERVER would have to make a set of
successful communication attempts to the device before it could resume
normal management traffic with the device.
More information:
Place Devices in Maintenance Mode (see page 77)
Place Devices in Hibernation Mode (see page 79)
Secondary Alarms and Devices in Maintenance Mode
You can configure SPECTRUM to show or hide secondary alarms when a device
is in maintenance mode by using the parameter ‗Show Secondary Alarms
When Device is in Maintenance‘ in the Set Preferences dialog. If this parameter
is enabled, secondary alarms are shown when a device is in maintenance
mode. If the show secondary alarm option is disabled (the default), secondary
alarms are hidden when a device is in maintenance mode and are shown later
when the device is taken out of maintenance mode. Note that the ‗Show
secondary when in maintenance‘ setting only applies when the primary and
secondary alarms are enabled in the Alarm Filter settings in the Set
Preferences dialog.
Note: You cannot show or hide secondary alarms for devices in hibernation
mode.

Chapter 6: Exporting Data and Images from OneClick 83
Chapter 6: Exporting Data and Images
from OneClick
This section contains the following topics:
Export Table Data (see page 83)
Copy and Paste Table Data (see page 85)
Export Topology Views as Image Files (see page 85)
Export Table Data
Using the Export button, you can export table data from OneClick to a file from
the Alarms tab, the List tab, and other tabs. The Export button opens the
‗Export table data to file‘ dialog where you can identify the following:
■ Location to save the exported data file
■ Name for the exported data file
■ Type of file to use to export the data
■ Type of file format to save the file
To export OneClick table data
1. Navigate to a table that contains the Export button (Export) in the
toolbar.
2. Click (Export).
The ‗Export table data to file‘ dialog opens.
3. Complete the following information:
Save in
Specifies the location to save the exported data file.
Save as type
Specifies the file type you want to use when saving the exported data.

Export Table Data
84 OneClick Console User Guide (5130)
File name
Defines the name for the exported data file.
Files of type
Specifies the type of file format to use. The supported file formats for
export are comma separated values (CSV), tab-delimited text, and
HTML.
4. Select a location to save the file and click Save.
The file appears in the directory you have chosen and can then be opened
by an appropriate application.
Fix Exported CSV Files Containing Board.Port Data
When you export a table that includes Board.Port data to CSV and open it in
Microsoft Excel, any trailing zeros are truncated. For example, if the Board.Port
value is 2.10, it appears as 2.1 in the spreadsheet. These trailing zeros are not
truncated if you export to TXT or HTML. However, if you still want to export to
CSV, you can complete the following procedure to help ensure that any trailing
zeros are not truncated.
To fix an exported CSV file in which trailing zeros have been truncated
1. Rename your CSV file from [set the File Name variable].csv to [set the File
Name variable].txt.
2. Select File, Open in Microsoft Excel.
3. Select ‗Text Files‘ from the Files of Type drop-down list.
4. Select your file and click Open.
The Text Import Wizard dialog opens.
5. Select Delimited and click Next.
6. Select Comma and click Next.
7. Select the column that contains the data with the trailing zeros that you
want to fix.
8. Select Text from the Column Data Format section.
9. Click Finish.
Microsoft Excel opens the file and the trailing zeros are preserved.

Copy and Paste Table Data
Chapter 6: Exporting Data and Images from OneClick 85
Copy and Paste Table Data
You can copy and paste OneClick table data to an external application. In the
following procedure, the Alarms table is used as an example, but you can use
this procedure in other OneClick tables as well.
To copy and paste table data
1. Select the alarms you want to export in the Alarms tab of the Contents
panel.
To select all alarms in the Alarms list, click any alarm and press CTRL+A.
2. Press CTRL+C to copy the selected alarms as tab-delimited text.
3. In the desired spreadsheet application or text editor, press CTRL+V to
paste the tab-delimited text.
The data from the Alarms table now appears in the spreadsheet application
or text editor you selected.
Export Topology Views as Image Files
Certain OneClick views such as the Topology view, the Neighbors Topology
view, and the Link Information view can be exported as images directly to a
Portable Network Graphics (PNG) file from their respective tabs.
Note: The image will be saved according to the current zoom level in the view.
To export a OneClick Topology view
1. Select the desired Topology or container in the Navigation panel.
2. Click the Topology tab.
3. Click (Export).
The Save As dialog opens.
4. Select a location to save the file, enter a file name, and click Save.
The file is saved as [set the File Name variable].png in the directory you
chose.
Important! The default setting for a minimum image size to export is
640x480 pixels. You can create a large image when exporting the Topology
view (4000x4000 pixels or larger). This will cause an out-of-memory error to
occur in OneClick. If this happens, you can reduce the size of the image you
are exporting by zooming out in the Topology view. Alternatively, you can ask
your OneClick administrator to increase your client memory settings.


Appendix A: Keyboard Shortcuts 87
Appendix A: Keyboard Shortcuts
The following keyboard shortcuts are available in the OneClick Console.
CTRL + P
Opens the Print dialog from which you can specify what you want to print
and which printer you want to use.
CTRL + G
Sends an ICMP Ping to the selected device, from the SpectroSERVER
modeling the device.
CTRL+T
Establishes a communication session with the selected device using Telnet,
from the SpectroSERVER modeling the device.
CTRL+H
Establishes an encrypted communication session with the selected device
using Secure Shell (SSH), from the SpectroSERVER modeling the device.
CTRL+L
Polls the device from the SpectroSERVER modeling the device.
CTRL+W
Web administration. Launches a browser using the IP address of the
selected device. Available only for models that have the WebAdminURL
attribute.
ALT+LEFT ARROW
Goes back to a previous container or device.
ALT+RIGHT ARROW
Goes forward to a container or device after navigating back.
ALT+V, S
Shows or hides the Status bar.
ALT+V, N
Shows or hides the Navigation panel.
ALT+V, C
Shows or hides the Contents panel.

Export Topology Views as Image Files
88 OneClick Console User Guide (5130)
ALT+V, D
Shows or hides the Component Detail panel.
ALT+H
Opens the Help menu from which you can access CA SPECTRUM support,
SPECTRUM training information, and SPECTRUM documentation.
Index 89
Index
A
alarms
advanced filtering • 54
creating and saving filters • 53
displaying initial and suppressed • 37
filtering • 53
preferences • 36
sending by email • 40, 41
severity colors • 27
tab • 25
toolbar • 32
viewing • 27
Annotation Font • 43
C
clone panels • 46
columns
customizing • 44
resizing • 44
sorting • 44
communication attempts, modify • 79
Component Detail panel • 25
connection status
checking • 72
dialog • 71
indicator • 71
Contents panel • 24
D
Default Table Font • 42
dock panels • 45
E
alarms to troubleshooters • 58
creating templates • 40
events • 59
events
display date and time range • 59
display ports and applications • 60
excluding and including by type • 60
filtering • 59
Expansion Limit • 41
Explorer tab
defined • 23
preferences • 41
F
Favorites folder • 46
filtering
advanced filtering • 54
Filter field • 45
lists in OneClick • 45
G
Global Collections • 46
Grid Properties • 43
H
hibernation mode
configuring for devices • 79
configuring for interface models • 80
highlight device and containers • 70
I
Initial Zoom • 43
interfaces • 63
Performance view • 68
Thresholds subview • 66
J
Java 2 Runtime Environment
installing (Linux) • 13
installing (Solaris) • 12
installing (Windows) • 14
K
KDE • 11
L
landscapes, selecting • 44
Linux operating • 11
lists
copy and paste • 85
customize columns in • 44
export • 83
filter • 45
Locale • 42
90 OneClick Console User Guide (5130)
Locater tab • 24
login credentials, saving • 12, 13, 14
Look and Feel • 42
M
maintenance mode
configuring for devices • 77
configuring for interface models • 81
recognizing • 81
Make Changes Permanent check box • 35
messages • 72
N
Navigation panel • 23
New Message Sound • 42
O
operating system requirements
Linux • 11
Solaris • 11
Windows • 11
P
panels
clone • 46
Contents • 24
Navigation • 23
undock • 45
password, changing • 47
R
Red Hat Enterprise Linux • 11
S
schedules
in DSS • 75
items for maintenance • 74
maintenance mode • 78
recurring • 76
Scrollbar Increment • 42
searches, performing • 50
setting • 35
Show Pipe Labels • 43
Show Secondary Alarms When Device is in
Maintenance • 82
Solaris client requirements • 11
SPECTRUM_BROWSER variable • 48
status bar • 34
subinterfaces • 66
T
Time Format • 42
Time Zone • 42
Tool Tip Delay • 42
toolbars • 30
alarms • 32
hiding and showing • 30
main • 31
neighbors • 34
topology • 33
topology
export as image file • 85
highlight devices in • 70
preferences • 43
spotlighting model relationships in • 69
tab • 28
troubleshooters
assign and unassign • 57
creating • 56
U
undock panels • 45
URLs, inserting in OneClick • 48
W
Windows client requirements • 11