On the formation of adiabatic shear bands in textured HCP ... · On the formation of adiabatic...
21
On the formation of adiabatic shear bands in textured HCP polycrystals Zhen Zhang a, * , Daniel E. Eakins b , Fionn P.E. Dunne a a Department of Materials, Royal School of Mines, Imperial College London, SW7 2AZ London, United Kingdom b Institute of Shock Physics, Imperial College London, SW7 2AZ London, United Kingdom article info Article history: Received 26 August 2015 Received in revised form 7 November 2015 Available online 17 December 2015 Keywords: A. Microstructures A. Thermomechanical processes A. Plastic collapse B. Rate-dependent material B. Crystal plasticity abstract Adiabatic shear band (ASB) formation in textured HCP polycrystals has been investigated under regimes of high rate compression and shear loading using dynamic thermo- mechanically coupled, dislocation-based crystal plasticity modelling. The balance be- tween rate of plastic dissipation leading to internal heat generation versus rate of thermal diffusion at a crystallographic length scale has been shown to be pivotal for the formation or otherwise of ASBs. Micro-texture has been found to have a key role in both advancing and inhibiting shear band growth, and its control offers the possibility of new alloys with higher impact strength over strain rate range1 10 2 to 1 10 5 s 1 . Texture has been found to lead to wide variations in applied macroscopic strain at which ASB formation occurs, such that strain level in isolation is inappropriate as a universal indicator of ASB onset. High-rate shear loading is found to lead to lower onset strains for ASBs compared to high rate compression, but the dependence of both on texture leads to considerable variation in strain level for ASB formation. A preliminary map demarcating ASB onset has been established over regimes of applied strain and texture for dynamic shear and compression. © 2015 The Authors. Published by Elsevier Ltd. This is an open access article under the CC BY license (http://creativecommons.org/licenses/by/4.0/). 1. Introduction Adiabatic shear band (ASB) formation remains an important phenomenon in a range of technological and industrial application areas, including that of foreign object damage in aero-engines. It is a highly complex process involving dynamic deformation, high-rate plasticity, internal heat generation, thermal transients with big local temperature excursions, and very localised slip. An area of research which has received limited attention in this context is microstructure and texture. Hence, the primary aim of this paper is to address the role of crystallographic texture, and local micro-texture, on ASB formation, with the objective of establishing whether good or bad textures, or carefully contrived micro-textures, could be utilised to control, and therefore inhibit, ASB formation. Localized heating during plastic deformation was first observed by Tresca (1878) in his forging experiment on iron, and Basinski (1957) found that the resulting localized temperature rise could cause measurable discontinuities in the corre- sponding stressestrain curve. In fact, the temperature rise can be sufficient to heat the material so as to produce unstable, highly localised conditions of plastic flow. More often than not, the localisation phenomenon is associated with dynamic high * Corresponding author. E-mail address: [email protected] (Z. Zhang). Contents lists available at ScienceDirect International Journal of Plasticity journal homepage: www.elsevier.com/locate/ijplas http://dx.doi.org/10.1016/j.ijplas.2015.12.004 0749-6419/© 2015 The Authors. Published by Elsevier Ltd. This is an open access article under the CC BY license (http://creativecommons.org/licenses/by/ 4.0/). International Journal of Plasticity 79 (2016) 196e216
Transcript of On the formation of adiabatic shear bands in textured HCP ... · On the formation of adiabatic...

International Journal of Plasticity 79 (2016) 196e216
Contents lists available at ScienceDirect
International Journal of Plasticity
journal homepage: www.elsevier .com/locate/ i jp las
On the formation of adiabatic shear bands in textured HCPpolycrystals
Zhen Zhang a, *, Daniel E. Eakins b, Fionn P.E. Dunne a
a Department of Materials, Royal School of Mines, Imperial College London, SW7 2AZ London, United Kingdomb Institute of Shock Physics, Imperial College London, SW7 2AZ London, United Kingdom
a r t i c l e i n f o
Article history:Received 26 August 2015Received in revised form 7 November 2015Available online 17 December 2015
Keywords:A. MicrostructuresA. Thermomechanical processesA. Plastic collapseB. Rate-dependent materialB. Crystal plasticity
* Corresponding author.E-mail address: [email protected] (Z. Z
http://dx.doi.org/10.1016/j.ijplas.2015.12.0040749-6419/© 2015 The Authors. Published by Elsevi4.0/).
a b s t r a c t
Adiabatic shear band (ASB) formation in textured HCP polycrystals has been investigatedunder regimes of high rate compression and shear loading using dynamic thermo-mechanically coupled, dislocation-based crystal plasticity modelling. The balance be-tween rate of plastic dissipation leading to internal heat generation versus rate of thermaldiffusion at a crystallographic length scale has been shown to be pivotal for the formationor otherwise of ASBs. Micro-texture has been found to have a key role in both advancingand inhibiting shear band growth, and its control offers the possibility of new alloys withhigher impact strength over strain rate range1 � 10�2 to 1 � 105 s�1. Texture has beenfound to lead to wide variations in applied macroscopic strain at which ASB formationoccurs, such that strain level in isolation is inappropriate as a universal indicator of ASBonset.High-rate shear loading is found to lead to lower onset strains for ASBs compared to highrate compression, but the dependence of both on texture leads to considerable variation instrain level for ASB formation. A preliminary map demarcating ASB onset has beenestablished over regimes of applied strain and texture for dynamic shear and compression.© 2015 The Authors. Published by Elsevier Ltd. This is an open access article under the CC
BY license (http://creativecommons.org/licenses/by/4.0/).
1. Introduction
Adiabatic shear band (ASB) formation remains an important phenomenon in a range of technological and industrialapplication areas, including that of foreign object damage in aero-engines. It is a highly complex process involving dynamicdeformation, high-rate plasticity, internal heat generation, thermal transients with big local temperature excursions, and verylocalised slip. An area of research which has received limited attention in this context is microstructure and texture. Hence,the primary aim of this paper is to address the role of crystallographic texture, and local micro-texture, on ASB formation,with the objective of establishing whether good or bad textures, or carefully contrived micro-textures, could be utilised tocontrol, and therefore inhibit, ASB formation.
Localized heating during plastic deformation was first observed by Tresca (1878) in his forging experiment on iron, andBasinski (1957) found that the resulting localized temperature rise could cause measurable discontinuities in the corre-sponding stressestrain curve. In fact, the temperature rise can be sufficient to heat the material so as to produce unstable,highly localised conditions of plastic flow. More often than not, the localisation phenomenon is associated with dynamic high
hang).
er Ltd. This is an open access article under the CC BY license (http://creativecommons.org/licenses/by/

Z. Zhang et al. / International Journal of Plasticity 79 (2016) 196e216 197
strain-rate loading, such as that encountered during impact, and shear bands are found to develop and propagate quicklythrough the material and are often followed immediately by fracture. The short loading duration acts to inhibit the local heatconduction, which in turn is argued to be a contributory factor in ASB formation by virtue of highly localised temperatureincreases, enhancing local softening, potentially followed by void growth and failure (Wright, 2002), in particular for ma-terials with low coefficient of thermal conductivity, low specific heat, and high density (Antolovich and Armstrong, 2014). It isthus reasonably difficult to find ASBs in copper where the material's high thermal conductivity is sufficient to conduct heataway from localisation regions.
The concentration of plastic work within discrete bands results in far more extreme load conditions then throughout thebulk. Local plastic strains in the bands can be as high as 10e102, with associated strain rates of 105e107 s�1 (Guduru et al.,2001a). In the ASB region formed by impacting the Tie6Ale4V alloy (Liao and Duffy, 1998), the local strain rate has beenreported to be around 8� 104 s�1 under a nominal/global strain rate of 103 s�1. The local strain could be surprisingly high fromabout 0.75 to 3.50. The local strain rate is above 1 �104 s�1 in the ASBs associated with metal machining when the nominalstrain rate is about 103 s�1 (Childs, 2014). In Split Hopkinson Pressure Bar (SHPB) experiments, typical loading strain rates are104 s�1. Strain rates from 104 s�1 to 108 s�1 are achievable by Taylor impact/plate impact, where uniaxial stress states are notpossible to obtain (Field et al., 2004; Ramesh, 2008).
For Tie6Ale4V, the shear bands range from 10 to 50 mm inwidth (Coghe et al., 2006; Liao and Duffy,1998; Meyers and Pak,1986), which is argued to be determined by the thermal diffusivity (Merzer, 1982), and the characteristic length scale is of theorder of
ffiffiffiffiffiat
pwhere a is the thermal diffusivity of thematerial, and t is the loading duration (Chichili et al., 2004; Childs, 2014).
The ASB bandwidth is found to increase nonlinearly with shear strains, for example 10 mm,15 mm, and 18 mm for 2.5, 3.5, and 8global strain, respectively, leading to band width saturation at 20 mm (Meyers et al., 1994).
ASB temperature distributions are known to be highly transient, with short range spatial periodicity in the direction oftheir growth (Guduru et al., 2001a). The temperature has been measured by Ranc et al. (2008) separately for initiation andpropagation of ASBs in Tie6Ale4V during dynamic torsion testing.With a global strain rate from 1000 s�1 to 2000 s�1, the lowtemperature range for ASB initiation is found to be from 50 �C to 300 �C and the high temperature range for ASB propagationfrom 800 �C to 1700 �C. Temperature heterogeneity, i.e. highly non-uniform with discrete regions of high temperature, isobserved along the formation length of ASBs. This has also been found by Guduru et al. (2001b) based on high-speed infraredcamera measurement.
It has been noted by Ranc et al. (2008) that the difficulty of accurately capturing the ASB formation lay in achievingsimultaneously high resolutions in time, space and temperature measurement. For instance, it is difficult to simultaneouslymaintain a temporal resolution of about 1 ms and spatial resolution of 43 mm for low temperature ranges and 10 ms and 2 mmrespectively for the high temperature range. Continuous and high-speed temperature measurement from 50 �C to 1670 �C(melting point of Tie6Ale4V) remains very difficult for a single pyrometer. This has hindered a better understanding of theonset mechanisms in shear localization and formation of ASBs.
The mechanisms of ASB formation remains controversial (Medyanik et al., 2007; Peirs et al., 2013; Rittel, 2009). Con-ventional criteria for the initiation of ASBs are to define a critical shear strain (Zhou et al., 1996a). Nevertheless, for a givenshear stress, the critical strain decreases with increasing strain rate (Lindholm, 1974) and this is attributed to the increase instrength at high strain rates (Meyers, 1994). Weak strain-rate sensitivity characterised by small rate hardening exponentreduces the strain necessary for the onset of shear bands (Clifton et al., 1984). On the other hand, shear localization can bedelayed by the effects of strain hardening (Clifton et al., 1984). Nonetheless, ASBs are commonly considered as an instabilityresulting from thermal softening effects (Bai and Dodd, 2012; Wright, 2002). In order to understand the emergence of anadiabatic shear band, Zener and Hollomon (1944) proposed to consider the competing influence of strain-rate hardening andthermal softening effects, the latter generating conditions where the material can no longer harden, thus losing its stabilityand allowing the formation of a localized failure mode.
Internal heat generation is recognized to be important for nucleation of adiabatic shear banding, and has been consideredin the classical JohnsoneCook model (Chen and Ghosh, 2012; Dolinski et al., 2010; Khan et al., 2004), the KockseMeckingmodel (Chichili et al., 1998; Follansbee and Gray, 1989), continuum viscoplasticity models (Rosakis et al., 2000; Zhou et al.,1996a, 1996), and crystal plasticity models (Austin and McDowell, 2011; Clayton, 2005; Lloyd et al., 2014a, 2014b). Most ofthese investigations are concerned with the macroscopic stress, strain and strain rate. Among these numerical methods, thecrystal plasticity models provide promise in linking the macroscopic mechanical behaviours with their microstructural or-igins. The microstructural mechanisms are argued to be dominated by dislocations when the applied strain rate is less than104 s�1 (Austin and McDowell, 2011; Gilat and Clifton, 1985; Khan et al., 2004).
An important aspect of microstructure relevant to ASB formation but which has yet to receive significant attention is thatof the effect of crystallographic texture, together with that of grain size distribution. Researchers have argued that the storedenergy of cold work is significant (Rittel, 2009; Sun et al., 2014), potentially through its influence on local slip strength andlocalisation; coarse-grained microstructures lead to low stored energy and ultra-fine-grained microstructures give rise tohigh stored energy. The importance of initial crystal orientation/texture has also been noted in studies of wave propagationand dynamic response of single and polycrystal aluminium. Lloyd et al. (2014a) studied high rate single crystal response ofaluminium with a peak pressure below 30 GPa, and showed that initial crystal orientation played a significant role in bothwave propagation profile and microstructure evolution in FCC metals. They considered initial orientations of five hundredrandomly oriented crystals, and their results revealed that for below 5 GPa pressures, a slight orientation dependence wasfound since the response is governed by dislocation multiplication. The orientation dependency increased with increasing

Z. Zhang et al. / International Journal of Plasticity 79 (2016) 196e216198
pressure from 5 to 15 GPa for which the primary dislocation generation mechanism transitioned from dislocation multi-plication to heterogeneous nucleation. When the shock pressure increased from 15 to 25 GPa, the orientation dependenciesdecreased as the homogeneous dislocation nucleation dominates the plastic deformation mechanisms. Lloyd et al. (2014b)found that the initial material heterogeneity significantly affected the high strain rate dynamic responses in aluminium,with peak shock pressure up to 110 GPa. For HCP metals, Coghe et al. (2006) tested Tie6Ale4V SHPB cylindrical samples, andfound that the deformationmechanism transition zone is strongly influenced by texture. As demonstrated in their results, thedeformation is dominated by generalised slip at a strain rate less than 0.5 s�1, then a transition zone exists with combined ASBand general slip from a strain rate up to 10 s�1. At even higher strain rate, adiabatic shear banding was found to be the majordeformation mechanism observed. Peirce et al. (1982) in crystal modelling studies found that the pattern of shear bandingdepended on the initial geometric imperfection, but also on the size of the imperfection to a critical size below which thedependence ceased. Schoenfeld and Kad (2002) reported differing shear band patterns in highly oriented and randomtextured Tie6Ale4V under simple shear. Mayeur and McDowell (2007) noted that transverse and basal/transverse texturedTie6Ale4V polycrystals displayed markedly different stressestrain behaviour when loaded in the texture TD direction.Kuroda and Tvergaard (2007) studied the effects of the typical five texture components on shear band development inves-tigated for plane strain tension/compression and bending problems, using crystal plasticity simulations on rolled aluminiumalloy sheets. Cube texturewas found to be very advantageous for preventing shear band development. Clayton (2009) showedthat specific aspects of microstructure were important in shear localization, including random and rolled cubic textures aswell as stored elastic energy and residual volume changes associated with lattice defects, impurities, and inclusions such assecond phases in the metal-matrix.
The aim of the present work is to study the role of initial texture on the dynamic response and adiabatic shear banding inHCP polycrystals, employing Tie6Al as a model alloy. The methodology is to utilise dislocation-based crystal plasticityenhanced to incorporate internal heat generation, fully thermo-mechanically coupled within a dynamic finite elementformulation. The study addresses textured polycrystals subjected to loading from the quasi-static rate up to high ratesassociated with impact, with the objective of quantifying the rate-dependence of the onset of ASB formation, by determiningthe strain at which initiation occurs for a given strain rate. The study is carried out over a range of textures also, such that itbegins to become possible to establish deformations maps over texture, loading rate and level of deformation for which ASBformation occurs. This remains a key technological challenge in a range of safety-critical applications, and the establishmentof such maps may facilitate the optimisation of materials and textures for some high-demand applications particularlyrelevant to aerospace applications.
In the following sections, the thermo-mechanically coupled energy formulation is presented, followed by the dislocation-based crystal plasticitymodel with internal heat generation. Model representation of HCP polycrystals under dynamic loadingis then described, together with the incorporation of polycrystal texture. There then follows the presentation of a systematicstudy of load-up rate, pulse duration, and texture in HCP polycrystals, and in particular, an examination of the onset of ASBformation, and its dependence on strain level, loading rate, and texture. We include an assessment of the role of local micro-texture in inhibiting or otherwise shear band formation, and present a summary of high-rate deformation maps relevant toASB development.
2. Thermo-mechanical crystal plasticity formulation with internal heat generation
We begin by assuming adiabatic conditions, wherein there is no transfer of heat between our polycrystal and its sur-roundings and there is no external heat source. The problem is thus represented by fully coupled thermo-mechanical dy-namic deformation with internal heat generation, and the governing equations are therefore prescribed by the principle ofvirtual work and adiabatic heat transfer.
The variation in virtual work givesZV
r€ududV þZV
tdEdV �ZV
fdudV ¼ 0 (1)
where V represents the volume of the body in the reference configuration, r is the initial mass density, t the second PiolaKirchhoff stress, E the Green-Lagrangian strain, f is the volume density body force, u the displacement and €u the acceleration.
The variational form of adiabatic heat transfer but with internal heat generation through plastic dissipation is given byZV
rcP _QdQdV �ZV
kVQVdQdV �ZV
bseff _pdQdV ¼ 0 (2)
where cP is the specific heat, Q the temperature, and k the heat conductivity. The quantity seff ¼ffiffiffiffiffiffiffiffiffiffiffiffiffiffiffiffi32s
0 : s0q
is the von Miseseffective stress where the stress deviator is given bys0 ¼ s� 1
3 trðsÞI. The effective plastic strain is given in terms of the plasticdeformation gradient by _p ¼
ffiffiffiffiffiffiffiffiffiffiffiffiffiffiffiffiffiffi23D
p : Dpq
where Dp ¼ sym(Lp) and where Lp is the plastic velocity gradient detailed in thefollowing section. The quantity b represents the fraction of plastic work converted to heat, often referred to as the Tay-loreQuinney coefficient (Taylor and Quinney, 1934). For simplicity we take a value of 0.9 in this study, but this is discussed

Z. Zhang et al. / International Journal of Plasticity 79 (2016) 196e216 199
further in a later section in relation to experimental methodologies under development for its determination. However, asshown by previous works on titanium alloys, this choice has been shown to lead to reasonable temperature rise measure-ments (Follansbee and Gray, 1989; Khan et al., 2004; Meyers et al., 1994).
The boundary integrals are ignored since all internal heat is assumed to be generated from the plastic dissipation withinthe volume, there are no external heat sources, and there is no heat dissipation to the outer environment through the surfacesof the considered volume. These assumptions are reasonable for modelling of ASB formation since relevant experimental datashow that the onset and development of ASBs is a transient and high-rate event occurring over a time scale of tens of mi-croseconds (Peirs et al., 2013; Ranc et al., 2008).
Therefore theweak form of coupled equilibrium given in Eqs. (1) and (2) with the assumptions statedmay be re-written as
r€u� divt� f ¼ 0 (3)
and
rcP _Q ¼ bseff _pþ divðkVQÞ (4)
Note that under strictly adiabatic conditions where localized heat transfer is inhibited, within the neighbourhood of amaterial point, Eq. (4) can be reduced such that
_Q ¼ bseff _prcP
(5)
Eq. (5) is indicative of the temperature evolution during adiabatic ASB formation, but in fact full thermo-mechanicalcoupling given by Eq. (4) is included. The thermoelastic coupling is neglected because of it is argued to be small withrespect to the internal heat generation resulting from plastic dissipation. However, the full representation may be found inWright (2002) or Clayton (2010), in which formulations applicable for general thermo-mechanical coupling effects are given.
2.1. Kinematics
The deformation gradient is decomposed into elastic, plastic and thermal parts, such that
F ¼ FeFpFQ (6)
where Fe denotes small elastic stretches and arbitrary rigid-body rotations. FQ represents the thermally-expanded unstressedconfiguration (Meissonnier et al., 2001). Fp evolves based on the flow rule as
_Fp ¼ LpFp (7)
where Lp is the plastic velocity gradient. In the crystal plasticity formulation, Lp comprises the summed resolved crystallo-graphic plastic slip rates _ga, such that
Lp ¼Xa
_gasa5na (8)
where sa and na are respectively the slip direction and slip plane normal on the a-th slip system with respect to updatedconfiguration due to grain orientation.
The dislocation-based slip rule employed is given by
_ga ¼ rmnb2 exp
��DHkQ
�sinh
"�ta � tac
�g0b2
kQffiffiffiffiffiro
p#
(9)
where rm is the density of mobile dislocations, n the frequency of attempts of dislocations to jump energy barriers corre-sponding to dislocation obstacles, b the Burger's vector magnitude, DH the activation energy for self-diffusion, and k theBoltzman constant. ta represents the resolved shear stress on slip system a, and tac is the slip strength or critical resolvedshear stress.Q is the temperature, and g0 a representative shear strain magnitude conjugate to the local resolved shear stress.The origin and details of the slip rule may be found in Dunne et al. (2007). The density of statistically stored dislocations, ro, isprescribed to evolve with local accumulated slip according to
_ro ¼ g0 _p (10)
where g0 is a hardening parameter ascribed to grain boundary interaction effects such that it is nonzero only in the case ofpolycrystals. This is to account for the hardening effect due to the grain boundaries in polycrystals.
Z. Zhang et al. / International Journal of Plasticity 79 (2016) 196e216200
The slip strength hardening is given by
tac ¼ tac0ðQÞ þ GðQÞb ffiffiffiffiffiro
p(11)
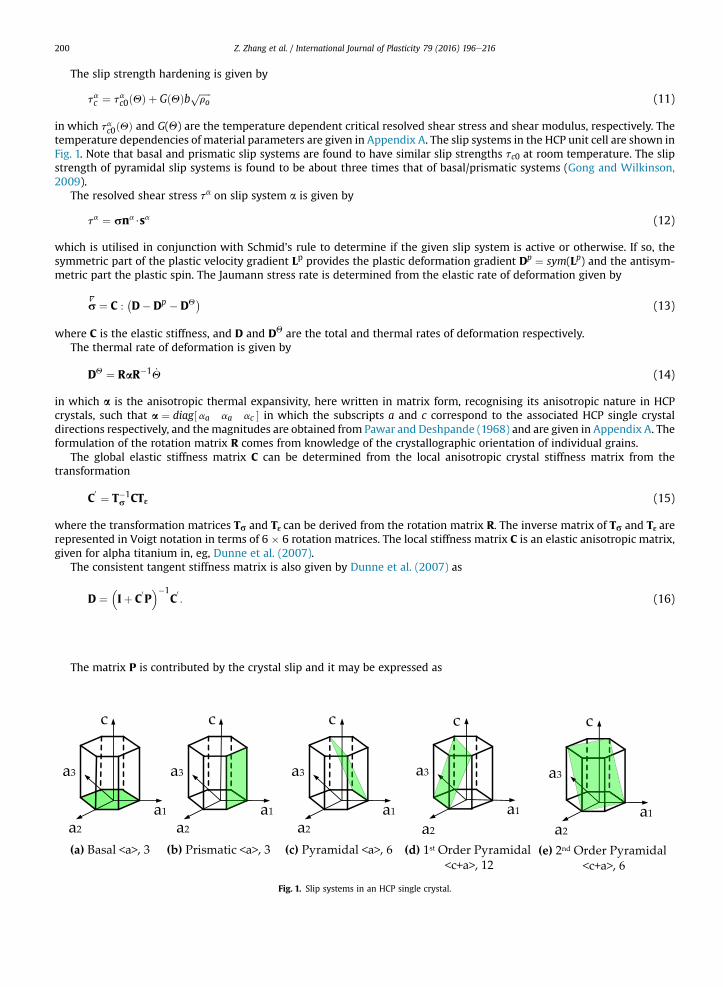
in which tac0ðQÞ and G(Q) are the temperature dependent critical resolved shear stress and shear modulus, respectively. Thetemperature dependencies of material parameters are given in Appendix A. The slip systems in the HCP unit cell are shown inFig. 1. Note that basal and prismatic slip systems are found to have similar slip strengths tc0 at room temperature. The slipstrength of pyramidal slip systems is found to be about three times that of basal/prismatic systems (Gong and Wilkinson,2009).
The resolved shear stress ta on slip system a is given by
ta ¼ sna$sa (12)
which is utilised in conjunction with Schmid's rule to determine if the given slip system is active or otherwise. If so, thesymmetric part of the plastic velocity gradient Lp provides the plastic deformation gradient Dp ¼ sym(Lp) and the antisym-metric part the plastic spin. The Jaumann stress rate is determined from the elastic rate of deformation given by
sV ¼ C :
�D� Dp � DQ
�(13)
where C is the elastic stiffness, and D and DQ are the total and thermal rates of deformation respectively.The thermal rate of deformation is given by
DQ ¼ RaR�1 _Q (14)
in which a is the anisotropic thermal expansivity, here written in matrix form, recognising its anisotropic nature in HCPcrystals, such that a ¼ diag½aa aa ac � in which the subscripts a and c correspond to the associated HCP single crystaldirections respectively, and themagnitudes are obtained from Pawar and Deshpande (1968) and are given in Appendix A. Theformulation of the rotation matrix R comes from knowledge of the crystallographic orientation of individual grains.
The global elastic stiffness matrix C can be determined from the local anisotropic crystal stiffness matrix from thetransformation
C0 ¼ T�1
s CTε (15)
where the transformation matrices Ts and Tε can be derived from the rotation matrix R. The inverse matrix of Ts and Tε arerepresented in Voigt notation in terms of 6 � 6 rotation matrices. The local stiffness matrix C is an elastic anisotropic matrix,given for alpha titanium in, eg, Dunne et al. (2007).
The consistent tangent stiffness matrix is also given by Dunne et al. (2007) as
D ¼�Iþ C
0P��1
C0: (16)
The matrix P is contributed by the crystal slip and it may be expressed as
Fig. 1. Slip systems in an HCP single crystal.

Z. Zhang et al. / International Journal of Plasticity 79 (2016) 196e216 201
P ¼Xa
hx coshx�ta � tac
�Aa5Aa (17)
where Aa is a 6� 1 vector determined by sa and na (Dunne et al., 2007). When ta < tac , there is no contribution from P, and theD matrix reduces to the elastic tangential modulus matrix C
0.
Based on Eq. (9), it is found that h and x in Eq. (17) are such that
h ¼ rmnb2 exp
��DHkQ
�(18a)
g0b2
x ¼kQffiffiffiffiffiro
p (18b)
The crystal plasticity model for this study is implemented into an ABAQUS VUMAT within a fully coupled 3D thermo-mechanical element formulation, thus facilitating the incorporation of internal heat generation from the local plastic dissi-pation and solution of the transient heat transfer problem, within an ABAQUS explicit dynamic finite element formulation.
3. Systematic study of rate, deformation and texture on ASB formation
In examining the formation of adiabatic shear bands in HCP polycrystals, we wish to differentiate the contributions, ifpossible, from wave propagation, strain accumulation, strain rate, and softening induced by internal heat generation, andimportantly, polycrystal texture. The polycrystal model boundary and loading conditions are described first.
Fig. 2. Model dimensions, finite element representation, and boundary conditions and applied dynamic loading.

Z. Zhang et al. / International Journal of Plasticity 79 (2016) 196e216202
3.1. Polycrystal model, boundary conditions and loading
Fig. 2 shows the schematic diagram of the model polycrystal with dimensions 200 � 200 � 20 mm chosen to investigateASB development in, and to be representative of both SHPB compression experiments and top-hat shear sample experiments(Meyers et al., 1994). Considering the dimensions of the polycrystal specimen selected and shown in Fig. 2(a), the loadingvelocity is chosen to range from quasi-static conditions, with a strain rate of 0.01 s�1, through to dynamic behaviour, with astrain rate of 1 �105 s�1 (eg. vpeak ¼ 20 m/s). This loading velocity range selected allows a full study of the deformation fromstatic to dynamic cases. The dynamic load is imposed with velocity boundary condition with a rise time of tr, as shown inFig. 2(a). The finite element model representation of the polycrystal is shown in Fig. 2(b). The model is meshed with 25,088ABAQUS C3D8RT three-dimensional, thermally-coupled continuum elements with a minimum of nine in-plane elementswithin a 10 mm by 10 mm region of area, compatible with that adopted in other studies (Clayton, 2005; Dolinski et al., 2010;Liao and Duffy, 1998). A simplification in the present study is to utilise grains with hexagonal morphology, and while fullythree-dimensional crystallographic orientations and crystal slip are facilitated, the grains considered are pseudo-3D in thesense of being prismatic through the polycrystal depth, as shown in Fig. 2(b). Both dynamic uniaxial compression and shearare considered as shown in Fig. 2(c) and (d), so as to study the relationship between loading type and ASB failure mode in therange of polycrystal textures considered. Periodic boundary conditions are imposed in order to be representative of apolycrystal morphology and texture.
3.2. Preliminary study of single and polycrystal response under dynamic loading
As a preliminary study, HCP single and polycrystal responses to uniaxial dynamic compression loading are considered first,and the velocity boundary conditions defining rise time and maximum applied velocity (20 ms�1) imposed are shown inFig. 3, together with the single crystal orientation, and polycrystal texture. The texture employed for the polycrystal isgenerated to give an in-plane random crystal orientation with the crystal c-axes close to parallel to the z axis for most grains.The quantitativemeasure of this texture is given by the Kearn's factors in Table 1. The results obtained showing both the onsetof shear band formation (for the strains of 4.6% and 4.5% for the single and polycrystal samples respectively) and at the pointof collapse (for strains of 8.5% and 7.2% respectively) are also given in Fig. 3. The onset of shear band formation is shown in
Fig. 3. Shear localization in HCP single crystal and polycrystalline specimens with vpeak ¼ 20 m/s; the snapshots are taken at (b) ε ¼ 4.6%; (c) ε ¼ 8.5%; (e)ε ¼ 4.5%; and (f) ε ¼ 7.2% respectively; ASB initiation sites are highlighted in (b) and (e).

Table 1Kearn's factors in six textures.
Textures Factor components
f1 e (x) f2 e (y) f3 e (z)
(a): RD split 0.34 0.13 0.52(b): TD split 0.13 0.39 0.48(c): (b)-rotated 0.39 0.48 0.13(d): Outspread 0.35 0.37 0.28(e): Wire (2D random) 0.26 0.26 0.48(f): 3D random 0.34 0.33 0.32
Z. Zhang et al. / International Journal of Plasticity 79 (2016) 196e216 203
Fig. 3(b) and (e), and the point of collapse in each in Fig. 3(c) and (f), respectively. For the single crystal, the onset of ASBformation occurs at the top right boundary of the specimen and the shear localization develops along prism slip planes until itreaches the other boundary of the specimen. During the initiation of the ASB in the single crystal specimen, wave propagationis the predominant nucleation source because of the heterogeneous deformation it generates since its wave length is smallcompared to the sample size.
In contrast, the nucleation of the ASB in the polycrystalline specimen initiates from the interior of the specimen (at thepoint of highest strain shown) as seen in Fig. 3(e). In fact, the initiation is found to occur at the boundary of a grain well-orientated for slip. The ASB then tends to develop in grains having similar orientation, therefore giving early slip, whichthen links to form the ASB. In both the single and polycrystal samples subjected to dynamic uniaxial loading, the overalldirection of the ASB reflects the macroscopically imposed direction of maximum shear stress. However, the role of localcrystal anisotropy is also reflected in that the width of the shear band is observed to be larger in the single crystal than that inthe polycrystal. This is why the local heat generation is significantly greater in the narrower shear band in the polycrystalresulting in the very differing temperatures achieved in each. For instance, at a macroscale strain of 7%, the maximum localtemperature in the polycrystal ASB is 533 �C compared to 413 �C in the single crystal ASB. In the polycrystal, several grains areoriented such that prism slip aligns with the macroscopically imposed maximum shear, favouring early slip nucleation andstronger localisation than that in the single crystal, for which the prism planes are inclined at 15� to the maximum shear, thusinhibiting slip relative to the polycrystal, and leading to awider slip band. A further consequence is that both initiation of ASBformation, and sample collapse are reached earlier in the straining history in the polycrystal compared to the single crystal.This signals the potentially significant role of texture in both advantaging and inhibiting ASB formation and development inpolycrystal deformation, and is addressed in detail later in the paper.
Fig. 4 shows the corresponding macro-level stress e strain responses for the two cases, where the differences in thecollapse strains may be seen. In addition, it is observed that the single crystal behaviour shows considerably more oscillationand for longer during loading than the polycrystal. Naturally, the polycrystal with random texture provides an order higherpotential for wave scatter thus giving a much more smooth, averaged, behaviour in the stress response compared with thesingle crystal. The figure also shows the average uniaxial stress is higher for the polycrystal than for the single crystal underthe same dynamic loading. This results from polycrystal grain orientations, several of which may be incompatible with easyslip (for example, cþ a slip strength is approximately three times that of a-type slip), thus increasing the effective yield stress.
Fig. 4. Macro-scale dynamic (vpeak ¼ 20 m/s) stressestrain response for single and polycrystal models under compression; “A” and “B” represent the ASB onsetpoints for polycrystal and single crystal models respectively; “C” and “D” are separately the failure points in the polycrystal and single crystal models.

Z. Zhang et al. / International Journal of Plasticity 79 (2016) 196e216204
3.3. Loading velocity (strain rate) effects in ASB formation
Many engineering alloys, particularly for high homologous (T/Tm) temperatures, show rate sensitivity effects, and acharacteristic of the near-alpha titanium alloys is that their rate sensitivity is high even at low homologous temperatures (egat 20 �C). In high rate loading of polycrystals, dynamic or inertia effects exist, leading to significant inhomogeneity of stressresulting, for example, from the propagation of stress waves. This generates a spatial distribution of strain rates, so that therate sensitivity of the material leads to an additional spatial variation of stress response to differing strain rate, whichpotentially impacts upon the overall polycrystal response. In addition, increasing strain rate leads to greater internal heatgeneration for a given strain occurring over progressively shorter times. A consequence is that the time available for thermalconduction decreases with increasing strain rate, thus potentially leading to much higher local temperatures, and the like-lihood of much more local softening and consequent severe strain localisation. To investigate the role of strain rate inpolycrystal ASB formation, a broad range of loading rate is applied (for given rise time) resulting in responses from quasi-static (vpeak ¼ 2 � 10�6 m/s) through to those giving rise to strong dynamic (ie wave or inertia-dependent) (vpeak ¼ 20 m/s) responses. The corresponding strain rates, given the polycrystal sample dimensions considered in this work, then vary from1 �10�2 to 1 �105 s�1. A rise time of 0.001 ms is considered for this study as it is known to introduce dynamic effects in thepresent specimen dimensions for the higher target velocities. The targeted total applied deformation in this study is acompressive strain of 10%.
Fig. 5 shows the spatial distribution of effective plastic strain resulting for the same polycrystal subjected to two extremesof applied velocity, namely that leading to quasi-static behaviour, and that resulting in a strongly dynamic response. It is seenfrom Fig. 5(a) for the quasi-static loading that some localisation of plasticity occurs, but that it remains rather diffuse relativeto the high-rate loading shown in Fig. 5(b) in which a strong ASB is seen to have formed. The quasi-static loading leads to theestablishment of two wide shear zones at 45� to the loading direction. Strong shear localization is not developed. The sig-nificant differences observed for the two loading rates result directly from the balance between the rate of thermal diffusionand the rate of plastic dissipation. For the high-rate loading, the dissipation rate is high relative to the rate of conduction, sothat temperatures are much higher, softening occurs and reinforces further slip development and internal heat generation.The consequence is the formation of an ASB. At the low loading rate, however, the dissipation rate is lower such that thermalconduction redistributes temperature gradients, thus inhibiting the strong softening and strain localisation, resulting in amuch more diffuse distribution of shear banding, and the absence of an ASB. It is informative to examine particularly theresulting temperature distribution along the ASB in the high-rate case, and along the corresponding more diffuse zone ofshear in the low-rate example. These temperature distributions along path AA0 , shown in Fig. 5(b), at an applied strain of 10%for the two loading rates are shown in Fig. 6.
Firstly, the much higher temperature achieved for the high-rate loading is noted, but so is the much more heterogeneousnature of its distribution, indicating a really strong influence from the polycrystal micro-texture, resulting from crystallo-graphic orientation changes from one grain to the next along path AA0 . The low-rate result is conspicuous in the absence ofstrong variation, indicating that provided sufficient time is available over the loading, thermal diffusion tends to equalise thetemperature distribution, but at the high rate, strong differences from grain to grain in internal heat generation exist(resulting from micro-texture variations), leading to highly localised flow in grains well-orientated for slip, pushing up localtemperatures and reinforcing localisation and progression of slip. This is evident in the resulting distribution of slip alongpath AA0 within the ASB shown in Fig. 5(b). This result provides further evidence that micro-texture, and potentially texture,are important in influencing ASB formation, and conversely, that careful control of texture may provide methodologies forcontrol of adiabatic shear banding. It also suggests that there may exist combinations of grain orientations, or contrived
Fig. 5. Compression of polycrystalline specimen up to 7% with (a) quasi-static loading and (b) dynamic loading with vpeak ¼ 20 m/s.

Fig. 6. Temperature profile along the shear band path AeA0 defined in Fig. 5(b).
Z. Zhang et al. / International Journal of Plasticity 79 (2016) 196e216 205
micro-textures, which provide stronger resistance to ASB formation. This possibility is addressed further in a later section ontexture effects.
3.4. Rise time, strain rate and inertial effects
It is expected that variation in loading rise time influences shear localization (Wright and Ockendon, 1996; Zener andHollomon, 1944). This has also been reported by many including Bonnet-Lebouvier and Klepaczko (2002). A shorter risetime leads to both higher strain rates, and stronger inertia (stress wave) effects, and reduces the time scales available forthermal diffusion; higher stress levels and stronger localisation are anticipated. It is therefore expected that the selection ofrise time for a fixed target loading velocity also influences material response, since it influences both the rate of change ofstrain rate, and the inertial (stress wave) behaviour.
In order to investigate this behaviour at the microstructural level within our crystal plasticity approach, we examinepolycrystal response with a fixed peak velocity of 20 m/s, a targeted applied deformation of 10% compressive strain, butconsider a range of rise times. The results are shown in Fig. 7, in which rise times of 1.0, 0.1 and 0.001 ms are imposed. Theresulting average, macro-level stress responses are shown in Fig. 7(a) for the three rise times. The result for the shortest risetime shows the strongest dynamic effects, but the average responses are not seen to vary significantly. However, Fig. 7(b)shows a marked change in the strain accumulation at a chosen ‘hotspot’ (identified in Fig. 5(b)) within the developing shearband. For a given loading time (or equivalently, applied strain), a decreasing rise time tends to increase the hotspot strainaccumulation, thus concentrating the strain localisation as reported elsewhere. The mechanistic basis for this is as discussedabove in Section 3.3 in which the rate of straining, thermal diffusion, and temperature increase enhancing softening,
Fig. 7. Rise time effect (vpeak ¼ 20 m/s) in: (a) macroscale stressestrain response; (b) Effective plastic strain history at typical hotspot within the shear band.

Z. Zhang et al. / International Journal of Plasticity 79 (2016) 196e216206
considered at the micro-texture, all couple to lead to ASB formation. As rise time increases, so the strain rate drops, inertialeffects diminish, temperature uniformity becomes greater, and the potential for ASB formation decreases, approaching theresponse anticipated under quasi-static conditions.
3.5. Thermal softening
While the consequences of thermal softening have been implicitly considered in the previous sections, because it is arguedto play such a profound role at themicro-texture length scale for ASB formation, the phenomenon is addressed separately andin more detail in this sub-section. To measure the temperature variation in the formation of adiabatic shear banding remainsan experimental challenge; its accurate measurement requires a spatial resolution of about 10 mm, and temporal resolution ofabout 10 ms. Within such fine resolutions in space and time, it is necessary to capture a potential temperature rise of order~1000 K. In the present work, we utilise the thermal crystal plasticity model in order to investigate internal heat generationfrom plastic dissipation, and the resulting temperature transients which arise in associationwith ASB formation. The texturedpolycrystal sample is subjected to the velocity loading and unloading history shown in Fig. 8; the unloading and subsequentload-free periods are included in order to track the thermal transients once the ASB has formed. A target velocity of 20 m/swith a rise time of 0.001 mm is considered which generates dynamic wave propagation and internal temperature rise. After0.7005 ms, the total deformation applied is 7%. The unloading velocity has the same rate, and once zero velocity has beenachieved, the thermal analysis continues for a further 7.0 ms.
As indicated in Fig. 8, four spatial temperature distributions at points A, B, C, and D in the loading history are extracted, andshown. It can be seen from the spatial distributions that the temperature remains less than 400 K at time point Awhich occursat an applied strain of 0.005%. Indeed, very little change in the uniform temperature of 293 K has yet taken place. The majorshear localization, at least as indicated by the temperature distribution, appears fully formed at point B and the main ASBaligns at about 60� with respect to the loading direction. In this polycrystal, the texture chosen is such that the predominant c-axis direction lies at ~30� to the loading direction such that the ASB is largely prism slip which localises because of thethermally-induced softening. During unloading between points B and C, it can be seen that significant conduction has takenplace to generate a muchmore uniform temperature distribution, and by point D after a further ~0.16 ms, the temperature haslargely returned to a uniform distribution of 293 K. The cooling ratewithin the shear band in this example is found to be about340 K/ms. Very high transient cooling of adiabatic shear bands has been reported by Peirs et al. (2010), though in their study,the authors didn't quantify the magnitude of the ASB cooling rate.
Interestingly, a heterogeneous temperature distribution is seen within the shear band. Four hotspots within the ASBdevelop at points labelled h1, h2, h3 and h4, as indicated in Fig. 8. The representative plastic strain rates at these points arecorrespondingly 0.88, 1.13, 1.1, and 0.84 ms�1, and are the greatest in the complete polycrystal domain. Clifton et al. (1984) alsofound that heat generation is greatest in the regions of highest strain rate. It has also been found experimentally that hotspotsmay occur at multiple locations within a shear band, and use of high speed infrared cameras (Guduru et al., 2001a, 2001b) andby pyrometry (Ranc et al., 2008) confirm this.
Fig. 9 shows the variation with time (loading history) of macro-level polycrystal stress and strain in the loading direction,together with the local hotspot h2 (identified in Fig. 8) temperature variation. All quantities are normalised as detailed in the
Fig. 8. Temperature variation during load and unload in the textured specimen. The snapshots of temperature distribution are taken at tA ¼ 0.00144 ms,tB ¼ 0.69 ms, tC ¼ 0.77 ms, and tD ¼ 0.926 ms corresponding to points A, B, C and D shown in the figure. Point D corresponds to the time at which the localtemperature has effectively diminished to 293 K.

Z. Zhang et al. / International Journal of Plasticity 79 (2016) 196e216 207
figure. Themodel specimen shows (stress) softeningwhen the local hotspot temperature reaches ~350 K at 0.62 ms. The globalload drop depends on the rival effects of thermal softening due to temperature rise, strain rate hardening by thermallyactivated dislocation and slip, and hardening associated with increased applied strain. From the velocity unloading to zero at0.7015 ms, the internal heat begins to disperse resulting in the progressive redistribution of temperature. The ASB cooling, andtemperature redistribution process is found to occur within ~0.23 ms, giving rise tomuch faster cooling than the heating underthis loading history.
3.6. Texture effects in ASB formation
Recent studies indicate that specimen dimensions and corner radii influence the initiation of ASBs, and the reproducibilityof the high strain rate impact performance of hat-shaped and Hopkinson bar samples is in fact found to be low (Peirs et al.,2010). This could be attributed to the above, but another potentially important factor is here argued to be the underlyingmetal texture, and micro-texture, both of which have already been shown to be of importance in influencing ASB formation.Hence, in this section, we consider in some detail the effects of representative HCP textures and their role in failure mode andonset of ASB formation under both uniaxial compression and simple shear dynamic loading. Fig. 10 shows the range oforientation distribution function representations of HCP textures considered in the study.
The texture (a), termed RD split, is often seen in HCP metals with c/a ratio larger than 1.633 such as for Zn and Zr(Tenckhoff, 2005). TD split in Texture (b) is often seen in processed Ti polycrystals for which the c/a ratio is smaller than 1.633.Texture (c) is simply Texture (b) rotated through �90� about both the z and x-axes, such that many crystal c-axes then lie inthe applied loading direction for dynamic compression. Texture (d) is close to, but not strictly, uniform random, since theminimum and maximum intensity values are 0.03 and 3.5. Texture (e) is generated to give an in-plane random crystalorientation with the crystal c-axes close to parallel to the z axis for most grains. Finally, Texture (f) represents uniform-random texture in three dimensions such that the minimum and maximum intensity values are close to unity.
For the six textures shown in Fig.10, textures (a), (b) and (d) are obtained frommaterial characterisationmethods (eg EBSDor XRD) while the remaining three are established numerically. As shown in Table 1, Kearns factors are calculated for thetextures shown in Fig.10. Kearns factors are commonly utilised in technological applications because of their simplicity, hencetheir consideration here, and further information is provided in Appendix B. The three factors for a given texture represent thefraction of HCP polycrystal basal poles that are orientated along the three orthogonal axes. The sum of the three factorstherefore gives a value of unity. It is reasonable to find that f3 is larger than the other two components in textures (a), (b) and(e) since most of the crystal basal poles (the c-axes) align closely to the z-axis. The rotation of Texture (b) into Texture (c)results in most basal poles being in-plane, leading to a reduced f3 in Texture (c) as compared to Textures (a) and (b). Due to theuniform random distributions of crystal orientations for in-plane and 3D textures (e) and (f) respectively, f1 and f2 are veryclose in Texture (e) while the three Kearns factors are almost identical in Texture (f).
With loading and boundary conditions introduced above and given in Fig. 2 for dynamic uniaxial compression and shear,respectively, the average, macro-level stress and strain behaviours for the six textures are given in Fig.11 for a loading velocityof 20 m/s with a rise time of 0.001 ms. The model specimens are loaded towards 10% straining in compression and sheardirections, respectively. It is seen from Fig. 11(a) that Textures (c), (d), and (e) lead to strain localisation and sample failure atabout 7% under uniaxial dynamic compression loading. However, in Fig. 11(b), Textures (b), (c), and (f) fail due to localisationat about 5.5% under dynamic shear loading.
Fig. 9. Macroscopic stress, strain and local hotspot h2 temperature history. Quantities shown are normalised by ε0 ¼ 7%, s0 ¼ 855 MPa and Q0 ¼ 350 K.

Fig. 10. Range of HCP polycrystal textures studied.
Z. Zhang et al. / International Journal of Plasticity 79 (2016) 196e216208
The localised plasticity and ASB formation are shown for uniaxial loading in Fig. 12 and for shear loading in Fig. 13respectively. Particularly, ASB formation for textures (c), (d) and (e) are apparent in Fig. 12(c), (d), and (e) for dynamiccompression to ~7% strain and has developed to the extent that overall softening occurs, leading to material failure. The othertextures ((a), (b) and (f)) under dynamic uniaxial loading also show ASB formation, but at a later strain of 10%, for whichsignificant overall (macro-scale) softening (and therefore failure) has not yet definitively taken place.
As shown in Fig. 12, model specimens with RD split and TD split textures ((a) and (b)) develop similar shear bandingtypically orientated at about 45� to the loading (y-) direction. The crystal c-axes are orientated to the global z-axis at about30�, separated in to either RD/x or TD/y axis orientations and prism slip directions lie at about 30� or 60� to the loadingdirection, indicating prismatic slip predominantly contributes to shear banding. The TD split texture (b) leads to the devel-opment of shear banding across the polycrystal sample, but this pattern appears to be inhibited by another weaker 60� shearband developing in the RD split (a) textured specimen. When rotating texture (b) and aligning its c-axes towards the loadingdirection as in texture (c), this increases the material strength in terms of flow stress (see Fig. 11). However, the shear bandingin Texture (c) is less diffuse in comparison with those in Fig. 12(a) and (b), reflecting the inhibition of a-type slip. The shear
Fig. 11. Macro-level stress versus strain response under (a) dynamic compression and (b) dynamic shear (v ¼ 20 m/s) for textures (a) to (f).

Fig. 12. Failure modes for six textures under dynamic compression (vpeak ¼ 20 m/s). The failure strains εyy at which the analyses terminate are: (a) 10%; (b) 10%;(c) 7.0%; (d) 7.4%; (e) 7.2% and (f) 10%. Experimental failure modes for dynamic compression are: (g) prismatic slip localisation in Tie6Ale4V by Peirs et al. (2013),and (h) loading along c-axis in Tie6Ale4V by Peirs et al. (2013) generating failure parallel to c þ a planes.
Z. Zhang et al. / International Journal of Plasticity 79 (2016) 196e216 209
band in this case is orientated at about 60�, although this has been blocked by an apparent band of strain localisation at about85�. Recall that texture (c) fails at a strain level of ~7% whereas neither texture (a) nor (b) has failed even at 10%, indicatingstronger localisation in texture (c). Fig. 12(g) shows independent experimental observations by Peirs et al. (2013) of similarASB orientation to that in Fig. 12(a) and (b) for similar texture. Fig. 12(h) also from experiments by Peirs et al. (2013) showsASB formation for a texture similar to that in (c), also showing good agreement in ASB orientation with respect to loading.Returning to Fig. 12(a) and (b), the distinctive “V” shaped strain banding visible is also observed in the Peirs et al. (2013)experiment, shown in Fig. 12(g).
In Fig. 12(d), (e) and (f) for near random, in-plane random and 3D random textures respectively, all give rise to strainlocalisation at about 45� to the loading direction, but it is notable that texture (f) shows considerably more diffuse strainingcompared to both (d) and (e), both of which result in ASB formation and failure at a strain of 7% compared to texture (f) whichhas not failed at a strain of 10%. Texture (d) shows an interesting apparent deviation in the course of the ASB formation, likelyrelating to local micro-texture features. We return to this in some detail in the next section where we examine the high-rateshear response to texture.
Fig. 13. ASB formation for six textures under dynamic shear (vpeak ¼ 20 m/s). The applied strains g at which failure occurs are: (a) 8%; (b) 5.5%; (c) 5.6%; (d) 10%;(e) 9.5% and (f) 5.3%.

Z. Zhang et al. / International Journal of Plasticity 79 (2016) 196e216210
Fig. 13 shows the numerical results obtained for simple shear loading, inwhich results for textures (b), (c) and (f) show theformation of ASBs and failure for low strain levels (about 5.5%), whereas for the other textures (a), (d) and (e), ASBs are alsodeveloped as shown in Fig. 13, but the strain levels for which this occurs are much higher (8, 10 and 9.5% respectively) as seenFig. 11(b). When dynamic shear loading in terms of velocity is applied at the top of the model specimen (shown in Fig. 2(d)),shear bands develop in all the considered textures parallel to the shear loading direction. This failure mode is seen inHopkinson bar tests on alpha-Ti (Meyers et al., 1994) and Tie6Ale4V (Peirs et al., 2010), and these independent experimentalresults are shown in Fig. 13(g) and (h) respectively. Note that shear loading as experienced in testing of top-hat specimens isoften associated with large, non-uniform compressive stress while the shear bands developed in the six textures in Fig. 13 areunder dynamic simple shear loading. However, the similar ASB formed in the numerical and experimental tests could indicatethat shear deformation governs the overall response in the local shear zone in the top-hat shear experiments. It is possible forseveral parallel shear bands to develop in the samples as demonstrated by the RD split (Fig. 13(a)) and TD split (Fig. 13(b))textures for which prismatic slip is favoured. As before, with more diffuse slip, when more shear bands develop, the totaldeformation is less focused on a single ASB and the corresponding failure strain is high. For example, Texture (d) leads tofailure but at a higher shear strain of 10% and the plastic strain is much more distributed than that in other textures. In thistexture, it is seen that the strongest shear band is blocked by one grain which is badly orientated for slip.
In order to investigate further the observed micro-texture effects, Path BeB0 in Fig. 14(a) has been introduced for Texture(d). The grain orientations along Path BeB0 are shown schematically in Fig.14(c) inwhich the particular grain badly orientatedfor slip with respect to shear loading is highlighted in red. This results in the low strain accumulation visible in this grain inFig. 14(a), apparently blocking the ASB formation. We investigate this further by pro-actively altering the orientation of thehard grain to make it well-orientated for slip, as indicated in red in Fig. 14(d), with a prismatic plane parallel to the sheardirection. The high-rate shear analysis is repeated and the new result obtained is shown in Fig. 14(b), for which a much moresignificant single shear band has developed compared to that in Fig. 14(a). In addition, the failure strain has been reducedfrom 10% to 7.2%. This demonstrates that micro-texture may be potentially contrived in order to inhibit or prevent the onset ofASB formation, thus delivering tailored alloys resistant to shear band failure in impact. Sun et al. (2014) have reported thatshear banding favours crystals well-orientated for prismatic <a> slip. The current work supports this assertion and goesfurther tomake clear that the inclusion of a single badly oriented grain (for slip) along the shear band path has the potential toincrease straining for which ASB occurs by significant margins.
The polycrystal macroscale stress strain behaviour for the original and modified orientation combinations is shown inFig. 14(e). Modifying the grain orientation to encourage continuity of slip is interestingly seen to increase the flow stress butclearly encourage localisation and early ASB failure. The increase in flow stress may be attributed to the strain rate sensitivityof Tie6Al alloy because of the considerably higher strain rates and strain localisation for polycrystal (b). The average tem-perature rise in this case is about 190 �C and the maximum local shear band temperature rise 427 �C, giving strong strain ratesensitivity.
3.6.1. High-rate strength dependence on textureIn passing, we examine the effect of texture on high-rate strengths, which are extracted from Fig. 11 for the dynamic
uniaxial compression and shear tests and are shown in Fig. 15 as a function of the Kearns factor associated with the relevantloading direction. That is, for dynamic compression, the y-direction Kearns factor (f2) is chosen, whereas for the dynamicshear loading, the x-direction (f1) factor is chosen. The strength is taken to be the average flow stress obtained after dynamicaloscillatory behaviour has diminished but before macro-scale softening commences. Hence, in the case of compression, thestrength is taken to be average flow stress over strain range from 0.025 to 0.056, and for shear, over the shear strain rangefrom 0.023 to 0.03. A small increase in strength is observed with increasing Kearns factor component since this reflects the
Fig. 14. Effective plastic strain fields (a) and (b) obtained for the ASB path crystal orientations (Path BeB0) shown in (c) and (d) respectively, and (e) the resultingmacro-level stress strain response showing the failure strains 10% and 7.2% for (a) and (b), respectively.

Fig. 15. High-rate strength with respect to Kearns factor for the range of textures shown in Fig. 16.
Z. Zhang et al. / International Journal of Plasticity 79 (2016) 196e216 211
increasing slip strength contribution associated with the higher fraction of crystal c-axes orientated with the loadingdirection.
3.6.2. Texture-dependence of ASB formationIn this final section, we aim to summarise the role of texture on the initiation and formation of ASBs, particularly with
respect to the strain level required for initiation. The latter measure, while not providing a definitive quantification of ASBformation, is at least important technologically and industrially, but there has been much research aimed at establishing anappropriate quantitative measure. We note that Hill (1962) presented a general theory of bifurcation of a homogeneouselasticeplastic flow field into a localized band. Asaro and Rice (1977) extended Hill's idea and showed that it was possible togenerate shear banding in weak work hardened materials rather than materials experiencing strain softening. The onset ofshear bandingwas found to be due to the deviation of the normality of the flow rule, which was caused by non-Schmid effectsat the onset of cross slip. Asaro and Rice (1977) addressed strain localization quantitatively through linking the micro-mechanical slip to macroscopic plastic consistency conditions. Their quantitative measure has been specified as a criticalplastic hardening rate at the inception of localization, through examples of initially-homogeneous rate insensitive singlecrystals. The specific form of this quantitative measure of localizationwas given for a constitutivemodel that allowed for non-Schmid effects in cross-slip. Based on a dislocation model of the process, the quantitative measure for ASB onset wasdeveloped. Antolovich and Armstrong (2014) also address quantitative onset of ASB formation. Consid�ere's criterion(Consid�ere, 1885), derived from the inflection point condition, is one of the well-known macroscopic onset measures ofnecking. This criterion has been extended for rate sensitive materials by consideration of a rate sensitivity index (Hart, 1967;Jia et al., 2001). Staker (1981) found experimentally that the onset of ASB in AISI 4340 steel could be represented by a trueshear strain based criteria. It is interesting to note that an upper bound based on conventional Consid�ere's criterion and alower bound by Staker's equation (Antolovich and Armstrong, 2014) may be established. The data scatter between the upperand lower bounds was attributed to sources of geometric instability andmicrostructural texture, which is independent of anythermal softening mechanism (Walley, 2007). However, in the present work, we address the onset of ASB formationwith fullconsideration of internal heat generation, the resulting heat transfer, and local thermally-driven strain softening in the rate-sensitive crystal model. In particular, we address the roles of texture and micro-texture in ASB formation, but in order to dothis quantitatively, it remains necessary to introduce an appropriate quantitative measure of shear band formation. In light ofthe discussion above, we therefore choose the technologically-relevant (and industrially preferred) point of instabilityoccurring with respect to the macro-scale stress e strain response resulting from the analysis of the aggregate of grainsconsidered in our textured, and micro-textured model polycrystals.
As has already been shown, ASB formation also depends very strongly on rise time and velocity, but for the purposes ofbrevity and clarity, we address just one set of given velocity conditions for which texture is then varied. However, to begin,consider loading all the model specimens to 7% total deformation both by dynamic loading (vpeak ¼ 20 m/s) and with quasi-static loading with strain rate of 10�2 s�1. The shear localization resulting at a strain level of 7% is illustrated in Fig. 16 for therange of textures considered, here shown by the effective plastic strain. This quantity clearly shows the establishment of verymuch more significant localisation and inhomogeneity for all textures for the dynamic loading (from (a) to (f)) compared toquasi-static ((g) to (l)). At this strain level, it is apparent that shear bands form in textures (c), (d) and (e) under dynamicloading but not so for the other textures in (a), (b), and (f). This demonstrates that ASB onset is very dependent on HCP texture.
Hence, for the specific dynamic compression loading conditions (vpeak ¼ 20 m/s), the range of textures have been sys-tematically analysed in order to establish the strain level required in order to establish the onset of ASB formation. For this

Fig. 16. Shear localization for the six textures under consistent 7% compressive strain, with (a)e(f) under dynamic loading with vpeak ¼ 20 m/s and (g)e(l) underquasi-static loading for the same set of textures.
Z. Zhang et al. / International Journal of Plasticity 79 (2016) 196e216212
purpose, ASB formation is quantitatively defined by the onset of softening (i.e. ds/dε ¼ 0, or dt/dg ¼ 0) shown by the cor-responding macro-scale stress strain response, and a discussion of this quantification, and the context provided by theresearch literature, has been given above. The summary results are shown in Fig. 17 for both dynamic compression and shearloading, demonstrating strong dependence of ASB onset strain on texture. In fact, the strain required in order to initiate ASBformation is found to differ by up about 0.03 (3%) within both the compression and shear loading regimes for the texturesconsidered. It therefore becomes clear that a ‘critical strain’ for the onset of ASB formation is not universal since it depends somuch on texture and, as was shown earlier, onmicro-texture. The ASB onset strain is generally found to be higher for dynamiccompression than that for dynamic shear, since ASB formation under dynamic shear is near-parallel to the shear loadingdirection. Under dynamic compression, the shear band orientation depends on texture but has been found to be between 30�
and 60� to the loading direction, and often occurs along with a more complex shear band network, resulting in much longereffective lengths in sheared material to accommodate the deformation, thus requiring higher applied strains. One significantexceptional case is that for texture (d) where the onset strain in shear is larger than that in compression. However, referringback to Fig. 13(d), it is observed that even for conditions of shear loading, a complex shear band structure has been developed,largely because of the effect of micro-texture (see Fig. 14). Conversely, for compression loading in the same texture, areasonablywell-defined 45� shear band is formed, as shown in Fig.12(d). It is also interesting to find that the shear band onsetstrain is around 4.5% on average (based on six considered textures) and this is much higher than the 3.7% that occurs undershear loading. This indicates that with the same texture, dynamic shear loading is likely more destructive than dynamiccompression.
4. Discussion of caveats
Some researchers indicate that b in Eq. (4) is strain and strain rate dependent (Rittel, 2009), and taking b as a constant (eg0.9 or 1.0) over the range of applied strains would likely result in the overestimation of temperature rise (Rosakis et al., 2000).
Fig. 17. Adiabatic shear band onset strain for six textures under dynamic loading (vpeak ¼ 20 m/s).

Z. Zhang et al. / International Journal of Plasticity 79 (2016) 196e216 213
It remains an important experimental challenge to quantify the proportion of plastic dissipation emerging as heat, and themechanistic basis for its occurrence. In this study, however, in the absence of quantitative and empirical detail, we simplifythe problem and take b to be 0.9. This is also recommended by Wright (2002).
It is the case that wave propagation is potentially affected by themodel boundaries and imposed boundary conditions, anda consequence is that the failure mode captured in small-scale model samples is not fully representative of that in bulkmaterials. Nevertheless, within this context, it has been possible to carry out systematic studies on the nucleation of ASBs andthe role of texture and micro-texture in their formation and propagation providing considerable insight in to the importanceof microstructure. The scale up of this approach to make it appropriate as a practical engineering tool therefore requiresfurther work.
In modelling material softening phenomena (and plastic strain localisation is a classic example), there usually exist meshdependency problems (Anand et al., 2012; Bazant and Jirasek, 2002; De Borst et al., 1993; Peerlings et al., 2001). A customarysolution is to introduce length-scale dependent parameters to regularize the total potential energy to maintain the positivedefiniteness of the numerical problem, thereby establishing a unique solution so that the softening/weakening is reasonablyrepresented. The regularisation is often based on a strain gradient approach, with the latter considered as an additionaldegree of freedomwhen formulating the finite elementmethod. The problem has beenmitigated in the present work throughappropriate mesh refinement and consistency in mesh size local to ASB formation by virtue of the regular grain morphologyadopted, and appropriate and consistent mesh refinement. However, it is recognised that such mitigation would be lesseffective in random morphological representations, and this necessitates the development of appropriate regularizationschemes, for example through incorporation of approaches similar to those used for non-local length scale effects (Dunneet al., 2012).
5. Conclusions
The balance between the time constants associatedwith thermal diffusion and plastic dissipation are found to be crucial incontrolling strain localisation, softening and ASB formation.
Texture in HCP polycrystals is found to have major impact on the strain required for the onset of ASB formation, withtexture variation leading to differences in ASB onset strain of up to 3%. For high-rate shear, low strain to ASB formation resultsfrom TD split textures, and high onset strain from outspread texture. For compression, random texture is shown to lead tohighest ASB onset strain.
ASB development tends to occur along bands of grains with similar crystallographic orientation. Grain size affects ASBthickness, thereby affecting length scale over which internal heat generation occurs, thereby influencing local temperature.Temperature differences along forming ASBs of 150 K ormore are observed, influenced strongly bymicro-texture. ASB coolingrates of 350 K ms�1 or higher are observed at local ASB hotpots at which temperatures in excess of 500 K are achieved.
Micro-texture has been found to play a crucial role in ASB initiation and development, and particularly in the inhibition, ordisruption of ASB formation. Contrived combinations of crystallographic orientation (eg to give a classical hard-soft slipconfiguration) have strong influence on both the advancement and inhibition of ASB growth, leading to considerable dif-ferences in failure strain. Carefully controlled microstructures therefore provide the potential for significant technologicalbenefits in the development of new impact-resistant alloys.
Acknowledgement
The authors gratefully acknowledge the financial support from the Engineering & Physical Science Research Council (EP/K034332) through HexMat programme. ZZ expresses gratitude to Drs Bo Lan and Ben Britton, and to Mr Bartosz Barzdajn forhelpful discussion on texture in hexagonal materials. DE acknowledges AWE for their continued support of the Institute ofShock Physics.
Appendix A. Properties and parameters
Table A.1High-purity polycrystal alpha-Ti: temperature independent material properties.
Material properties Quantities Reference
Thermal conductivity, k 14.99 [w/mK] Leyens and Peters (2003)Density, r 4510 [Kg/m�3] Lide (2010)Thermal expansion coefficient ac ¼ 5.6 � 10�6 [K�1]
aa ¼ 9.5 � 10�6 [K�1]Ho and Taylor (1998) and Pawar and Deshpande (1968)

Table A.2High-purity polycrystal alpha-Ti: material property dependency on temperature.
Temperature dependency for Q 2 [293,1000] K
Critical resolved shear stress for basal, prismatic and pyramidal <a> slip systems
tb;pc ðQÞ ¼ 0:002� ðQ� 273Þ2 � 0:3794� ðQ� 273Þ þ 280:45 (A1.a)tpyrac ðQÞ ¼ 0:0011� ðQ� 273Þ2 � 1:3801� ðQ� 273Þ þ 867:18 (A1.b)
Williams et al. (2002)
Young's modulus and shear modulusE11 ¼ �75:329� ðQ� 273Þ þ 85292 (A2.a)G12 ¼ �27:403� ðQ� 273Þ þ 29100 (A2.b)
Lütjering and Williams (2007)
Specific heat capacity
CpðQÞ ¼ 2:0� 10�7 � ðQ� 273Þ3 � 0:0003� ðQ� 273Þ2 þ 0:3159� ðQ� 273Þ þ 519:58 (A3)
Leyens and Peters (2003)Xue et al. (2002)
Z. Zhang et al. / International Journal of Plasticity 79 (2016) 196e216214
Full elastic anisotropy is adopted in this study. The constant values in room temperature are given by Dunne et al. (2007)terms of E11, E33,G12, G13, n12 and n13. With temperature dependency of E11 and G12 defined in Eq. (A2), one can interpolate to
get the other elastic constants. At an updated temperatureQi þ 1, for instance, Eiþ133 ¼ Eiþ1
11 � Ei33
Ei11. Using this method, one can get
associated temperature dependency for G13 and n13. In addition, the parameters defined in the slip rule are given by Zhanget al. (2015) and they are listed in Table A.3.
Table A.3Slip rule parameters.
Material properties Quantities
rm 5.0 [mm�2]ro 0.01 [mm�2]n 1.0 � 1011 [Hz]b 3.20 � 10�4 [mm]k 1.381 � 10�23 [J K�1]g0 6 � 10�4
g0
0 for single crystal0.05 for polycrystal
DH 9.913 � 10�20 [J atom�1]
Appendix B. Kearns factors
Kearns factors are used to represent the fraction of basal poles of HCP metals projected into global orthogonal axes. Theyserve as a simple and technologically useful index of material anisotropy and have been adopted widely in HCP metals(Anderson et al., 1999; Lan et al., 2014, 2015a,b). Fuller detail may be obtained from the papers by Anderson et al. (1999) andKearns (1965). Kearns factors are given by
f1 ¼ fRD ¼Zp
2
0
Z2p0
qðc; hÞsin3ðcÞcos2ðhÞdhdc (C1)
f2 ¼ fTD ¼Zp
2
0
Z2p0
qðc; hÞsin3ðcÞsin2ðhÞdhdc (C2)
f3 ¼ fND ¼Zp
2
0
Z2p0
qðc; hÞsinðcÞcos2ðhÞdhdc (C3)
where q(c,h) is the normalized pole figure intensity, and it is noted thatP3
i¼1fi ¼ 1. If the basal poles are perfectly aligned inone direction, a Kearns factor of 1.0 will be found in that direction and zero for the other two directions. For random texture, avalue of 1/3 is obtained for all three directions (Kearns, 2001).
References
Anand, L., Aslan, O., Chester, S.A., 2012. A large-deformation gradient theory for elastic-plastic materials: strain softening and regularization of shear bands.Int. J. Plast. 30e31, 116e143.

Z. Zhang et al. / International Journal of Plasticity 79 (2016) 196e216 215
Anderson, A.J., Thompson, R.B., Cook, C.S., 1999. Ultrasonic measurement of the Kearns texture factors in zircaloy, zirconium, and titanium. Metall. Mater.Trans. A Phys. Metall. Mater. Sci. 30, 1981e1988.
Antolovich, S.D., Armstrong, R.W., 2014. Plastic strain localization in metals: origins and consequences. Prog. Mater. Sci. 59, 1e160.Asaro, R.J., Rice, J.R., 1977. Strain localization in ductile single crystals. J. Mech. Phys. Solids 25, 309e338.Austin, R.A., McDowell, D.L., 2011. A dislocation-based constitutive model for viscoplastic deformation of fcc metals at very high strain rates. Int. J. Plast. 27,
1e24.Bai, Y., Dodd, B., 2012. Adiabatic Shear Localization: Frontiers and Advances. Elsevier, London.Basinski, Z.S., 1957. The instability of plastic flow of metals at very low temperature. Proc. R. Soc. Lon. Ser. A Math. Phys. Sci. 240, 229e242.Bazant, Z.P., Jirasek, M., 2002. Nonlocal integral formulations of plasticity and damage: survey of progress. ASCE J. Eng. Mech. 128, 1119e1149.Bonnet-Lebouvier, A.S., Klepaczko, J.R., 2002. Numerical study of shear deformation in Ti-6Al-4V at medium and high strain rates, critical impact velocity in
shear. Int. J. Impact Eng. 27, 755e769.Chen, Y., Ghosh, S., 2012. Micromechanical analysis of strain rate-dependent deformation and failure in composite microstructures under dynamic loading
conditions. Int. J. Plast. 32e33, 218e247.Chichili, D.R., Ramesh, K.T., Hemker, K.J., 1998. The high-strain-rate response of alpha-titanium: experiments, deformation mechanisms and modeling. Acta
Mater. 46, 1025e1043.Chichili, D.R., Ramesh, K.T., Hemker, K.J., 2004. Adiabatic shear localization in alpha-titanium: experiments, modeling and microstructural evolution. J.
Mech. Phys. Solids 52, 1889e1909.Childs, T., 2014. CIRP encyclopedia of production engineering. In: Laperri�ere, L., Reinhart, G. (Eds.), Adiabatic Shearing in Metal Machining. Springer, London,
pp. 27e33.Clayton, J.D., 2005. Dynamic plasticity and fracture in high density polycrystals: constitutive modeling and numerical simulation. J. Mech. Phys. Solids 53,
261e301.Clayton, J.D., 2009. Modeling effects of crystalline microstructure, energy storage mechanisms, and residual volume changes on penetration resistance of
precipitate-hardened aluminum alloys. Compos. B Eng. 40, 443e450.Clayton, J.D., 2010. Nonlinear Mechanics of Crystals. Springer, Dordrecht.Clifton, R.J., Duffy, J., Hartley, K.A., Shawki, T.G., 1984. On critical conditions for shear band formation at high strain rates. Scr. Metall. 18, 443e448.Coghe, F., Rabet, L., Kestens, L., 2006. Deformation mechanisms of a commercial titanium alloy Ti6Al4V as a function of strain rate and initial texture. J. De
Phys. IV 134, 845e850.Consid�ere, A., 1885. Memoire sur l'emploi du fer et de l'acier dans les constructions. Ann. Ponts Chauss�ees 9, 574e775.De Borst, R., Sluys, L.J., Mühlhaus, H.B., Pamin, J., 1993. Fundamental issues in finite element analyses of localization of deformation. Eng. Comput. 10,
99e121.Dolinski, M., Rittel, D., Dorogoy, A., 2010. Modeling adiabatic shear failure from energy considerations. J. Mech. Phys. Solids 58, 1759e1775.Dunne, F.P.E., Kiwanuka, R., Wilkinson, A.J., 2012. Crystal plasticity analysis of micro-deformation, lattice rotation and geometrically necessary dislocation
density. Proc. R. Soc. A Math. Phys. Eng. Sci. 468, 2509e2531.Dunne, F.P.E., Rugg, D., Walker, A., 2007. Lengthscale-dependent, elastically anisotropic, physically-based hcp crystal plasticity: application to cold-dwell
fatigue in Ti alloys. Int. J. Plast. 23, 1061e1083.Field, J.E., Walley, S.M., Proud, W.G., Goldrein, H.T., Siviour, C.R., 2004. Review of experimental techniques for high rate deformation and shock studies. Int. J.
Impact Eng. 30, 725e775.Follansbee, P.S., Gray III, G.T., 1989. An analysis of the low temperature, low and high strain-rate deformation of Ti�6Al�4V. Metall. Trans. A Phys. Metall.
Mater. Sci. 20, 863e874.Gilat, A., Clifton, R.J., 1985. Pressure-shear waves in 6061-T6 aluminum and alpha-titanium. J. Mech. Phys. Solids 33, 263e284.Gong, J., Wilkinson, A.J., 2009. Anisotropy in the plastic flow properties of single-crystal alpha titanium determined from micro-cantilever beams. Acta
Mater. 57, 5693e5705.Guduru, P.R., Ravichandran, G., Rosakis, A.J., 2001a. Observations of transient high temperature vortical microstructures in solids during adiabatic shear
banding. Phys. Rev. E 64, 036128.Guduru, P.R., Rosakis, A.J., Ravichandran, G., 2001b. Dynamic shear bands: an investigation using high speed optical and infrared diagnostics. Mech. Mater.
33, 371e402.Hart, E.W., 1967. Theory of the tensile test. Acta Metall. 15, 351e355.Hill, R., 1962. Acceleration waves in solids. J. Mech. Phys. Solids 10, 1e16.Ho, C.Y., Taylor, R.E., 1998. Thermal Expansion of Solids. ASM International, Materials Park, Ohio.Jia, D., Wang, Y.M., Ramesh, K.T., Ma, E., Zhu, Y.T., Valiev, R.Z., 2001. Deformation behavior and plastic instabilities of ultrafine-grained titanium. Appl. Phys.
Lett. 79, 611e613.Kearns, J.J., 1965. Thermal Expansion and Preferred Orientation in Zircaloy. Bettis Atomic Power Laboratory, Westinghouse Electric Corporation, Pittsburgh,
PA.Kearns, J.J., 2001. On the relationship among ‘f’ texture factors for the principal planes of zirconium, hafnium and titanium alloys. J. Nucl. Mater. 299,
171e174.Khan, A.S., Suh, Y.S., Kazmi, R., 2004. Quasi-static and dynamic loading responses and constitutive modeling of titanium alloys. Int. J. Plast. 20, 2233e2248.Kuroda, M., Tvergaard, V., 2007. Effects of texture on shear band formation in plane strain tension/compression and bending. Int. J. Plast. 23, 244e272.Lan, B., Lowe, M., Dunne, F.P.E., 2014. Experimental and computational studies of ultrasound wave propagation in hexagonal close-packed polycrystals for
texture detection. Acta Mater. 63, 107e122.Lan, B., Lowe, M.J.S., Dunne, F.P.E., 2015a. A generalized spherical harmonic deconvolution to obtain texture of cubic materials from ultrasonic wave speed. J.
Mech. Phys. Solids 83, 221e242.Lan, B., Lowe, M.J.S., Dunne, F.P.E., 2015b. A spherical harmonic approach for the determination of HCP texture from ultrasound: a solution to the inverse
problem. J. Mech. Phys. Solids 83, 179e198.Leyens, C., Peters, M., 2003. Titanium and Titanium Alloys: Fundamentals and Applications. Wiley, Weinheim.Liao, S.C., Duffy, J., 1998. Adiabatic shear bands in a TI-6Al-4V titanium alloy. J. Mech. Phys. Solids 46, 2201e2231.Lide, D.R., 2010. CRC Handbook of Chemistry and Physics, 90 edition ed. CRC Press, Boca Raton, Florida.Lindholm, U.S., 1974. Review of dynamic testing techniques and material behaviour. In: Harding, J. (Ed.), Mechanical Properties at High Rates of Strain.
Institute of Physics, London and Bristol, pp. 3e21.Lloyd, J.T., Clayton, J.D., Austin, R.A., McDowell, D.L., 2014a. Plane wave simulation of elastic-viscoplastic single crystals. J. Mech. Phys. Solids 69, 14e32.Lloyd, J.T., Clayton, J.D., Becker, R., McDowell, D.L., 2014b. Simulation of shock wave propagation in single crystal and polycrystalline aluminum. Int. J. Plast.
60, 118e144.Lütjering, G., Williams, J.C., 2007. Titanium. Springer-Verlag, Berlin Heidelberg.Mayeur, J., McDowell, D., 2007. A three-dimensional crystal plasticity model for duplex Tie6Ale4V. Int. J. Plast. 23, 1457e1485.Medyanik, S.N., Liu, W.K., Li, S., 2007. On criteria for dynamic adiabatic shear band propagation. J. Mech. Phys. Solids 55, 1439e1461.Meissonnier, F.T., Busso, E.P., O'Dowd, N.P., 2001. Finite element implementation of a generalised non-local rate-dependent crystallographic formulation for
finite strains. Int. J. Plast. 17, 601e640.Merzer, A.M., 1982. Modelling of adiabatic shear band development from small imperfections. J. Mech. Phys. Solids 30, 323e338.Meyers, M.A., 1994. Dynamic Behavior of Materials. Wiley, New York.

Z. Zhang et al. / International Journal of Plasticity 79 (2016) 196e216216
Meyers, M.A., Pak, H.R., 1986. Observation of an adiabatic shear band in titanium by high-voltage transmission electron microscopy. Acta Metall. 34,2493e2499.
Meyers, M.A., Subhash, G., Kad, B.K., Prasad, L., 1994. Evolution of microstructure and shear-band formation in alpha-hcp titanium. Mech. Mater. 17,175e193.
Pawar, R.R., Deshpande, V.T., 1968. The anisotropy of the thermal expansion of alpha-titanium. Acta Cryst. A24, 316e316.Peerlings, R.H.J., Geers, M.G.D., de Borst, R., Brekelmans, W.A.M., 2001. A critical comparison of nonlocal and gradient-enhanced softening continua. Int. J.
Solids Struct. 38, 7723e7746.Peirce, D., Asaro, R.J., Needleman, A., 1982. An analysis of nonuniform and localized deformation in ductile single crystals. Acta Metall. 30, 1087e1119.Peirs, J., Tirry, W., Amin-Ahmadi, B., Coghe, F., Verleysen, P., Rabat, L., Schryvers, D., Degrieck, J., 2013. Microstructure of adiabatic shear bands in Ti6Al4V.
Mater. Charact. 75, 79e92.Peirs, J., Verleysen, P., Degrieck, J., Coghe, F., 2010. The use of hat-shaped specimens to study the high strain rate shear behaviour of Ti-6Al-4V. Int. J. Impact
Eng. 37, 703e714.Ramesh, K.T., 2008. High rates and impact experiments. In: Sharpe Jr., W.N. (Ed.), Springer Handbook of Experimental Solid Mechanics. Springer, New York,
pp. 929e960.Ranc, N., Taravella, L., Pina, V., Herve, P., 2008. Temperature field measurement in titanium alloy during high strain rate loading e adiabatic shear bands
phenomenon. Mech. Mater. 40, 255e270.Rittel, D., 2009. A different viewpoint on adiabatic shear localization. J. Phys. D Appl. Phys. 42, 214009.Rosakis, P., Rosakis, A.J., Ravichandran, G., Hodowany, J., 2000. A thermodynamic internal variable model for the partition of plastic work into heat and
stored energy in metals. J. Mech. Phys. Solids 48, 581e607.Schoenfeld, S.E., Kad, B., 2002. Texture effects on shear response in Ti-6Al-4V plates. Int. J. Plast. 18, 461e486.Staker, M.R., 1981. The relation between adiabatic shear instability strain and material properties. Acta Metall. 29, 683e689.Sun, J.L., Trimby, P.W., Yan, F.K., Liao, X.Z., Tao, N.R., Wang, J.T., 2014. Shear banding in commercial pure titanium deformed by dynamic compression. Acta
Mater. 79, 47e58.Taylor, G.I., Quinney, H., 1934. The latent energy remaining in a metal after cold working. Proc. R. Soc. A 143, 307e326.Tenckhoff, E., 2005. Review of deformation mechanisms, texture and mechanical anisotropy in zirconium and zirconium base alloys. J. ASTM Int. 2,
JAI12945.Tresca, M.H., 1878. On further applications of the flow of solids. J. Frankl. Inst. 106, 326e334.Walley, S.M., 2007. Shear localization: a historical overview. Metall. Mater. Trans. A Phys. Metall. Mater. Sci. 38A, 2629e2654.Williams, J.C., Baggerly, R.G., Paton, N.E., 2002. Deformation behavior of HCP Ti-Al alloy single crystals. Metall. Mater. Trans. A 33, 837e850.Wright, T.W., 2002. The Physics and Mathematics of Adiabatic Shear Bands. Cambridge University Press, Cambridge.Wright, T.W., Ockendon, H., 1996. A scaling law for the effect of inertia on the formation of adiabatic shear bands. Int. J. Plast. 12, 927e934.Xue, Q., Meyers, M.A., Nesterenko, V.F., 2002. Self-organization of shear bands in titanium and Ti-6Al-4V alloy. Acta Mater. 50, 575e596.Zener, C., Hollomon, J.H., 1944. Effect of strain rate upon plastic flow of steel. J. Appl. Phys. 15, 22e32.Zhang, Z., Cuddihy, M.A., Dunne, F.P.E., 2015. On rate-dependent polycrystal deformation: the temperature sensitivity of cold dwell fatigue. Proc. R. Soc. A
471, 20150214.Zhou, M., Ravichandran, G., Rosakis, A.J., 1996a. Dynamically propagating shear bands in impact-loaded prenotched plates. 2. Numerical simulations.
J. Mech. Phys. Solids 44, 1007e1032.Zhou, M., Rosakis, A.J., Ravichandran, G., 1996b. Dynamically propagating shear bands in impact-loaded prenotched plates .1. Experimental investigations of
temperature signatures and propagation speed. J. Mech. Phys. Solids 44, 981e1006.