
ON THE APPLICATION OF THE HIC AS HEAD ... THE APPLICATION OF THE HIC AS HEAD PROTECTION CRITERION...
18
ON THE APPLICATION OF THE HIC AS HEAD PROTECTION CRITERION ABSTRACT E . Faerber Bundesanstalt für Strassenwesen (BASt) Bergisch Gladbach and F . Kramer Institut für Fahrzeugtechnik Technische Universität Berlin Federal Repub l i c of Germany The WSU tolerance curve describes the relationship between effective acceler- ation and time duration of effective acceleration for brain injury in fore- head impac t s . This relationship represents impacts against plane , unyielding surfaces . The HIC was developed to rate resultant dummy head accelerations according to the WSU tolerance curve . In the ECE/GRCS draft regulation con- cerning occupant protection in frontal passenger car impacts , a head protec- tion criterion (HPC) is now being considered which limits the application of HIC in the case of dummy head imp ac t . In this paper, problems of HIC application in crash testing are discussed. 1. OBJECTIVES Since the introduction of head loading criteria such as the 3 ms acceleration value , severity index (SI) and in particular the head inj ury criterion (HIC) , the discussion as to the expediency of the these inj ury criteria has not been concluded / 1 , 2/*. Based on this l iterature , the types of injury and the injury mechanism during head loading are described below. I n addition , measuring and mathematical problem areas are indicated which must be taken into consideration during practical application of the HIC in evaluating head loadings . 2. The BIOMECHANICAL ASPECT Ef forts have been and are being made worldwide to investigate the mechanisms of head injuries resulting from accidents . These efforts can be traced back to the middle of the 19th century when the development of characteristic val- ues to describe head injuries arising from the effect of force were studied for the first time , see e.g. the literature study /3/ . The difficulties involved in solving this problem are due first and foremost to the fact that direct measurement of mechanical variables cannot be carried out on a l iving person at a sufficiently high load. For this reason , steps were taken to investigate this phenomenon based on carefully recorded acci- dent data . Tests were carried out with human and animal corpses and with * Numb e r s in parentheses designate references at the end of the paper 235
Transcript of ON THE APPLICATION OF THE HIC AS HEAD ... THE APPLICATION OF THE HIC AS HEAD PROTECTION CRITERION...

ON THE APPLICATION OF THE HIC AS HEAD PROTECTION CRITERION
ABSTRACT
E . Faerber
Bundesanstalt für Strassenwesen (BASt)
Bergisch Gladbach
and
F . Kramer
Institut für Fahrzeugtechnik
Technische Universität Berlin
Federal Repub l i c of Germany
The WSU tolerance curve describes the relationship between effective acceler
ation and time duration of effective acceleration for brain inj ury in fore
head impact s . This relationship represents impacts against plane , unyielding
surface s . The HIC was developed to rate resultant dummy head accelerations
according to the WSU tolerance curve . I n the ECE/GRCS draft regulation con
cerning occupant protection in frontal passenger car impacts , a head protec
tion criterion (HPC) is now being considered which limits the application of
HIC in the case of dummy head impac t .
I n this pape r , problems o f HIC appl ication i n crash testing are discussed .
1 . OBJECTIVES
Since the introduction of head loading criteria such as the 3 ms acceleration
value , severity index ( S I ) and in particular the head inj ury criterion ( H I C ) ,
the discussion as to the expediency of the these inj ury criteria has not been
concluded / 1 , 2 / * .
Based on this l iterature , the types of injury and the inj ury mechanism during
head loading are described below . I n addition , measuring and mathematical
problem areas are indicated which must be taken into consideration during
practical application of the H I C in evaluating head loadings .
2 . The BIOMECHANICAL ASPECT
E f forts have been and are being made worldwide to investigate the mechanisms
of head injuries resulting from accidents . These efforts can be traced back
to the middle of the 19th century when the development of characteristic val
ues to describe head injuries arising from the effect of force were studied
for the first time , see e . g . the literature study / 3 / .
The d i f ficulties involved in solving this problem are due first and foremost
to the fact that direct measurement of mechanical variables cannot be carried
out on a l iving person at a sufficiently high load . For this reason , steps
were taken to investigate this phenomenon based on carefu l l y recorded acci
dent data . Tests were carried out with human and animal corpses and with
* Numbers in parentheses designate references at the end of the paper
235

living animals fitted with transducers , whereby the head was subjected to a
specific impact or deceleration . In addition to measuring the accelerations ,
the motion patterns were analyzed using high-speed film.
2 . 1 TYPES OF LOADING
The head of the vehicle occupant is subjected to dynamic loadings during an accident . Depending on whether the head makes contact with parts of the vehicle or not , the head is subj ected to loading from the impact forces or from
the inertia forces via neck forces .
Impact and inertia forces generally induce head movements comprising both
translatory and rotatory components , thus resulting in corresponding acceler
ations . Rotatory acceleration components almost always occur because :
- The freely moving head follows curved paths as a result of restraining
forces of the trunk via the neck
- The resulting impact force due to the irregular contours of the sku l l
passes only in the most seldom of cases through the centre o f gravity o f the head over the entire period of impac t .
2 . 2 TYPES O F INJURY
Inj uries to the head are di fferentiated into skull and brain injurie s . I f forces and torques are transferred solely through the cervical spine , inj ur
ies to the skull can be excluded. Impact force s , on the other hand , can
cause both skull and brain injurie s .
2 . 2 . 1 SKULL INJURIES
With skull injurie s , distinction is normally made between indirect fractures
and depressed fractures of the skull . Indirect fractures occur where forces
are exerted over large areas causing opposite oscillations between the half of the skull on the side of contact and the half of the skull away from the point of contact (anti-resonance at 300 to 360 Hz) . Depressed fractures are
the result of hard blows to small areas : The part of the skull on the side
of contact oscillates at high amplitude whilst the part of the skull away
from the point of contact is relatively undisturbed ( resonance at approx . 900 Hz) / 4 / .
2 . 2 . 2 BRAIN INJURIES
Studies of road traffic accidents /5/ have shown that brain injuries only
occur when the head makes impact with parts of the vehicle . Brain injuries include concussions , haemorrhages , contusions and crushing in the area near
est to the point of contact resulting from compression s , and also ruptures as a result of depressed skull fractures .
A further phenomenon in brain injuries are " contrecoup" injuries . They occur
on the opposite side of the brain from the point of contact when the vapour
pressure o f the tissue fluid i s too low, causing gas bubbles di ssolved in the
brain to expand /6/ .
236

The above-mentioned injuries are observed primarily where translatory load
ings predominate . Rotatory loading of the head normally results in wide
spread brain haemorrhages due to ruptures of the pontine veins induced by
inertia-related relative movements between skull and brain / 7 / .
I n more recent studies / 8 / , serious brain inj uries with fatal consequences
are differentiated into subdural hematoma ( SDH) and diffuse axonal inj ury
(DAI ) . These two types of injury have different cause s . SDH occurs primarily in falls , whilst DAI occurs a lmost exclusively in vehicle collisions . Both
types of inj ury occur under the same mechanical load , but which differs only
in its intensity ; quotation from /8/ :
"Subdural hematoma is due to vascular inj ury that is caused by relatively
short duration angular acceleration loading at high rates of acceleration . These are the circumstances that occur in falls where the head rapidly decel
erates because of impact to firm, unyielding surface s . DAI is also due to
angular acceleration of the head, but occurs most readily when the head moves
coronally and it only occurs when the acceleration duration i s longer and the
rate of acceleration lower than conditions that produce SDH . These conditions
are met in vehicle occupants where impact to deformable or padded surf aces
lengthen the deceleration and decrease its rate . In DAI the principal mechan
ical damage is to the brain itse l f (mainly to axons) while in SDH the primary
damage occurs to surface blood vessels . "
I f one accepts the results of this study , then the translatory acceleration
of the head is of lesser importance , at least for the more serious brain injuries . · In contrast to this , howeve r , is the fact that nowadays measurements
conducted during safety crash tests on dummies are restricted almost exclu
si vely to translatory accelerations . On the other hand , it is concluded in
/ 7 / from a number of studies that local effects of impact clearly reduce the
tolerance level o f the brain compared with rotational accelerations .
2 . 3 INJURY-RELEVANT PHYS IOLOGICAL PARAMETERS
Since studies of head injuries were first started , the wide range of influ
encing factors has caused very great difficulties in relating injuries to mechanical loading factors when determining , for example , the protection cri
teria. But even if the mechanical influences are held constant, the physio
logical differences between the victims of road traffic accidents are very
wide ranging. Of the parameters : Body size , constitution , sex and age of the vehicle occupants , the size of the body determines the point of contact in
the vehicle and , as a result of the close relationship between size and
weight , the energy content of the part of the body to be decelerated . For
head injuries , age is a dominant factor , whilst the sex of the occupant and
the other parameters are of minor importance . The effect of age can be even
greater for the seriousness of the inj ury than the effect of the relative speed / 9 , 10/ . For ehest injuries (rib fractures) , a factor was developed for age characterization of bones (BCF = hone condition factor) /10/ which ,
if applied analogously to the bones of the skul l , could sharply reduce the age-related variance of injuries under equal load.
237

2 . 4 INJURY SEVERITY LEVELS
Whilst determining an acceptable injury severity level for the head, a distinction is drawn on the one hand between dangerous to l i fe and not dangerous
to life (WSU curve) and on the other hand , a line is drawn between reversible
and irreversible injuries / 1 2 / .
With the introduction o f the " abbreviated injury scale" (AIS) i n 1 9 7 1 and
the revision in 1 98 0 , an inj ury coding system has been established .
However the AIS coding only covers the traumatological assessment of injuries
at the scene of an accident . It does not take into consideration the longterm consequences of the injuries , for example succeeding severity increase .
This situation is indicated separately by the introduction of the lethality
rate in / 1 3 / . According to this rating, 16% of those victims with AIS3 injuries and 4 % of those with AIS2 injuries died . With a rough classi fication ,
the border between reversible and irreversible head injuries lies between
AIS2 and AIS3 , whilst the border between dangerous to life and not dangerous
to l i fe is more likely to lie between AIS3 and AIS4 . I f one takes into con
sideration the consequences of the inj ury severity levels mentioned above , the acceptable limit should be set between AIS2 and AIS3 .
2 . 5 INJURY CRITERIA/PROTECTION CRITERIA
In the following, the terms : Inj ury criteri a , injury criteria leve l s , human tolerance leve l s , protection criteria , protection criteria levels and perfor
mance criteria limits will be used as defined in / 14 / . These definitions were developed as part of the EEC b iomechanics program . To date , these terms
have not been applied uni formly in biomechanical research .
The most important head inj ury and protection criteria are classified in
Table 1 from / 15 / . S I and HIC use the resulting acceleration of the head as
the inj ury criterion whilst at the same time also using it as the protection
criterion.
s 1
SEVERITV INOEX (GADO)
We1gh1ed Impulse of a(t)
SI = j[�m]"' dt 0
loml' •ll H'l lllllh A11 11111 ''°""
"••• = ISOO
Table 1 :
H I C HEAO INJURV
CRITERION (VERSACE & NHTSA)
Weoghted Impulse of a(t)
" l•t - {.C•i. a.,=
lt,-t,I i-·� .� .„ -··· HIC- a„<•,· •, l - •1·•· " .J
O< 1, < '•' T
HtCtel : 1000
J T I J-TOLERANCE
INOEX (SLATTENSCHEK)
• a�
I� w.= VliTm " ... IM'4
P = <lc. w.=635. p = 1 .0 J ...... .„ = ö.Oiii . iO
J : 1 0 •••
R B M E D I M S C REVISEO BRAIN EFFECTIVE MAXIMUM STRAIN
MOOEL OISPLACEMENTINOEX CRITERION
(FAN) (BRINN) (STALNAKER)
• •
� � a� .
'� l�I l�I w.: 175. w,.:482. m, : 0.6 (lbol
p : 0.-4 p : 0.707 m,:10.0 (Ibo) c = 2.0 Ob-seclin)
k : SO 000. 1 tb. in)
T<to•• I T >to•• .... . A·r III. C = x„„/L • ... • I •••• = **AN 0.15 "' 0.11 1. HUMAN: l: S.75 in(.\·r) IU.1.fc I 1.15 I• DU-T 0.17 In 0.2 In c,., = o.006' in•in
Summary of some inj ury criteria and protection criteria levels (mechanical
models � dummies) from /15/
238
The value HIC = 1000 is the performance criterion limit of US FMVS standard
2 0 8 . The other four criteria ( JTI , RBM, EDI , MSC) use de formations and defor
mation speeds as the inj ury criteria .
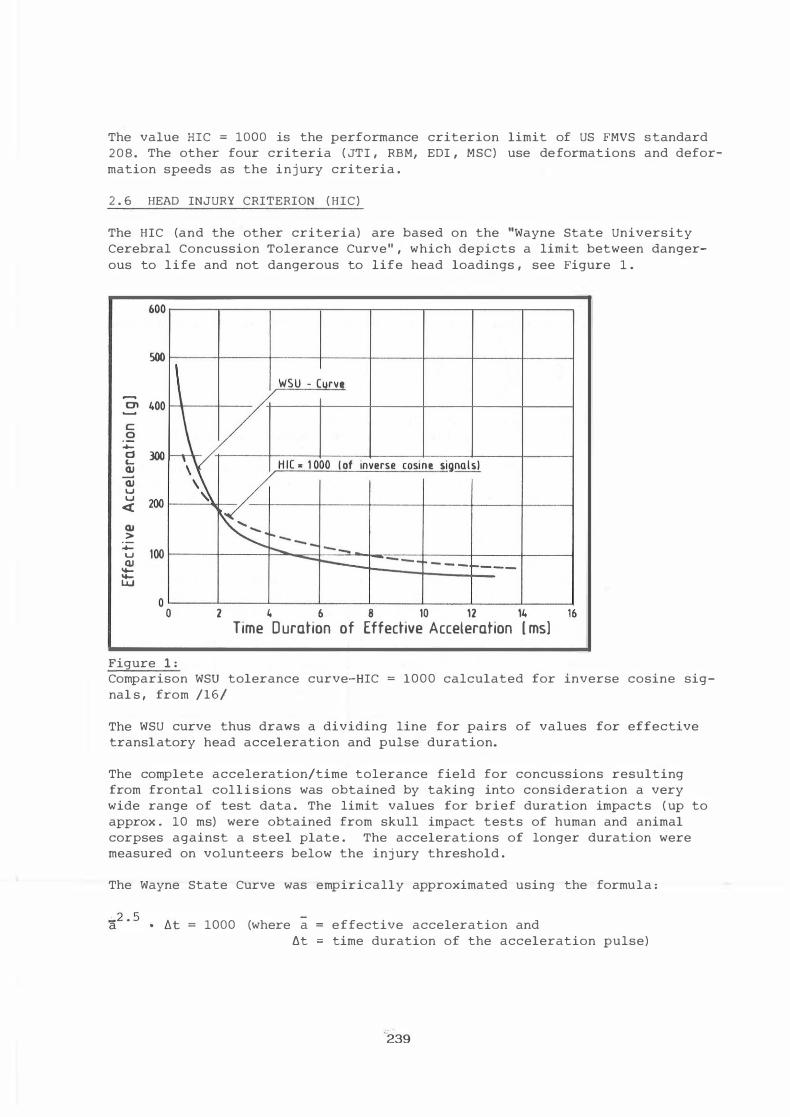
2 . 6 HEAD INJURY CRITERION ( HIC)
The HIC (and the other criteria) are based on the "Wayne State University
Cerebral Concussion Tolerance Curve" , which depicts a limit between danger
ous to life and not dangerous to life head loadings , see Figure 1 .
c 0 ..... d L. QJ -QJ u u <{ QJ >
..... u QJ .... tt:; O'--��-'-��-'-��--'���-'--��-'-��---'-���,__���
0 2 4 6 8 10 12 14 16 Time D uration of Effective Acceleration [ ms]
Figure 1 : Comparison WSU tolerance curve-HIC
nal s , from /16/
1000 calculated for inverse cosine sig-
The WSU curve thus draws a dividing line for pairs of values for effective
transl atory head acceleration and pulse duration.
The complete acceleration/time tolerance field for concussions resulting
from frontal collisions was obtained by taking into consideration a very
wide range of test data . The limit values for brief duration impacts ( up to
approx . 10 ms) were obtained from skull impact tests of human and animal
corpses against a steel plate . The accelerations of longer duration were measured on volunteers below the inj ury threshold .
The Wayne State Curve was empirically approximated using the formula :
1000 (where a = effective acceleration and
6t time duration of the acceleration pulse)
From this formula , the HIC was initially defined as follows : 1 f 2 . 5 (At adt) .:l.t with the limit value 1000 .
.0 t In / 1 7 / , the fact is criticized that for certain acceleration patterns , the HIC values calculated for part intervals could become greater than the values calculated over the entire duration .
For this reason , interval limits t1
and t2
were introduced to the complete measured acceleration pattern .
The currently valid version of the HIC introduced by the NHTSA in FMVSS 208 tz (t �t f a (t) dt) 2 . s Ctz- t1)
i s :
HIC maximum 2 1 t
l where "a" is the resultant acceleration expressed as a multiple of " g " and "g" is the acceleration due to gravity , and either ( i ) "t " and "t " are any two points in the time measured in seconds during h
. 1 2 t e impact, or ( i i ) 11t
111 and 11t
211 are any two points in the time measured in seconds during
any interval when the head is in continuous contact with a part of the vehicle other than the seat belt system when the anthropomorphic test device is restrained by a seat belt system.
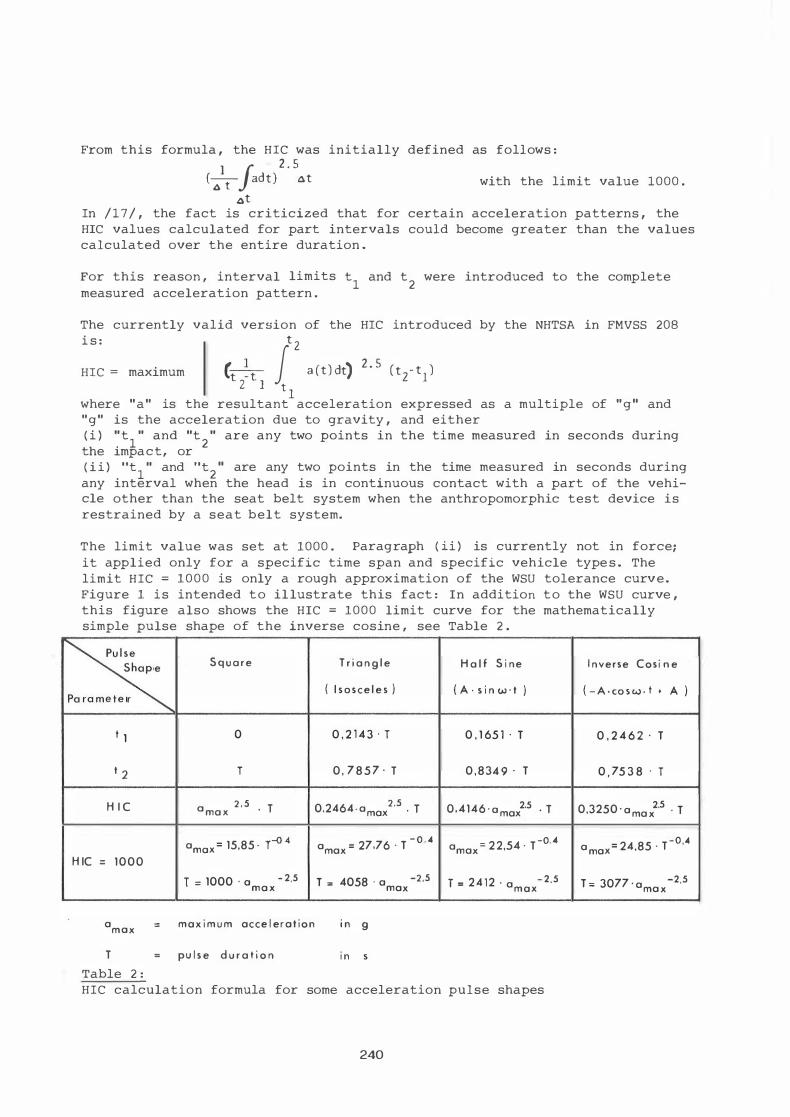
The limit value was set at 1000 . Paragraph ( ii ) is currently not in force; it applied only for a specific time span and specific vehicle type s . The limit HIC = 1 0 0 0 is only a rough approximation of the WSU tolerance curv e . Figure 1 is intended t o il lustrate this fact : In addition t o the WSU curve , this figure also shows the HIC = 1000 limit curve for the mathematically simple pulse shape of the inverse cosine , see Table 2 .
� S q u a r e T r i a n g l e H a l f S i ne I nverse Cosi n e
( l s o s ce l e s ) ( A · s i n w · t ) ( - A · CO S W • t • A
e
r
t 1 0 0 , 2 1 4 3 · T 0 , 1 65 1 · T 0 , 2 4 6 2 · T
t 2 T 0 , 7 8 5 7 · T 0 , 8 34 9 · T 0 , 75 3 8 · T
H I C 0 ma x 2 . 5 . T 0.2464 · amax 2.5 . r 0.4146 · a max2·5 · T 0,3250 · a ma x2·5 · T
)
amax = 15,85 · T-0 4 amax = 27.76 · T - 0 . 4 amax = 2 2,54 · T -0.4 a max= 24,85 · T -0
.4
H IC = 1000
T = 1000 · a - 2,5 T = 4058 · amax ma x
amax = max i m u m acce l erat ion i n g
T
Table 2 :
pu l s e d u r a t i o n i n
-2,5 T = 2 4 1 2 · amax - 2,5
HIC calculation formula for some acceleration pulse shapes
240
T = 3077 · ama x -2,5
For the other signal shapes shown i n Table 2 , this applies also in principle .
3 . THE MEASURING ASPECT
In the analysis of the ef fects of the components of the measuring equipment on the HIC value s , calibration of the accelerometer and filtering of the recorded signals were expected to exert the greatest influence.
3 . 1 ACCELERATION MEASUREMENT
Generally , translational acceleration i s measured using transducers based on the Piezo effect . A universally applicable special rotation angle transducer is not yet available since in collision tests , the point of rotation of the body to be measured is not known in advance and, furthermore , this position normally changes during the measurement .
The measurement of combined translatory and rotatory accelerations must therefore be carried out using a suitable layout of several translatory acceleration transducers . For minimum requirements , six transducers are sufficient, but where higher demands are made on the measuring accuracy , at least nine transducers must be used .
The application and calibration of acceleration transducers are standardized in SAE J 2 1 1 and ISO 6487 . The ISO s tandard , in particular , makes high demands on the calibration of the transducers . Normally , shakers and/ or impact pendulums are used to generate acceleration signals . By performing comparisons with reference transducers , the acceleration transducer to be calibrated can normally only be tested at low accelerations - but over a wide frequency band - on the shaker, and at high accelerations on the impact pendulum. With the impact pendulum test the frequency pattern is calculated in a Fourrier analysis . Observation of the acceleration transducers has shown that due to their high natural frequency ( normally higher than 5 - 7 kHz) problems seldom occur in the frequency pattern. With the increasing use of digital measuring data transmission and storage, errors arising in the modules which perform these functions are now almest negligib le .
3 . 2 EFFECTS OF FILTERING
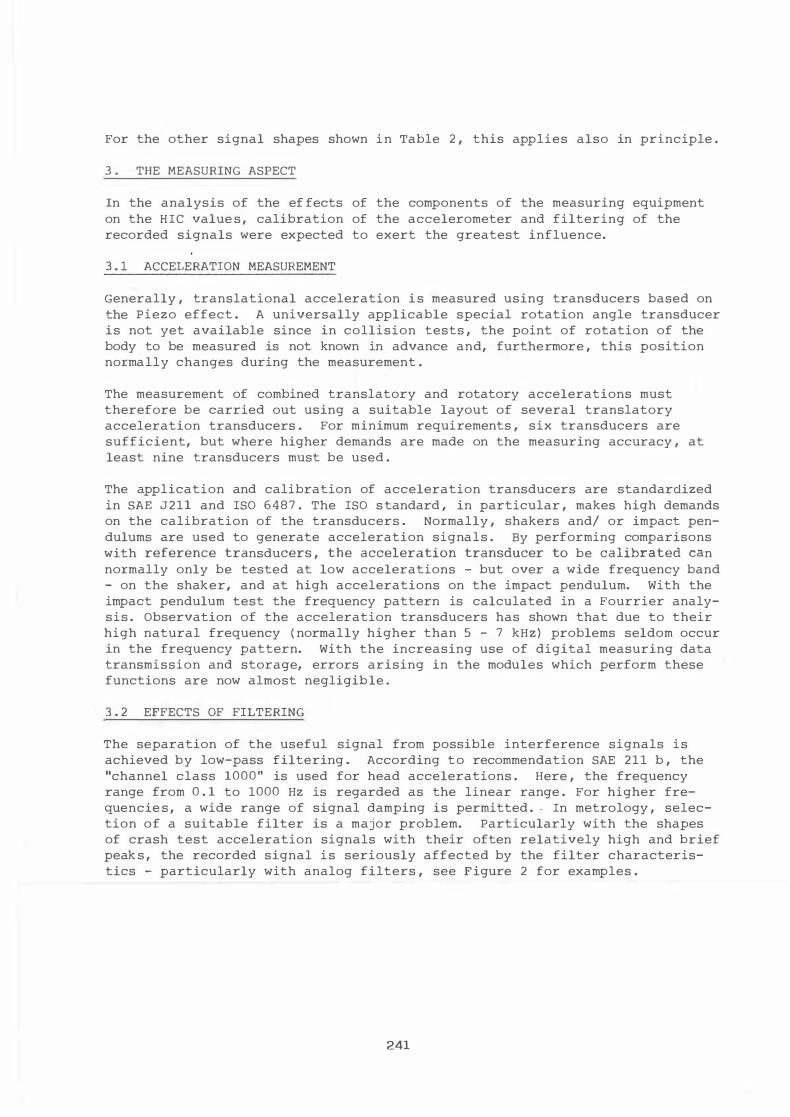
The separation of the useful signal from possible interference signals is achieved by low-pass filtering . According to recommendation SAE 2 1 1 b , the "channel class 1000" is used for head accelerations . Here , the frequency range from 0 . 1 to 1000 Hz is regarded as the linear range . For higher frequencie s , a wide range of signal damping is permitted . . In metrology , selection of a suitable filter is a major problem. Particularly with the shapes of crash test acceleration signals with their often relatively high and brief peak s , the recorded signal is seriously affected by the filter characteristics - particularly with analog filters , see Figure 2 for examples .
241
c 2 p
"'
� .<
�Ji ::1 0
1 l
Unf 1 ltered S1gD.Ql
� 1 . 20 40 • 60 80 100 l111s l
Time
Filtered by BESS E L . 4th order, 300 Hz
Filtered by BUTTERWORTH ,_
4th orde� 300 Hz
� t Filtered by TSCHEBYSCHEW,
1 3 rd order, 300 Hz
1 .� ( OE l1 1 VEO FROH AN UNPUBLISHED PAPER Of M KOCH. VOLVO J
Figure 2 : Influence of analog filter characteristics on pulse shape
In order to further investigate this prob lem , the HIC formula was applied to a number of mathematically simple pulse shape s . The equations are shown in Table 2 . It i s apparent that for similar HIC values - e . g . 1000 - the acceleration duration is of greater importance than the maximum acceleration. This fact was a first indication that filter characteristics do not have any great effect on the HIC value . In a first attempt , high frequency acceleration signals were filtered through various filters . This unsystematic investigation proved that the various filters only caused insignificant changes to the HIC values . In the meantime , an unpub lished study from Volvo which deals with the same problem has come to our notice . This showed that crash signals are considerably modified by analog filters (with decreasing limit frequency , the maximum values decrease; with differing filter characteristics and filter slopes , the phase shifts of the frequency components of the acceleration signals are changed) , but that the HIC values are only insignificantly ( 3 - 5 % ) changed down to limit frequencies of 100 to 1 5 0 Hz .
The change caused in the HIC values by digital filters was investigated in a thesis from the TU Berlin / 1 6 / . With decreasing limit frequencies , digital filters produce decreasing maximum ampl itudes but scarcely any phase shift,
242
see Figure 3 .
(g) 150
c 100 0
-Cl 'QJ �
<LI � 50
<
0
Figure 3 :
_µ/ 0 40
---� .,„,,„,;„ p"'" 1 filtered by 1500 H z , - 15 d B
--
1- i i i ), Acceleration Pulse 1 filtered by 10 Hz, -15dB I
f �v A , � ·v " �
80 120 160 200 Time
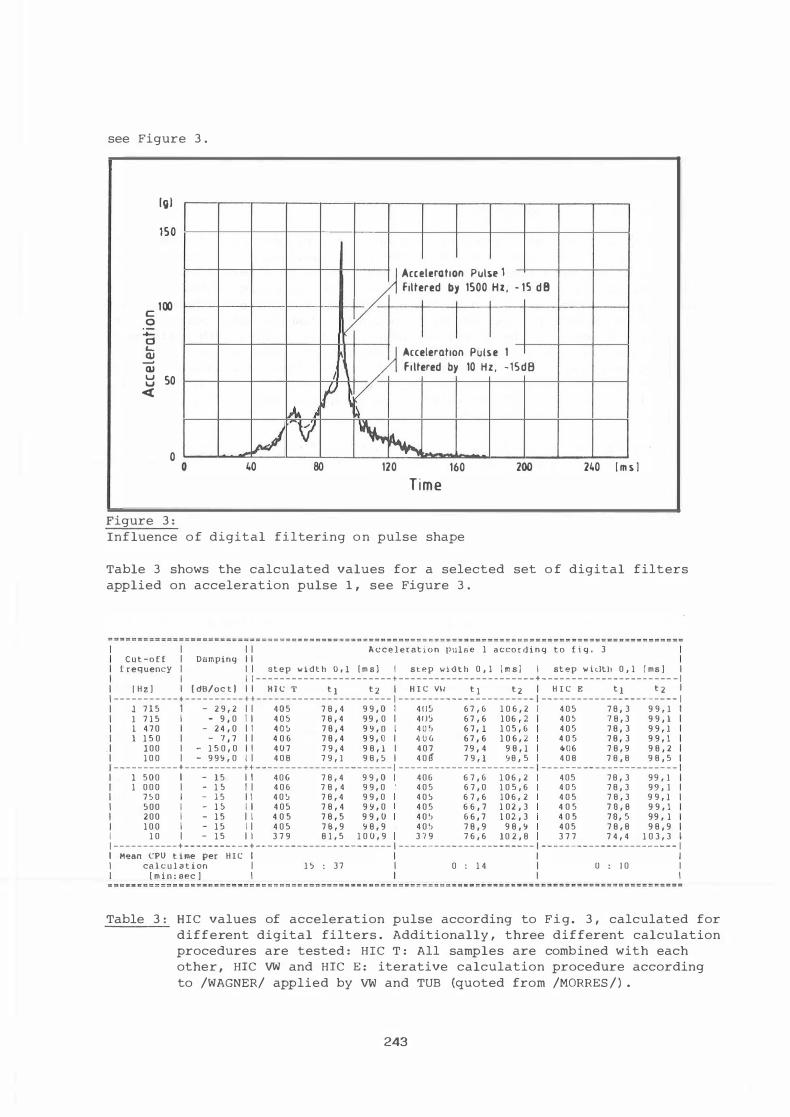
Influence o f digital filtering o n pulse shape
240 ( m s ]
Table 3 shows the calculated values for a selected set o f digital filters applied on acceleration pulse 1 , see Figure 3 .
1 1 1 l\cceleration pulse 1 acco r d i n g t o f i g . 3 C u t -o f t 1 Darnping 1 1
f requency 1 1 1 step w i d t h O , l l m s ) 1 step w i d t h 0 , 1 l m s ) 1 step w i tlth 0 , 1 { ms ] 1 1 1 l -----------------------+-----------------------+---------------------- - 1
{ H z ) 1 l dB/oc t ] 1 1 H H ; 'l' t 1 t i 1 ll I C VII t 1 t 2 H I C E t 1 t 2 1 -----------+----------++----------------------- 1 ----------------------- ----------------------- 1
l 7 1 5 1 - 2 9 , 2 I I 4 0 5 7 8 , 4 9 9 , 0 1 4115 6 7 , 6 1 0 6 , 2 4 0 5 7 8 , 3 9 9 , l 1 l 7 1 5 1 - 9 , 0 1 1 4 0 � 7 8 , 4 9 9 , 0 1 411� 6 7 , 6 1 0 6 , 2 4 0 � 7 8 , 3 9 9 , l l 4 7 0 1 - 2 4 , 0 I 1 4 0 � 7 8 , 4 9 Y , O 1 4 0 � 6 7 , l 1 0 5 , 6 4 0 5 7 8 , 3 9 9 , l l 1 5 0 1 - 7 , 7 I I 4 0 6 7 8 , 4 9 9 , 0 1 4 0 G 6 7 , 6 1 0 6 , 2 4 0 5 7 8 , 3 9 9 , l
1 0 0 1 - 1 5 0 , 0 1 1 4 0 7 7 9 , 4 9 8 , l 1 4 0 7 7 9 , 4 9 8 , l 406 7 8 , 9 9 8 , 2 1 0 0 1 - 9 9 9 , 0 1 1 4 0 8 7 9 , l 9 8 , � 1 4 0 � 7 9 , l , 8 , 5 4 0 8 7 8 , 8 9 8 , 5
- - - - - - - - - - - + - - --------++-- - - - - - - - - - - - - - - - - - - - - - - - - - - - - - - - - - - - - - - - - - - - - ----- -- -- ------------ --! 5 0 0 I - 1 5 1 1 4 0 G 7 8 , 4 9 9 , 0 4 0 6 6 7 , 6 1 0 6 , 2 4 0 5 7 8 , 3 9 9 , J 1 0 0 0 1 - 1 5 1 1 4 0 6 7 8 , 4 9 9 , 0 4 0 5 6 7 , 0 1 0 5 , 6 4 0 5 7 8 , 3 9 9 , J
7 5 0 1 - 1 5 1 1 4 0 � 7 8 , 4 9 9 , 0 4 0 � 6 7 , 6 1 0 6 , 2 4 0 5 7 8 , 3 9 9 , l 5 0 0 1 - 1 5 1 1 4 0 5 7 8 , 4 9 9 , 0 4 0 5 6 6 , 7 1 0 2 , 3 4 0 5 7 0 , 8 9 9 , l 2 0 0 1 - 1 5 1 1 4 0 5 7 8 , 5 9 9 , 0 4 0 � 6 6 , 7 1 0 2 , 3 4 0 5 7 0 , 5 9 9 , 1 1 0 0 I - 1 5 1 1 4 0 5 7 6 , 9 9 8 , 9 4 0 � 7 8 , 9 9 8 , Y 4 0 5 7 8 , 8 9 8 , 9
1 1 0 1 - 1 5 1 1 3 7 9 8 1 , 5 1 0 0 , 9 3 7 9 7 6 , 6 1 0 2 , 8 3 7 7 7 4 , 4 1 0 3 , 3 1 1 ------- ----+-----------+----------------------- ----------------------- ----------------------- 1 1 Mean CPU t i me per HIC 1 1 1 ca l c u l a t i on 1 l � : 3 7 0 : 1 4 O : 1 0 1 1 I m i n : sec ] 1 1
Table 3 : HIC values of acceleration pulse according to F i g . 3 , calculated for different digital filters . Additionally , three different calculation procedures are tested : HIC T : All samples are combined with each other , HIC VW and HIC E : iterative calculation procedure according to /WAGNER/ applied by VW and TUB (quoted from /MORRES / ) .
243
At the same time, various methods of calculation which were discussed below were tested . Table 3 shows clearly that digital filters with limit frequencies as low as 100 Hz modify the HIC value only insignificantly.
3 . 3 EFFECTS OF THE SAMPLE RATE
Digitization of the analog measuring signals for processing and storage in a computer is closely related to the filtering . Digitization is performed by scanning at discrete time s . Certain rules have to b e observed here , since the measuring signal must not be distorted by the sampling process . The sampling procedures are based on the SHANNON theorem whereby a harmonic signal with two points per period duration can be unambiguously reconstructed . Since , in the case of the measuring value s , we are dealing with a stochastic rather than a harmonic signal , it is recommended to perform five times the scanning compared with the filter cut-off frequencies. According to SAE J 2 1 1 , the minimum sampling rate corresponds to five times the value of the filter frequency at -3 dB , in other words at approx . 8000 Hz during acceleration measurements on the head.
In conjunction with the filtering and scanning of measuring signa l s , mention should be made of one possible source of error which is norma lly underestimated and therefore ignored; this is the " aliasing" effec t . Errors due to this effect can achieve a magnitude which considerably impairs the measuring accuracy.
The aliasing effect occurs with every sampling process based on a periodical sampling from a continuous proces s .
This effect can b e prevented using anti-aliasing filters ; these low-pass filters with a falling flank steepness of 24 or 30 dB per octave ( filter of fourth or fifth order) adequately limit the band of the measuring signal .
To return to the effects of digitization rates on the HIC values of crash signals : As with filtering , the effect is low. By reducing the scanning rate from 8000 Hz to 1000 Hz during evaluation of acceleration signals measured during col lision test s , the changes in the HIC values were less than 2 % .
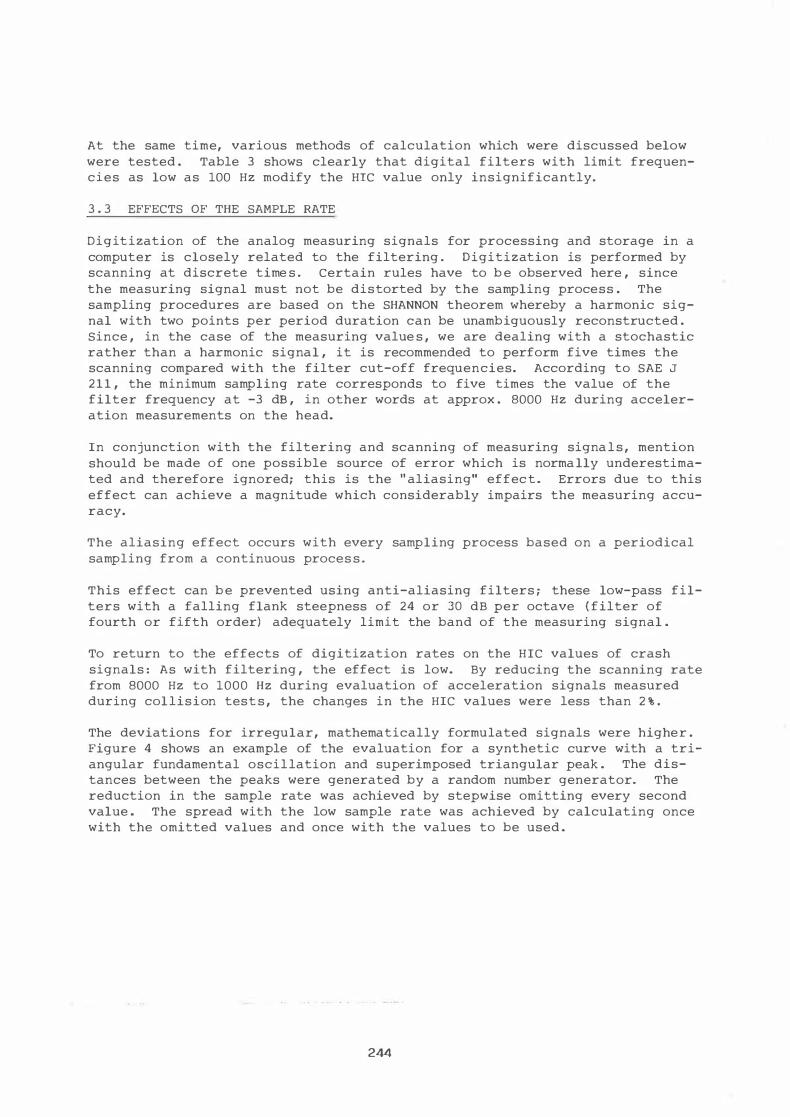
The deviations for irregular, mathematically formulated signals were higher . Figure 4 shows an example of the evaluation for a synthetic curve with a triangular fundamental oscil lation and superimposed triangular peak . The distances between the peaks were generated by a random number generator. The reduction in the sample rate was achieved by stepwise omitting every second value . The spread with the low sample rate was achieved by calculating once with the omitted values and once with the values to be used .
244
0 0-c
u J: ....... 0
.._ 0 .._ .._
w Q) > 0 Q) c.::
5
4
3
2
H z
16000 8000 4000 2000 1000 S a m p l e Rate
F i l t e r : F I L8 U P
F igure 4 :
Relative deviation of HIC values calculated for different sample rates for an irregular synthetic pulse shape : Basic triangle superimposed by triangular peaks , distances between peaks stochastic
The reason for the negligible effect of considerable reductions in filter limit frequencies and sample rates becomes clear when one considers the amplitude spectra of unfiltered crash signals . Figure 5 shows the spectrum of the measuring signal from Figure 3 . Above approx . 100 Hz , the measuring signal shown as an example contains only frequency components with low amplitude s .
245

80
Ol 60 { 1 c 0 :;::: d 40 L.. Q) -Q) u u 20 <(
0 0
Figure 5 :
-V \ - -
V' '--. r---... � � 60 � � �
Frequency [ Hz]
Amp l i tude spectrum of "unfi ltered" signal of Figure 3
3 . 4 DETERMINATION OF THE HEAD CONTACT AND ITS DURATION
300
I t was stated above that skull and severe brain injuries only occured during head impact against parts of the vehicle . Consequently , calculation of the HIC should only be carried out during the impact interval . Measurement of this interval can be performed by evaluation of high-speed film recordings and actuation of electrical contacts . Possible impact points on the vehicle and on the head of the dummy are coated with an electrically conducting material . When the two contact areas tauch , an electrical circuit is closed.
General ly , and particularly with weak head impacts , the contact duration can only be determined very inaccurately from film. By using electrical contact areas , it is generally possible to measure the start of contact accuratel y . High impact forces , however , frequently cause the surfaces to be damaged and thus the electrical circuit to be interrupted so that the end of the contact can only be determined very inaccurately.
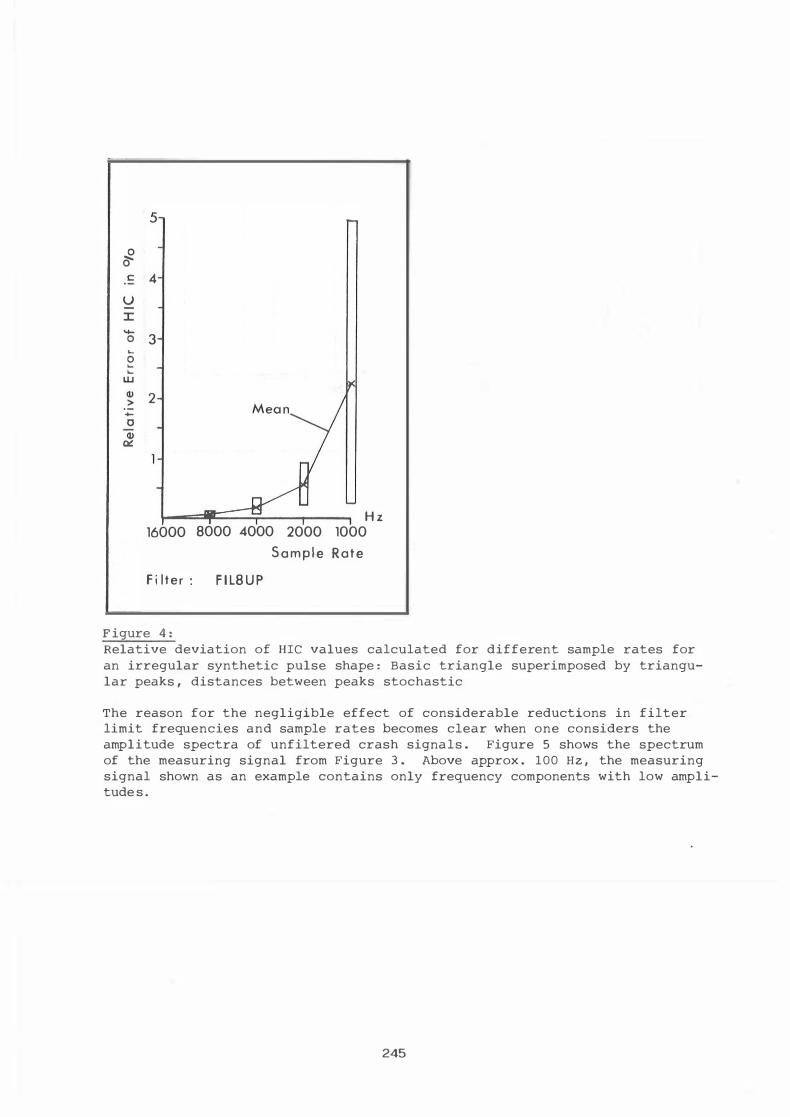
Dummy head drop tests in accordance with US PART 572 have shown that the calibrati:>n. values of the dummy head are only insignif icantly af fected by the application of contact paints and foils , see Table 4 .
246
H ead 1 •
Head 2 •
Head 3 ... ...
'l'able 4 : Head drop
Max imum resu ltant acce l e rotion
of dummy head ( g ) Bore
A l um i n i u m Con d u c t i n g foil covered paint coated
2 2 8 2 1 9 2 2 9
226 2 1 9 227
232 215 233
test results according to PART 572
Spec i f ication o f PART 5 7 2 :
2 1 0 g $ a $ 260 g max
Tests per formed at Union
Technique de l ' Automobile
et du Cycle ( UTAC)
Tests performed at BAS t ,
mean values o f 3 tests
Whilst the start of contact can be deterrnined electrically with a very high degree of accuracy, the acceleration signal of the head can be distorted and temporally displaced by analog filtering; as a result , parts of the impact forces would lie outside the impact period .
In contrast to the statement made earlier , this results in higher demands being made on analog filtering.
However, since the filtered signals are shifted backwards and only the start of contact can be deterrnined accurately, this problem is , in turn , insignificant if the HIC calculation is allowed to run fran the start of contact and the end of contact is ignored .
4 • THE NUMERIC-MATHEMATICAL ASPECT
The following section discusses the determination of the resulting head acceleration and its integration . Thereafter , HIC calculation rnethods are assessed with respect to prograrnning time , memory space requirement and , in particular , CPU time requirement . Finally, the sensitivity of the HIC calculation is examined with respect to the shifting of the interval limits .
4 . 1 DETERMINATION OF THE RESULTING ACCELERATION
The resulting acceleration is produced by vectorial addition fran the acceleration canponents of the body in x, y and z direction of the centre of gravity of the head : a = Ya 2 + a 2 + a 20• By using the resulting accel-eration in the HIC caltÜiation , xthe r�lativ� angle - for example between the acceleration vector and the vertical axis of the head - is ignored .
In view of the missing angle information the temporal sequence of the resulting acceleration a (t) is a factor which , fran a physical standpoint , must be regarded with s� caution . With single or double integration , an incorrect speed or path sequence normally results ( e . g . where the sign changes several times within one measuring channel) . Oscillating accelerations without sizeable effects on the head speed are added positively by squaring and lead to an increase in the area under a ( t ) . On the other hand , the oscil-res
247

lating accelerations rnust reach a considerable level (e .g . 30%) relative to the rnain loading in order to have a greater effect on the resultant acceleration (in this exarrple , approx . 10%) •
4 . 2 HIC CALCULATION METHOD
For an initial approxirnate calculation of the HIC for a given curve a (t) , the forrnulae in Table 2 can be used . In / 1 8 / , a graphic rnethod for d���rrnining the HIC is described . Nonnally, however, the HIC is calculated fran digitized rneasuring value sequences on the canputer .
For nurneric integration of the expression J ares (t) dt
mathernatical approxirnation rnethods are used , whereby
- the rectangular forrnula, - the trapezoidal f orrnula and - SIMPSON ' s (parabolic forrnula) rule
are the approxirnation rnethods rnost frequently used. All three procedures are rnore accurate the srnaller the step width. With the sarne step width, the parabolic forrnula is rnore accurate than the trapezoidal forrnula, which in turn is rnore accurate than the rectangular forrnula. With the high sarrpling rate of 8000 Hz demanded in the regulations , the selection of the integration rcethod is of no significance . With reduced scanning rates (down to 1000 Hz) , the application of the trapezoidal forrnula, see Figure 6 , for the HIC calculation of f ers a good canprornise between CPU time and cost on the one hand and the demands of accuracy on the other hand.
1 nteg ration
N - l � ( A i i = l
Figure 6: Integration procedure according to trapeziurn forrnula
The simplest, yet rnost tirne-consurning rnethod (basic HICT rnethod , see Table 3 ) of calculating the HIC value for a head acceleration sequence is to perforrn the integration for every possible canbination of digital values and then calculate the HIC value . The rnaxirnurn value is then the required HIC value .
For the acceleration sequence in Figure 3 , a high-power canputer systern requires rnore than 15 . 5 rninutes (see Table 3 ) . It is therefore necessary to look for rnore logical and rnore rapid rnethods .
248

In French-speaking countries , an approximation method is frequently used which starts with large steps and then rroves to ever finer steps to pin-point the tirres t
1 and t
2 of the HIC value . Initially , this method was intended
to be incluaed as an exemplary method in the ECE/GRCS draft regulations for the protection of occupants in head-on collisions / 1 9 / .
I n Gennan-speaking countries , mainly iterative methods are used which are based on mathematical analyses of the HIC equation published in /18 / . In this study, it was found that for the HIC value , the accelerations at tl and t
2 are on the same level . Furthermore , this acceleration level always ies
between 0 . 6 of the integral mean value and 0 . 6 of the maximum value of the acceleration sequence .
The study which initially aimed at a graphic determination of the HIC value requires only a single integral of the resulting acceleration function . Furthermore , horizontal lines of constant acceleration are placed through the curve in order to find the interval in which the HIC value is located. Consistent application of the above conditions enables the interval containing the HIC value to be found reliably and rapidly and, also allows an arbitrary level of accuracy to be obtained due to the iterative shift of the acceleration level between 0 . 6 x ä and 0 . 6 a •
max
Apart from its own canputer program (HICE according to /18/) , the TU Berlin also has a program from Volkswagen (HICVW) at its disposal. The capabilities of the above-mentioned three programs (HICT , HICE , HICVW) were investigated in a thesis reported in /16/. Table 3 shows an example for the results of the calculations for the acceleration curve from Figure 3 .
It can be seen that the iterative methods (HICE and HICVW) have a high degree of accuracy and also require considerably shorter CPU times (10 and 14 seconds respectively) .
4 . 3 EFFECT OF THE CALCULATION INTERVAL ON THE HIC VALUE
As already mentioned above , the HIC should only be calculated during the head contact tirre of a head impact . If this aspect is examined it becomes apparent that in crash testing the start of contact frequently lies within the interval limits t
1_ and t
2 of the HIC calculated over the entire acceleration se
quence. If the HIC calculation method is now applied fran the start of contact , new interval limits t
1• and t
2' are obtained , whereby t
1' is normally
at the start of contact and t2
' is slightly nearer to tl or t1
1 than is t2
. Furthermore, the HIC value now detennined is considerab y lower (normally 10 to 15% , maximum values even up to 50%) than that calculated over the entire acceleration sequence .
It must be taken care whether applied iteration methods still function correctly in limiting the calculation range . With the iteration method according to /18/ , for example , it must be noted that there is normally no functional value of the acceleration sequence at the new interval start t
1' .
249
5 . DISCUSSION OF VARIOUS HEAD PROTECTION CRITERIA
In FMVSS 208 , the HIC must be calculated over the entire head acceleration period . 1000 is set as the performance criterion limit value . The ECE/GRCS draft regulations stipulate that the head protection criterion is fulfilled if no head impact takes place . In the event of a head impact , the HIC equa- , tion should be applied fran the start of contact. The filter frequency for the acceleration signals is set at 600 Hz . The value 1000 is set as the limit. As a result of a study /20/ in which the variation between dmmy measured values in collision tests (method as in ECE/GRCS draft regulation) , a tolerance of +250 is pennitted .
Although the significance of rotatory acceleration on the head loading was pointed out during the EEC bicmechanics symposium in March 1983 in Brussels , no steps have yet been taken to include this in a head protection criterion (HPC) .
Other head protection criteria as shown in Table 1 (except SI) propose the application of head deformation as an injury criteria . If one wished to apply these criteria in durnny tests , the heads of the durnnies would have to be manufactured to high mechanical standards . The deformation measurement is very difficult since , as a rule , the point of head impact and the direction of irnpact is not known in advance. As a result, a durrmy head would have to be fitted with a large nurnber of deflection transducers or pairs of accel- ' eration transducers .
Furthenoc>re , the deformation measurements only take indirect and insufficient account of rotatory accelerations since only parts of the mechanical rnodel opposite the point of impact can be taken into consideration and not the ro- · tation itself.
lt would be worth considering whether mechanical rnodels which permit such measurements could not be better applied in canponent tests after the precise ; irnpact parameters had been detennined in a full scale test.
6 . SUMMARY
Influence of canbined loads of longitudinal and rotational acceleration on head injury c r i ter ia l evel s i s not wel l known today
- Rotational head acceleration should be considered in future HPC
- Filter characteristics distort acceleration signals but weakly affect HIC values
- High reduction of sample rate in digital data processing has low influence on HIC value
- T� synchronization of filtered acceleration signal events and undistorted event registration (filming, high frequency event markers) might be difficult
- Beginning of contact t� could easily be measured, while end of contact time could not be ascertained
250

- Conducting materials applied to the dummy head ( for the use as contact switch) have little influence on PART 572 head drop test results
- Several numerical procedures for HIC dete:rrnination gave sirnilar results
- Limiting the time interval for HIC calculation can cause a high reduction in the HIC value .
7. CONCLUSIONS
- In view of the fact that HIC or HPC = 1000 correlates only unsatisfactorily with head injuries , no proof has yet been given that purely translatory loads are not correctly evaluated
- Rotatory loads can be measured by attaching several linear acceleration transducers to the head of the dummy
- If calculation formulae sirnilar to the HIC equation are applied in the evaluation of rotatory accelerations , the increase in the quantity of digital data due to the increased number of measuring channels can be canpensated by a reduction in the cut-off frequency of the measuring channels to approx . 600 Hz (even 300 Hz when determining the filter characteristics) and reduction in the sample rate to 2000 per second .
8 . REFERENCES
1 . NIW-1AN , J .A. : Head Injury Criteria in Autcmotive Crash Testing. SAE Paper No . 801317. Proc . 24th Stapp Car Crash Conference , 1980 .
2 . GOLDSMITH , W . ; a1MAYA, A . K . : Head and Neck Injury Criteria and Tolerance Levels . The Bianechanics of Impact Trauma , pp. 149-187 , Amalfi 1983 , rcrs 1984 .
3 . FAERBER, E . ; GULICH , H . -A . ; HEGER, A. ; ROTER, G . : Bianechanische Belastungsgrenzen , Literaturstudie über die Belastbarkeit des Menschen beim Aufprall . "Unfall- und Sicherheitsforschung Straßenverkehr" , Volume 3 , BASt, Cologne , 1976 .
4 . HODGSON , V. R . ; PATRICK , L.M. : Resp:mse of the Human Cadaver Head . SAE Paper 68078 4 . Proc . 12th Stapp Car Crash Conference , 1968 .
5 . BRUN-cASSAN , F . ; FAYON , A . ; TARRIERE , C . : Tolerance of the Human Head at Impact : Reconstruction of Head Impacts Observed in True-Life Accidents . Seminar on "The Bianechanics of Impacts in Road Accidents" , Brussels 1983
6. SELLIER, K . : Das Schädel-Hirn-Trauma . " Rechtsmedizin" magazine 6 8 . Pp. 239-25 2 , Springer-Verlag , 1971 .
7. CMMAYA, A . K . : The Head : Kinematics and Brain Injury Mechanisms . The Biomechanics of Impact Trauma , pp . 127-138 , Amalfi 1983 , rcrs 1984 .
8 . GENNARELLI , T . A . : Clinical and Experimental Head Injury . The Biomechanics of Impact Trauma , pp. 103-1 1 6 , Amalfi 1983 , ICTS 1984 .
251

9 . SCHMIDr , G . ; KALLIERIS , D . ; BARZ , J. ; MATl'ERN , R . ; SCHULZ , F . : Belastbarkeitsgrenze und Verletzungsmechanik des angegurteten FahrzeugInsassen . FAT Schriftenreihe No . 6 . Frankfurt , 1978 .
10 • SACRESTE , J . ; BRUN-cASSAN , F . ; FAYON, A . ; TARRIERE , C . ; GC!r , C . ; PATEL , A . : Evaluation of the Influence Inter-Individual Differences on the Injury Level. Seminar on EEC Bianechanics Research Prograrrme . Brussels , 1983 .
1 1 . GURDJIAN, E . S . ; ROBERTS , V. L . ; THa.1AS , L .M. : Tolerance Curves of Acceleration and Intercranial Pressure and Protective Index in Experimental Head Injury . Journal of Trauma , 1964 .
1 2 . APPEL , H . ; KRAMER, F . ; HOFMANN , J . : Protection Criteria for Occupants and Pedestrians . ESV Conference , Paris 1979 .
13 . KRAMER, F . ; HEGER, A. ; MELZ , T . : Die Verwendung der Letalitätsrate unter Berücksichtigung der Unfallstatistik . Annual Report TUB 8201 to the BMFT Research Project " Insassenschutz" . Berlin, 1982 .
14 . Arn1AN, B . : Synthesis Report of the EEC Bianechanics Prograrnne . Proc . of the Seminar: "The Bianechanics of Impacts in Road Accidents" , Brussels 21-23 March 1983
15 • McELHANEY, J. H. ; STAINAKER , R . L . ; ROBERTS , V. L. : Bianechanical Aspects of Head Injury . Human Impact Response . Proc . of the Sympositnn on Human Impact Response , CM Research Laboratories, Warren , Michigan , 1972 .
16 . MORRES , H . : Berechnungsverfahren und Parametereinflüsse bei der Enniitlung von Durrrnybelastungswerten (Untersuchungen ztnn HIC) •
Thesis No. 14/82 (FG 1) , Technical University of Berlin 1984 .
17 . VERSACE , J . : A Review of the Severity Index . SAE Paper No . 710881 . Proceedings of the XV Stapp Car Crash Conference , 1971 .
1 8 . WAGNER, R . : Ein Verfahren zur iterativen Best.irrrnung des HIC-Wertes beim Kopfaufprall . Autcmobiltechnische Zeitschrift ATZ 7 8 , 1976 .
1 9 . Economic Conrnission of Europe: Draft Regulation : Unifonn Provisions Concerning the Approval of Private (Passenger) Cars with Regard to the Ptotection of the Occupants in the
Event of Head-On Collisions , August 1983 .
2 0 . FAERBER, E . : Streuung von Schutzkriterien in kontrollierten Aufprallversuchen gegen die 30° Barriere . Research Reports of the Federal Highway Research Institute , Accident Research Division , No. 826 7 , 1983 . (Translated into English : Highway Safety Literature, NHTSA 385735) .
252