on NASA’s
57
A severe winter storm pummeled the Pacific Northwest in late January 2012, icing roads, downing power lines, and prompting avalanche warnings. On January 20, more than 250,000 customers were without electricity, as utility crews struggled to restore power, news sources said. Rising temperatures and potential new rainfall raised the possibility of flooding in the days that followed. Snow still blanketed much of Washington state on January 23, 2012, when the Moderate Resolution Imaging Spectroradiometer (MODIS) on NASA’s Terra satellite captured these images. The top image is a natural-color scene similar to what our eyes would see from the sky. The bottom image is a false-color scene that better distinguishes between snow and clouds. Ice and snow are red. Liquid-water clouds are white, and ice clouds are peach. Vegetation is bright green. Snow blankets the region east of Seattle and Portland, stretching all the way to the Idaho border. In the band of forest along the Pacific Coast, snow may be more prevalent than it appears, as it is sometimes hidden from satellite imagers by trees. Warmer air blew into the region soon after the storm, adding to hazardous conditions. Flooding closed roads and forced some residents into emergency shelters. On January 23, KVAL reported that a fresh storm was approaching the region and might drop several inches of rain. The National Weather Service issued a flood warning for the Portland area, as the new round of rain had the potential to push rivers into flood stage. References 1
Transcript of on NASA’s

A severe winter storm pummeled the Pacific Northwest in late January 2012, icing roads, downing power lines, and prompting avalanche warnings. On January 20, more than 250,000 customers were without electricity, as utility crews struggled to restore power, news sources said. Rising temperatures and potential new rainfall raised the possibility of flooding in the days that followed.
Snow still blanketed much of Washington state on January 23, 2012, when the Moderate Resolution Imaging Spectroradiometer (MODIS) on NASA’s Terra satellite captured these images. The top image is a natural-color scene similar to what our eyes would see from the sky. The bottom image is a false-color scene that better distinguishes between snow and clouds. Ice and snow are red. Liquid-water clouds are white, and ice clouds are peach. Vegetation is bright green.
Snow blankets the region east of Seattle and Portland, stretching all the way to the Idaho border. In the band of forest along the Pacific Coast, snow may be more prevalent than it appears, as it is sometimes hidden from satellite imagers by trees.
Warmer air blew into the region soon after the storm, adding to hazardous conditions. Flooding closed roads and forced some residents into emergency shelters. On January 23, KVAL reported that a fresh storm was approaching the region and might drop several inches of rain. The National Weather Service issued a flood warning for the Portland area, as the new round of rain had the potential to push rivers into flood stage.
References
1

2

3
Note that the absorption features become deeper and broader (more
wavelengths involved) as water vapor in the atmosphere increases.

4

5

6

7

8

9
Note that near 1000 nm, that the wavelength of maximum absorption for
water vapor is at the shortest wavelength, then liquid water and frozen
water at the longest wavelength.

10

Forward Inversion results for:
V=vegetation
R=rock
LS=low altitude snow
HS= high altitude snow


13

14

15

16

17

18
Shorter Wavelengtrhs penetrate to deeper depths. Some light can be reflected
from bottom. Note refraction between air and water.

19
Scattering in the blue is why water appears blue to our eyes.

20
Note that as the depth of water becomes deeper the maximum transmission
wavelengths are shifted toward the blue part of the spectrum

21

The islands were named "Dry Tortugas" upon discovery by Ponce de Leon in
1513 -- "tortugas" means turtles in Spanish, and the islands are "dry" as no fresh
water is found on them. From the air, the islands present an atoll-like
arrangement, however no central volcanic structure is present. The islands are
only accessible by boat or seaplane; nevertheless they have been designated
the Dry Tortugas National Park, and are visited by hundreds every year. This
view highlights three islands in the group; Bush Key, Hospital Key, and Garden
Key -- the site of Fort Jefferson. Fort Jefferson is a Civil War era fort, perhaps
most notable for being the prison of Dr. Samuel Mudd, who set the broken leg of
John Wilkes Booth following Booth's assassination of President Lincoln. The fort
itself is currently undergoing extensive restoration to prevent collapse of the
hexagonal outer walls (center). The islands stand out due to brown and light tan
carbonate sands visible above the Gulf of Mexico water surface. Light blue-
green irregular masses in the image surrounding the islands are coral reef tops
visible below the water surface.
22

vast maze of reefs, passages, and coral cays (islands that are part of the reef). This nadir true-color image was acquired by the Multi-angle Imaging Spectroradiometer (MISR) instrument on August 26, 2000, and shows part of the southern portion of the reef adjacent to the central Queensland coast. The width of the MISR swath is approximately 380 kilometers, with the reef clearly visible up to approximately 200 kilometers from the coast. It may be difficult to see the myriad details in the browse image, but if you retrieve the higher resolution version, a zoomed display reveals the spectacular structure of the many reefs.
The more northerly coastal area in this image shows the vast extent of sugar cane cultivation, this being the largest sugar producing area in Australia, centered on the city of Mackay. Other industries in the area include coal, cattle, dairying, timber, grain, seafood, and fruit. The large island off the most northerly part of the coast visible in this image is Whitsunday Island, with smaller islands and reefs extending southeast, parallel to the coast. These include some of the better known resort islands such as Hayman, Lindeman, Hamilton, and Brampton Islands.
Further south (in the high-resolution version), just inland of the small semicircular bay near the right of the image, is Rockhampton, the largest city along the central Queensland coast, and the regional center for much of central Queensland. Rockhampton is just north of the Tropic of Capricorn. Its hinterland is a rich pastoral, agricultural, and mining region.
23

24

25

26
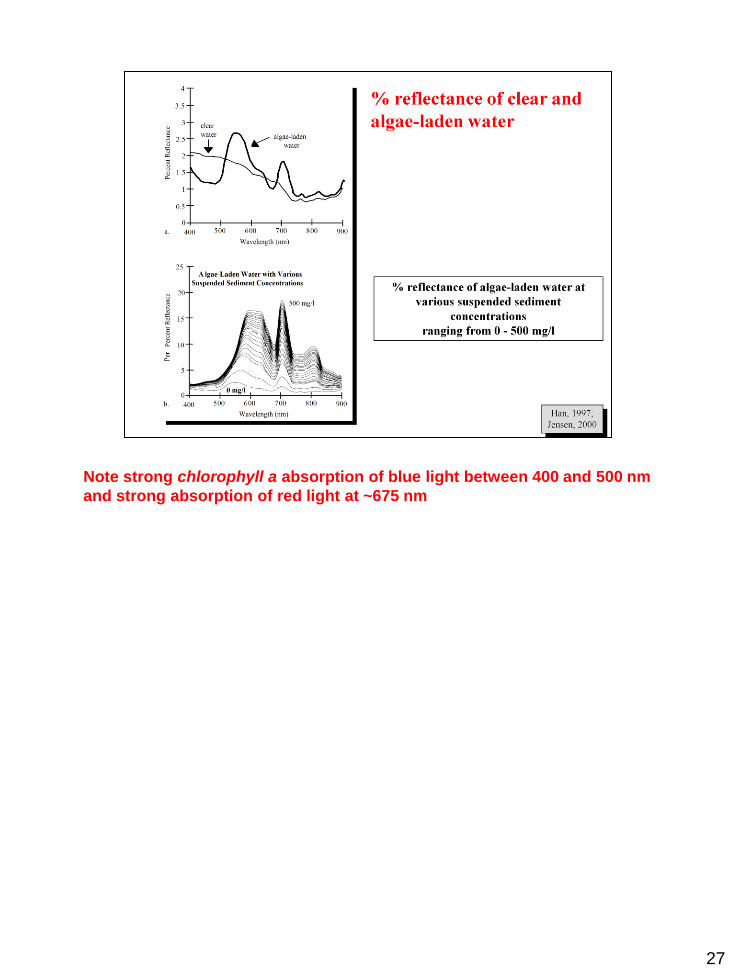
In situ spectroradiometer Measurements
27
Note strong chlorophyll a absorption of blue light between 400 and 500 nm
and strong absorption of red light at ~675 nm

The waters around New Zealand’s Chatham Islands teem with life. The highly
productive waters support massive phytoplankton blooms that sustain valuable
stocks of fish. This image, taken by the Moderate Resolution Imaging
Spectroradiometer (MODIS) on NASA’s Aqua satellite on December 5, 2010,
shows the large annual spring-time bloom.
The bloom is an array of colors from deep green to electric blue, and is probably
made up of many different types of marine life, primarily phytoplankton. The
phytoplankton, plant-like organisms, contribute to making the ocean in this
region a carbon sink, a place where the ocean takes in more carbon dioxide than
it releases into the atmosphere.
The ocean is productive in this region because the topography of the ocean floor
brings two currents together around the Chatham Islands. The islands sit on the
Chatham Rise, an underwater plateau that stretches from New Zealand’s South
Island east to just beyond the Chatham Islands. The water north and south of
the plateau is very deep. Cold, nutrient-rich, but iron-poor water from the
Antarctic flows south of the Chatham Rise. To the north is mostly warm, nutrient-
poor, but iron-rich water from the subtropics.
The two pools of water come together in a current that rides over the plateau,
mixing cold water with warm. The mixed water in the current provides both the
nutrients and iron fertilizers needed to support large blooms around the Chatham
Islands. The current, and therefore, the bloom, is strongest in the spring and fall.
28

Ocean waters glowed peacock green off the northern Namibian coast in late
November 2010. The Moderate Resolution Imaging Spectroradiometer (MODIS)
on NASA’s Terra satellite captured this natural-color image on November 21,
2010.
These bright swirls of green occur along a continental shelf bustling with
biological activity. Phytoplankton blooms often occur along coastlines where
nutrient-rich waters well up from ocean depths. The light color of this ocean
water suggests the calcite plating of coccolithophores.
Farther south along the coast of Namibia, hydrogen sulfide eruptions occur fairly
frequently. According to a study published in 2009, ocean currents deliver
oxygen-poor water from the north, while the bacteria that break down
phytoplankton also consume oxygen, depleting the supply even more. In this
oxygen-poor environment, anaerobic bacteria produce hydrogen sulfide gas.
When the hydrogen sulfide finally reaches oxygen-rich surface waters, pure
sulfur precipitates into the water. The sulfur’s yellow mixes with the deep blue
ocean to make bright green.
So this swirl of bright green could contain phytoplankton, sulfur, or a combination
of the two.
29

30
31
32

33
21 Scandium, 22 Titanium, 23 Vanadium, 24 Chromium, 25 Manganese, 26
Iron, 27 Cobalt, 28 Nickel, 29 Copper, 30 Zinc
40 Zirconium, 42 Molybdenum, 43 Technetium, 44 Ruthenium, 45
Rhodium, 46 Lead, 47 Silver, 28 Cadmium
78 Platinum, 79, Gold, 80 Mercury

34

35
Surface to volume ratio: smaller grains have higher surface to volume ratio, so
usually more scattering occurs in smaller grains vs. larger grains, and
reflectance is typically higher in the VNIR.
Beer’s Law: states that as light is transmitted through a path of a certain length,
the absorbance is directly proportional to the concentration of a solution. If you
plot absorbance versus concentration, the resulting graph yields a straight line.

36
Comparison of laboratory spectral signatures and airborne hyperspectral imager
(AVIRIS) spectra for three minerals: kaolinite (a type of clay), allunite (another
type of clay) and buddingtonite (a rare mineral sometimes associated with gold
deposits)

37
Contrast with soils and plants

38

39

40
In a solid (like a crystal) electrons may be shared causing the energy levels to be smeared over a
range. Energy level depends on valance state of atom (e.g., Fe+2, Fe+3), coordination number,
and symmetry of the site.
The electrons can move freely within the orbitals of the molecular lattice and so electrons
become detached from its atom. The electrons are said to be delocalised. The metal is held
together by the strong forces of attraction between the positive nuclei and the delocalised
electrons.

41
Transfer of an electron between ions or between ions and ligands. Can occur
with different valence states in a metal (e.g., Fe+2 and Fe+3).
A ligand is an atom, ion or functional group that donates its electrons through a
coordinated covalent bond to one or more central atoms or ions, usually metals.
An array of such ligands around a center is termed a complex.
CTA are generally diagnostic of specific minerals. They typically occur in the UV
and have wings that extend into the visible. The shape may change with grain
size. Absorption bands rapidly decrease in intensity in small sized grains
because of the increased surface/volume ratio.
(Left) Reflectance spectra of the iron oxide hematite (Fe2O3) [ion Fe+3] and iron
hydroxide goethite (FeO-OH), [Fe+2] from Clark et al., 1993b). The intense
charge-transfer band in the UV (< 0.4 µm) is "saturated" in reflectance, so only
first surface (specular) reflection is seen in these spectra. The 0.9-µm and 0.86-
µm absorption features are due to Laporte-forbidden transitions (e.g. Morris et
al, 1985; Sherman, 1990 and references therein). The absorption at 2.7-3.0 µm
is due to trace water in the samples., and in the case of goethite, the OH. The
goethite spectrum is offset upward 0.2 units.
(Right) For mid-infrared wavelengths, without offsets
42
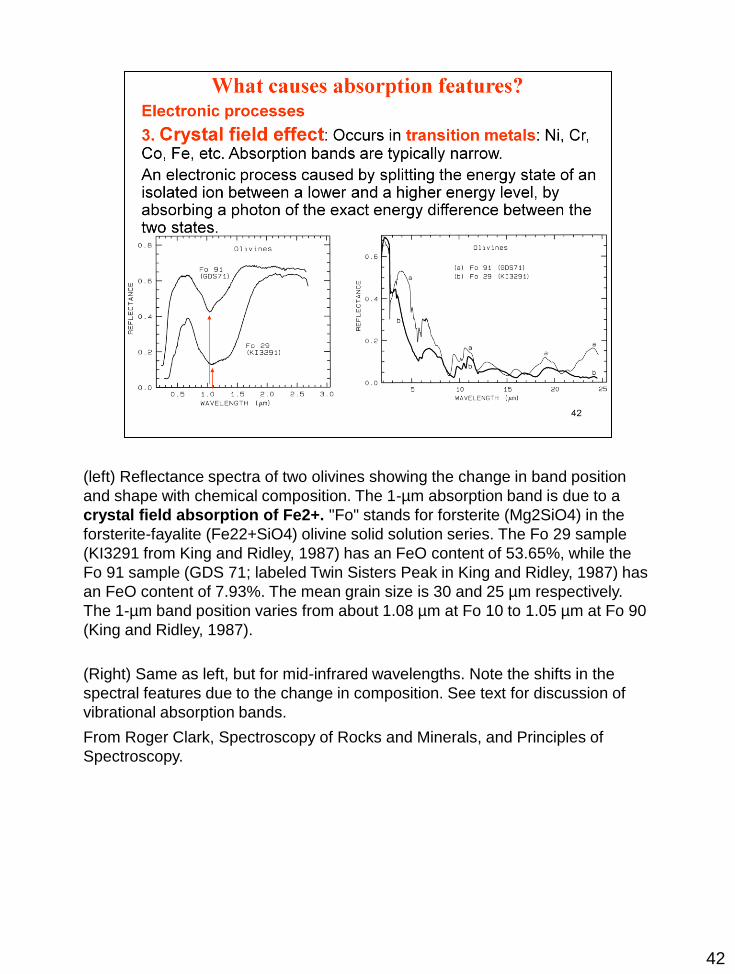
(left) Reflectance spectra of two olivines showing the change in band position
and shape with chemical composition. The 1-µm absorption band is due to a
crystal field absorption of Fe2+. "Fo" stands for forsterite (Mg2SiO4) in the
forsterite-fayalite (Fe22+SiO4) olivine solid solution series. The Fo 29 sample
(KI3291 from King and Ridley, 1987) has an FeO content of 53.65%, while the
Fo 91 sample (GDS 71; labeled Twin Sisters Peak in King and Ridley, 1987) has
an FeO content of 7.93%. The mean grain size is 30 and 25 µm respectively.
The 1-µm band position varies from about 1.08 µm at Fo 10 to 1.05 µm at Fo 90
(King and Ridley, 1987).
(Right) Same as left, but for mid-infrared wavelengths. Note the shifts in the
spectral features due to the change in composition. See text for discussion of
vibrational absorption bands.
From Roger Clark, Spectroscopy of Rocks and Minerals, and Principles of
Spectroscopy.

43
Spectra of two pyroxenes. Note shift in band position and shape between
samples of different mineral compositions

44
(Left) Reflectance spectra of rare-earth oxides, showing absorptions in the
visible region. Spectra are offset 1.0 units for clarity. Spectral resolution is about
1 nm.
(Right) Reflectance spectra of rare-earth oxides. These absorptions are due to
crystal-field transitions involving deep-lying electrons of the rare-earth elements
and do not shift when the rare-earth ion is in another mineral. Each spectrum is
offset by 1.0 units for clarity.
Spectra from Clark et al. (1993b).

45
National Institute of Standards and Technology (NIST)
See Rare Earth spectra in previous lecture. The narrow band spectral features
are used to determine wavelength calibration. Holmium Oxide for UV-VIS-NIR
applications
Dysprosium Oxide for NIR applications
Erbium Oxide for VIS-NIR applications

46
A dielectric material contains polar (partially charged) molecules. An applied
electric field will polarize the material by orienting the dipole moments of polar
molecules.
Cinnabar is HgS
In compounds of sulfur (where known), the most common oxidation numbers of
sulfur are: 6, 4, 2, and -2.
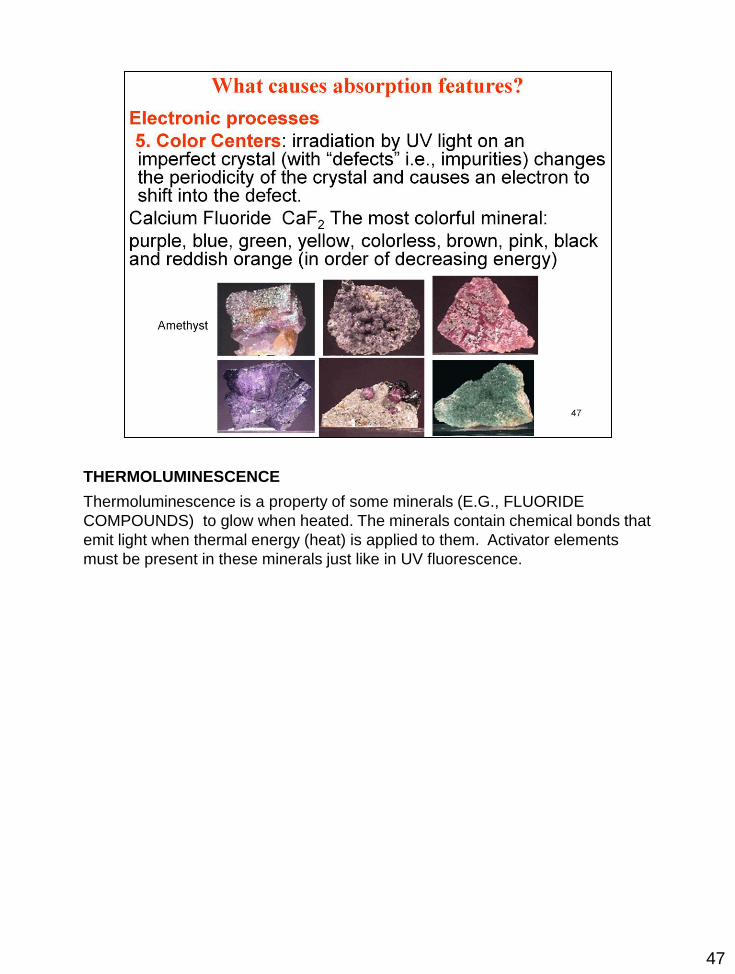
47
THERMOLUMINESCENCE
Thermoluminescence is a property of some minerals (E.G., FLUORIDE
COMPOUNDS) to glow when heated. The minerals contain chemical bonds that
emit light when thermal energy (heat) is applied to them. Activator elements
must be present in these minerals just like in UV fluorescence.

48

49

50
Vibrational bands due to OH, CO3, and H2O
Some materials have important vibrational absorptions: water,
hydroxyl, carbonates, phosphates, borates, arsenates,
vanadates (metallic elements that combine with vanadium (VO4)-3
(VO3)-1 radicals)

51
Vibrational bands due to OH and H2O

52
Vibrational bands due to OH

53

54
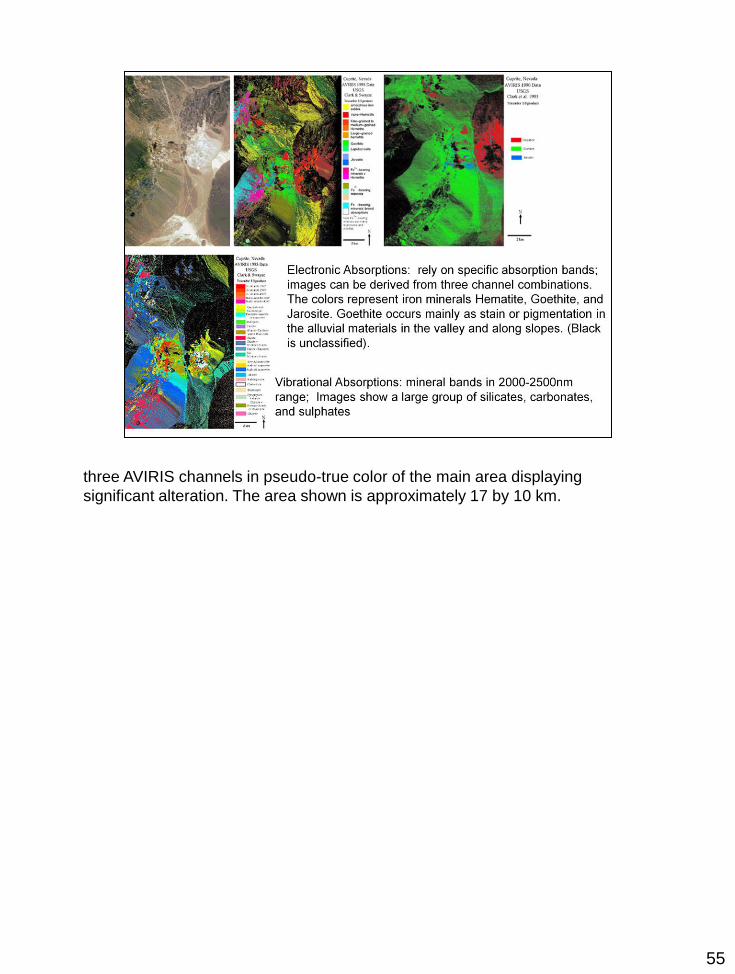
three AVIRIS channels in pseudo-true color of the main area displaying
significant alteration. The area shown is approximately 17 by 10 km.
55

56
An example of "spectrolithologic mapping" using only 4 minerals: hematite,
goethite, halloysite, and montmorillonite. The minerals in their various
compositions allow each formation to be distinguished and mapped. The outlines
were derived based on the mineralogic boundaries, and agree well with
published geologic maps.
Clark, R.N., A.J. Gallagher, and G.A. Swayze, Material Absorption Band Depth
Mapping of Imaging Spectrometer Data Using a Complete Band Shape Least-
Squares Fit with Library Reference Spectra, Proceedings of the Second Airborne
Visible/Infrared Imaging Spectrometer (AVIRIS) Workshop. JPL Publication 90-
54, 176-186, 1990.
Clark, R.N., G.A. Swayze, A. Gallagher, N. Gorelick, and F. Kruse, Mapping with
Imaging Spectrometer Data Using the Complete Band Shape Least-Squares
Algorithm Simultaneously Fit to Multiple Spectral Features from Multiple
Materials, Proceedings of the Third Airborne Visible/Infrared Imaging
Spectrometer (AVIRIS) Workshop, JPL Publication 91-28, 2-3, 1991.

57