
NASA’s Optical Program on Ascension Island: Bringing MCAT ...
13
NASA’s Optical Program on Ascension Island: Bringing MCAT to Life as the Eugene Stansbery-Meter Class Autonomous Telescope (ES-MCAT) S. M. Lederer 1 , P. Hickson 2 , H. M. Cowardin 3 , B. Buckalew 4 , J. Frith 3 , R. Alliss 5 1 NASA Johnson Space Center, Orbital Debris Program Office 2 University of British Columbia/Euclid Research 3 Univ. Texas El Paso, 4 JETS/Jacobs, 5 Northrop Grumman Corp ABSTRACT In June 2015, the construction of the Meter Class Autonomous Telescope was completed and MCAT saw the light of the stars for the first time. In 2017, MCAT was newly dedicated as the Eugene Stansbery-MCAT telescope by NASA’s Orbital Debris Program Office (ODPO), in honour of his inspiration and dedication to this newest optical member of the NASA ODPO. Since that time, MCAT has viewed the skies with one engineering camera and two scientific cameras, and the ODPO optical team has begun the process of vetting the entire system. The full system vetting includes verification and validation of: (1) the hardware comprising the system (e.g. the telescopes and its instruments, the dome, weather systems, all-sky camera, FLIR cloud infrared camera, etc.), (2) the custom-written Observatory Control System (OCS) master software designed to autonomously control this complex system of instruments, each with its own control software, and (3) the custom written Orbital Debris Processing software for post-processing the data. ES-MCAT is now capable of autonomous observing to include Geosyncronous survey, TLE (Two-line element) tracking of individual catalogued debris at all orbital regimes (Low-Earth Orbit all the way to Geosynchronous (GEO) orbit), tracking at specified non-sidereal rates, as well as sidereal rates for proper calibration with standard stars. Ultimately, the data will be used for validation of NASA’s Orbital Debris Engineering Model, ORDEM, which aids in engineering designs of spacecraft that require knowledge of the orbital debris environment and long-term risks for collisions with Resident Space Objects (RSOs). 1. INTRODUCTION An autonomous system by design, the Eugene Stansbery – Meter Class Autonomous Telescope (ES-MCAT, also historically called MCAT) was installed on Ascension Island in the South Atlantic Ocean. The prime driver for selecting where to deploy this telescope was largely the desire to expand operational coverage of a US-controlled optical telescope at a unique location not currently covered by other US observatories. At (7º 58ʹ S, 14º 24ʹ), it is perfectly suited for Low Inclination Low-Earth Orbit (LILO) observations from a site controlled by the US Air Force 45 th Space Wing, Detachment 2. It fills a geographical gap in longitudinal coverage by the US-run GEODSS (Ground-based Electro-Optical Deep Space Surveillance) network of telescopes, providing access to a region of the Geosynchronous (GEO) belt previously covered by the (now closed) Mor ón, Spain site. The primary observing goal for MCAT is to statistically characterize under-sampled orbital regimes, with emphasis on monitoring the GEO debris belt to determine the distribution function of debris. The prime objective is to monitor and assess the orbital debris environment by surveying, detecting, and tracking orbiting objects at all orbital altitudes: Low Earth Orbit (LEO), Medium Earth Orbit (MEO), Geo Transfer Orbit (GTO), and Geosynchronous Orbits (GEO). MCAT can also be used to track and characterize a Resident Space Object (RSO), defined here as an artificial object orbiting Earth, whose orbital elements are known. As a dedicated NASA asset, MCAT can be tasked for rapid response to break-up events after they have occurred, and is intended to become a contributing sensor for the Space Surveillance Network (SSN) for the purposes of Space Situational Awareness (SSA).
Transcript of NASA’s Optical Program on Ascension Island: Bringing MCAT ...

NASA’s Optical Program on Ascension Island: Bringing MCAT to Life as the Eugene
Stansbery-Meter Class Autonomous Telescope (ES-MCAT)
S. M. Lederer1, P. Hickson2, H. M. Cowardin3, B. Buckalew4, J. Frith3, R. Alliss5
1NASA Johnson Space Center, Orbital Debris Program Office
2University of British Columbia/Euclid Research 3Univ. Texas El Paso,
4JETS/Jacobs, 5Northrop Grumman Corp
ABSTRACT
In June 2015, the construction of the Meter Class Autonomous Telescope was completed and MCAT saw the light
of the stars for the first time. In 2017, MCAT was newly dedicated as the Eugene Stansbery-MCAT telescope by
NASA’s Orbital Debris Program Office (ODPO), in honour of his inspiration and dedication to this newest optical
member of the NASA ODPO. Since that time, MCAT has viewed the skies with one engineering camera and two
scientific cameras, and the ODPO optical team has begun the process of vetting the entire system.
The full system vetting includes verification and validation of: (1) the hardware comprising the system (e.g. the
telescopes and its instruments, the dome, weather systems, all-sky camera, FLIR cloud infrared camera, etc.), (2) the
custom-written Observatory Control System (OCS) master software designed to autonomously control this complex
system of instruments, each with its own control software, and (3) the custom written Orbital Debris Processing
software for post-processing the data.
ES-MCAT is now capable of autonomous observing to include Geosyncronous survey, TLE (Two-line element)
tracking of individual catalogued debris at all orbital regimes (Low-Earth Orbit all the way to Geosynchronous
(GEO) orbit), tracking at specified non-sidereal rates, as well as sidereal rates for proper calibration with standard
stars.
Ultimately, the data will be used for validation of NASA’s Orbital Debris Engineering Model, ORDEM, which aids
in engineering designs of spacecraft that require knowledge of the orbital debris environment and long-term risks for
collisions with Resident Space Objects (RSOs).
1. INTRODUCTION
An autonomous system by design, the Eugene Stansbery – Meter Class Autonomous Telescope (ES-MCAT, also
historically called MCAT) was installed on Ascension Island in the South Atlantic Ocean. The prime driver for
selecting where to deploy this telescope was largely the desire to expand operational coverage of a US-controlled
optical telescope at a unique location not currently covered by other US observatories. At (7º 58ʹ S, 14º 24ʹ), it is
perfectly suited for Low Inclination Low-Earth Orbit (LILO) observations from a site controlled by the US Air
Force 45th Space Wing, Detachment 2. It fills a geographical gap in longitudinal coverage by the US-run GEODSS
(Ground-based Electro-Optical Deep Space Surveillance) network of telescopes, providing access to a region of the
Geosynchronous (GEO) belt previously covered by the (now closed) Morón, Spain site.
The primary observing goal for MCAT is to statistically characterize under-sampled orbital regimes, with emphasis
on monitoring the GEO debris belt to determine the distribution function of debris. The prime objective is to monitor
and assess the orbital debris environment by surveying, detecting, and tracking orbiting objects at all orbital
altitudes: Low Earth Orbit (LEO), Medium Earth Orbit (MEO), Geo Transfer Orbit (GTO), and Geosynchronous
Orbits (GEO). MCAT can also be used to track and characterize a Resident Space Object (RSO), defined here as an
artificial object orbiting Earth, whose orbital elements are known. As a dedicated NASA asset, MCAT can be tasked
for rapid response to break-up events after they have occurred, and is intended to become a contributing sensor for
the Space Surveillance Network (SSN) for the purposes of Space Situational Awareness (SSA).

2. INSTRUMENTATION AND TECHNICAL SPECS
2.1 ES-MCAT Telescope and Instrumentation
The ES-MCAT telescope is a 1.3m Ritchey-Cretien f/4 DFM Engineering telescope (Fig. 1). Its uniquely designed
double-horseshoe equatorial mount allows for uninterrupted tracking through the zenith at this low latitude site. This
hydraulic-based mount is capable of tracking objects at all Earth orbiting regimes, from LEO to GEO. The fast-
tracking 7-meter Observadome, with a variable speed azimuth drive, can easily accommodate all desired track rates.
Fig. 1: Left: The ES-MCAT Observatory is comprised of the 1.3-m ES-MCAT telescope (larger building on the
right) and a tower platform (left) that will house a 0.4-m Officina Stellare telescope by 2018 [2]. The weather mast
can be seen between the two telescopes. Right: The 1.3-m ES-MCAT (a.k.a. MCAT) telescope, demonstrating the
horseshoe mount that allows it to track smoothly through the zenith at Ascension’s low latitude site.
Instrumentation on MCAT includes an optical 1100S Spectral Instruments (SI) cryogenically-cooled CCD camera
with a Grade 1 e2v back thinned 4k x 4k chip with a midband coating, a 41ʹ x 41ʹ field of view (FOV), and Time
Delay Integration (TDI) readout capability, whereby the charge on the CCD is shifted in reverse so that the debris
objects are seen as point sources and the stars are seen as streaks. TDI mode aids in conducting GEO surveys by
counter-sidereal scanning with the camera, eliminating the need to reposition the telescope after every integration,
and thereby alleviating undue stress on the telescope drives]. A Uniblitz mechanical shutter is mounted to the front
face of the SI Camera. A DFM-designed 8-position filter slide contains a suite of research grade broadband filters,
including a set of Sloan Digital Sky Survey (SDSS) griz filters, and Johnson/Kron-Cousins BVRI filters.
Within the optical path lies an aspheric field corrector to flatten and correct astigmatism over the 0.96-degree
unvignetted field of view of MCAT. Both the primary and secondary mirror are currently coated with their original
protected aluminum coatings. The SI camera fused silica window has an anti-reflection (AR)coating, resulting in an
optical wavelength range of 0.3 – 1.06 µm. Additional details on instrumentation can be found in Lederer et al. [1, 2,
3].
An independent FLIR Systems, Inc. infrared camera (spectral range of 7.5 – 13µm) is deployed above the secondary
mirror on the spider vein of the telescope. Its field of view encompasses the width of the Observadome aperture.
This camera’s sole role is to quantitatively assess the sky transparency and thereby the photometric conditions of
each image taken. (See Sec. 3.3 for more details)
2.2 Weather Sensors
Ascension Island is located in the middle of the Atlantic Ocean, where local weather is dictated by the unique eco-
system and geography of the island, meaning it is unpredictable and can change with little warning. As such, a suite
of weather sensors that monitor not just standard weather information (wind, humidity, temperature, pressure), but
also respond sensitively to very light rain is of utmost importance. The dust on this volcanic island is acidic and

when combined with water, is harmful for a front-illuminated mirror, even one with a protected aluminum coating
(see Sec. 3.2) like MCAT.
With this in mind, a suite of 8 weather sensors (two each of four different sensors) monitors the skies for conditions
that may warrant closing the observatory if they exceed acceptable values. These conditions include outside
temperature, dew point temperature, humidity, wind, and rain. Each station is queried and monitored by the
Observatory Control System (OCS) software. Sensors include 2 each of (1) Davis Vantage Pro2, (2) Optical
Scientific Inc., ORG (Optical Rain Gauge), (3) ASE rain sensor 8C, and (4) Boltwood Cloud Sensor. All sensors
save one OSI sensor are located on the weather mast that is located 75-feet SE of MCAT. This location is nearly
always upwind owing to the constant and steady ESE trade-winds (Fig. 1).
If any sensor detects rain, the observatory is closed. If humidity levels exceed 90%, or the wind speed exceeds 35
mph sustained or 45 mph gusts, the observatory closes. It must then maintain at least 20 minutes with humidity less
than 85%, wind speed less than 30 mph and no gusts greater than 45 mph to allow the observatory to open.
In addition, thermocouples have been attached to the primary mirror to allow the temperature of the mirror and the
ambient air to be compared with dew point temperature to ensure the dome closes (which activates the dehumidifiers
in the dome) if there is threat of dew forming on the mirrors. If the air temperature is within 3°F of the dew point
temperature, the observatory closes. It must remain at least 5°F below the dew point temperature for 20 minutes
before the observatory is allowed to open.
3. MCAT CAPABILITIES
The OCS master software, developed by Euclid Research Corp, is custom software that queries and controls all
functions of the observatory, including the full suite of hardware, instrumentation, and the software controlling each
system. It is designed for maximum autonomy in data collection and processing. This requires the master software to
be the eyes and brain that typically is fulfilled by an on-site observer.
For example, this master OCS software commands the SI camera software for collecting data, the DFM Telescope
Control System (TCS) for moving the telescope and controlling the dome, and the infrared FLIR camera (see Sec.
3.3) for monitoring cloud opacity. It also queries output data from each of the weather sensors, controls all daemons,
and can turn outlets on and off for instrumentation or equipment plugged into Power Distribution Units (PDUs).
Autonomous observing is fully controlled by a script read by OCS, and data pre-processing and calibration (See Sec.
5) is conducted at the end of the night by OCS. Post-processing is completed at NASA JSC by the companion
Orbital Debris Processing (ODP) software (developed by Euclid Research), which will be discussed in a future
publication.
3.1 Autonomous Observing
MCAT will largely be tasked for surveying the sky for the purpose of statistically characterizing the orbital debris
environment. As such, it will be used for surveys in LEO as well as GEO and potentially for future surveys to
identify objects in GTO or other elliptical orbits. For an optical telescope, objects in LEO can only be observed at
twilight (dusk or dawn) when the RSOs are illuminated by the sun, before they enter or after they leave the Earth’s
shadow. This limits MCAT to observing LEO or LILO objects during an approximately 2-hour period at the
beginning and end of each night.
A script detailing the observations to be made on a given night is generated by ODPO staff and uploaded to the
MCAT system. The observing mode under which the data are collected is specified for each set of images to be
taken (e.g. GEO, Sidereal Track, Rate Track, Orbit Track, Object [TLE] Track, Stare – see Sec. 4 for more details),
and if needed, the non-sidereal rate of motion desired by specifying right ascension (RA) and declination (Dec
rates). Total number of exposures to take, exposure time, filter, image bin size (e.g. 1x1, 2x2, 4x4, 8x8), and
exposure type (e.g. bias, flat, dark, or, for most science images with exposure times noted – light) can also be
specified. Each line in the script defining a set of observations to be taken can also specify limits for seeing
conditions, maximum acceptable cloud opacity, RSO illumination, maximum lunar illumination (phase of the
moon), lunar phase angle (angular distance from the object to the Moon), and similarly the solar phase angle.

On a typical night, the observatory follows routine scheduling, which includes:
Start of night script: Check weather sensors to ensure it is safe to open the telescope. Run start-up procedures,
including: open the dome and primary mirror covers, turn off dehumidifiers and the air conditioning system. Turn on
all needed hardware and instrumentation (e.g. telescope drives, dome tracking, etc.)
Query weather sensors: Throughout the night, monitor weather sensors and shut observatory if conditions exceed
‘safe’ weather limits (See Sec 2.2)
Calibration data for pre-processing: Obtain bias, dark, and if weather conditions allow (i.e. photometric, cloud-free
skies) evening sky flat field calibration images. FLIR images can be used for determining the quality of the sky flats,
and whether to take flat fields with the SI camera by assessing the opacity of the sky. Obtain images to check the
pointing of the telescope and adjust centering as needed.
Focus data: Optimal focus is achieved through a routine that takes a set of 7 images of a star field, stepping through
different focus values, and determines the minimum PSF (point spread function) width of the stars.
LEO Observing: Obtain data of LEO/LILO regimes for the period 2 hours after sunset and 2 hours prior to sunrise,
when the altitude of the Sun is -12 to -30 degrees.
GEO Observing: Obtain sets of GEO debris survey data between LEO observations, targeting the anti-solar point.
Near equinox, when the Earth’s shadow overlaps the anti-solar point, observations are taken of the portion of the sky
leading the Earth’s shadow during the first half of the night, and trailing the Earth’s shadow during the second half
of the night. Traditionally, the broad-R filter was employed for GEO observations using the 0.6m MODEST
telescope. It is anticipated that the SDSS r filter will be the prime GEO survey filter as these filters are very well
calibrated and standard filters used throughout the astronomical community.
Photometric Calibration data: Throughout the night, observations of debris are paused to allow collection of
standard star field images using the same suite of filters used for debris observations. The USNO (US Naval
Observatory) catalogue is used for calibrating data taken with the griz Sloan Digital Sky Survey (SDSS) while the
Landolt catalogue is used for BVRI filter calibration.
Calibration data for pre-processing: Obtain morning sky flat field calibration images if weather allows.
End of night script: Fully shut down the observatory, reversing steps taken in the Start of Night script. Archive data
in the appropriate data directory, preprocess data (see Sec. 5), and generate files with detected objects for that
night’s data to be transferred back to NASA JSC for post-processing analysis and correlations by the ODPO team
using the ODP software. Output files include photometric and astrometric data, object files describing positions of
detected moving objects, and orbital elements.
3.2 MCAT Sensitivity estimates
The original protected/enhanced aluminum coating on the MCAT primary mirror, referred to as ‘Magnabrite ’ was
applied by H.L. Clausing, Inc. in 2014, prior to the installation of MCAT in 2015. The average reflectivity of the
primary mirror measured during Factory Acceptance Tests (FAT) was 90% from 450-750 nm, and 88% from 300-
1100nm. Spatially, reflectivity was highest near the center at ~93%, with reflectivity dropping to about 85% at the
outer edges of the mirror.
Models were then run to project MCAT’s expected limiting magnitude. Using the measured reflectivity of the
primary mirror from the FAT, an SDSS rʹ filter, a signal-to-noise ratio (SNR) of 5, and a sky brightness of 20.4 m-
r/sq-arcsec, we estimate that with a clean primary mirror and no loss-of-signal due to the secondary mirror and
additional optics in the light path, we should be capable of detecting an object of mr ~ 18.5 in 5 seconds. This value
will vary with sky brightness, dirty optics, and losses due to the field corrector, filter, and the window on the SI
camera and the field corrector. The sky brightness will be much greater at full moon, but with dark skies, the
brightness of the Ascension sky is ~21.3 in the V-band, based on measurements from a Sky Quality Meter, which
measures a FWHM 84º FOV.

The object size that this magnitude relates to is dependent upon the solar phase angle at the time of the observation,
the range (distance to the object), the bond albedo (ratio of incident to scattered power over all solar phase angles),
and the observed brightness (i.e. the apparent magnitude). The observed brightness of the object also depends upon
which filter is used (band center and width), and the shape of the object, the latter of which is not known for debris
fragments. Notably, the estimated size of an object can vary by about a factor of 2½ if one considers the full range of
possible albedos of debris, which can be very low for carbon-fiber material, or very high for a bright white paint. An
average value of 17.5% for debris fragments is currently assumed by the ODPO [4]. As such, care must be taken
when considering the ‘size’ of an object estimated as detected by an optical telescope, which truly measures
brightness of an object, not size. Assuming an average albedo of 0.175 (17.5% reflectivity), a magnitude of 18
relates to a ~20cm object in GEO at 36,000 km altitude assuming a diffuse Lambertian phase function. The
measured limiting magnitude of the full system is being fully investigated and will be reported in a future paper. For
more details on how to calculate the size of an observed object, see [4].
3.3 FLIR Camera and Sky Transparency
The FLIR A 325 camera employs a 320 x 240 pixel
microbolometer array that is sensitive to thermal radiation
in the 7.0 - 13.5 µm range. It is equipped with a 4.0-mm
focal length f/1.3 lens that has a 90 x 73 degree field of
view. Mounted on the spider vein of MCAT’s secondary
mirror, the camera views the region of sky through the
dome slit in the direction that the telescope is pointed.
Since cloud bases are warmer than the night sky, clouds are
readily visible in the images (Fig. 2). The OCS software
estimates cloud opacity by comparing the mean intensity
within a circle centered on the telescope bore sight and
compares this with reference levels determined for dark
and cloudy sky. If the cloud opacity exceeds a specified
level, exposures are suspended, unless a timeout period
expires.
Estimates of the transparency of the sky (i.e. photometric conditions) will be included in the photometric calibration
pipeline using the measured FLIR sky value that is written into the header at the time of the observation.
3.4 Weather statistics and expected observable time
Eight years (2005-2012) of the Cloud-Free Line of Sight (CFLOS) data were collected by the METEOSAT Second
Generation (MSG) and analyzed for Ascension Island [Fig. 3]. The data show that seasons have a significant effect
on the weather. The conditions are best (~60-80% clear for the 8-year average) as Ascension’s southern-
hemisphere’s summer arrives, January through March; then average (~45-60% clear) in fall moving into winter
(April – June); poorest during spring-time (August – November); and improve again in December (~50% clear). [1]
Fig. 2: Cloudy image taken from the FLIR camera as
seen through the dome slit (slit indicated by curved
edges to the left, right & top of the image).
Figure 3: An estimate of the percentage of clear nights available as a function of year (Left) and month (Right)
derived from the MSG Satellite. Data are defined through a through a CFLOS analysis where clear is defined as an
optical depth < 0.1 (the limit of the sensors). Red dots (Right) signify averages for the indicated month for each year
and the blue Xs indicate the average of 8 years (2005 – 2012) for that month.

Notably, Ascension weather appears to be particularly affected by local geography and vegetation – Green Mountain
(aptly named) is typically covered in clouds and often rainy – and appears to be evolving in shorter timescales (from
year to year) than expected based on accounts from the local people. Areas on the island that were previously devoid
of vegetation receive rainfall more regularly than in previous decades, or in some cases just a few years ago, calling
for vigilance in monitoring trends for MCAT to project long-term expectations of data collections for use with
NASA’s ORDEM model (See Sec 6.3). However, skies over the SW corner of the island, where both MCAT and the
Royal Air Force Meteorology Station are located, are generally clearer, and more represented by the monthly mean
average, and the yearly averages (Fig. 3).
Data from the MCAT weather sensors collected from mid-April 2016 through July 2017 indicate that the weather
criteria allowing the dome to open (Sec. 2.2) were met ~65% of the time – this does not mean cloud-free, but rather
that humidity, wind, and rain criteria were met. The Boltwood Cloud sensors measure the temperature of the sky (in
the thermal infrared, 8 – 14 µm) compared with the ambient ground-level temperature to estimate the cloud cover
over an 80-degree FOV (with some sensitivity reaching to 120-degrees). A small temperature difference between
these measurements indicates thick, low-level clouds, whereas a large difference indicates clear skies; the sensor
feedback reads as “clear”, “cloudy”, or “very cloudy” where the temperatures bracketing each can be adjusted by the
software. It also detects rain or snow, the latter of which has likely never happened on Ascension. Data taken by
these sensors on Ascension suggest that the skies are relatively clear roughly half of the time, consistent with the
CFLOS data shown in Fig. 3. However, Boltwood data may not be sensitive to thin cirrus.
Data taken with the FLIR camera are more sensitive to cloud opacities and will, in the future, be used to estimate
CFLOS at MCAT’s site, and time that the skies are truly photometric (cloud-free). Notably, the FLIR, which is
connected to the telescope itself, will necessarily take data of the portion of the sky MCAT intends to observe, and
the central portion of the FLIR image analyzed to estimate sky opacity for each science and calibration image. FLIR
data can be used to provide a quantitative estimation of whether skies are photometric (no clouds), observable but
only spectroscopic (light clouds or cirrus), or cloudy. In contrast, the Boltwood cloud sensors are both located on the
top of the weather mast outside of the observatory with a generalized view of the sky with a more qualitative
‘clear/cloud/mostly-cloudy’ assessment.
4. OPERATIONAL MODES AND DATA ACQUISITION
A suite of observing modes have been defined for MCAT that include both traditional astronomical data collections
(e.g. tracking at stellar rates) and those specific to collecting data on RSOs – modes that are not typically available at
traditional professional astronomical observatories as these modes are unique to the field of tracking satellites and
debris.
4.1 Sidereal Track
Telescopes with tracking capabilities are designed to track at the rate of the motion of stars (i.e. sidereal). MCAT is
no exception. Throughout the course of any given night of observations, the nightly program file (i.e. tasking file)
will prompt the telescope to observe well calibrated star fields for the purpose of both astrometric and photometric
calibration of the debris observations. (See Sec 3.1 and 5)
4.2 GEO Survey
With typically 1000 images expected to be collected during a full night of survey, “GEO survey” will be the primary
imaging mode. GEO Survey can be conducted using two tracking modes, including GEO mode that employs TDI
read-out technology, and Rate Track, or ‘RT’.
To survey the GEO belt in GEO mode using TDI, the telescope itself tracks at a the sidereal rate, maintaining a fixed
celestial position. During the exposure, the charge on the CCD is shifted in the opposite direction so that the debris
objects are seen as a point source and the stars are seen as streaks. The effect of observing in this mode is that an
object that is essentially stationary in the sky with respect to altitude and azimuth will be detected as point sources in
this mode. This allows the telescope to track a stationary position on the sky at a constant rate without re-slewing
repeatedly throughout the night. The effect is that the telescope is, in fact, observing a stationary point in space,
which is roughly (though not exactly) the motion of objects in the GEO belt (Fig. 4).

Fig. 4: (LEFT) Images taken in GEO mode or RT will result in streaks of equal length and orientation for the stars,
while RSOs in GEO (green circles) will appear point-source. Four RSOs are evident. (North is up, east is left)
(RIGHT) An image taken at LEO following an RSO’s TLE demonstrates much longer star trails for the faster
moving LEO object (red circle).
Rate Track allows the telescope to track at a user-defined RA and Dec rate that is non-sidereal, but constant. This
differs from TLE tracking as TLE orbital rates are not constant in velocity. To track a region in the anti-solar
direction using RT, the telescope must be re-slewed to that position regularly to maintain its pointing. GEO mode
alleviates that problem by having the camera, using TDI read-out, do the work of the positional shift. However,
objects move through the field of the telescope and will appear on just a few (3-4) images. With RT, MCAT can
track at the expect velocity and direction of motion of the GEO belt, allowing for more frame-to-frame detections of
a given GEO object to be observed. In fact, one can then choose the number of RT images to take in a given
sequence to ensure enough images are taken of an object to yield a statistically significant detection before slewing
to the next sampling position.
Specifically, with the goal of statistically sampling the GEO belt, one must estimate the cadence at which the belt
should be sampled, and an observing strategy developed to ensure that one does not over-sample one portion of the
sky unnecessarily while under-sampling another. As such, an analysis of how to maximize the completeness of the
GEO survey has been done by ODPO and is reported in detail in [5] and references therein. Assuming that one can
observe GEO for 23 nights in a given month, (i.e. excluding the week of the full moon), we estimate that 6 months
of data are needed to adequately sample the GEO belt. However, this does not take down time due to poor weather
or any other factors into account. The weather statistics from the MSG satellite from 2005 – 2012 for Ascension
(Sec. 4.3), and the MCAT weather sensors suggest roughly half the night may result in observable skies. If accurate,
the GEO belt could be adequately sampled each year using MCAT.
On nights dedicated to GEO survey, a standard exposure time of 5 sec is used to prevent saturation across the frame
by star streaks, while at the same time allowing the signal to build on the detector. Taking the read-out times and
overhead into account as well, MCAT can take a 5-sec exposure roughly every ~40 sec. If an object is moving at the
maximum delta v = +/- 15-arcsec/sec expected for GEO debris, this equates to 10ʹ in 40 sec, then an object at GEO
would pass through the field of view in 4 images.
4.3 Catalogue (TLE) or Object of Interest Mode
Catalogued objects in spacetrack.org can be tracked using their orbital parameters. A TLE, or Two-Line Element
describes the orbital elements of a known RSO tracked by the Space Surveillance Network (SSN). The OCS
software sends vectors defining the position, angular velocity and acceleration of the object to the DFM TCS
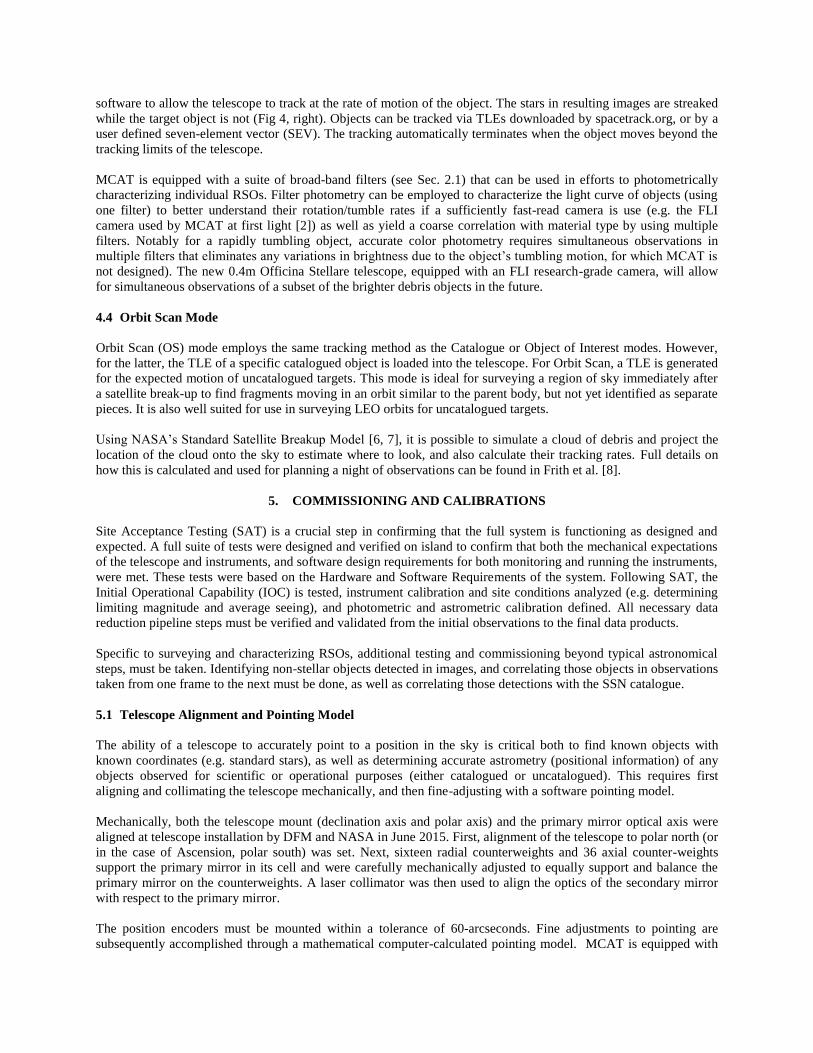
software to allow the telescope to track at the rate of motion of the object. The stars in resulting images are streaked
while the target object is not (Fig 4, right). Objects can be tracked via TLEs downloaded by spacetrack.org, or by a
user defined seven-element vector (SEV). The tracking automatically terminates when the object moves beyond the
tracking limits of the telescope.
MCAT is equipped with a suite of broad-band filters (see Sec. 2.1) that can be used in efforts to photometrically
characterizing individual RSOs. Filter photometry can be employed to characterize the light curve of objects (using
one filter) to better understand their rotation/tumble rates if a sufficiently fast-read camera is use (e.g. the FLI
camera used by MCAT at first light [2]) as well as yield a coarse correlation with material type by using multiple
filters. Notably for a rapidly tumbling object, accurate color photometry requires simultaneous observations in
multiple filters that eliminates any variations in brightness due to the object’s tumbling motion, for which MCAT is
not designed). The new 0.4m Officina Stellare telescope, equipped with an FLI research-grade camera, will allow
for simultaneous observations of a subset of the brighter debris objects in the future.
4.4 Orbit Scan Mode
Orbit Scan (OS) mode employs the same tracking method as the Catalogue or Object of Interest modes. However,
for the latter, the TLE of a specific catalogued object is loaded into the telescope. For Orbit Scan, a TLE is generated
for the expected motion of uncatalogued targets. This mode is ideal for surveying a region of sky immediately after
a satellite break-up to find fragments moving in an orbit similar to the parent body, but not yet identified as separate
pieces. It is also well suited for use in surveying LEO orbits for uncatalogued targets.
Using NASA’s Standard Satellite Breakup Model [6, 7], it is possible to simulate a cloud of debris and project the
location of the cloud onto the sky to estimate where to look, and also calculate their tracking rates. Full details on
how this is calculated and used for planning a night of observations can be found in Frith et al. [8].
5. COMMISSIONING AND CALIBRATIONS
Site Acceptance Testing (SAT) is a crucial step in confirming that the full system is functioning as designed and
expected. A full suite of tests were designed and verified on island to confirm that both the mechanical expectations
of the telescope and instruments, and software design requirements for both monitoring and running the instruments,
were met. These tests were based on the Hardware and Software Requirements of the system. Following SAT, the
Initial Operational Capability (IOC) is tested, instrument calibration and site conditions analyzed (e.g. determining
limiting magnitude and average seeing), and photometric and astrometric calibration defined. All necessary data
reduction pipeline steps must be verified and validated from the initial observations to the final data products.
Specific to surveying and characterizing RSOs, additional testing and commissioning beyond typical astronomical
steps, must be taken. Identifying non-stellar objects detected in images, and correlating those objects in observations
taken from one frame to the next must be done, as well as correlating those detections with the SSN catalogue.
5.1 Telescope Alignment and Pointing Model
The ability of a telescope to accurately point to a position in the sky is critical both to find known objects with
known coordinates (e.g. standard stars), as well as determining accurate astrometry (positional information) of any
objects observed for scientific or operational purposes (either catalogued or uncatalogued). This requires first
aligning and collimating the telescope mechanically, and then fine-adjusting with a software pointing model.
Mechanically, both the telescope mount (declination axis and polar axis) and the primary mirror optical axis were
aligned at telescope installation by DFM and NASA in June 2015. First, alignment of the telescope to polar north (or
in the case of Ascension, polar south) was set. Next, sixteen radial counterweights and 36 axial counter-weights
support the primary mirror in its cell and were carefully mechanically adjusted to equally support and balance the
primary mirror on the counterweights. A laser collimator was then used to align the optics of the secondary mirror
with respect to the primary mirror.
The position encoders must be mounted within a tolerance of 60-arcseconds. Fine adjustments to pointing are
subsequently accomplished through a mathematical computer-calculated pointing model. MCAT is equipped with

on-axis optical Heidenhain encoders that reads out positions with a resolution of 10ʺ. However, pointing model
corrections to the position data must be made, including both coordinate corrections (translating positions of stars in
a catalogue (e.g. J2000) to current epoch of date) and TCS corrections. Coordinate corrections account for effects
due to aberration, precession, and nutation. TCS corrections include atmospheric refraction as well as telescope
errors. In addition to accounting for the refracted pole (as opposed to true-polar alignment), DFM’s pointing model
also accounts for telescope pointing errors due to (1) azimuth and altitude misalignments to the celestial pole, (2)
mechanical and optical non-perpendicularities, (3) encoder scale factors, offsets, and eccentricities, (4) flexures of
the telescope’s mechanical structure, and (5) flexures of the optical mounts. Additional details on the DFM pointing
model can be found at the DFM website under Newsworthy Articles [9].
Constructing a new optical telescope facility requires regular pointing model updates, more frequently early in the
facilities’ lifetime (at least several times per year) because as the pier settles, the accuracy of the telescope pointing
shifts. For the DFM pointing model, a suite of observations of catalogued stars, chosen preferentially to minimize
stars with small error bars in their catalogued position, and without a high proper motion. Stars are selected every
10-15 degrees across the equator to sample a range of RA, and likewise across the meridian for Dec sampling. For a
telescope the size of MCAT, a 30 arcsec RMS is considered ‘good’ with a prime goal of reaching 3-10-arcsec RMS
error. For MCAT, we have achieved typical RMS errors of 5.6 – 7 arcsec for the DFM pointing model.
5.2 Calibration of Data
Data taken with MCAT are calibrated and analyzed through a pipeline developed specifically for MCAT, and
includes standard astronomical pre-processing, object detection (both occur on-island through OCS software),
transfer of files to NASA JSC, and finally post-processing of the data at NASA JSC with the ODP software.
The following steps are taken, with details on each step given below:
Pre-processing includes bias (or dark) subtraction and normalizing by a master sky flat field image (averaging a
set of sky flat images taken with a given filter) to account for instrumental signatures.
Standard star observations allow translation from instrumental magnitudes to calibrated absolute magnitudes.
Photometric conditions are quantified through cloud opacity estimates from infrared FLIR images
Astrometric calibration is performed by matching positions of detected stars with those in the USNO-B1
catalog.
Potential debris objects are identified on individual pre-processed images by preferentially searching for point-
source detections or short-streaks, while rejecting any streaks that are the length and direction expected for stars
based on the track-rate of the telescope
o Photometry (brightness) and astrometry (position) of detected objects are logged, along with the
relevant meta-data (e.g. airmass, UT date and time, epoch, exposure time, filter, frame number)
Detected objects are analyzed from frame-to-frame to determine whether those detections are sequential
observations of a given debris object, or rejected if they are not (e.g. cosmic ray detections). A minimum of 4
detections must be made to be considered statistically significant.
All output files are returned to NASA JSC to the ODPO for post-processing analysis to correlate detected
objects with the SSN catalogue.
5.2.1 Photometric Calibration
As with all astronomical photometric calibration, a suite of bias images and flat fields are collected nightly. Bias
images correct for the underlying baseline signal (both the average signal and pixel-to-pixel variations) in
electronically collected charge-coupled device (CCD) images and a master bias image (the median average of a set
of e.g. 11 individual bias images) is subtracted from all data.
Sky flat fields are used to correct for the non-uniform response and pixel-to-pixel sensitivity differences across the
images, as well as any effects from dust, scratches or non-uniformities in the optical path (e.g. on filters, the field
corrector, primary, or secondary mirror). They can be taken either with tracking off, or if sidereal tracking on,
incremental positional shifts in the sky must be implemented between each observation to ensure that the median
value of the resultant master flat field is not biased by a star appearing at a given position on all images.

Thermally generated electrons cause ‘dark’ noise in detectors. As MCAT’s SI camera CCD is cryogenically cooled,
using PT-30 in a closed-loop system to -110C, dark current is greatly minimized. However, darks can be subtracted
(instead of bias images) if desired. As the maximum measured dark current measured for the MCAT SI camera is
0.00035 e-/pix/sec at -110C, and our observations are generally 5-seconds for debris observations, and nearly always
less than 60 seconds for any science (e.g. standard star) images, dark subtraction is not necessary. However,
monitoring dark current images with time is useful for potentially catching off-nominal effects or failures of the
CCD chip.
Standard stars are included in the program file (target list) for each night, but only useful for data collected with
clear skies. At the end of the night, calibration images are processed first to determine photometric zero points,
extinction coefficients, and color coefficients for each wavelength band. If the photometric error is sufficiently
small, these data are used for photometric calibration of all images subsequently processed. Otherwise, standard
photometric calibration values, determined on previous photometric nights, are used.
Cloud opacities estimated from FLIR camera images, taken at the start and end of each exposure, are recorded in the
FITS header of all images (see Sec. 3.3). These values are used by the data processing pipeline to identify and
quantify the photometric conditions.
Output photometry files include: (1) FITS header information from the image, RA, Dec, instrumental magnitude,
pixel coordinates, major and minor axes, position angle, and SNR of the object flux.
5.2.2 Astrometric Calibration
For each image, the detection algorithm produces a list of objects detected in the frame, including instrumental
coordinates and magnitudes. Astrometric calibration is performed by automatically matching detected stars with
those in the USNO-B1 catalog. A six-parameter general linear transformation, Xʹ = A + Bx, representing pointing
offsets, image scale, rotation and anamorphic distortion, is employed. Typical residual astrometric errors are less
than 1-arcsec RMS. These astrometric parameters are saved in an astrometric calibration file to be used later on the
debris detections.
Astrometric calibration of the debris images uses the above parameters calculated from in-frame star positions to
translate the X and Y pixel locations of the detected debris objects into RA and Dec.
5.3 Object Identification: Detecting objects & Frame to Frame correlations
To identify debris objects in data taken while the telescope tracks at the expected rate of motion of the debris, first
the images are preprocessed and flattened. Next, any streaks that match the length and orientation of star trails are
identified and cross-matched with brightness and positions listed in the USNO-B1 catalogue for calculating the
photometric and astrometric coefficients, as described above. The star detections are rejected from the list of
potential debris object detections at this time.
Then all non-streaked objects (or those with shorter streaks than stars, in the case of detecting all Earth-orbiting
objects, not just those moving at the track rate of a particular orbital regime) are identified in each frame, and
compared with the locations of objects detected in sequential frames to correlate objects that are moving at the same
rate and direction from one image to the next, within a given ‘rate box’ motion defined for GEO by ±2ʺ/sec in RA
(or hour angle, HA), and ±5ʺ/sec in Dec. A minimum of 4 detections of a given object must be made within a single
group of observations, or the ‘possible detection’ is rejected from consideration, eliminating, e.g. cosmic ray hits.
The detected objects are calibrated for photometry and astrometry and the resultant ‘object file’ sent to NASA JSC
for post-processing.
5.4 Post-processing
The frame-to-frame identified and calibrated detections are sent back as a text file to NASA’s ODPO for post-
processing with the ODP software. For a given image, relevant metadata are determined (year, day, UT, field center
of the image). A version of SGP (Simplified General Perturbation) code is used to estimate the objects orbital
elements (observed mean motion, inclination, Right Ascension of Ascending Node (RAAN), eccentricity), as well

as phase angle and range are used to predict whether an object in the SSN catalogue might be in the image field of
view [10]. (Orbits here are assumed to be circular as the arc of the orbit observed in this timeframe is insufficient to
determine eccentricity.) If yes, ODP makes an attempt to correlate objects detected in each image to potential
objects in the SSN catalogue and assigned an SSN number if a correlation is made and the object classified as a
Correlated Target (CT). If no object is found in the catalogue, it is classified as an Uncorrelated Target (UCT).
Additional details of how correlations are made versus rejected is outside the scope of this work and may be
discussed in a future publication. The general concepts can be found in [11].
6. FUTURE WORK
6.1 Future anticipated modes of data collection
Currently the prime goal is GEO survey observations with secondary goals including collecting LEO observations,
tracking known objects for further characterization, and characterizing break-up events. The modes being vetted
now are well suited for triggering observations should a break-up occur at GEO. Future observing modes to be
tested include Stare-Detect-Chase, and Coordinated Observations, described below.
6.1.1 Stare-Detect-Chase mode
The Stare-Detect-Chase mode is designed to detect objects not in the SSN catalogue.
Stare: Initially, the telescope is set to ‘stare’ at the sky at a given tracking rate, without any a priori knowledge of
any objects that may cross the FOV, nor their orbital elements.
Detect: Images are then processed in real-time to provide a calibrated list of photometric detections. This list is
compared with those from images taken immediately prior and following using an algorithm that identifies objects
that are moving with near-constant angular rates with respect to one another.
Chase: If a set of objects is found meeting this criteria, an initial TLE is computed, predicting the motion of that
UCT, assuming a circular orbit, and the telescope is redirected to track the moving object, i.e. ‘chase’ it. Additional
exposures are acquired automatically during the ‘chase’ phase so that the orbital elements and photometry can be
later refined with all images. This will be explained in detail in a future publication.
6.1.2 Coordinated observations
A tower platform has been deployed next to MCAT that is the future home of a 0.4m Officina Stellare f/5.2 optical
telescope (Fig. 1, Left), equipped with a camera that will roughly match the FOV of MCAT (44ʹ x 44ʹ for the
smaller telescope; 41ʹ x 41ʹ for MCAT), and will be equipped with the same suite of filters as MCAT to allow for
observations to be taken simultaneously by both telescopes (e.g. with different filters), or in concert with MCAT
where one telescope is used to make follow-up observations of the detections made by the other. The OCS software
is designed to trigger observations with cameras on both telescopes simultaneously to eliminate variations in color
caused by observations being taken when then object presents differing viewing geometries/rotational phases. This
phase of observing will be implemented after installation of the new telescope, expected in 2018.
Likewise, a C-band radar stationed on Ascension could be used for taking coordinated observations with either
MCAT and/or the 0.4m telescope. Such observations may be designed and carried out in MCAT’s future through
coordination with the US Air Force owner/operators of the radars.
6.2 MCAT as a contributing sensor
As MCAT is a joint AFRL/NASA project, data obtained with MCAT are expected to be shared with JSpOC. In the
event of a break-up, requests by JSpOC can also be made for MCAT to aid in data collections immediately and over
time as the unique location of MCAT will enhance the current GEODSS coverage of the sky.

6.3 ORbital Debris Engineering Model, ORDEM 4.0
Ultimately the data collected by MCAT will be used largely for the modeling needs of the ODPO, to further our
statistical understanding of the Earth-orbiting debris environment.
NASA’s Orbital Debris Engineering Model, ORDEM, is designed primarily to be used by satellite owner/operators
and engineers to understand the debris long-term collision risks to their missions and how those risks might be
mitigated (e.g. for understanding shielding requirements from impacts due to debris) [12]. ORDEM is used to
estimate debris spatial density and population fluxes. The current version of ORDEM 3 (3.0 and beyond) includes
uncertainties in flux estimates, and material density classes (e.g. intact objects, sodium-potassium (NaK) droplets
from broken coolant lines, high-, medium-, and low-density debris materials), and is applicable for orbital regimes
ranging from LEO to GEO. Past break-up events (e.g. The Chinese ASAT (2007) and Iridium/Cosmos (2009)
breakups, etc.) are also included. The current environment is estimated by various measurement tools (radar, optical
telescopes, returned surfaces exposed to the space environment), and that environment is propagated into the future
using the LEGEND model (Leo-to-GEO Environment Debris), a 3-D evolutionary model, to statistically account for
long-term (e.g. 100 years from now) future environment evolution – primarily on-orbit explosions and collisions.
The ORDEM model estimates populations of debris and spacecraft larger than 10 µm in sub-GEO orbits, and larger
than 10 cm at GEO. The model has a “spacecraft mode” that predicts the flux in the frame of a spacecraft in a
specific orbit, broken out by direction, relative velocity, particle size and material density class. This information
can be used to predict the kinds of damage a spacecraft is most likely to experience in orbit. The model also has a
“telescope/radar mode” that can be used to predict the flux a ground-based sensor should be able to observe to aid in
determining programmatic requirements.
Creation of the ORDEM 3 populations was accomplished by using a suite of observational data, both in-situ and
ground-based, from HAX, Haystack, Goldstone (all radar); the STS (Space Shuttle) windows and radiators (in-situ
measured returned surfaces); the SSN catalogue (radars and telescopes), and the 0.6m optical MODEST telescope.
Of these input data, only the SSN (detection size limit > 1 m) and MODEST (>30cm) monitor the GEO regions.
One of the prime purposes of MCAT is to provide input data for future versions of ORDEM, with GEO as its prime
statistical survey regime. However, with the fast tracking telescope and dome, it also has the capability to observe
any orbital regime from LEO to GEO, as well as highly elliptical orbits, which MODEST was unable to do.
As noted above, data from MCAT will also include RSOs in LEO and LILO orbits, MEO, and GTO, and can track
orbits ranging from circular to highly eccentric. These data are anticipated to be applied to the future release of
ORDEM– specifically ORDEM 4.0 slated for release in 2022. Just as future MCAT data will be used to validate
future versions of ORDEM, conversely, the current version of ORDEM 3 can be used to predict what MCAT should
be capable of detecting.
7. CONCLUSIONS
The ES-MCAT telescope is now fully built and integrated and is undergoing extensive testing and characterization.
A full suite of weather sensors monitors conditions to ensure safe operations of the telescope, as well as allowing a
quantitative assessment of the photometric conditions of the sky through an infrared FLIR camera working in
tandem with MCAT. The system is capable of observing autonomously in a variety of observing modes to
statistically characterize the GEO population through GEO surveys, as well as to characterize individual debris
objects, tracked using their orbital parameters (TLEs). Scripts detailing the full range of required tasks for the
observatory, from start-up to telescope tasking to shut-down procedures work together to fully run the observatory.
The output images are then automatically processed through a pipeline that first detects objects on individual
images, then match them from frame-to-frame to link individual objects, and finally produces calibrated output
photometry and astrometry files. The output files are then used with a post-processing pipeline designed to correlate
the detected object sets with the SSN catalogue. The data produced by MCAT will ultimately be shared with the
DoD/JSpOC for use by their catalogue, and also be used by NASA’s ODPO for their engineering model, ORDEM,
to further our statistical understanding of the Earth-orbiting environment.

8. REFERENCES
1. Lederer, S.M. et al., The NASA Meter Class Autonomous Telescope: Ascension Island, AMOS Technical
Conference Proceedings, 2013.
2. Lederer, S.M. et al., Deploying the NASA Meter Class Autonomous Telescope on Ascension Island, AMOS
Technical Conference Proceedings, 2015.
3. Lederer, S.M. et al., NASA’s Orbital Debris Optical and IR Ground-based Observing Program: Utilizing the
MCAT, UKIRT, and Magellan Telescopes, AMOS Technical Conference Proceedings, 2016.
4. Mulrooney M.K., M.J. Matney, and E.S. Barker, A New Bond Albedo for Performing Orbital Debris Brightness
to Size Transformations, International Astronautical Congress, 2008.
5. Frith, J.M. et al., Characterizing the Strategy and Initial Orbit Determination Abilities of the NASA MCAT
Telescope for Geosynchronous Orbital Debris Environmental Studies. AMOS Technical Conference
Proceedings, Maui, Hawaii Sept 2017.
6. Johnson, N.L., et al. NASA’s New Breakup Model of EVOLVE 4.0. Adv. Space Res. 28 (9), 1377-84, 2001.
7. Cowardin et al., Characterization of Orbital Debris via Hyper-velocity Laboratory Based Tests, 7th European
Conference on Space Debris, ESOC, Darmstadt, Germany 2017.
8. Frith, J.M., et al., Observing Strategies for Focused Orbital Debris Surveys using the Magellan Telescope, 7th
European Conference on Space Debris, ESOC, Darmstadt, Germany 2017.
9. Melsheimer, F., Telescope Structure- Pointing, http://www.dfmengineering.com/news_eng_article_4.html#teles
point, 2000.
10. Vallado, Crawford, Hujsak and Kelso. Revisiting Spactrack Report #3, AIAA/AAS Astrodynamics Specialist
Conference, 2006-6753, 2006.
11. Abercromby K.J. et al., Michigan Orbital Debris Survey Telescope (MODEST) Observations of the
Geosynchronous Orbital Debris Environment Observing Years: 2007-2009, NASA TP-2011-217350, 2011.
12. Krisko, P.H., The New NASA Orbital Debris Engineering Model ORDEM 3.0, AIAA/AAS Astrodynamics
Specialist Conference, 2014.


