
Older People – Local Evidence Lorraine Yeomans December 2014.
25
Older People – Local Evidence Lorraine Yeomans December 2014
-
Upload
agnes-cunningham -
Category
Documents
-
view
216 -
download
0
Transcript of Older People – Local Evidence Lorraine Yeomans December 2014.

Older People – Local Evidence
Lorraine YeomansDecember 2014

Why are we interested in older people?
• The older population is increasing• As we age the likelihood that we will need help from the health and
social care sectors increases
• 46% of hospital admissions are for those aged over 65• 2/3rds of NHS contacts are with those aged over 65• Limiting longstanding illness affects;
– 36% of people aged 65 – 74– 47% of people aged over 75– 69% of over 85s
AgeUK Later Life in the UK November 2014
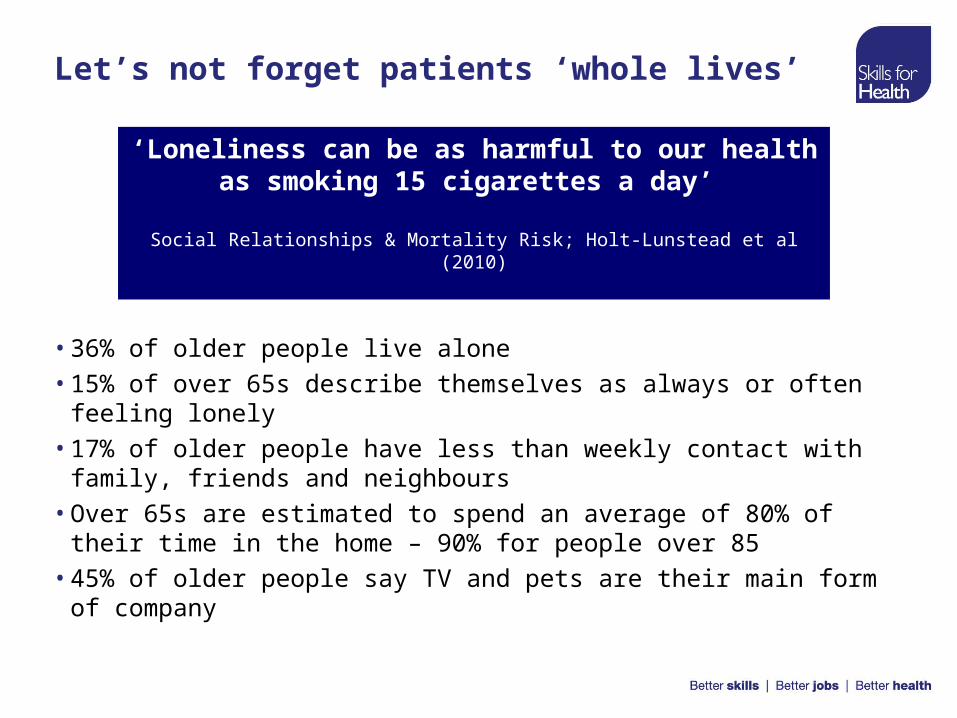
Let’s not forget patients ‘whole lives’
• 36% of older people live alone• 15% of over 65s describe themselves as always or often feeling
lonely• 17% of older people have less than weekly contact with family,
friends and neighbours• Over 65s are estimated to spend an average of 80% of their time in
the home – 90% for people over 85• 45% of older people say TV and pets are their main form of company
‘Loneliness can be as harmful to our health as smoking 15 cigarettes a day’
Social Relationships & Mortality Risk; Holt-Lunstead et al (2010)

How do older people want to be treated?
• AgeUK surveys tell us that:– 64% of older people think that health and care staff don’t always
treat them with respect for their dignity– 52% of people think that those who plan services do not pay
enough attention to the needs of older people– 52% of adults (of all ages) believe that once you reach very old
age people tend to treat you as a child

Diving Deeper!
• Previous session we sought to provide you with an overview
• We’re able to drop further and provide some more detail around some themes around Older People and Islington in greater detail
• Data sources include ESR, QOF database and Public Health England
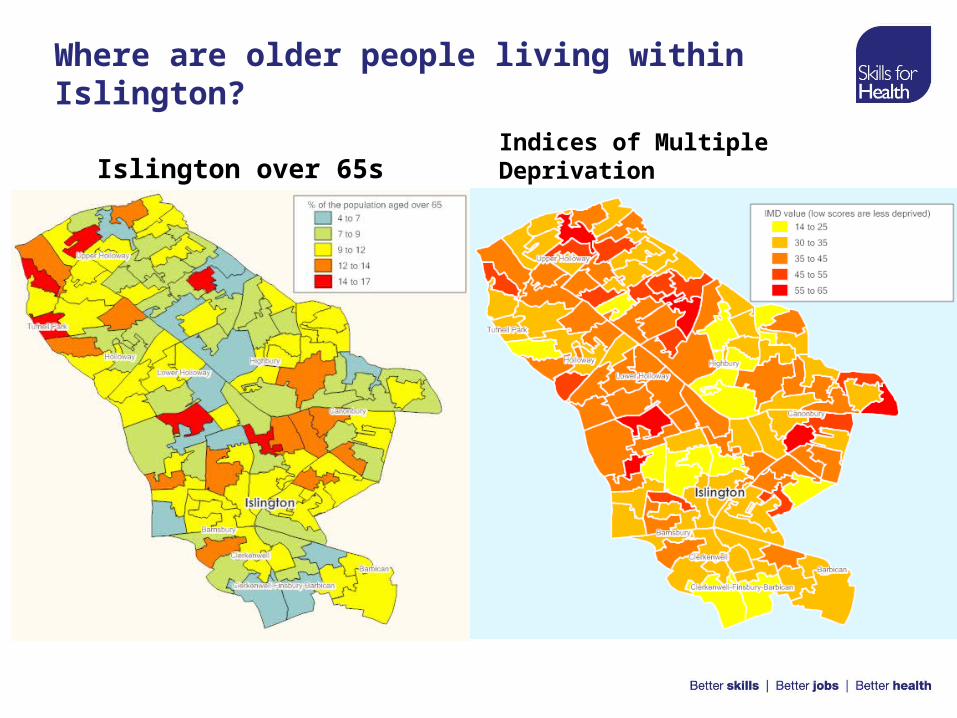
Where are older people living within Islington?
Indices of Multiple DeprivationIslington over 65s
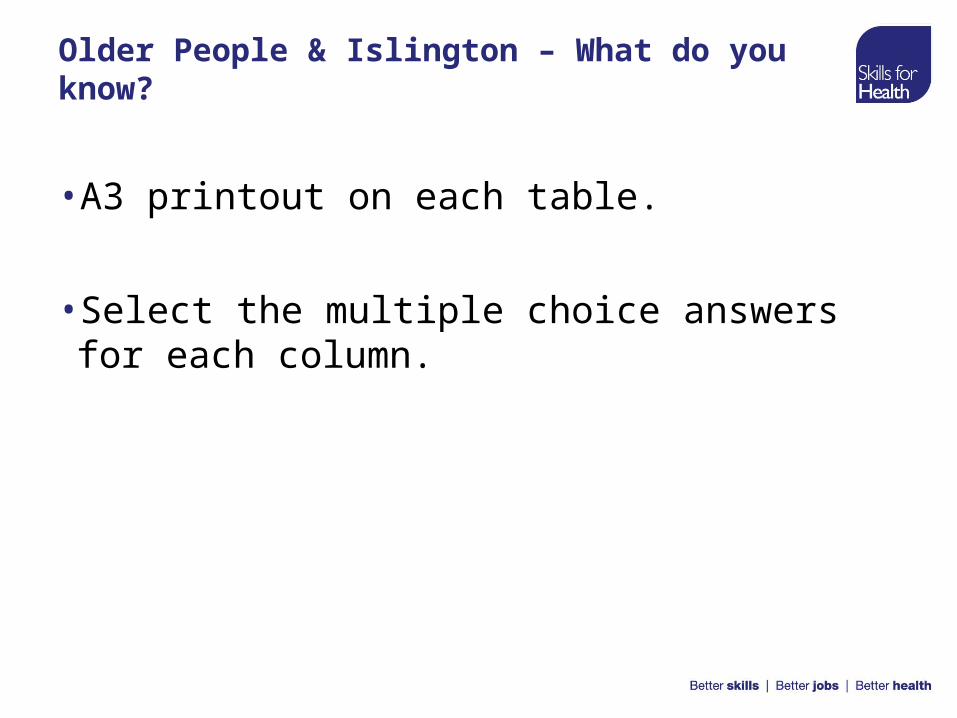
Older People & Islington – What do you know?
• A3 printout on each table.
• Select the multiple choice answers for each column.

Total Number Prevalence
Islington London England
COPD 3,385 1.5% 1.1% 1.7%
Dementia 890 0.4% 0.4% 0.5%
Stroke and Transient Ischaemic Attacks
2,315 1.1% 1.1% 1.7%
Cancer 3,095 1.3% 1.3% 1.8%
Total Number Prevalence
Islington London England
Heart Failure 1,265 0.6% 0.5% 0.7%
Hypertension 20,980 9.4% 11.1% 13.6%
Coronary Heart Disease 3,890 1.8% 2.2% 3.4%
Chronic Kidney Disease 1,795 1.6% 2.1% 3.4%
Depression 3,365 1.5% 1% 0.8%
Older People & Islington – What do you know? The answers
Number of People inIslington
% of total population
Islington London England
Aged 65 and over in 2012 19,000 9% 11% 17%
Aged 85 and over in 2012 2,000 1% 2% 2%
Projected
Aged 65 and over in 2037 33,000 12% 16% 24%
Aged 85 and over in 2037 4,000 2% 3% 5%

QOF Indicator Summary – GP Practice Level (2012 data)
QOF Indicator NHS Islington Centile
Percentage of GP Practices in
Islington over the 75th centile
Mental Health* 100 90%
Depression* 54 19%
Dementia 15 16%
COPD 31 14%
Hypertension 4 5%
Stroke and Transient Ischaemic Attacks 10 0%
Coronary Heart Disease 4 0%
* Mental Health is being discussed in depth at future sessions

Changing Population of Islington
• Islington has a younger population profile than many other areas of England
• Between 2012 and 2037 ONS modelling suggests:– 70,000 increase in total population of Islington = 33% growth in (one
of the largest percentage increases in England)– In absolute terms the population aged between 35 and 64 will grow
the most (additional 34,000 people)– In percentage terms the population aged between 65 – 79 and 80+
will increase the most with an 80% increase in people in these age categories (additional 14,000 people). They will however still make up a small proportion of the overall population
• Components of population change show:– +10,000 through net migration (internal and international)– +60,000 through natural change (births and deaths)

Ageing Population - Islington
Source: ONS Sub-National Population Projections

How does that compare? What does it mean?
• Islington has a ‘younger’ overall population than many parts of England however…
• The total number of people aged over 65, living in Islington (2012), is greater than or equal to the total number in;
– Exeter (19,000)
– Reading (18,000)
– Mid Devon (17,000)
– Oxford (17,000)
– Surrey Heath (15,000)
– Lincoln (14,000)
– West Somerset (11,000)
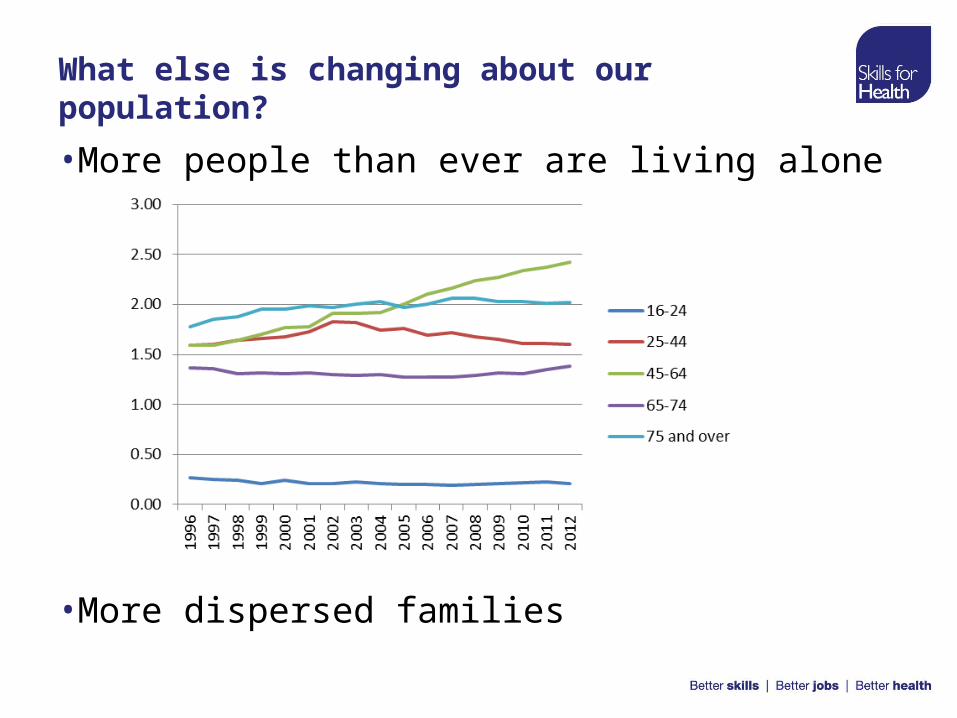
What else is changing about our population?
• More people than ever are living alone
• More dispersed families

A look to the future….
• Total population in Islington is set to increase by 33% (70,000 people) between 2012 and 2037 with the proportion of the population aged over 65 growing the fastest (80% increase from 19,000 to 33,000).
• Some conditions won’t be increasing in prevalence but this increased population will increase demand.
• Some conditions will increase in prevalence so demand will grow faster than the population.
• Dementia• COPD• Obesity• Coronary Heart Disease

Dementia
• Applying these rates to the ONS Population projections for 2012 – 2037 and QOF prevalence data there could be an almost 50% increase in the number of people in Islington with Dementia over the time period.
• Growth from under 900 to over 1,300
• Based purely on population growth the numbers could increase to nearer 1,600
“Dementia is one of the main causes of disability in later life, ahead of some cancers,
cardio-vascular disease and stroke”Age UK

Dementia
• For people with dementia• 40% have felt lonely recently• Only 47% said that their carer(s) received help in caring for them• 72% are living with another medical condition or disability as well as
dementia• Almost 1 in 10 only leave the house once a month
• High levels of loneliness make people twice as likely to develop Alzheimer’s - Loneliness & Risk of Alzheimer’s, Wilson et al (2007)

COPD
• 3.9% of those aged 25-44• 7.7% of those aged 45-64• 9.5% of those aged 64+
• Modelled against Islington’s population profile this suggests there could be an increase of 47% (1,600) between 2012 and 2037 in the number of people living with COPD.
• Whole Lives Perspective – less mobile, more isolated, more likely to be anxious or depressed,

The Organisations & Workforce in
Health &
Social Care

Organisations
An estimated:•43 Establishments delivering Adult Social Care
– 7 Statutory local authority– 12 Private sector– 24 Voluntary or third sector
•3 NHS Trusts within the boundary(including Moorfields Eye Hospital), some fluidity as the population served by other trusts•37 GP practices•45 Community Pharmacies

Types of Social Care Organisations
Sources: SfC – NMDS Adult Social Care

Occupational Profile – Health & Adult Social Care
Health Adult Social Care Total
Estimated Total
%Estimated
Total%
Estimated Total
%
Medical and Dental 640 10% 640 5%
GPs 170 3% 170 1%
Registered Nurses 1,720 26% 100 1% 1,820 13%
Therapists/AHPs 1,075 16% 1,075 8%
Social Workers 200 2% 200 1%
HCAs/Care Workers /Senior Care Workers 1,740 26% 3,200 45% 4,940 36%
Managers 200 3% 200 2% 400 3%
Admin and clerical 620 9% 620 5%
Other430 7% 3,400 43% 3,830 28%
Total Workforce 6,600 100% 7,000 100% 13,600 100%
Sources: SfC – NMDS Adult Social Care, ESR data, Labour Force Survey 2013

Whittington Health Workforce
Source: ESR Headcount (all SIP numbers rounded to nearest 5)
120
100
20
15
95
190
Nurses
ST&T

Social Care Workforce
Source: SfC NMDS (all staff in post numbers rounded to nearest 5)
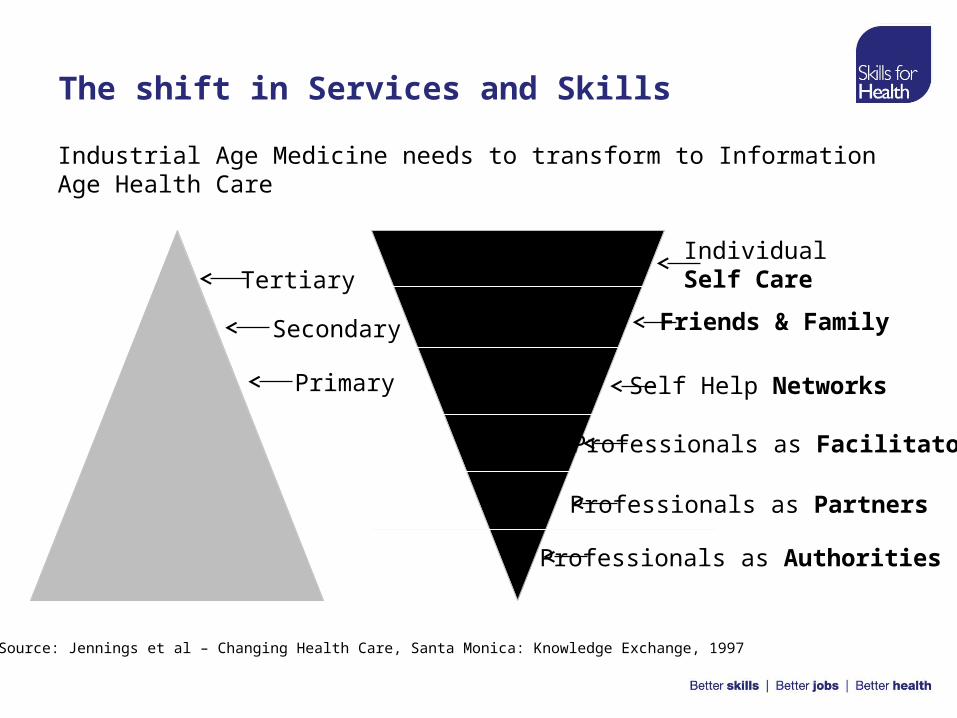
The shift in Services and Skills
Industrial Age Medicine needs to transform to Information Age Health Care
Tertiary
Secondary
Primary
IndividualSelf Care
Friends & Family
Self Help Networks
Professionals as Facilitators
Professionals as Partners
Professionals as Authorities
Source: Jennings et al – Changing Health Care, Santa Monica: Knowledge Exchange, 1997

WorkshopHub and Spoke Model
The Patient or Person
Individual Self Care
Friends & Family
Self Help Networks
Professionals as
Authorities
Professionals as
Facilitators
Professionals as Partners


