Old and New Media Use
20
1 Old and New Media Use The Multicultural Marketing Equation Study 2007: Report # 1 The 2007 Florida State University/DMS Research Multicultural Marketing Research Program This is the first in a series of reports summarizing the data of the 2007 Multicultural Marketing Equation Study conducted by the Center for Hispanic Marketing Communication at Florida State University and DMS Research (an AOL LLC company). The Multicultural Marketing Equation Study was first conducted in 2006. By Felipe Korzenny, Ph.D., Director And Betty Ann Korzenny, Ph.D., Associate Director Both at the Center for Hispanic Marketing Communication, Florida State University With the Collaboration of senior researchers at DMS Research, and Madhurima Sarkar doctoral student at Florida State University This study was made possible by the contributions from the following students in the Spring 2007 Seminar on Multicultural Marketing Communication at Florida State University: Ledvi Beza, Punchalee Buraruk, Rosemeire Carbonell, Pei-Hui Chang, Szu-Wei Chen, Eddy Meola, Yarbrah Peeples, Adah-Duval Pittman-Delancey, Eunjung Shin, Shanna Tumbleson, John Tyndall, and Mary Warmka We want to thank John Zarrella, President of Research Results, and his excellent team of survey specialists for their contributions to this study.
Transcript of Old and New Media Use

1
Old and New Media Use
The Multicultural Marketing Equation Study 2007: Report # 1
The 2007 Florida State University/DMS Research Multicultural Marketing Research Program
This is the first in a series of reports summarizing the data of the 2007 Multicultural Marketing Equation
Study conducted by the Center for Hispanic Marketing Communication at Florida State University and
DMS Research (an AOL LLC company). The Multicultural Marketing Equation Study was first conducted
in 2006.
By
Felipe Korzenny, Ph.D., Director
And
Betty Ann Korzenny, Ph.D., Associate Director
Both at the Center for Hispanic Marketing Communication, Florida State University
With the Collaboration of senior researchers at DMS Research, and Madhurima Sarkar
doctoral student at Florida State University
This study was made possible by the contributions from the following students in the Spring
2007 Seminar on Multicultural Marketing Communication at Florida State University:
Ledvi Beza, Punchalee Buraruk, Rosemeire Carbonell, Pei-Hui Chang, Szu-Wei Chen, Eddy Meola,
Yarbrah Peeples, Adah-Duval Pittman-Delancey, Eunjung Shin, Shanna Tumbleson, John Tyndall, and
Mary Warmka
We want to thank John Zarrella, President of Research Results, and his excellent team of survey
specialists for their contributions to this study.

2
Table of Contents Executive Summary ............................................................................................................................. 4
Introduction ........................................................................................................................................ 7
Methodology for the 2007 Study ..................................................................................................... 7
Media covered in the 2007 Study ..................................................................................................... 7
Main Findings ...................................................................................................................................... 8
Old Media Exposure ......................................................................................................................... 8
Television..................................................................................................................................... 8
Radio ......................................................................................................................................... 10
Newspapers ............................................................................................................................... 11
Magazines.................................................................................................................................. 12
New Media Usage .......................................................................................................................... 13
The Internet including email ...................................................................................................... 13
Use of Other Technologies ......................................................................................................... 14
Cellular Phones ...................................................................................................................... 14
CD’s ....................................................................................................................................... 15
MP3’s or an iPod .................................................................................................................... 15
Electronic Games ................................................................................................................... 17
Cellular Phone Use for Other Than Speaking .......................................................................... 17
Satellite Radio ........................................................................................................................ 18
Music on Television ................................................................................................................ 18
Epilogue ............................................................................................................................................ 18
The Multicultural Marketing Equation for Media ............................................................................... 19
Commonalities ............................................................................................................................... 19
Cultural Differences ....................................................................................................................... 19
Methodological Note ......................................................................................................................... 20
Online Interviewing Method – ....................................................................................................... 20
Additional details: .......................................................................................................................... 20
3
Table of figures
Table 1: Watching Television in English ................................................................................................... 8
Table 2: What is your age?....................................................................................................................... 9
Table 3: Watching television in another language .................................................................................... 9
Table 4: Listening to the radio in English ................................................................................................ 10
Table 5: Listening to the radio in another language................................................................................ 10
Table 6: Reading newspapers in English ................................................................................................. 11
Table 7: Reading newspapers in another language ................................................................................ 11
Table 8: Reading magazines in English ................................................................................................... 12
Table 9: Reading magazines in another language ................................................................................... 12
Table 10: Using the Internet including e-mail in English ......................................................................... 13
Table 11: Using the Internet including e-mail in another language ......................................................... 13
Table 12: Speaking on a cellular phone .................................................................................................. 14
Table 13: Average hours speaking on a cellular phone by age ................................................................ 14
Table 14: Listening to CD's ..................................................................................................................... 15
Table 15: Listenign to MP3's or an iPod ................................................................................................. 15
Table 16: What is your household income ............................................................................................. 16
Table 17: Playing electronic games ........................................................................................................ 17
Table 18: Using a cellular phone for things other than speaking............................................................. 17
Table 19: Listening to satellite radio ...................................................................................................... 18
Table 20: Listening to music on television .............................................................................................. 18

4
Executive Summary
Background
In the Spring of 2007, The Center for Hispanic Marketing Communication at Florida State University and
DMS Research conducted a second online Multicultural Marketing Equation Study with approximately
2500 respondents, divided almost equally among five cultural groups: Non-Hispanic Whites (NHW),
African Americans (AA), Asians (A), Hispanics who completed the questionnaire in English (HE), and
Hispanics who completed the questionnaire in Spanish (HS). This 2007 version of the study refined the
2006 research by allowing Hispanics who preferred to respond in Spanish to contribute their opinions.
The purpose of the study was to shed further light on whether a multicultural marketing approach
common to all groups or a culture specific approach directed to each of these groups is most effective.
This report is the first of a series, concentrating on media, of the 2007 Multicultural Marketing Equation
Study.
This report addresses two aspects of change which are salient in the current dynamic of marketing in
this country: the continually increasing cultural diversity of the population and the exploding media
options available to consumers. African Americans, Hispanics, and Asians now constitute over thirty
percent of the total population and have the fastest growth rates. NHW remain the largest segment,
however, in contrast, they are an aging population, and declining in numbers. Changes in media and
new technologies are daily news, and consideration of touchpoints in marketing has moved from an
innovation to a norm. It appears that an effective media plan now needs to include a grid in two
dimensions—the appropriate cultural target groups in the population and the media touchpoints to use
for communication with each. This research informs that need.
This study required that respondents be over eighteen years of age. The demographics collected for
each of these five groups allowed for analysis by income and age when needed for further
understanding of the findings. The research looked at media language preferences where other
language options were available. The exploration of media included hours spent per week on both old
and new media. Old media investigated were television, radio, newspapers, and magazines; new media
included the Internet and e-mail, cellular phones, CDs, MP3’s or an iPod, electronic games, satellite
radio, music on TV, and cellular phones for non-speaking functions. In each case respondents
illuminated the multicultural marketing equation with unexpected results. The addition of Hispanics
that preferred to answer the questionnaire in Spanish (HS) to this study allowed for the analysis of their
differences from Hispanics who answer in English (HE) in a variety of dimensions. This series of studies
is futuristic in that it provides a glance into the near future when almost all residents of the United
States will be online. It is true that restricting the study to those who are online eliminates an important
segment of the population. It is also true that it provides a perspective that marketers need to know
precisely because it is about trends and the future.

5
Overall Trends
Old media and new media share the attention of online consumers across different cultural groups.
NHW tend to be laggards when it comes to new technologies while members of emerging minorities are
venturesome and eager to explore. The typical alternative explanation for this is that these minorities
are younger. This study, however, shows that after controlling for age, NHW continue to be laggards
regardless of age.
The importance of the native language of consumers is evidenced in the degree to which A, HE, and HS
use the media in a language other than English. They use these media in other languages proportional
to their acculturation levels. That is not surprising per se but it does point to how the language of media
offerings evolves and the importance that marketers have to place in going beyond language and more
into connecting through other cultural avenues with these important emerging groups.
Conclusions
The findings in this first report of the Multicultural Marketing Equation Study of 2007 indicate that
there are resounding commonalities across the five cultural groups studied in the usage of old media as
well as new media. Indeed the intensity and complementarity of media usage present powerful
avenues for communicating with consumers. However, marketers should beware that significant
cultural differences abound! Only through informed planning of media touchpoints for our culturally
diverse population, can marketers take advantage of the current media explosion.
The big story from this data is that all groups are spending huge amounts of time per week,
approximately 40 hours, just on television viewing and Internet usage. These hours are almost equally
divided between these two most popular media options. Television producers get this, demonstrated
by the fact that most major television shows have online counterparts. This bi-media strategy for
television and for marketing can create strong involvement with viewers and promote loyalty.
However, the critical message from this study is that language preferences influence total usage, a point
made particularly salient in this year’s study by the inclusion of HS respondents. The impact of language
both in old and new media permeates this study. It is evident in the responses of less acculturated HS,
but also in HE and A, who participate in other language media even though they are mainly involved in
English media usage. This use of other language options suggests a cultural and emotional connection
that draws A, HE, as well as HS to media, which is most likely in their native language.
This research reconfirmed the 2006 study tendency of NHW to stay with more traditional uses of media
both in old and newer technologies. Their heavier media usage seemed to be in television, newspapers,
and the Internet in contrast to newer uses of old media and emerging technologies. This appears to go
hand in hand with NHW being an older segment of the population whose interests remain linked to the
past.
In contrast A, HS, HE, and AA reported stronger participation in a range of new technologies. AA tended
to concentrate on entertainment linked technologies, particularly those which provide opportunities to
6
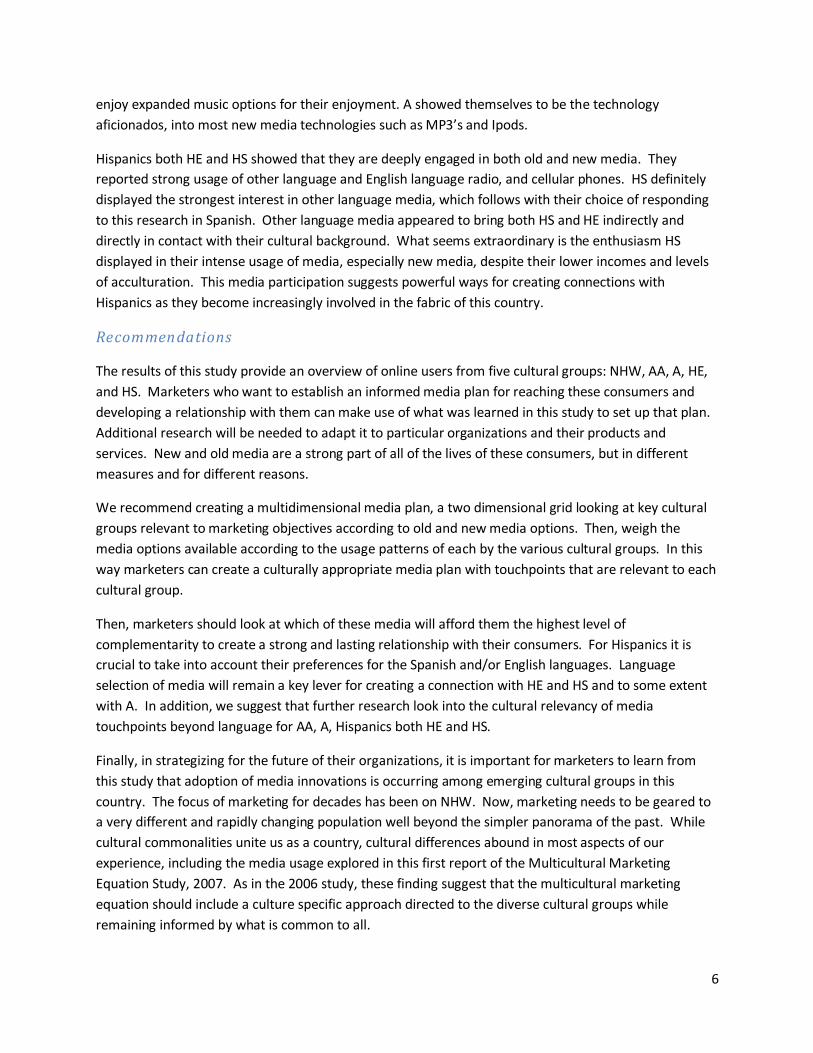
enjoy expanded music options for their enjoyment. A showed themselves to be the technology
aficionados, into most new media technologies such as MP3’s and Ipods.
Hispanics both HE and HS showed that they are deeply engaged in both old and new media. They
reported strong usage of other language and English language radio, and cellular phones. HS definitely
displayed the strongest interest in other language media, which follows with their choice of responding
to this research in Spanish. Other language media appeared to bring both HS and HE indirectly and
directly in contact with their cultural background. What seems extraordinary is the enthusiasm HS
displayed in their intense usage of media, especially new media, despite their lower incomes and levels
of acculturation. This media participation suggests powerful ways for creating connections with
Hispanics as they become increasingly involved in the fabric of this country.
Recommendations
The results of this study provide an overview of online users from five cultural groups: NHW, AA, A, HE,
and HS. Marketers who want to establish an informed media plan for reaching these consumers and
developing a relationship with them can make use of what was learned in this study to set up that plan.
Additional research will be needed to adapt it to particular organizations and their products and
services. New and old media are a strong part of all of the lives of these consumers, but in different
measures and for different reasons.
We recommend creating a multidimensional media plan, a two dimensional grid looking at key cultural
groups relevant to marketing objectives according to old and new media options. Then, weigh the
media options available according to the usage patterns of each by the various cultural groups. In this
way marketers can create a culturally appropriate media plan with touchpoints that are relevant to each
cultural group.
Then, marketers should look at which of these media will afford them the highest level of
complementarity to create a strong and lasting relationship with their consumers. For Hispanics it is
crucial to take into account their preferences for the Spanish and/or English languages. Language
selection of media will remain a key lever for creating a connection with HE and HS and to some extent
with A. In addition, we suggest that further research look into the cultural relevancy of media
touchpoints beyond language for AA, A, Hispanics both HE and HS.
Finally, in strategizing for the future of their organizations, it is important for marketers to learn from
this study that adoption of media innovations is occurring among emerging cultural groups in this
country. The focus of marketing for decades has been on NHW. Now, marketing needs to be geared to
a very different and rapidly changing population well beyond the simpler panorama of the past. While
cultural commonalities unite us as a country, cultural differences abound in most aspects of our
experience, including the media usage explored in this first report of the Multicultural Marketing
Equation Study, 2007. As in the 2006 study, these finding suggest that the multicultural marketing
equation should include a culture specific approach directed to the diverse cultural groups while
remaining informed by what is common to all.

7
Introduction
Understanding the Multicultural Marketing Equation in our rapidly changing United States population is
a critical concern for marketers and the organizations they serve. How do they balance communication
to diverse consumers in the U.S.? Should they use an overall homogeneous multicultural approach
common to all, or diverse messages for the various cultural groups that make up our complex society?
Little is known about the contrasting consumer behaviors of Hispanics, Asians, African Americans, and
Non-Hispanic Whites to guide decision making. This series of reports will summarize data from the 2007
Multicultural Marketing Equation Study by Florida State University and DMS Research, according to
topics. It will make comparisons as appropriate with the 2006 data published in a comprehensive
summary report last year.
Methodology for the 2007 Study
The 2007 Multicultural Marketing Equation Study was conducted online with 2500 respondents,
including the following groups: Non-Hispanic Whites (NHW), Hispanics who completed questionnaires
in English (HE), Hispanics who completed questionnaires in Spanish (HS), African Americans (AA), and
Asians (A). There were approximately 500 respondents in each of these groups, with the total Hispanic
sample reaching approximately 1000, and the AA sample somewhat larger at over 560. In contrast to
the 2006 study, Hispanics were provided the opportunity to respond to the questionnaire in English or in
Spanish. The HE sample included 428 completed questionnaires. These robust numbers provided the
opportunity for between group comparisons with differences reported at a level of Probability of ≤ .05.
More specific information on methodology is provided in the Methodological Note at the end of this
report.
Media usage is one of the challenging areas of communication that is continuously evolving as media
fragmentation becomes more prevalent. Sheer media exposure estimates are particularly important at
this time when touchpoints of very diverse characteristics are sources of messaging and influence.
Understanding how new options in media usage affect consumers with diverse backgrounds has
become an imperative for communication strategy planning.
Media covered in the 2007 Study
In this 2007 Multicultural Equation Marketing Research Study we asked respondents to tell us the
approximate number of hours per week they spend with television, radio, newspapers, magazines, and
the Internet including e-mail, in English and in another language. Use of other new technologies such as
cellular phones, CDs, MP3’s or an iPod, electronic games, satellite radio, and music on TV were also
included in the study. In addition, the demographic information provided by the respondents has been
used in some of the data analysis to shed light on these media habits.

8
Main Findings
Old Media Exposure
Television
The following table shows the differences and similarities in television exposure in English among the
five cultural groups included in this study:
Table 1: Watching Television in English
Mean Differences in Hours per Week
Cultural Groups N Probability ≤ .05
Hispanic Spanish 428 8.46
Asians 502 16.83
Hispanic English 493 16.92
African Americans 564 21.02
Non-Hispanic Whites 513 22.53
This table style is convenient in detailing the statistical differences (or lack of differences) among the five
groups. The means of groups contained in a single box are not statistically different from each other
and means of groups in different boxes are statistically different from each other at the probability level
lower or equal to .05. That means that the probability of means being in different boxes by error is very
small (about 5% of the time or less).
What this table highlights is that NHW and AA are more avid English television viewers than the other
groups. The table also shows that A and HE watch less English language television than AA and NHW,
and that they do not differ between themselves. As expected, Hispanics who completed the
questionnaire in Spanish were almost half as likely as their English speaking Hispanic counterparts to
watch television in English.
Age appears to be partly responsible for this exposure to English language television. The following
table shows the differences of these cultural groups by age:

9
Table 2: What is your age?
Mean Differences in Age
Cultural Group N Probability ≤ .05
Hispanic English 493 38.27
Asians 502 38.83 38.83
Hispanic Spanish 428 40.18
African Americans 564 43.38
Non-Hispanic Whites 513 51.25
Taking into consideration that the study was only conducted with adults 18 years of age and older, the
means are higher than in the overall groups represented. It is likely that NHW spend more time with
television given that older adults are more likely to be retired and have more available time for watching
TV. Coincidentally, AA follow NHW in age, further substantiating this trend. The differences among the
rest of the groups are smaller, even though HS are somewhat older than HE.
Exposure to television in a language other than English is documented in table 3:
Table 3: Watching television in another language
Mean Differences in Hours per Week
Cultural Groups N Probability ≤ .05
Non-Hispanic Whites 513 .19
African Americans 564 .20
Asians 502 2.42
Hispanic English 493 2.76
Hispanic Spanish 428 10.81
Not surprising but of interest, is that the largest amount of exposure to television in another language is
by HS, followed by HE, and by A. Worthy of attention is the fact that HS watch almost 8 hours more in
their native language than HE. It seems logical to assume that their “other language” viewing is in
Spanish. Further, HE watch almost 3 hours of television in Spanish despite their preference for
responding to this questionnaire in English. This highlights the notion that the Spanish language does
not only have a utilitarian value for Hispanics but also an emotional component that is appealing even to
those who are proficient in English.
While Asians watch somewhat less television overall, they still invest part of their exposure in watching
in their native languages. Again, we have made the assumption that their other language viewing is in
their native languages. While we did not provide Asians with a questionnaire in their native languages,
the estimate above also substantiates the importance of native languages to them. Clearly the amount
of exposure of AA and NHW to television in other languages is negligible as expected.
10
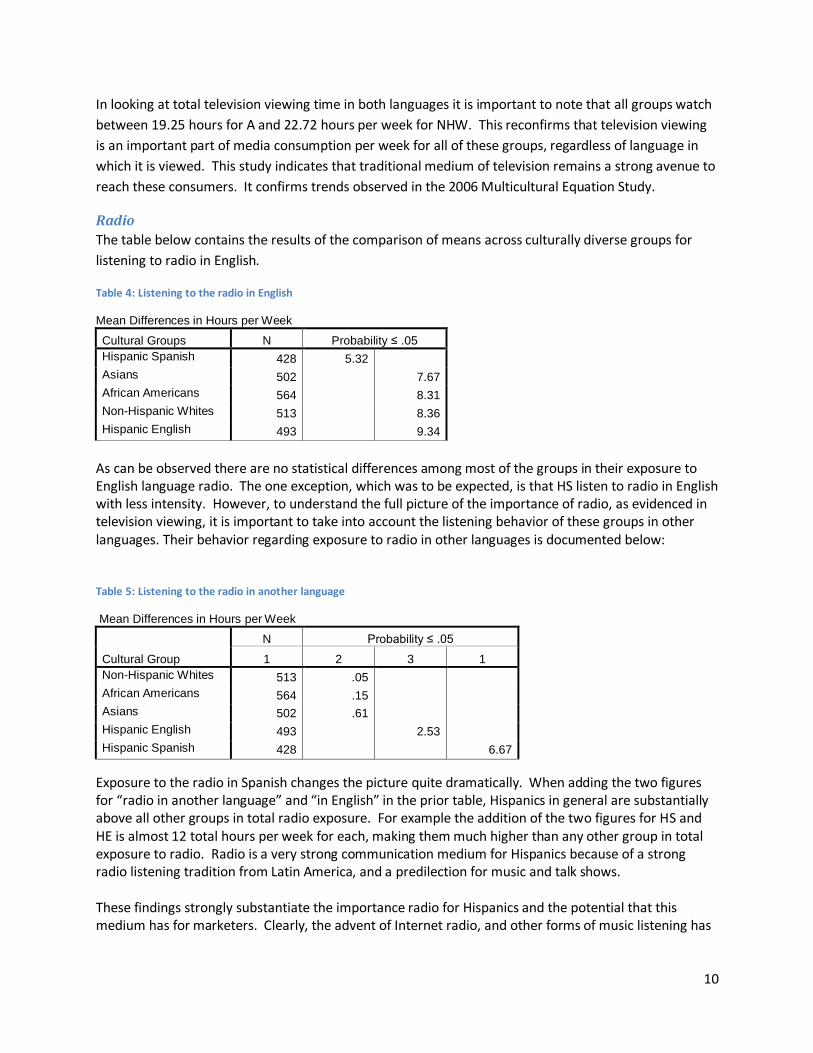
In looking at total television viewing time in both languages it is important to note that all groups watch
between 19.25 hours for A and 22.72 hours per week for NHW. This reconfirms that television viewing
is an important part of media consumption per week for all of these groups, regardless of language in
which it is viewed. This study indicates that traditional medium of television remains a strong avenue to
reach these consumers. It confirms trends observed in the 2006 Multicultural Equation Study.
Radio
The table below contains the results of the comparison of means across culturally diverse groups for
listening to radio in English.
Table 4: Listening to the radio in English
Mean Differences in Hours per Week
Cultural Groups N Probability ≤ .05
Hispanic Spanish 428 5.32
Asians 502 7.67
African Americans 564 8.31
Non-Hispanic Whites 513 8.36
Hispanic English 493 9.34
As can be observed there are no statistical differences among most of the groups in their exposure to English language radio. The one exception, which was to be expected, is that HS listen to radio in English with less intensity. However, to understand the full picture of the importance of radio, as evidenced in television viewing, it is important to take into account the listening behavior of these groups in other languages. Their behavior regarding exposure to radio in other languages is documented below: Table 5: Listening to the radio in another language
Mean Differences in Hours per Week
Cultural Group
N Probability ≤ .05
1 2 3 1
Non-Hispanic Whites 513 .05
African Americans 564 .15
Asians 502 .61
Hispanic English 493 2.53
Hispanic Spanish 428 6.67
Exposure to the radio in Spanish changes the picture quite dramatically. When adding the two figures for “radio in another language” and “in English” in the prior table, Hispanics in general are substantially above all other groups in total radio exposure. For example the addition of the two figures for HS and HE is almost 12 total hours per week for each, making them much higher than any other group in total exposure to radio. Radio is a very strong communication medium for Hispanics because of a strong radio listening tradition from Latin America, and a predilection for music and talk shows. These findings strongly substantiate the importance radio for Hispanics and the potential that this medium has for marketers. Clearly, the advent of Internet radio, and other forms of music listening has

11
the potential for diluting some of this power. However, for the moment this the traditional medium of radio distinguishes Hispanics from the other groups studied.
Newspapers
The following two tables contain the results for readership of newspapers in English and in another
language:
Table 6: Reading newspapers in English
Mean Differences in Hours per Week
Cultural Groups N Probability ≤ .05
Hispanic Spanish 428 2.45
African Americans 564 3.91
Non-Hispanic Whites 513 3.99
Hispanic English 493 4.16
Asians 502 4.72
Table 7: Reading newspapers in another language
Mean Differences in Hours per Week
Cultural Groups N Probability ≤ .05
African Americans 564 .01
Non-Hispanic Whites 513 .04
Hispanic English 493 .47 .47
Asians 502 .95
Hispanic Spanish 428 2.42
Generally, there is no difference in newspaper readership among most groups with the exception of HS,
who read less in English. When looking at the combined picture, A, HE, and HS are the most avid
readers of newspapers. HS divide their newspaper reading about equally between Spanish and English
and Asians complement their English newspaper reading with a small portion of reading in their native
languages.
Taking into consideration that the respondents of this study were all online, they may not fully represent
those not online. Still, the fact that HS are highly print oriented is surprising because many new
immigrants tend to be less literate than those educated in the United States. What this speaks of is the
potential complementarity between newspapers and Internet content particularly for HS and A. In other
words, since HS and A are both online each of these types of media can stimulate interest in the other.

12
Magazines
The number of weekly hours devoted to magazine readership for both English and Spanish publications
is documented below:
Table 8: Reading magazines in English
Mean Differences in Hours per Week
Cultural Groups N Probability ≤ .05
Hispanic Spanish 428 2.58
Non-Hispanic Whites 513 2.59
African Americans 564 3.74 3.74
Hispanic English 493 3.77 3.77
Asians 502 4.36
Table 9: Reading magazines in another language
Mean Differences in Hours per Week
Cultural Groups
N Probability ≤ .05
1 2 3 1
Non-Hispanic Whites 513 .01
African Americans 564 .04
Asians 502 .68
Hispanic English 493 .70
Hispanic Spanish 428 2.64
Magazines present a story parallel to that of newspapers. When combining readership of English and
Spanish magazines, HS appear to be the most avid readers of magazines followed by HE and A. It is
fascinating to note that HS and NHW spend the same amount of time reading magazines in English.
Then, HS also spend that same amount of time again reading magazines in Spanish.
As in the case of newspapers, this trend supports the notion of media complementarity with the
Internet. In addition it dissipates the stereotype that Hispanics are not as devoted readers as others in
our society. Clearly, this has to be qualified by the fact that these are all online individuals.
Further, the substantive amount of time that these groups say they devote to different media seems to
dispel the notion that these consumers are replacing their traditional media exposure with the Internet.

13
New Media Usage
The Internet including email
These were probably the most surprising findings in this part of the study. As old or traditional media
continue to be used and enjoyed, the Internet and e-mail appear to have claimed an important part of
the lives of these consumers as seen in the following tables:
Table 10: Using the Internet including e-mail in English
Mean Differences in Hours per Week
Cultural Groups N Probability ≤ .05
Hispanic Spanish 428 8.25
Hispanic English 493 17.22
African Americans 564 19.14 19.14
Asians 502 20.33
Non-Hispanic Whites 513 20.65
Table 11: Using the Internet including e-mail in another language
Mean Differences in Hours per Week
Cultural Groups N Probability = .05
African Americans 564 .06
Non-Hispanic Whites 513 .23
Asians 502 1.28
Hispanic English 493 1.33
Hispanic Spanish 428 7.96
Using the Internet in English is most prevalent among NHW , A, and AA. When combining both use of
the Internet in English and in another language, then the differences become smaller and A appear to
surpass NHW to some extent. Hispanic Internet and e-mail behavior is almost equally split for HS, and
complemented by Spanish language for HE.
These findings are surprising not just because the differences in time spent with the Internet and email
are relatively small but because Hispanics and African Americans, once online are avid consumers of this
medium. Indeed, all of these online consumer groups report spending almost an equal number of hours
on the Internet as they do watching TV. As we saw earlier, NHW tend to be older and have more time to
surf the web and be exposed to other media. This consideration makes these findings even more
important and relevant to online advertisers.

14
Use of Other Technologies
Cellular Phones
Table 12: Speaking on a cellular phone
Mean Differences in Hours per Week
Cultural Groups N Probability ≤ .05
Non-Hispanic Whites 513 3.78
Asians 502 7.64
Hispanic English 493 7.99
African Americans 564 8.61
Hispanic Spanish 428 8.99
The number of hours spent on the cell phone is almost double for all culturally diverse groups than it is
for NHW. This is one of the findings that emphasizes the growing gap between emerging minorities and
the traditional majority. While the most immediate explanation for these differences could be age, the
following table excludes age as the main explanation for the differences among culturally unique
groups:
Table 13: Average hours speaking on a cellular phone by age
Group by Age 18-25 26-35 36-45 46-55 56-65 65+
Hispanic English 9.92 9.04 8.25 6.53 3.51 3.18
Hispanic Spanish 8.02 9.53 10.71 7.15 7.67 1.90
Non-Hispanic Whites 7.71 5.20 4.79 4.35 2.18 2.16
African Americans 15.10 10.83 8.48 6.66 6.49 2.95
Asians 9.73 8.90 8.11 5.63 2.91 3.86
Total 10.40 9.16 8.29 5.85 4.28 2.44
This table emphasizes that regardless of age, NHW use the cell phone less than the other cultural
segments. Thus, belonging to a cultural group is a stronger explanation for differences than age alone.
Younger age accounts for more use of the cell phone across groups, but the differences across groups
persist regardless of age.

15
CD’s
Table 14: Listening to CD's
Mean Differences in Hours per Week
Cultural Groups N Probability ≤ .05
Non-Hispanic Whites 513 2.88
Hispanic English 493 4.27
Asians 502 4.45 4.45
African Americans 564 5.55 5.55
Hispanic Spanish 428 5.76
As in the case of cell phones, the use of CD’s is much higher among all other groups than it is for NHW.
Still, there are some small but interesting differences among these culturally diverse groups. HS, AA,
and A are more avid consumers of this medium than HE who appear to be somewhat less dedicated to
music on CD’s.
MP3’s or an iPod
Table 15: Listenign to MP3's or an iPod
Mean Differences in Hours per Week
Cultural Groups N Probability = .05
Non-Hispanic Whites 513 .87
Hispanic Spanish 428 1.93
African Americans 564 1.93
Hispanic English 493 2.88 2.88
Asians 502 3.44
The use of new music formats is again more popular among all groups than it is for NHW, nevertheless A
appear to be at the forefront in the use of this technology. This may not be surprising due to Asians’
predilection to technical innovations and also to their relative affluence. The following table shows the
income of the different groups:

16
Table 16: What is your household income
Quota on Ethnic
What is your household income? Hispanic English
Hispanic Spanish
Non-Hispanic Whites
African Americans Asians
$19,999 or less N 40 67 50 86 31
%
9.1% 19.6% 11.4% 17.8% 7.5%
$20,000 to 29,999 N 55 66 58 82 30
%
12.5% 19.3% 13.2% 17.0% 7.2%
$30,000 to 39,999 N 64 56 55 61 40
%
14.5% 16.4% 12.5% 12.7% 9.6%
$40,000 to 49,999 N 61 63 50 59 43
%
13.9% 18.4% 11.4% 12.2% 10.3%
$50,000 to 59,999 N 42 31 53 58 44
%
9.5% 9.1% 12.0% 12.0% 10.6%
$60,000 to 69,999 N 37 17 49 46 39
%
8.4% 5.0% 11.1% 9.5% 9.4%
$70,000 to 79,999 N 41 12 32 26 39
%
9.3% 3.5% 7.3% 5.4% 9.4%
$80,000 to 89,999 N 23 11 15 15 33
%
5.2% 3.2% 3.4% 3.1% 7.9%
$90,000 to 99,999 N 21 5 25 17 27
%
4.8% 1.5% 5.7% 3.5% 6.5%
$100,000 to 124,999 N 27 9 25 18 42
%
6.1% 2.6% 5.7% 3.7% 10.1%
$125,000 to 149,999 N 16 3 14 4 16
%
3.6% .9% 3.2% .8% 3.8%
$150,000 or more N 13 2 14 10 32
%
3.0% .6% 3.2% 2.1% 7.7%
Total N 440 342 440 482 416
%
100.0% 100.0% 100.0% 100.0% 100.0%
The following summary table shows the percentage of each group that have a household income of
$80,000 or more:
HE HS NHW AA A
32.00% 12.30% 28.50% 18.60% 45.40%

17
The differences are striking. Almost half of A have a household income of $80,000 or more while only
12.3% of HS have a similar income. HS and AA have the lowest levels of income in this sample which
seems to explain some of their media behaviors, particularly those which tend to be more expensive.
Electronic Games Table 17: Playing electronic games
Mean Differences in Hours per Week
Cultural Groups N Probability ≤ .05
Hispanic Spanish 428 1.02
Non-Hispanic Whites 513 1.32 1.32
Hispanic English 493 1.71 1.71
African Americans 564 1.93
Asians 502 2.05
For those who are online, playing electronic games is not unusual. There are no statistically significant
differences among most groups with the exception of HS. This may be the case because electronic
games may not be part of the behavioral repertoire of these less acculturated individuals. Cost may
enter into this scenario as well.
Cellular Phone Use for Other Than Speaking
Table 18: Using a cellular phone for things other than speaking
Mean Differences in Hours per Week
Cultural Groups N Probability ≤ .05
Non-Hispanic Whites 513 .79
Hispanic Spanish 428 1.13 1.13
Hispanic English 493 1.91 1.91
African Americans 564 1.95 1.95
Asians 502 2.17
Surfing the web, downloading ring tones, using e-mail, etc. on cell phones are more popular activities
among emerging minorities than they are for NHW and HS. NHW generally seem to be less into newer
technologies for communication as seen in the analysis above. HS may be lagging due to being in their
early stages of acculturation. This is an interesting behavioral pattern linking NHW who have been the
more established mainstream culture in the United States and HS who tend to be those who are less
acculturated. It seems that NHW who have had the most opportunity to avail themselves of new
technologies through income and education, have made the choice not to innovate in this area, while HS
who are already strong users of cellular phones may only lack the acculturation element to incorporate
some of these behaviors. Cost may also be a prohibitive factor for some of these features.
18
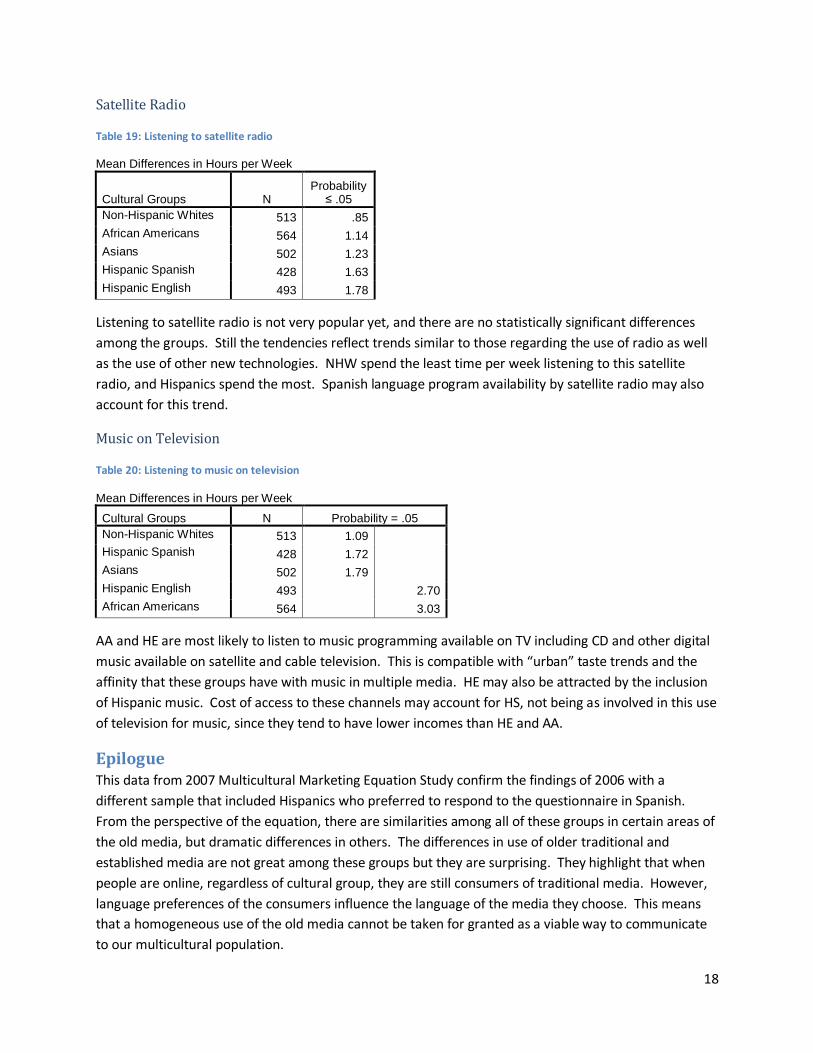
Satellite Radio
Table 19: Listening to satellite radio
Mean Differences in Hours per Week
Cultural Groups N Probability
≤ .05
Non-Hispanic Whites 513 .85
African Americans 564 1.14
Asians 502 1.23
Hispanic Spanish 428 1.63
Hispanic English 493 1.78
Listening to satellite radio is not very popular yet, and there are no statistically significant differences
among the groups. Still the tendencies reflect trends similar to those regarding the use of radio as well
as the use of other new technologies. NHW spend the least time per week listening to this satellite
radio, and Hispanics spend the most. Spanish language program availability by satellite radio may also
account for this trend.
Music on Television
Table 20: Listening to music on television
Mean Differences in Hours per Week
Cultural Groups N Probability = .05
Non-Hispanic Whites 513 1.09
Hispanic Spanish 428 1.72
Asians 502 1.79
Hispanic English 493 2.70
African Americans 564 3.03
AA and HE are most likely to listen to music programming available on TV including CD and other digital
music available on satellite and cable television. This is compatible with “urban” taste trends and the
affinity that these groups have with music in multiple media. HE may also be attracted by the inclusion
of Hispanic music. Cost of access to these channels may account for HS, not being as involved in this use
of television for music, since they tend to have lower incomes than HE and AA.
Epilogue This data from 2007 Multicultural Marketing Equation Study confirm the findings of 2006 with a
different sample that included Hispanics who preferred to respond to the questionnaire in Spanish.
From the perspective of the equation, there are similarities among all of these groups in certain areas of
the old media, but dramatic differences in others. The differences in use of older traditional and
established media are not great among these groups but they are surprising. They highlight that when
people are online, regardless of cultural group, they are still consumers of traditional media. However,
language preferences of the consumers influence the language of the media they choose. This means
that a homogeneous use of the old media cannot be taken for granted as a viable way to communicate
to our multicultural population.

19
When it comes to new media, emerging minorities are more aggressively using these new modes of
communication while NHW tend to be less adventurous, a trend that also surprised us in the 2006 study.
However, there are surprises and nuances even within these trends including differences between HE
and HS, as well as between A, AA, and both HE and HS. This suggests that marketers that have assumed
that consumers online are parallel to those offline may have underestimated the way in which culturally
diverse groups are leaving behind their NHW counterparts, and adapting new technologies to meet their
cultural and personal needs.
The Multicultural Marketing Equation for Media
Commonalities
One resounding commonality among the five cultural groups is that all are firmly entrenched to almost
the same extent in the use of traditional “old” media, particularly television, and the new media of the
Internet. Each of these five groups spends close to 20 hours a week on television, and yet another 20
hours on the Internet! Marketers should realize that both old and new media avenues create not only
access to these consumers, but complement each other to reinforce a strong communication link.
However, this does not mean that the multicultural marketing equation is full tilt on the commonalities
side. Even though the five cultural groups share these common television and Internet media
tendencies, they have differing attitudes, values, tastes, and language preferences, to be revealed in
future parts of this study, which need consideration in appealing to their hearts and minds.
Cultural Differences
The vibrant message to marketers is that a wide range of new technology touchpoints are even more
prevalent among emerging minorities than NHW. The 2007 sample in which we have included HE and
HS allowed us to understand the online Hispanic market more fully. In some cases, HS, who are less
acculturated and have lower incomes, have less new technology usage than HE. However, HS presence,
in most cases is stronger than NHW. A and AA often showed parallel trends to the other emerging
cultural groups. Yet, they do exhibit distinct new media preferences which reflect their cultures.
Overall, the multicultural marketing equation applied to the media still shows greatest strength on the
side of cultural differences. This means that effective marketers will plan media strategy to take
advantage of the variety of media touchpoints specific to each of the cultural segments which make up
the complex population in this country. The Multicultural Marketing Equation is tipped toward the
weight of cultural differences

20
Methodological Note
Online Interviewing Method –
In 2007, sample sources were expanded to accommodate new sample requirements which
included a segment of respondents that would answer the questionnaire in Spanish in addition
to Hispanics that would answer the questionnaire in English.
Therefore, for the sample of those answering in English, respondents were originally sampled
via the Opinion Place online "river" methodology. This method has also been referred to as
"RDD for the web" as it uses broadcast promotional intercepts to generate a flow of respondents
to the Opinion Place site. Respondents are screened and assigned to surveys in real-time, and
are not considered registered panelists since most do not return to the site for ongoing survey
participation.
For the sample of those answering in Spanish, respondents were invited from Tu Opinión
Latina, a bilingual online Hispanic panel.
For the overall study, given the quota requirements, a random sample of respondents was
selected based on their demographic characteristics and invited to participate in this special
survey opportunity via a custom email invitation using the Opinion Place online “river”
methodology. Respondents completed the survey by clicking on a link in the email invitation,
which connected them with the online questionnaire.
Additional details:
Fieldwork was executed from March 7 - 27, 2007.
Respondents were required to be 18 years of age or older.
The actual number of completes per quota group is as follows: o n=513 Non-Hispanic Whites o n=493 Hispanic (English version) o n=428 Hispanic (Spanish version) o n=564 African Americans o n=502 Asians
Each respondent received a small incentive for completing the survey.
English Speaking Segment
Spanish Speaking Segment
Average survey length 22 minutes 31 minutes
Response rate 28% 20% Completion rate 79% 82%
Online programming and the assembly of the final data file were provided courtesy of Research
Results, Inc. Our gratitude goes to John Zarrella, President of Research Results, and his
excellent team of survey specialists.