of the Solar Industry - Reed Smith
22
State of the Solar Industry Solar Energy Investments and the Green Stimulus Plan March 4, 2009 Lisa Frantzis Shannon Graham
Transcript of of the Solar Industry - Reed Smith

State of the Solar Industry
Solar Energy Investments and the Green Stimulus Plan
March 4, 2009
Lisa FrantzisShannon Graham

1
Navigant Consulting, Inc. (NCI) is a specialized consulting firm known globally for its emerging energy technology and strategy expertise.
Transmission
Fuel Services
Market Modeling & Economics
Rates & Regulatory
Resource Procurement
Transmission
Fuel Services
Market Modeling & Economics
Rates & Regulatory
Resource Procurement
Power Systems, Markets & PricingPower Systems, Markets & Pricing
Performance Improvement
Customer Strategies
Generation Services
Performance Improvement
Customer Strategies
Generation Services
Business Planning & Performance Improvement
Business Planning & Performance Improvement
Energy Efficiency
Emerging Technology
Renewables
Energy Efficiency
Emerging Technology
Renewables
Emerging Technologies & Energy Efficiency
Emerging Technologies & Energy Efficiency
Energy PracticeEnergy PracticeNavigant ConsultingNavigant Consulting
• Publicly traded since 1996(NYSE: NCI)
• 2008 revenues ‐$811 million
• 41 offices globally
Navigant Consulting named ʺBest Advisory – Renewable Energyʺ in the 9th Annual Environmental Finance and Carbon Finance Market Survey
About NCI

2
Today we will be talking about solar, but that includes a number of technologies.
Solar Definition
Solar Thermal Electric Technologies
Solar Dish
Parabolic Trough Power Tower
Linear Fresnel Lens
Photovoltaics
SunPower installation at Toyota Motor Sales, 500 kW
Flat Plate
Concentrating PV

3
Topics
Solar Energy Drivers
Market Status and Growth
Solar Economics

4
Solar Drivers
Renewable Portfolio
Standards, other incentives, and
utility ownership
Growing consumer demand for green
energy
Increased cost competitiveness and lower price volatility relative to fossil fuels
Drivers
Arrival of “big players” is providing large‐scale
investment

5
Solar, relative to other renewables, has high first costs, but significant cost reductions are expected in the near term.
1. Cost range covers wide variation in current capital costs. No significant changes expected between 2007 and 2015.2. Low end of capacity factor is without thermal storage, high end is with 6 hours thermal storage starting in 2010. Thermal storage
provides some dispatchibility and control of output.
Typical Capacity Factors85%+28‐40%35‐75%85%+80%90%+75‐85%+27‐42%45‐75%75%38‐40%23‐25%85%+14‐20%13‐18%14‐20%75%+
Intermittency
2016 2009
Yes
No
Representative Total Installed Costs for U.S. ($/kW in 2009 $)
Drivers: Cost

6
RPS standards vary by the requirement size, eligible resources, dates, technology tiers/multipliers, and other factors.
1. MA has enacted an additional Alternative Energy Portfolio Standard of 5% by 2020 and an added 0.25% of sales each following year. Eligible technologies include CHP, gasification with CO2 capture, and flywheel energy storage among others.
2. ME has a goal of at least 3,000 MW of installed wind capacity by 2020.3. Guam has enacted an RPS goal of 25% by 2035.4. KS MOU between utilities and the governor for 20% wind by 2020 not included
here, as it is not an officially codified RPS goal. Source: January 2009, Database of State Incentives for Renewable Energy (DSIRE)
TargetAZ 15% by 2025 ND 10% by 2015CA 20% by 2010 NH 23.8% by 2025
CO 20% by 2020 (IOUs), 10% munis and co‐ops NJ 22.5% by 2021
CT 27% by 2020 NM 20% (IOUs), 10% (co‐ops) by 2020
DC 11% by 2022 NV 20% by 2015DE 20% by 2019 NY 24% by 2013HI 20% by 2020 OH 12.5% by 2025
IA 105 MW (2% by 1999), add’l 1000 MW goal by 2011 OR 25% (large utilities), 5%‐10%
(small utilities) by 2025
IL 25% by 2025 PA 18% in 2020
MA1 4% by 2009 ( +1%/year after) (tier 1); 3.6% tier 2 RI 16% by 2020
MD 20% by 2022 SD 10% by 2015 goalME2 10% add’l by 2017 class 1 TX 5,880 MW by 2015MI 10% by 2015 UT 20% by 2025 goal
MN 25% by 2025, (Xcel 30% by 2020) VA 12% of 2007 sales by 2022
MO 15% by 2021 VT Energy growth 2005‐’12 met by RE; 20% by 2017
MT 15% in 2015 WA 15% by 2020
NC12.5% of 2020 sales by 2021 (IOUs), 10% of 2017 sales by 2018 (munis & co‐ops)
WI 10% by 2015
As of January 2009, 28 states plus DC had renewable portfolio standards (RPS) and 5 states had renewable portfolio goals.
RPS Mandates RPS Goals
Drivers: RPS

7
States are increasingly supporting solar with RPS set‐asides and other programs.
7
RPS Standards That Include DG Solar
RPS Mandate with Solar Set Aside that Includes DG Solar
RPS Mandate that Includes DG SolarRPS Mandate in Legislation or RPS Goal that Includes DG Solar
No RPS or RPS Mandate that does not include DG Solar
Source: NCI, February 2009
Drivers: RPS and Solar Set Asides

8
States are increasingly supporting solar with RPS set‐asides and other programs.
Source: NCI estimates, January 2009.
1. TX has a 500 MW non‐wind set aside. NY has a customer‐sited distributed generation set –aside of 0.1542% of retail electricity sales. AZ has a distributed generation requirement of 4.5% of retail electricity sales.
Estimated Cumulative Solar Set Aside Capacity Targets through 2015 (MW)
States with set‐asides that can include solar 1
States with specific solar targets
Drivers: RPS and Solar Set Asides

Drivers: Utility Ownership
Many utility companies are realizing the value of solar ownership to add to the asset base and rate base the technologies.
9
Filed November 20073.5MW in 5 years2
Filed July 200877MW in 4 years1
A Sempra Energy Utility
1. SDG&E: 55MW owned by utility
2. ACE: 0.5MW will be utility owned and located on utility facilities.
3. PG&E is proposing ownership of 250MW
Filed June 200810MW in 2 years
Utility Programs for Distributed Solar: Examples of Recent Filings for Rate Basing
Filed February 2009500MW in 5 years3
Filed March 2008250MW in 5 years
Proposed 4Q 20085MW
Filed February 2009120MW in 5 years

10
Advantages of Photovoltaics (PV)
•Modular•Well suited to customer‐sited applications, and can defer some T&D losses and upgrades
•No land costs (if building mounted)• 25+ years of proven reliability and field performance (crystalline silicon)• PV output is often a good match with peak demand, thus offsetting the most expensive power
•Minimal O&M costs (no moving parts if trackers not used)•Cost‐effective today in many off‐grid applications such as telecom, water pumping, cathodic protection, rural electrification
PV can be sited at customer premises to compete with retail power, but high first cost is still a major barrier to broader market penetration
Drivers: PV Advantages

11
CSP will eventually use thermal storage or natural gas hybrids that can result in capacity factors of > 40%.
Drivers: CSP Advantages
CSP Advantages
•…Versus traditional generating technologies− No emissions, except when combined with natural gas capability in hybrid configurations
•…Versus wind power− Potential high coincidence between peak output and peak demand. Wind power often does not have this coincidence.
•…Versus photovoltaics (PV)− Large scale relative to PV, with plant size ranging from 25 kW (dish Stirling) to 50 MW+ (trough or tower systems)
− Require predominantly conventional materials – glass, aluminum, concrete,‐ so no scientific breakthroughs are required to reduce costs, and storage can be applied to increase capacity factors
•…Versus PV and Wind Power − Uses some of the same technologies as conventional central power plants (steam turbine generators), accelerating the learning curve.
− Thermal storage is a natural extension of trough and tower technologies.

12
Source: Navigant Consulting PV Service Program, February 2009.
US Europe JapanCompany Headquarters
Other
Market Status: Photovoltaics
Global Demand (2008)Total Shipments = 5,455.8 MW
In 2008, the US only represented 8% of global demand.

13
The US is expected to have 16% growth in 2009 in a conservative scenario, but possibly less if we are in a recession throughout the year.
Historical and Projected Annual PV Demand, 2001‐2013
Actual ForecastSource: Navigant Consulting PV Service Program, February 2009.
World
USA
Market Status: Photovoltaics
14
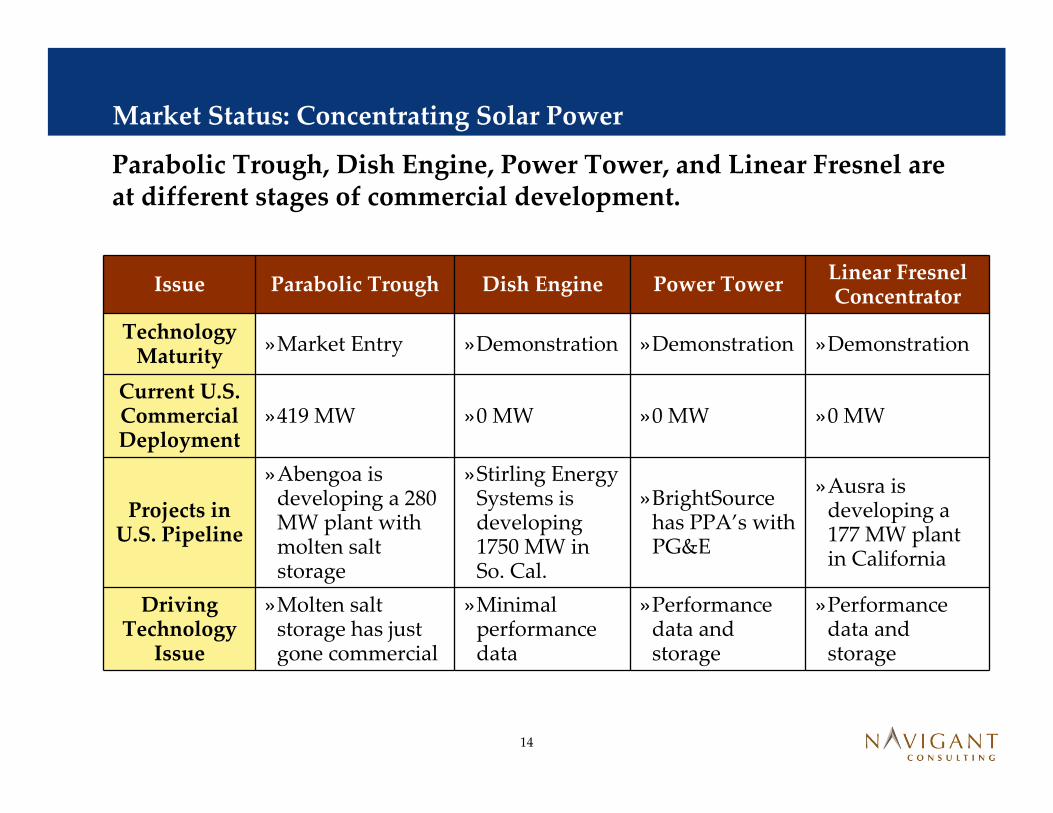
Parabolic Trough, Dish Engine, Power Tower, and Linear Fresnel are at different stages of commercial development.
Issue Parabolic Trough Dish Engine Power Tower Linear Fresnel Concentrator
Technology Maturity »Market Entry »Demonstration »Demonstration »Demonstration
Current U.S. Commercial Deployment
»419 MW »0 MW »0 MW »0 MW
Projects in U.S. Pipeline
»Abengoa is developing a 280 MW plant with molten salt storage
»Stirling Energy Systems is developing 1750 MW in So. Cal.
»BrightSourcehas PPA’s with PG&E
»Ausra is developing a 177 MW plant in California
Driving Technology Issue
»Molten salt storage has just gone commercial
»Minimal performance data
»Performance data and storage
»Performance data and storage
Market Status: Concentrating Solar Power

15
Building applications of solar compete with retail rates, and central applications compete with wholesale rates.
Central Plant Step‐Up Transformer
DistributionSubstation
ReceivingStation
DistributionSubstation
DistributionSubstation
Industrial/ Agricultural
CommercialResidential
» Landfill gas» Low impact hydro
» Biomass gasification combined cycle
» Anaerobic digester gasPV
PVPV
Wholesale Tier
Retail Tier
» Land‐based wind» Offshore wind» Biomass co‐firing with coal» Biomass gasification combined cycle
» Landfill gas» Geothermal» Concentrating Solar Power»Wave» Tidal» Low‐impact Hydro
Economics: How Solar Competes

16
The Federal government uses six basic types of incentives to support renewable electricity project development.
Description PV Solar Thermal Electric
Production Tax Credit (PTC)
» 2.1 ¢/kWh (2008 tax year) for first 10 years of operation. PTC is indexed to inflation and is good through 12/31/2012 for wind, 12/31/2013 for others.
» Full value applies to wind, solar, geothermal and “closed‐ loop” biomass» Credit value is 1.0 ¢/kWh for “open‐loop” biomass, small irrigation power/qualified hydro production, cogeneration and waste‐to‐energy
Only for facilities in service before 01/01/2006
Renewable Energy Production
Incentive (REPI)
» Rough equivalent to the PTC, but for public power entities» 2.1¢/kWh (2008 $) adjusted for inflation for the first 10 years of operation. The REPI is subject to annual appropriations such that it may not be fully funded from year to year.
» EPAct 2005 reauthorized this program through 2026 (i.e., for projects installed through 2016)
Corporate Investment tax Credit (ITC)
» 30% credit against income tax as percent of investment. After 12/31/2016, 30% credit will revert back to 10%. No $ cap on ITC per project.
» The American Recovery and Reinvestment Act of 2009 (H.R. 1) allows entities to apply for a grant for the equivalent 30% instead of taking the tax credit.
30% 30%
Personal Investment Tax Credit (ITC)
» 30% credit with no maximum (no maximum is new in 2009) for technologies except for fuel cells; $500 per 0.5 kW for fuel cells.
» Eligible technologies include: PV, SHW, geothermal, small wind and fuel cells. X
Accelerated Depreciation
» Eligible technologies are classified under Modified Accelerated Cost Recovery System (MACRS) property class 5, allowing 5 year vs. 15 year depreciation
» H.R. 1 extended (through 2009) the 50% bonus depreciation in year 1 fortechnologies that can take the 5 year MACRS.
Clean Renewable Energy Bonds (CREBs)
» Tailored for not‐for‐profit utilities; generally has the same applicability as the PTC.» The federal government grants the bondholder a tax credit in lieu of the issuer paying interest to the bondholder
» $800 MM in CREBs are authorized through December 31, 2009 under The Energy Improvement and Extension Act of 2008. H.R. 1 allocated an additional $1.6 B.
Economics: Incentives

17
Individual states/municipalities provide a wide range of solar incentives, the most common of which are rebates, tax exemptions, and tax credits.
Type Typical Incentive Level and Description PVSolar Thermal Electric
Rebates on installed costs
» $2‐5/watt typical for PV»Can be lower for other technologies»May also be subject to absolute or percent limits (e.g., $4/Watt up to 60% of installed system price)
X
Property and sales tax exemptions
» Full or partial exemptions from property and/or sales tax on qualifying systems/technologies
Income tax credits
» Schemes vary:‐ May be for one or more years‐ May be based on production or on initial investment
‐ Typically have total dollar limits
Economics: State Level

Economics: LCOE – Base Case
Using NCI’s likely case for the installed cost of PV, the LCOE for a commercial system in Palo Alto may stay near ¢20/kWh by 2015.
CA Levelized Cost of Electricity for Commercial PV (50 – 300 kW) – Base Case
With and Without Federal Incentives for Given Year of Installation
Key assumptions (without incentives): Debt equity ratio: 60%:40%, cost of equity = 11%, cost of debt = 5%, Composite income tax = 37.6%. Insurance = 0.05%, Depreciation under Modified Accelerated Cost Recovery System (MACRS): 5 years + 50% bonus in year 1. Loan period = 10 years. Project economic life (for property tax calculations) = 25 years. Property tax rate of 1.5% of book value. Key assumptions (with incentives): Accelerated depreciation under MACRS 5 year schedule with 50% bonus depreciation. Federal investment tax credit = 30% of total installed cost. Currently the incentive level is 30%, due to expire in 2016. California State PBI incentive in 2009 assume Step 6: $0.15/kWh for 5 years. In 2015, the PBI is estimated to be at Step 9: $0.03/kWh for 5 years.
With Incentives – 2009 Installation, Palo Alto Insolation
18
0
10
20
30
40
50
60
2009 2015
Levelized Cost of Electricity
¢/kWh (2009 US$)
Without IncentivesWith Federal IncentivesWith Federal and State Incentives
0
10
20
30
40
50
60
LCOEwithout
Incentives
(lessaccelerated
depr)
(less ITC) (less staterebate)
LCOE withincentives
Levelized Cost of Electricity
¢/kWh (2009 US$)

19
Using NCI’s aggressive case for the installed cost of PV, the LCOE for a commercial system in Palo Alto falls to ¢15/kWh by 2015.
Economics: LCOE – Aggressive Case
CA Levelized Cost of Electricity for Commercial PV (50 – 300 kW in Size)
With and Without Federal Incentives for Given Year of Installation
Key assumptions (without incentives): Debt equity ratio: 60%:40%, cost of equity = 11%, cost of debt = 5%, Composite income tax = 37.6%. Insurance = 0.05%, Depreciation under Modified Accelerated Cost Recovery System (MACRS): 5 years + 50% bonus in year 1. Loan period = 10 years. Project economic life (for property tax calculations) = 25 years. Property tax rate of 1.5% of book value. Key assumptions (with incentives): Accelerated depreciation under MACRS 5 year schedule with 50% bonus depreciation. Federal investment tax credit = 30% of total installed cost. Currently the incentive level is 30%, due to expire in 2016. California State PBI incentive in 2009 assume Step 6: $0.15/kWh for 5 years. In 2015, the PBI is estimated to be at Step 9: $0.03/kWh for 5 years.
0
10
20
30
40
50
60
2009 2015
Levelized Cost of Electricity
¢/kWh (2009 US$)
Without IncentivesWith Federal IncentivesWith Federal and State Incentives
With Incentives – Aggressive Cost Scenario 2015 Installation, Palo Alto Insolation
0
10
20
30
40
50
60
LCOEwithout
Incentives
(lessaccelerated
depr)
(less ITC) (less staterebate)
LCOE withincentives
Levelized Cost of Electricity
¢/kWh (2009 US$)

20
Solar Energy
The economic crisis will only slow market
adoption in the near term
The Stimulus Package has provided many incentives to help the cost competitiveness and growth of solar
Installed system prices will continue to decrease for solar, making it more competitive
Conclusions
Strong market growth is still expected

21
Contact Information
Lisa FrantzisManaging DirectorNavigant Consulting, Inc.Burlington, MA 01803781‐270‐[email protected]
Shannon GrahamAssociate DirectorNavigant Consulting, Inc.San Francisco, CA 94105(415) 399‐[email protected]