
of · Survey's Child-Mother file, ... There are several reasons why levels of outcomes might differ...
61
NBER WORKING PAPER SERIES DOES HEAD START MAKE A DIFFERENCE? Janet Cunie Duncan Thomas Working Paper No. 4406 NATIONAL BUREAU OF ECONOMIC RESEARCH 1050 Massachusetts Avenue Cambridge, MA 02138 July 1993 We thank Jon Gruber for helpful comments and Nancy Cole for excellent research assistance. Janet Currie thanks the National Science Foundation for support under SES-9122640 and the National Bureau of Economic Research for support under the Olin fellowship program. This paper is part of NBER's research programs in Labor Studies and Health Economics. Any opinions expressed are those of the authors and not those of the National Bureau of Economic Research.
-
Upload
nguyendieu -
Category
Documents
-
view
213 -
download
0
Transcript of of · Survey's Child-Mother file, ... There are several reasons why levels of outcomes might differ...

NBER WORKING PAPER SERIES
DOES HEAD STARTMAKE A DIFFERENCE?
Janet Cunie
Duncan Thomas
Working Paper No. 4406
NATIONAL BUREAU OF ECONOMIC RESEARCH1050 Massachusetts Avenue
Cambridge, MA 02138July 1993
We thank Jon Gruber for helpful comments and Nancy Cole for excellent research assistance.Janet Currie thanks the National Science Foundation for support under SES-9122640 and theNational Bureau of Economic Research for support under the Olin fellowship program. Thispaper is part of NBER's research programs in Labor Studies and Health Economics. Anyopinions expressed are those of the authors and not those of the National Bureau of EconomicResearch.

NBER Working Paper #4406July 1993
DOES HEAD STARTMAKE A DIFFERENCE?
ABSTRACT
Although there is a broad hi-partisan support for Head Start, the evidence of positive long-
term effects of the program is not overwhelming. Using data from the National Longitudinal
Survey's Child-Mother file, we examine the impact of the program on a range of chi]d outcomes.
We compare non-parametric estimates of program effects with estimates from parametric models
that control for selection by including mother fixed effects. This comparison suggests that studies
that ignore selection can be substantially misleading; it also suggests that the impact of selection
differs considerably across racial and ethnic groups. After controlling for selection, we find
positive and persistent effects of participation in Head Start on the test scores of white and
Hispanic children. These children are also less likely to have repeated a grade. We find noeffects on the test scores or schooling attainment of African-American children. White children
who attend Head Start are more likely to receive a measles shot, while African-American
enrollees receive measles shots at an earlier age. African-American children who attend Head
Start are also taller than their siblings. In a sample of the children's mothers, we find evidence
that whites who attended Head Start as children are taller and have higher AFQT scores than
their siblings who did not
Janet Currie Duncan ThomasNBER Economic Growth Center1050 Massachusetts Avenue Yale UniversityCambridge, MA 02138 Box 1987, Yale Station(617) 868-3900 X344 New Haven. CT 06520and MIT (202) 432-3623

Head Start is a federal matching grant program that aims to
improve the learning skills, social skills, and health status of
poor children so that they can begin schooling on an equal footing
with their more advantaged peers. Federal guidelines require that
90% of the children served be from families with incomes below the
federal poverty line. Begun in 1964 as part of the "War on
Poverty', Head Start is the element of that program which has
enjoyed the greatest public and bi—partisan support. Former
President Bush and President Clinton have pledged to increase
federal funding so that all eligible children may be served. Today
622,000 children, roughly 28% of eligible 3 to 5 year olds, are
served at a cost of $2.2 billion per year (Stewart, 1992).
Both policy makers and the general public appear to believe
that the benefits of Head Start are well—known and well—documented.
Head Start is thought to have significant immediate effects on IQ
which decline over time and become insignificant by the third
grade. Head Start is also thought to reduce grade repetition, high
school dropout rates, and teenage pregnancies, and to improve
childrens medical care and health status (c.f. Childrens Defense
Fund, 1992). However, a close reading of the literature shows that
the evidence in support of these conclusions is rather limited.
To begin with, despite the broad goals of the Head Start
program, the majority of previous studies have focused only on
assessing gains in terms of IQ. For example, a recent review of
210 studies conducted by the U.S. Department of Health and Human
1

Services (Mckey et al., 1985)' cites only 34 studies that have
examined effects on health. These 34 studies provide useful
qualitative information about the health effects of the program,
but very few of them attempt to quantify the effects in any way.
McKey et al. also note that few studies have examined the
impact of Head Start on schooling attainment. These include:
McDonald and Monroe (undated), Goodstein, Cawley, and Burrows
(1975), Consortium (1983), Copple, CAine, and Smith (1987), Bee
(1981) and Hebbeler (1985). The first two studies found positive
effects while the others found little effect. And we are aware of
only one other study (McDonald and Monroe) that has examined the
impact of Head Start on measures of long term achievement such as
high school completion, welfare participation, and age at first
birth. They examine the effects of Head Start on high school
completion and teen pregnancy but find no effect.
In fact, the most widely cited evidence in support of the
long—term benefits of Head Start comes from studies of model
preschool programs such as the Perry Preschool Project or the
Tennessee Early Training Project. These programs were funded at
higher levels, involved more intensive programs, and •had better—
trained staff then the typical Head Start program. Furthermore,
many of these studies involved very small samples: for example, the
There have been several other surveys of the Head Startliterature. See Westinghouse Learning Corporation and OhioUniversity (1969), Bronfenbrenner (1975), Datta (1979), Horowitzand Paden (1973), and White (1985—86). Vinovskis (1993) shows thatthe debate about the efficacy of compensatory education in the U.S.dates back at least to the 1840's when 40% of all three year oldsin Massachusetts were attending infant schools.

Perry Preschool Project followed 58 treatments and 65 controls
(Berrueta—Clement et al, 1984).Finally, many studies make use of a quasi—experimental design
in which the comparison children are drawn from waiting lists for
the Head Start program. There is anecdotal evidence that local
staff select the most disadvantaged children to participate. If
this is true, then studies that rely on this design could
understate the effect of Head Start (Haskins, 1989). Lee, Brooks—
Gunn and Schnur (1988) reanalyzed data on Head Start children and
two groups of "controls and found that the Head Start group were
less likely to have a father present, and had less educated
mothers. Barnett (1992) notes that many studies are also biased by
attrition since children who attend remedial classes, who repeat a
grade, or who move, are lost.
In this study we use data from the National Longitudinal
Survey's Child—Mother file (NLSCM) to examine the impact of Head
Start on a broad array of outcomes including measures of the
child's cognitive attainment, scholastic success, utilization of
medical care, and health. The NLSCM offers a large national sample
of children who attended regular Head Start programs. Since both
mothers and children were asked about participation in the program,
we also use the sample of mothers to examine the long term effects
of Head Start.
A great advantage of the NLCSM is that, in contrast with many
previous studies, we can include controls for differences between
the family backgrounds of Head Start children and non—Head Start
3

children, by comparing the outcomes of children who were enrolled
to those of siblings who were not. Similarly, when we turn to the
sample of mothers, we can compare mothers who were enrolled with
their sisters who were not.
It is also possible to identify children who attended other
types of preschool programs and to compare their outcomes with
those of the Head Start children. These children may be a more
relevant comparison group than children who attend no preschool
since they are also cared for in group settings away from home.
The rest of the paper is laid out as follows: Section 2
provides a discussion of the methods we employ. An overview of the
data including non—parametric estimates appears in section 3.
Results based on sibling differences are shown in section 4 and our
conclusions follow. To make a long story short, we find that
participation in Head Start has a positive effect on a broad range
of outcomes, but there are significant racial and ethnic variations
in the effects which cannot be entirely explained by the fact that
some groups are more disadvantaged than others. In this paper, we
focus on identifying those who benefit from Head Start and the ways
in which these children benefit; we see this as a necessary first
step towards a more complete evaluation of the costs and benefits
of Head Start.2
2 Expenditures on Head Start comprised 20% of all federalexpenditures on child care in 1986 (Kahn and Kamerman, 1987). Itwould be useful to compare the costs and benefits of Head Startwith public and private expenditures on other forms of child care.These comparisons are complicated by the fact that 80% of HeadStart programs are part-day and may not be close substitutes forother (full—day) child—care services. (Hayes et .21., 1990).
4
2. Model and Empirical Methods
We are interested in measuring the impact of participation in
Head Start on a series of indicators of child well—being, Y; these
include measures of cognitive achievement, performance in school,
vaccination histories, and child height which is an indicator of
nutritional status. Following Becker (1981), we assume that
household members allocate resources in order to maximize their
welfare given a budget constraint and a human capital production
function. This leads to a conditional demand function (Pollak,
1969)- in which child outcomes, Y1, depend on individual and
household characteristics, X, as well as participation in Head
Start, HS1, or a preschool, PS1:
(1) Y1 = f(HS1, PS,, X, e1)
where represents individual specific unobserved heterogeneity
part of which may be common across household members.
As a first step in describing these relationships, we use a
multi—dimensional non—parametric estimator. We examine the
relationship between household permanent income and child outcomes
controlling for enrollment into Head Start or preschool. Non—
parametric regression provides a powerful tool when there is little
a priori knowledge about the shape of these income—outcome
relationships and so it is a useful descriptive device.
There are several reasons why levels of outcomes might differ
by race and ethnicity: cognitive tests may be culturally biased;
children whose mother tongue is not English may not perform well in
language based tests; part of child height is genetic and African—
5

American children tend to be taller; and white and African—American
children tend to receive health care from different kinds of
providers —— African—Americans are half as likely as whites to be
seen by a private doctor or LIMO (Bloom, 1990). It is less clear a
priori that the shapes of the functions should differ across race,
once an intercept shift has been allowed. However, the non—
parametric estimates leave no doubt that they do. Since we find
empirically that the function f depends on the race or ethnicity,
e, of the child, we allow the shape of the relationships between
the outcomes and the covariates to vary depending on whether the
child is African—American, white or Hispanic:
(2] Y1 = f,(HS1, PSi, X1, £)
These non—parametric estimates are discussed in Section 3.
It is not straightforward to move from the description of the
relationship between Head Start and child outcomes provided by the
non—parametrics to statements about the causal effects of Head
Start. The basic problem is that children are not randomly
assigned to Head Start: both parents and program administrators
choose whether or not a particular child will participate. Since
enrollment in Head Start and other preschools is endogenous,
Ordinary Least Squares (OLS) estimation of [2] may result in biased
estimates of these effects.
If it were possible to measure all of the characteristics of
children, parents, and administrators that determine participation,
then the endogeneity of program participation would not result in
biased estimates of program effects. In practice, many of these
6

variables are unobservable. To the extent that these unobserved
characteristics are constant over time and common to all household
members then they will be shared by siblings. In this case, the
difference between the outcomes of siblings will not be affected by
the unobserved characteristics and so models that incorporate
household fixed effects will provide unbiased estimates of the
impact of Head Start on child well—being.
To see this, partition child and household characteristics, x
into two groups: child specific characteristics X, such as age and
gender, and household specific characteristics, X. Let the latter
be both time varying, X, such as current income, and also time
invariant, X111., such as native ability. Assume that the
unobservable e is comprised of two components, a child specific
component c, and a household specific component, thV Then the
child outcome function [2) can be rewritten:
(3] Y = f,(HS1, PSi, X, X., Xb, td c)
If is linear then including a fixed effect for each mother
yields the estimating equation:
[4J Y = f,cHs;, PS, X, X, t)
where a prime denotes deviations from the household meabs. This is
equivalent to examining sibling differences. All household level
time invariant observables and unobservables are now removed from
the function. In order to consistently estimate the parameters of
(4] it is critical that there be no within household unobserved
characteristics that affect participation in Head Start or
preschool; that is ;, should be orthogonal to the regressors.
7
This orthogonality condition could be violated if a parent
systematically favored the sibling that was in Head Start. In this
case, the estimated Head Start effect from [4] would be an over-
estimate of the true program effect. This would occur if, for
example, parents favored first born children, or boys, and these
children were more likely to be enrolled in Head Start; we thus
control for birth order and gender of the child in the results
reported below.
It differences across racial and ethnic groups are fully
captured by intercept shifters, then the parameters of [4] will be
the same across groups. This is a testable assumption and turns
out to be false; we therefore allow all coefficients to vary with
race which is equivalent to estimating [4] with a full set of race
interactions. These fixed effects estimates are presented in
Section 4,3
The advantage of using sibling comparisons is that any
constant sources of unobserved heterogeneity between Head Start
children and other children are eliminated by this procedure. The
Another way to address the problem of the endogeneity ofprogram participation is to use instrumental variables estimators.We have experimented with this approach but have not beensuccessful in identifying convincing instruments, at least from anempirical point of view. We tried, for example, assuming that amothers participation in Head Start affected her child's outcomesonly through the child's own participation in Head Start. Althoughmaternal participation in Head Start is a significant predictor ofthe child's participation (Mott and Quinlan, 1992), it does notexplain much of the variation in participation and the second stageestimates of the impact of Head Start are very imprecise. Nelsonand Startz (1990) report then in these circumstances, IV estimatescan be very misleading. In any case, we do not report the IVresults in this paper.
B

disadvantage is that it tends to bias the estimated effects of the
program towards zero for two reasons. First, it is well known that
in the presence of measurement error, differencing may result in
"throwing the baby out with the bath water'1, since the true
"signal' may be discarded while the "noise" remains.
Secondly, estimates with household fixed effects are based on
households in which one child attended Head Start and the other did
not. If there are any spillover effects of Head Start from one
sibling to the other, then the difference between the two siblings
will underestimate the effect of the program. Spillover effects
might be important either because a child teaches his or her
sibling something learned in Head Start, or because the parent
learns something or gains access to a service that is beneficial to
both children. Conversely, a negative shock to a family that made
one child eligible for Head Start could have an adverse impact on
the other child, even if that child was not eligible for Head Start
because of age. These arguments suggest that the estimates
presented below may be lower bounds on the true program effects.
3. The Data
(a) An Overview of the NLScM
The National Longitudinal Survey of Youth (NLSY) began in 1979
with 6283 young women between the ages of 14 and 21. These women
have been surveyed annually ever since. As of 1990, they had given
birth to over 8500 children. In 1986, the NLS began a separate
survey of the children of the NLSY, the National Longitudinal
9

Survey's Child—Mother file or NLSCM. All the children completed
age—appropriate assessments of cognitive skills, mothers answered
questions about their child's schooling attainment and utilization
of health care, and the children's heights were recorded. Second
and third waves of the NLSCM were undertaken in 1988 and 1990. In
these two waves, mothers were asked whether their child had ever
participated in Head Start.
It is important to note that the original NLSY oversampled
African—Americans, Hispanics, and the poor and so it is not a
representative sample of all American mothers in the relevant age
group. Also, the fact that we are focusing on children with
siblings biases our sample towards the poorest, since poor women
tend to have larger families and begin child bearing at younger
ages. But the unrepresentativeness of the sample is balanced by
the fact that a relatively large proportion of the sample children,
15%, participated in Head Start. In addition, there are large
enough numbers of African—Americans and Hispanics to allow separate
examinations of these groups.
Figure 1 presents non—parametric estimates of the relationship
between enrollment in Head Start, other preschools, or no preschool
and household permanent income. The non—parametric estimator used
throughout the paper is a locally—weighted smoothed scatterplot
(LOWESS) (Cleveland, 1979) which is a nearest neighbor—type
estimator. Essentially, each observation is replaced by its
predicted value based on a weighted regression using the
observations in a band around it and so the shape of the estimated
10
function is determined locally throughout the distribution of
income. (See, also, Hardle, l991).
We define permanent income as the logarithm of average annual
household income between 1978 and 1990 (in real 1990 dollars).5
Use of this measure should attenuate the influence of measurement
error and breaks the link between household income at a point in
time and eligibility for the Head Start program. Household
permanent income is about $29,000 for the average white child,
$23,000 for Hispanics and $18,000 for African-Americans. About 8%
of white children in the sample participated in Head Start; the
proportion is twice as large for Hispanics (16%) and three times as
great for African—Americans (27%).
The non—parametric estimates in the first panel of Figure 1
demonstrate that participation in Head Start declines with
permanent income. However, Figure 1 also shows that even at the
4LOWESS estimates are calculated by creating a band around eachobservation (y, x1, say) and estimating a weighted linearregression of the dependent variable on the independent variables.The predicted value of y1 is then plotted against x1 to form theTJOWESS estimates. Observations within the band are weighted by thetricube function, w,=(1—d/)3, where d is a measure of the distancebetween observation j and the observation of interest,'- i. In thesimple regression case d=(x—x1)/(x—x1) where x is the furthestobservation from observation i within the band. The weight ispositive for each observation within the band; the weight, is equalto one at the point itself, and declines as points are furtheraway. Observations outside the band are given a weight of zero. Inaddition to choosing the weighting function (or kernel), it isnecessary to choose the band width. We have experimented with arange of values and report those for which we think the estimatedfunction is sufficiently smoothed to reveal the essential shape.
In cases where the mother was living with her parents, we usethe family income. Otherwise, we use the sum of the mothers ownincome and any spouse or partner's income.
11

same level of income, African—Americans are more likely to have
been in Head Start: the estimated function for whites is everywhere
below that for African—Americans.6
The middle panel of Figure 1 shows that the probability of
attending a preschoolrises with permanent income. Differences in
the probability of attendance across racial and ethnic groups are
much smaller1 with no group dominating the other at all income
levels.
About half of all children in the sample did not attend any
preschool. The last panel of Figure 1 shows that although this
probability tends to decline with income, African—Americans are
most likely to have attended some type of preschool at all income
levels.
Means and standard errors of sample variables are shown in
Table i. White preschool children are by far the most advantaged
in terms of household permanent income: the average for these
6For example, among children from households with permanentincome between $30,000 and $40,000, 2% of whites, 10% of Hispanicsand 20% of African Americans participated in Head Start.
'overall, 22% of African Americans, 25% of Hispanics and 30%of whites attend non—Head Start preschools.
8Non—parametric estimators perform best with large sample sizesand so our estimates are based on the entire sample of data fromthe 1986, 1988 and 1990 NLSCMs. Since the fixed effects estimates,presented below, use only those children who have at least onesibling in the survey, this reduces the sample (by about 20%) to5,630 children. It turns out that the full and reduced samples aresimilar in all observable dimensions: for example, permanent incomeamong Whites on Head Start is $16,900 in the full sample and$16,700 in the reduced sample; among African Americans, the meansare $15,400 and $15,100 respectively. We thus present means inTable 1 for only the reduced sample used in the fixed effectsestimation.
12

children is about double the income of children who attended Head
Start and about 50% higher than household income of African—
Americans who attended preschool. In contrast, Head Start children
have roughly similar incomes regardless of race or ethnicity.
Hence, the disparity between preschool children and those on Head
Start is greatest among whites.
In addition to this income advantage, children who attend
preschools (other than Head Start) are also better off then Head
Starters in most other observable dimensions. Their mothers are
better educated, had higher average age at first birth, and scored
higher on the Armed Forces Qualification Test (AFQT), a
standardized test of ability.9 They are also more likely to have
a father—figure present in the household in 1990 than their peers
who attended Head Start. One potential disadvantage that the
preschool children suffer is that their mothers are more likely to
be employed in 1990, which may indicate that these women are less
able to spend time with their children.'°
The rest of this section uses non—parametric methods to
describe the relationship between participation in Head Start and
other preschool programs, and a series of child outcomes that
include scores on tests of cognitive skills, probability of
retention in grade, utilization of medical care, and height
'Since the NLSY respondents were of different ages when thetest was administered, the scores are standardized using the meanscore for each year of age.
'° For a more detailed analysis of the correlates of Head Startparticipation in the NLSCM see Mott and Quinlan (1992).
13

conditional on age. A comparison of the non-parametric results
with the sibling differences shown below will shed light on the
importance of controlling for the fact that Head Start children may
differ from other children in unobservable as well as observable
ways.
(b) Measures of Cognitive Skill and Schooling Attainment
The tests of cognitive skills that we use include the Peabody
Individual Achievement Test Mathematics Assessment (PIAT—MATH), the
Peabody Individual Achievement Test Reading Comprehension
Assessment (PIAT_READING)u, and the Peabody Picture vocabulary
Test (PPVT). For a comprehensive description of these assessments,
see Baker and Mott (1989).
The PIAT and PPVT assessments are widely known arid used. We
use percentile scores based on nationally established norms for
each age. The PPVT is also normed for gender. It has been claimed
that these tests have high test—retest reliability and tend to be
highly correlated with other measures of cognitive achievement
(Baker and Mott, 1989). We focus on math and reading comprehension
skills because these are regarded as among the most basic academic
skills. PPVT scores from the NLSCM have been used •in several
recent studies as the sole measure of intellectual ability. (Hill
and O'Neill, 1992; Desai et al., 1989). It is instructive to
The NLSCM also includes the flAT test of ReadingRecognition. Children must score above a minimum level on thistest of word recognition before they will be tested for readingcomprehension. Examination of the reading recognition scoresproduced results which were qualitatively similar, though weaker,than the results reported below for reading comprehension.
14
compare results based on this test with results based on the other
two.?IAT scores.
The PIATs were administered to all children of five and over,
and were administered to many children in more than one wave of the
survey. In cases where there are repeated measures we use the mean
score in order to attenuate the influence of random measurement
error)2 The PPvT was administered to all children of three and
over, but due to budget constraints, was typically only
administered once per child.
Non—parametric estimates of the relationship between Head
Start and other preschool participation, permanent income, and test
scores are shown separately for whites, African—Americans, and
Hispanics in Figures 2 through 4)3 These figures show that on all
three tests, scores tend to rise with income and whites score
higher than other children.
The racial and ethnic differences are most dramatic for PPvT
scores: the average score for a white child is 42 but the scores
for African—Americans and Hispanics are only 16 and 22,
respectively. the slopes of the income—PPVT functions are also
significantly different across the three groups: they are twice as
12 A third of the total variation in the flAT scores is"within" rather than "between" children which indicates thatmeasurement error may be an important problem. Zigler, Abelson andSeitz (1973) show that a preschooler's performance on the PPVT isinfluenced by anxiety and rapport with the interviewer, whichsuggests one possible source of within child variability in testscores.
'3unless otherwise indicated, the bandwidths for all LOWESSestimates are 35% for children on Head Start, 30% for children inpre—school and 25% for other children.
15
steep for whites as for African-Americans.
The fact that these tests snay have cultural biases that impede
the performance of minorities provided an initial rational for a
separate examination of each group. These figures show that there
are good reasons, on empirical grounds, for permitting the shapes
of the regression functions to vary with race and ethnicity.
Figures 2 through 4 can be used to compare the effects of Head
Start, preschool, and no preschool attendance on test scores, after
controlling for permanent income. They indicate that white
preschool children have higher scores than either Read Start
children or those who never attended preschool. This is true at
all income levels. Furthermore, on the HATs, Head Start children
tend to score below those who had no preschool.'4
Among African—Americans, the evidence is substantially
different. At low levels of income, no clear differences emerge
among the three groups of children. As income rises, however, the
HAT scores of preschoolers tend to rise faster than those who
attended Head Start or no preschool.
Finally, the figures show that among Hispanics, both preschool
and Head Start children tend to have higher PIAT—READING and PPVT
" In a linear regression of test scores on dummy variables forHead Start participation, preschool participation, age, gender, andc?ntrols for income, we find that preschoolers score 3 to S pointshigher than those who never attended preschool. In turn, thelatter score about 5 points higher on the PIATS relative to ReadStart children. All of these differences are statisticallysignificant.
16
scores relative to children who did not attend preschool." This
suggests that early English—language schooling may have powerful
effects on the reading and vocabulary skills of Hispanic children.
The question about schooling attainment that we use is "Has
your child repeated any grade(s) for any reason?" which was asked
only of children at least 10 years old.'6 About 30% of white and
Hispanic children and 40% of African—American children are reported
to have repeated a grade.'7
Non-parametric estimates of the probability of repeating a
grade are shown in Figure 5. The probability of repeating a grade
tends to decline with income except for white Head Start children:
at all but the lowest income levels, white children who attended
Head Start are more likely to repeat a grade than other white
children. In contrast, grade repetition among African—Americans is
unrelated to Head Start or other preschool attendance. Among
Hispanics both Head Start and other preschool children are less
likely to repeat a grade than children who attended no preschool.
In sum, Figures 2 through S suggest that preschoolers tend to
perform better both in terms of test scores and school attainment
than those children who attended Head Start or no preschool at all.
These differences are larger for preschQolers andsignificant in both cases.
'6This restriction results in smaller sample sizes and so thenon—parametric estimates have larger bandwidths (of 55%) in eachcase.
"Keep in mind that academic failure is not the only reason fora child to repeat a grade. Children may also repeat grades becauseof absenteeism or because they are deemed to lag behind their peerssocially.
17

Among African—Americans and Hispanics, there are no clear
differences between the latter two groups of children. Among
Whites, however, Head Start children appear to perform
significantly worse than those who never went to preschool.
Furthermore, the gap in test scores and schooling attainment
between white children who attended Head Start and white children
who attended other preschools is much greater than it is for
African—Americans or Hispanics —— and this is true after
controlling for income in a very flexible way. We will return to
the issue below.
(c) Health Care and the Health Status of Children
Turning to measures of the utilization of health care and
health status, we look at whether the child had received a measles
shot by 1990, and the child's height—for—age. Head Start aims to
"provide a comprehensive health services program which includes a
broad range of medical services..." including "an assessment of
immunization status". The Head Start program performance standards
also state that "every child in a part—day program will receive a
quantity of food in meals.. .and snacks which provides at least 1/3
of daily nutritional needs..." (Head Start Bureau, 1992). The
requirement that all children be fed has been an integral part of
the program since its inception. Both nutritious food and better
medical care are expected to improve child growth. Hence, there is
some reason to expect a positive effect of participation in Head
Start on child height as well as on immunization rates.
Unlike test scores or schooling attainment, immunization
18

probabilities are fairly similar for whites, African-Americans, and
Hispanics (even after controlling for income). Whereas little over
half the children in the sample have received a measles shot, this
proportion is about 0.85 among those children who attended Head
Start. In part, this reflects the fact that immunization
probabilities tend to decline slightly with income, as shown in
Figure 6.
This figure demonstrates one of our most striking results:
for whites and African—Americans, the probability of having been
immunized against measles is significantly higher at all income
levels for children who were in Head Start relative to those who
went to other preschools. The latter are, in turn, more likely to
have been immunized than those who did not attend any preschool.
Among Hispanics, the large differences are between those who went
to Head Start or another preschool and those who did not.'8 Thus,
for all three ethnic groups, those who did not attend any preschool
are the least likely to have been immunized.
Height—for—age, is a relatively objective measure of health
status which has been profitably used in the nutrition, economic
history and development literatures (see, for example, Fogel, 1986;
Martorell and Habicht, 1986). The evidence suggests that well—
nourished children in many societies follow similar growth curves
and it has been argued that height, conditional on age and gender,
is a good indicator of longer run nutritional and health status.
Growth varies systematically with age and gender so we
' All these differences are significant.
19
standardize height following guidelines from the National Center
for Health Statistics (1976). Each child in the sample is compared
with the median child in a population of well nourished children of
the same age and gender in the United States; the sample height—
for—age is expressed as a percentage of this median.'9 In spite of
the fact that the NLSCM is a sample of relatively pOor children,
the height (conditional on age and gender) of the average child is
only slightly below the US median. This is partly because African—
Americans are significantly taller than whites or Hispanics.
The growth curves of poor children in many countries show
systematic deviations from the growth curves of the median child
(Waterlow, et al., 1977). As Appendix Figure 1 shows, in the
NLSCH, the growth of children tends to falter at an early age but
appears to catches up to the median US child after age 2. For this
reason, it is likely to be important to compare children of
approximately similar ages. Hence, we use the first measure of
height taken after age S for each child.
Figure 7 shows that among whites and African—Americans, height
for age is largely unrelated to income but there are substantial
'91n the NLSCM, child height is either measured (by theenumerator or mother) or recalled by the mother. In the 1986survey, it is not possible to identify those children that wereactually measured although reported height was apparently based onrecall for very few children (personal communication, Paula Baker,1993). In the 1968 and 1990 surveys, the heights of about 30% ofchildren were reported by their mothers and the probability ofbeing measured rises with age. There is very little evidence forstacking in the recall data and the variances are similar for bothrecall arid measured data and so, in this paper, we use all reportedchild heights. These issues are taken up more fully in Currie andThomas, (1993).
20
differences among the three preschool groups. White children who
attended preschools are (significantly) taller than other children.
It is not clear that there is much difference between those who
attended Head Start and those who did not attend any preschool.
Among African—Americans, children who attended Head Start are very
close, in terms of height, to those who attended preschools and
both these groups of children are taller than the other children.
All these patterns persist across the income distribution. The
differences among Hispanics are less clear although at the top of
the income distribution we see that, like African—Americans,
Hispanic Head Starters and preschoolers are about the same height
and are taller, given age, than the other children.
In sum, the results in Figures 6 and 7 suggest that Head Start
children are more likely to be immunized than other children and
also tend to be as tall as children who attended other preschools,
at least among African—Americans and higher income Hispanics.
Recall that Head Starters tend to perform no better on test
scores than other preschoolers and whites seem to perform worse
than those who attended no preschool at all. It may be that the
positive correlation between health and Head Start ot preschool
enrollment reflects selection into the program: taller and
healthier children may be more likely to be enrolled. We address
the issue of selection below.
(d) Households with Changes in Chi1drens Head Start Status
The non—parametric estimates may reflect omitted unobserved
characteristics of the families or children that are correlated
21

with participation in Head Start. In an attempt to control for
these differences, we estimate models that include fixed effects
for each mother. These models are identified using the subset of
children in families who live in families in which at least one
child attended Head Start and at least one did not. A description
of this subsample of children appears in Table 2.
The first row of Table 2 shows that Head Start effects in the
fixed effects models are based largely on within—family comparisons
of children in Head Start with siblings who did not attend any
preschool: relatively few families with a child who attended Head
Start had a child who attended a different kind of preschool.
Although the results are not shown, the converse is also true:
families with at least one child in preschool and at least one
child not in preschool were unlikely ever to have had a child in
Head Start. Thus, estimates of Head Start and other preschool
effects are based on largely non—overlapping samples of families.
The second thing that is apparent in Table 2, is that using
sibling differences eliminates many of the large differences in
observables between Head Start and other children that were evident
in Table 1. For example, the difference between the family income
at the time the Head Start child was age 3 and the time the sibling
was age 3, is small.2° The probability that the mother was
20 Income at age 3 is relevant since this is the age that mostchildren would begin preschool or Head Start. We actually use themean of income at age 2, income at age 3, and income at age 4 inorder to attenuate the effects of random measurement error. If thechild was born after 1988, we use the mean income in 1988, 1989,and 1990.
22

employed in the birth year is also similar for the two groups.
However, Table 2 suggests that within a family, the child who
attended Head Start is more likely to have been the first born and
so is older then the "no preschool' sibling and was born to a
younger mother. Head Start children are also less likely to have
had a father—figure present in the birth year. Thus, on the whole,
children seem to have been enrolled in Head Start at a tine when
the mother was disadvantaged, relative to her future prospects.
However, since there may be advantages associated with being the
first born, we will control for this in the estimation. An
examination of families with at least one other preschool and one
non—preschool child showed the opposite pattern: children were more
likely to attend preschool when their mothers were relatively well
off.
Turning to test scores, Table 2 shows that Head Start children
tend to out—perform their siblings on PPVTs. The difference is
very pronounced among Hispanics (Head Starters score twice as high
as other children) and large among African—Americans. Within
families, children who attended Head Start are less likely to
repeat a grade then siblings who attended no preschool. Head
Starters are also more likely to have had a measles shot. Finally,
among both African—Americans and Hispanics, Head Start children are
taller then their siblings who did not attend although the reverse
is true for whites,
In summary, the inclusion of mother fixed effects is unlikely
to perfectly control for all relevant unobservables. Nevertheless,
23

given the disadvantaged background of the Head Start children
relative to even their own siblings, we contend that positive
measured effects of Head Start that equal or exceed the measured
effects of other preschool programs are unlikely to reflect omitted
characteristics of mothers or children.
Ce) Long run effects of Head Start
In the last part of the paper we focus on the long run effects
of Head Start by exploiting the fact that in 1988, mothers in the
NLSCM were asked "Were you ever in Head Start as a child?". Again,
in order to take account of selection into Head Start, we estimate
models that include family fixed effects and so use a sample of
mothers who are sisters in order to examine the relationship
between participation as a child and outcomes as an adult. This
sample is rather small —— there are 103 white, 143 African—
American, and 46 Hispanic mothers with a sister in the sample of
mothers and complete information about their own and their sisters
Head Start participation and outcomes. We do not, therefore,
consider Hispanics separately.-
The outcomes we consider are whether the mother ever
participated in AFDC, high school completion, age at first birth,
attained height, and the score on the Armed Forces Qualifications
Test (AFQT). The women in this sample of mothers who are siblings
are somewhat more disadvantaged than the mothers of children in the
child—sibling sample: 52% participated in AFDC at some time
compared to 33% in the larger group, 76% completed high school
compared to 80%, the average age at first birth is 19 compared to
24
20.6, and the average (normalized) AFQT score is .92 compared to
1.04. There is no difference in average heights.
4: Results Usinc Sibling Differences
Parametric estimates of the effects of Head Start and other
preschool attendance on a series of child outcomes are reported in
Tables 3 through 7. The models are of the form [4), and include a
fixed effect for each mother in order to capture time invariant
household characteristics. Each regression also includes a control
for whether or not the child attended Head Start or another
preschool, the age of the child at the survey date (in months),
gender, and an indicator for whether the child is the first born.
We control for household income by including the log of the average
income taken over the three years centered on the year the child
turned 3. In a fixed effects context, it is the deviations of
income and child age from mother—specific means that matter.
Hence, income at age 3 is a measure of changes in the family's
circumstances over time while child age controls for the effects of
birth interval.
We have also estimated all of the models reported-in Tables 3
to 7 below including controls for marital status in the birth year,
and maternal employment status in the birth year. These variables
were occasionally statistically, significant, but their inclusion
had little impact on the estimated coefficients on the Bead Start
or other preschool controls. We have chosen to present the more
parsimonious models since they do not suffer from the potential
25

endogeneity of changes in marital or employment status.2'
(a) Measures of Cognitive Skill and Schooling Attainment
Models of NAT and PPVT scores that include indicators for
Head Start and preschool attendance as well as mother fixed effects
are shown in Table 3. The results in the first half of the table
apply to all children with valid assessments.
Recall that the non—parametric estimates above indicate that
white children who attended Head Start get lower scores on these
tests than either other preschoolers or those who never went to
preschool. In a regression that does not account for selection,
the coefficient on Head Start is significantly negative for both
flATs and also negative for ?PVT.22 In models that control for
selection, all of these effects are positive and, in fact, Head
Start is associated with a significant 5% increase in the
percentile score on the PPVT.
The non-parametric estimates also suggested that white
children who attended non—Head Start preschools did significantly
better on these tests than either Head Start children or those who
stayed at home. Accounting for selection reduces these effects to
statistical insignificance.
21 We attribute the general lack of statistical significance ofthe employment and marital status variables to the fact that if amother is continuously employed, unemployed, married, or unmarried,the impact will be absorbed by the fixed effect, and if the motherbecomes divorced or goes to work, there may be a similar effect onall siblings.
22The OLS coefficients are —4.5 and —5.2 for PIAT—MATH andPIAT—READJUG, respectively, with standard errors around 2.0. Thecoefficient is —0.1 for PPVT.
26

A similar pattern emerges for Hispanics performance on verbal
tests (PPVT and PIAT—READING). According to the non—parametric
estimates, preschool children perform significantly better than
Head Start children who, in turn, perform better than those who did
not attend preschool. The impact of Head Start is much bigger in
the fixed effects estimates (about 9%), whereas the impact of
preschool is reduced to 3 — 5% and these effects are not
statistically significant.
For both whites and Hispanics failure to take account of
selection leads to substantially different inferences regarding the
impact of Head, Start and preschool. Even conditional on
observables, children who are enrolled in Head Start appear to be
relatively disadvantaged whereas those who go to other preschools
are relatively advantaged.
The test scores of African—Aperican children are unrelated to
whether they attended Head Start or other preschools. This is true
in regressions that ignore selection and in the fixed effects
estimates. No clear patterns emerge from a comparison of these
estimates suggesting that the selection mechanism underlying
enrolment in Head Start or preschool is quite different for these
children relative to Hispanics and whites.
As observed in the non—parametric estimates, income has
generally positive effects on the test scores of whites and
Hispanics. It is, however, statistically significant only in the
PIAT—MATH equation for Hispanics. In contrast with these results
(and also with the non—parametric estimates) income is negatively
27

associated with test scores among African—Americans in the fixed
effects models. This effect is statistically significant in the
case of PIAT—MATH scores. This perverse effect may have to do with
the fact that African—American mothers are more likely to be single
mothers, and raising their income by becoming employed may take
time away from the child. Alternatively, there may be more
measurement error in the reported incomes of African—Americans than
in the incomes of whites or Hispanics.23
The second half of Table 3 presents estimates of similar
functions based on the sample of children 8 years and older. We
focus on this group in order to see if there are gains in test
scores that persist three years or more after children have left
Head Start. Recall that most previous studies found that the
effects of Head Start had dissipated by this time. Only the
coefficients on Head Start and other preschool attendance are
shown. On the whole, the estimated coefficients on Head Start and
other preschools are similar to those just discussed, although the
coefficient on PPVT is larger for whites, and the coefficient on
flAT—READING loses statistical significance for Hispanics.
The interpretation of the results for children over 8 years
old is complicated by the fact that the oldest children in the
NL.SCM are likely to have been born to the youngest and most
disadvantaged mothers. The larger effect on PPvT among older
whites may indicate that participation in Head Start has a greater
23We reran these regressions using per capita household incomeand found very similar results.
28
positive impact on the test scores of the most disadvantaged white
children. We attempt to test this hypothesis more directly below.
In summary, relative to siblings who stayed at home,
participation in Head Start has positive effects on the math and
vocabulary scores of white children and on the reading and
vocabulary scores of Hispanic children. Furthermore, we find that
the benefits associated with Head Start appear to persist after the
child is 8 years old. The effects also equal or exceed the effects
of attending other preschools. In contrast, however, we find no
effects on the test scores of African—American children.
Test scores measure certain abilities that may contribute to
scholastic success. However, Copple et al. (1987) argue that
ability is not the only determinant of a childs success in school.
A positive self—image and determination for example, may also play
a role. While there is some evidence that test scores are
associated with higher wages (Murnane, 1993), it has been well
established that education is one of the most important
determinants of individual wages and employment probabilities. It
is thus useful to examine a more direct measure of scholastic
success than test scores.
In Table 4, we examine the probability that a child has ever
repeated a grade which is a good predictor of whether he or she
will eventually drop out of school24. The results here are similar
24 For example, Currie and Fallick (1990) found that NLSYrespondents who were not in a grade appropriate for their age at 14were more likely to drop out of school at age 16 then those whowere.
29

to those for test scores. Participation in Head Start reduces the
probability that white and Hispanic children repeat grades, but
appears to have no effect on African—American children. Attendance
at a non—Head Start preschool has no effect on grade repetition.
As discussed above, it is possible that the estimates based on
sibling differences understate the true effects of the Head Start
program. The fixed effects estimates could, therefore, be
interpreted as evidence that Head Start has smaller effects on the
test scores and scholastic attainment of African—American children
than on the test scores and scholastic attainment of other
children, rather than as evidence that there is no effect.
The fixed effects results for whites contrast sharply with the
non—parametric estimates in the previous section suggesting that
estimates that do not take account of selection into Head Start may
be substantially misleading. Among Hispanics, the benefits
associated with Head Start are also larger when we control for
selection. In contrast, the non—parametric and fixed effects
estimates for African—Americans are virtually identical. As in the
case of test scores, the selection mechanisms seem to be very
different across the three groups.
(b) Utilization of Health Care and Health Status
The effects of participation in Head Start and other
preschools on the probability of having had a measles shot and on
height—for—age are shown in Table 5. We find that Head Start
participation is associated with increases in the probabilities
that white and African—American children receive measles shots of
30

10% and 12% respectively. For whites, the effects of Head Start
and other preschool participation are equal, while for Afri:an-
Americans and Hispanics, preschool increases the probability of
having had a measles shot by only 6%. Head Start is not estimated
to have a statistically significant effect on the probability that
a Hispanic child is immunized, but we cannot reject the hypothesis
that the effects of Head Start and other preschool attendance are
equal. All these results are essentially identical to the non—
parametric estimates and suggest that taking account of selection
has little impact on the estimated effect of Head Start or
preschool on immunizations.
The fixed effects estimates may reflect the fact that the
probability of having had a shot rises sharply with age, and
children who have not attended any preschool are younger on average
than other children. Hence, at the bottom of Table 5, we show
estimates of the probability of having had a measles shot which use
only children of public school age. White children in this age
group who attended Head Start are still 8% more likely to have been
vaccinated than children who did not. However, there is now no
statistically significant effect of Head Start participation on the
probability that an African—American or Hispanic child has been
vaccinated.
This pattern of results suggests that white children who
attend Head Start are more likely to be vaccinated against measles.
However, African—American Head Start children and white children
who attend other preschools are vaccinated earlier than they would
31

otherwise have been, but are not in the end more likely to have
been vaccinated by the time they reach elementary school. This
result may reflect the fact that white children who attend other
preschools and African—American Head Start children are more likely
to have either private health insurance coverage or Medicaid
coverage than white Head Start children in this sample.
Table S also shows regressions of height—for—age on Head Start
and preschool attendance. As discussed above, height—for—age can
be thought of as a measure of nutritional status. African—American
children who attended Head Start are significantly taller than
their siblings —— a result that was apparent in the non—parametric
estimates. The impact of preschool, however, is smaller for all
three ethnic groups when we control for selection and, in contrast
with the non—parametric estimates, preschool children are not
significantly taller than their siblings who stayed at home.
At the bottom of Table 5 we show results using the first
measure of height obtained after the child turned 8 years old. As
in Table 3, the purpose of these estimates is to examine whether
the effects of Head Start persist over time: the evidence suggests
that they may be relatively short—lived. This is somewhat
surprising in view of the evidence regarding the critical
importance of good nutrition at an early age.
The positive effects of Head Start on height might reflect
selection into the program: (African—American) mothers may be more
likely to send a child who is tall for his or her age to Head
Start. Yet, if this is the explanation then the lack of any
32
similar effect for other preschools is puzzling.
In general, white and Hispanic children seem to benefit from
attending Head Start in terms of test outcomes, school performance
and immunization records. Why do they not appear to be better
nourished than their siblings? It is hard to transfer the test
score benefits of Head Start from one child to another; food may be
more fungible. Mothers may, for example, compensate siblings of
Head Start children by giving them extra food at home at the
expense of the Head Start child. Siblings of children in the
program would then also benefit from Head Start, and estimates
based on sibling differences would be biased downwards.
(c) Why Does Race Matter?
Why do the effects of Head Start vary so greatly with race?
Our parametric results suggest that once selection into the program
is taken into account, Head Start has a smaller effect on the test
scores and schooling attainment of African—Americans than on the
test scores and academic achievement of white and Hispanic
children. This finding is all the more striking because we find
that in terms of health, African—American children appear to gain
more from Head Start than other children. African—Americans are as
likely as white children to be vaccinated if they are in Head
Start, and they are more likely to experience gains in height—for-
age.
Why do race and ethnicity matter? One hypothesis is that
there is heterogeneity in the Head Start programs that serve
children of different races. Given that there are over 1,300 Head
33
Start programs (Hayes et al., 1990) all administered at a local
level, and that the program guidelines are not specific about how
the goals of the program are to be attained, there is bound to be
a great.deal of heterogeneity in program content. It is possible
that programs that serve African—Americans place more emphasis on
health and less emphasis on academic achievement than programs
serving white and Hispanic children. Such a focus might be
justified if African—American children had greater health problems.
Unfortunately, it is difficult to test this hypothesis given that
we have no information about individual programs.
An alternative hypothesis is that the benefits of compensatory
education depend both on the program itself and the child's home
background including, for example, the level of resources at home,
as well as the type and quality of school attended after Head
Start. To the extent that African—American children come
disproportionately from more disadvantaged homes, located in poorer
communities, and attend troubled schools, one might expect Head
Start to have smaller effects. Thus, race may be a proxy for a
disadvantaged background.
On the other hand, since the average Hispanic child in this
sample also comes from a disadvantaged background relative to a
white child, one must explain the beneficial effects of Head Start
on the test scores and academic achievement of these children. It
is possible that children with English—language difficulties
benefit disproportionately from the early opportunity to learn in
an English—language setting.
34

In this section, we report two attempts to separate the
effects of race and ethnicity from the effects of a disadvantaged
family background. In the first, we pool children from the three
racial and ethnic groups and limit the analysis to children in
families with permanent incomes greater than $10,000 and less than
$18,000. The $10,000 cutoff marks the 6th percentile of the white
income distribution, the 26th percentile of the African—American
income distribution, and the 12th percentile of the Hispanic
distribution. The $18,000 cutoff marks the 28th, 64th, and 45th
percentiles of the white, African—American, and Hispanic
distributions, respectively. Since families with permanent incomes
below $10,000 are disproportionately African—American and families
with permanent incomes over $18,000 are disproportionately white,
it is possible that the racial differences in the parametric
estimates may reflect nothing more than the relative poverty of
African—Americans.
Table 6 shows models estimated using this subsample that
include interactions of race and ethnicity with Head Start and
other preschool participation. There are no statistically
significant racial differences in test scores. It is, however,
worth noting that the point estimates of the effects of Head Start
on PIAT—READING and PPVT are greater for whites than for African-
Americans, and greatest for Hispanics. Given that the sample size
is much reduced by the restriction on income, it is not clear that
the lack of statistically significant race effects for test scores
indicates that our earlier estimates reflect only income effects.
35
We do find, even in this subsample, that Head Start
participation lowers the probability of retention in grade more for
whites then for African—Americans, and increases height more for
African—Americans than for whites. Hence, Table 6 suggests that
there are statistically significant racial differences in the
effects of Head Start even within a relatively homogeneous income
group. Experimentation with other income cutoffs produced similar
results.
Thus far, we have focussed on permanent income as our measure
of long—run household resources. An alternative measure is the
mother's AFOT score. We prefer AFQT to education since about 50%
of the women report 12 years of schooling (see Appendix Figure 2).
In contrast, AFOT scores are more evenly spread. In any case, AFQT
and educational attainment are very highly correlated. The right
hand panel of Appendix Figure 2 presents a non—parametric estimate
of the relationship between education and AFQT scores: it is upward
sloping and virtually linear.
We estimated mpdels identical to those shown in Tables 3, 4
and S except that they also included interactions between the Head
Start and preschool indicators and AFOT. The results (reported in
Appendix Table 1) provide some support for the hypothesis that
children from the most advantaged backgrounds gain more from Head
Start. The interaction of AFQT and Head Start was positive and
statistically significantly in the white and Hispanic models of
grade repetition. African—American Head Start childrens flAT—MATH
scores and heights also rose with the mothers AFOT. These results
36

suggest that one way to ensure that disadvantaged children reap the
greatest possible benefit from Head Start, is to strengthen the
components of the program aimed at educating parents.
d) Long—ternt Effects of Head Start on the Mothers
In this section we examine the long—run effects of Head Start
participation on the children's mothers. The outcomes we consider
are the mother's participation in Aid to Families with Dependent
Children (AFDC), her AFQT score, whether or not she graduated from
high school, her height, and whether or not she had her first child
as a teenager. Ordinary Least Squares regressions of these
outcomes on the measurable characteristics of the mother imply that
participation in the'program has negative effects. However, as
discussed above it is likely that in an OLS regression, the Head
Start variable is a proxy for a disadvantaged background.
Hence, we adopt the same strategy for the mothers as we did
for the children —— that is, we compare mothers to their sisters
in the sample. To be more specific, we include only mothers who
have at least one sister with non—missing Head Start information in
the sample, and estimate models that include a fixed effect for
each mother's own family. One drawback of this procedure is that
since the question about Head Start participation was only asked of
mothers, women who have a sibling in the NLSY who is not a mother
cannot be included. The sample size is thus quite small, and the
results should be interpreted with caution. They are reported in
37

Table 7 for whites and African—Americans.25
We do not know whether the mother attended another preschool
and so the excluded category is likely to be quite heterogeneous.
The only mother—specific covariate in the regressions is her
current age. There does appear to be a positive effect of
participation in Head Start on the AFQT scores and heights of
whites. However, we find no significant effect on the probability
of graduating from high school, or on AFDC participation although
the point estimate on the later is negative. There is actually a
positive and implausibly large effect of Head Start on the
probability that a white mother was a teen at the first birth.
This result may reflect the sampling structure of the NLSY: since
Head Start began in 1964, only the youngest sister in many families
was eligible for Head Start. And the probability that a given
family got into the sample of mother—sisters was greatly increased
if the youngest sibling had a child as a teenager. It is
noteworthy that once again we find no effects for African—Americans
although the sample size is actually larger for this group.
5. Discussion and Conclusions-
Participation in Head Start is associated with better
performance on tests among whites and Hispanics. These effects
persist for children B years and older, and are perhaps detectable
in the AFQT scores of the white mothers in our sample. Mothers who
25Hispanics are dropped from this analysis because of the smallsample size.
3B
attended Head Start also tend to be taller as adults. White and
Hispanic children are also less likely to have repeated a grade if
they attended Head Start and white children are more likely to
receive measles shots.
In contrast, African—Americans who attended Head Start do not
appear to perform better on tests or in school. They do, however,
seem to do better in terms of health: they tend to receive measles
shots earlier and are significantly taller than their siblings who
did not attend a preschool.
A comparison of non—parametric estimates with estimates that
take account of selection by incorporating mother fixed effects
suggests that even when observables are accounted for, white
children who attend Head Start are very disadvantaged in terms of
academic potential. Conversely, white children who went to other
preschools appear to be positively selected. Estimates of the
effects of Head Start and preschool on test scores and schooling
attainment that ignore selection may be biased. In contrast, there
is little evidence that selection biases the estimated effects of
Head Start on the health outcomes of any group. And we find no
strong pattern of selection among African—Anericans,
There are then, dramatic racial and ethnic differences in the
effects of Head Start, and in the role of selection. These
differences cannot be entirely explained by observable differences
in household resources such as permanent income. Further
investigation of the reasons for these differences is likely to
provide insights that will make Head Start a more effective
program.39
References
Baker, Paula and Frank Mott. NLSY Child Handbook. 1989, Center forHuman Resource Research — The Ohio State University, Columbus,Ohio, June 1989.
Barnett, Steven. 'Benefits of Compensatory Preschool Education,'The Journal of Human Resources, XXVII 2, 24—312, 1992.
Becker, Gary. A Treatise on the Family, Harvard University Press,1981.
Bee, C.K. "A Longitudinal Study to Determine if Head Start hasLasting Effects on School Achievement," Dissertation AbstractsInternational, 42(5), 1981.
Berrueta—Clement, J.R. et al. "Changed Lives: The Effects of thePerry Preschool Program on Youths Through Age 19," Ypsilanti,MI: High Scope (1985).
Bloom, Barbara. "Health Insurance and Medical Care," Advance Datafrom Vital and Health Statistics of the National Center forHealth Statistics, # 188, Public Health Service, WashingtonD.C., October 1, 1990.
Bronfenbrenner, U. 'Is Early Intervention Effective?" in M.Guttentag and E. Stuening (eds.) Handbook of EvaluationResearch, v. 2, 519—603, Beverly Hills:Sage, 1975.
Children's Defense Fund. The Nation's Investment in Children: AnAnalysis of the President's FY 1993 Budget Proposals,Washington D.C., 1992.
Consortium for Longitudinal Studies. As the Twig is Bent: LastingEffects of Preschool Programs, Hillsdale, NJ:Erlbaum, 1983.
Copple, C.E. dine, M.G, and Smith, A.N. Path to the Future: Long-Term Effects of Head Start in the Philadelphia SchoolDistrict, Washington D.C.: Head Start Bureau, U.S. Departmentof Health and Human Services, 1987.
Currie, Jaaet and Fallick, Bruce. "From School to Work: MinimumWages and Educational Attainment," mimeo, UCLA, 1990.
Currie, Janet and Duncan Thomas. "Measurement of Height and Weightin the NLSY", mimeo, Yale University, 1993.
Datta, L. "Another Spring and Other Hopes: Some Findings FromNational Evaluations of Project Head Start," in E. Zigler and3. Valentine (eds.), Project Head Start: A Legacy of the Waron Poverty, 405—432, New York:Free Press, 1979.
Desai, Sonalde, Lindsay Chase—Lansdale, and Robert Michael. "Mother
40

or Market? Effects of Market Employment on the IntellectualAbility of 4—year—old Children,' Demograohy, 26, p. 545—61.
Fogel, Robert. "Physical Growth as a Measure of the Economic well-being of Populations: The Eighteenth and NineteenthCenturies," in F. Falkner and 3. Tanner, eds., Human Growth:A Comprehensive Treatise, Vol 3, 2nd ed., New York: PlenumPress, 1986.
Maskins, Ronald. "Beyond Metaphor: The Efficacy of Early ChildhoodEducation," American Psychologist, v. 44 2, 274—282, Feb.1989.
Hardle, W. Applied Nonoarametric Rearessio, monograph, Faculty ofStatistics, Rheinische—Friedrich—Wilhelms University, Bonn,1988.
Hayes, Cheryl, John Palmer, and Martha Zaslow. Who Cares forAmeric&s Children: Child Care Policy for the l990s, NationalAcademy Press: Washington D.C., 1990.
Hill, Anne and June O'Neill. "The Transmission of CognitiveAchievement Across Three Generations," mimeo, Baruch College,CUNY, March 1992.
Head Start Bureau, Head Start Program Performance Standards, U.S.Department of Health and Human Services Publication # ACE 92—31131, June 1992.
Hebbeler, K. "An Old and a New Question on the Effects of EarlyEducation for Children from Low Income Families," EducationalEyaluation and Policy Analysis, 7, 207—216, 1985.
Hofferth, Sandra and Douglas Wissoker. "Price, Quality, and Incomein Child Care Choice," Journal of Human Resources, v27 # 1,Winter 1992, 70—111..
Horowitz, F.D. and Paden, L.Y. "The Effectiveness of EnvironmentalIntervention Programs," in B. Caldwell and H. Ricciuti (eds.)Review of Child Development Research, v.3, 331-402, Chicago:University of Chicago Press.
Kahn, Alfred and Sheila Kamerman. Child Care: Facing the HardChoices, Auburn House: Dover MA, 1987.
Lee, V.E., Brooks—Gunn, 3., Schnur, E. "Does Head Start Work? A 1—Year Follow—Up Comparison of Disadvantaged Children AttendingHead Start, no Preschool, and other Preschool Programs,'Developmental Psychology, 24, 210—222, 1988.
41

Martorell, Reynaldo and Jean—Pierre Habicht, "Growth in EarlyChildhood in Developing Countries," in F. Falkner and 3.Tanner, eds., Human Growth: A Comprehensive Treatise, Vol 3,2nd ed., New York: Plenum Press, 1986.
Humane, Richard, "The Growing Importance of Cognitive Skills inWage Determination", mimeo, Harvard University, 1993.
McDonald, M.S. and Monroe, E. A follow—un Study pf the 1966 HeadStart Program, unpublished manuscript, Rome Georgia PublicSchools, undated.
McKey, Ruth et al. The Impact of Head Start on Children. Familieand Communities: Final Report of the Head Start Evaluation.Synthesis and Utilization Project, Washington, D.C.: CSR,Incorporated, 1985.
Mott, Frank and Quinlan, Stephen. Participation in Project HeadStart: Determinants and Possible Short—Term Conscuences,mimeo, Center for Human Resource Research, The Ohio StateUniversity, July 1992.
National Center for Health Statistics, Growth Charts, Washington,D.C.: Department of Health and Human Services, 1976.
Nelson, Richard and Richard STartz. "The Distribution of theInstrumental Variables Estimator and its T—ratio When theInstrument is a Poor One", Journal of Business, 63.1.2:5125—40, 1990.
Pollak, Robert. 'Conditional Demand Functions and ConsumptionTheory", Ouarterlv Journal of Economics, 83, 1969, 70—78.
Stewart, Anne. "Head Start: Funding, Eligibility, andParticipation,: CRS Report for Congress, July 22, 1992.
Vinovskis, Mans. "Early Childhood Education: Then and Now,Daedalus, v 122 *1, 151—176, Winter 1993.
Waterlow, J., et al. "The Presentation and Use of Height andWeight Data Comparing the Nutritional Status of Groups ofChildren under 10 Years Old," Bulletin of the World HealthOrganization, 55:489—98, 1977.
Westinghouse Learning Corporation and Ohio University, The Imnactof Head Start: An Evaluation of the Effects of Head Start onChildren's Cognitive and Affective Development, v 1 and 2,Report to the Office of Economic Opportunity, Athens, Ohio:WLC and Ohio State, 1969.
White, K. "Efficacy of Early Intervention," Journal of SnecialEducation, 41, 401—416, 1985—86.
42

Zigler, W.E., W. Abelson, and V. Seitz. Motivational Factors inthe Performance of Economically Disadvantaged Children on thePPVT , Child Development, 44:294—303, 1973.
43
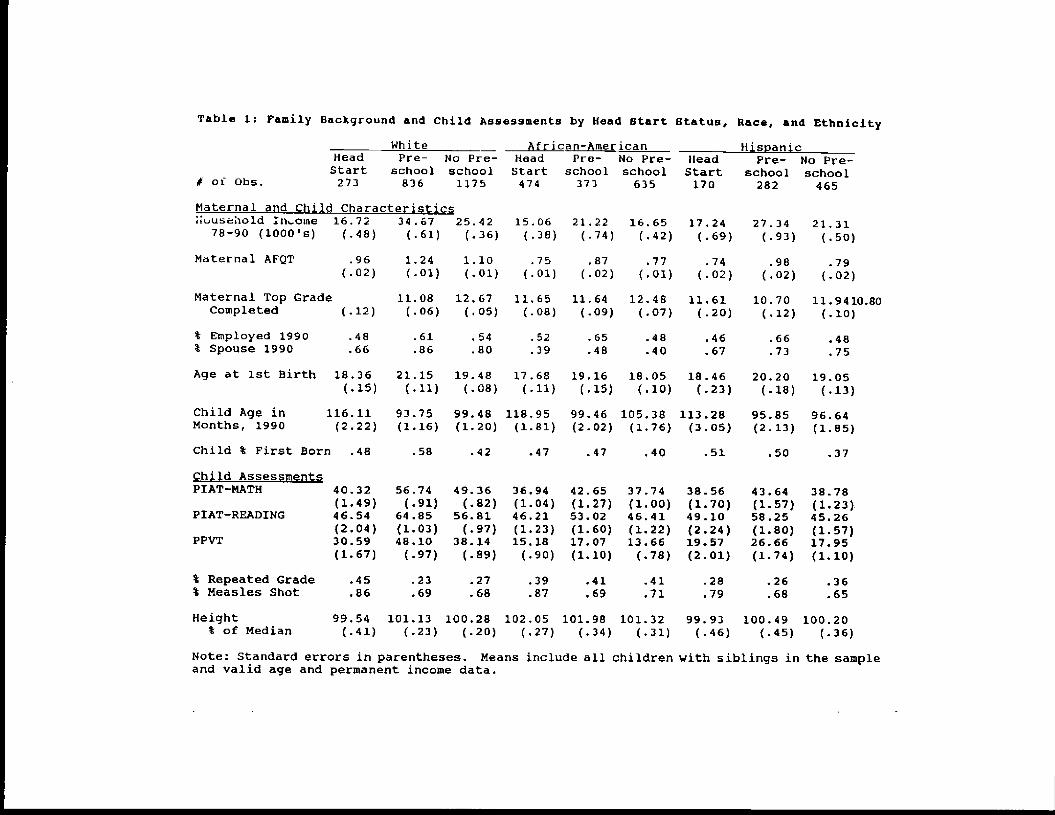
Table 1: Family Background and Child Assessments by Head Start Status, Race, and Ethnicity
Note: Standard errors in parentheses. Means include all children with siblings in the sampleand valid age and permanent income data.
# of cbs.
HeadStart273
Pre-school836
Ho Pre-school1175
White African-American HisnnirHeadStart474
Pre-school373
No Pre-school635
34.67 25.42 15.06 21.22 16.65(.61) (.36) (.38) (.74) (.42)
Pre-school282
headStart170
17.24(.69)
No Pre-school465
27.34 21.31(.93) (.50)
.48
.66.61 .54 .52 .65.86 .80 .39 .48
.48
.40.46.67
116.11 93.75 99.48 118.95(2.22) (1.16) (1.20) (1.81)
.66
.73.48.75
Maternal and Child Characteristics;uuseho1d in..ome
78—90 (1000's)16.72(.48)
Maternal AFQT .96
(.02)
1.24
(.01)
1.10(.01)
.75
(.01)
.87
(.02)
.77
(.01).74
(.02)
.98(.02)
.79
(.02)
Maternal Top GradeCompleted (.12)
11.08(.06)
12.67(.05)
11.65(.08)
11.64(.09)
12.48(.07)
11.61(.20)
10.70(.12)
11.9410.80(.10)
% Employed 1990% Spouse 1990
Age at 1st Birth 18.36(.15)
21.15(.11)
19.48(.08)
17.68(.11)
19.16(.15)
18.05(.10)
18.46(.23)
20.20(.18)
19.05(.13)
Child Age inMonths, 1990
95.85(2.13)
96.64(1.85)
Child % First Born .48 .37
Child Assessments37.74(1.00)46.41(1.22)13.66(.78)
PIAT-MATH
PIAT—READING
PPVT
% Repeated Grade% Measles Shot
.39
.87.41.69
.41
.11
Height% of Median
99.54(.41)
101.13 100,28(.23) (.20)
102.05(.27)
101.98(.34)
101.32(.31)
99.93(.46)
100.49(.45)
100.20(.36)
.58 .42
99.46 105.38 113.28(2.02) (1.76) (3.05)
.47 .47
40. 32
(1.49)46.54(2.04)30.59(1.67)
.40
56.74(.91)
64.85(1.03)48.10
(.97)
.51
49.36(.82)
56.81(.97)
38.14(.89)
.50
36 • 94(1.04)46.21(1.23)15.18
(.90)
42.65(1.27)53.02(1.60)17.07(1.10)
.45
.86.23.69
(1.70)49.10(2.24)19.57
.2768
43.64(1.57)58.25(1.80)26.66(1.74)
38.78(1.23).45.26(1.57)17.95(1.10)
.28 .26.68
.36
.65
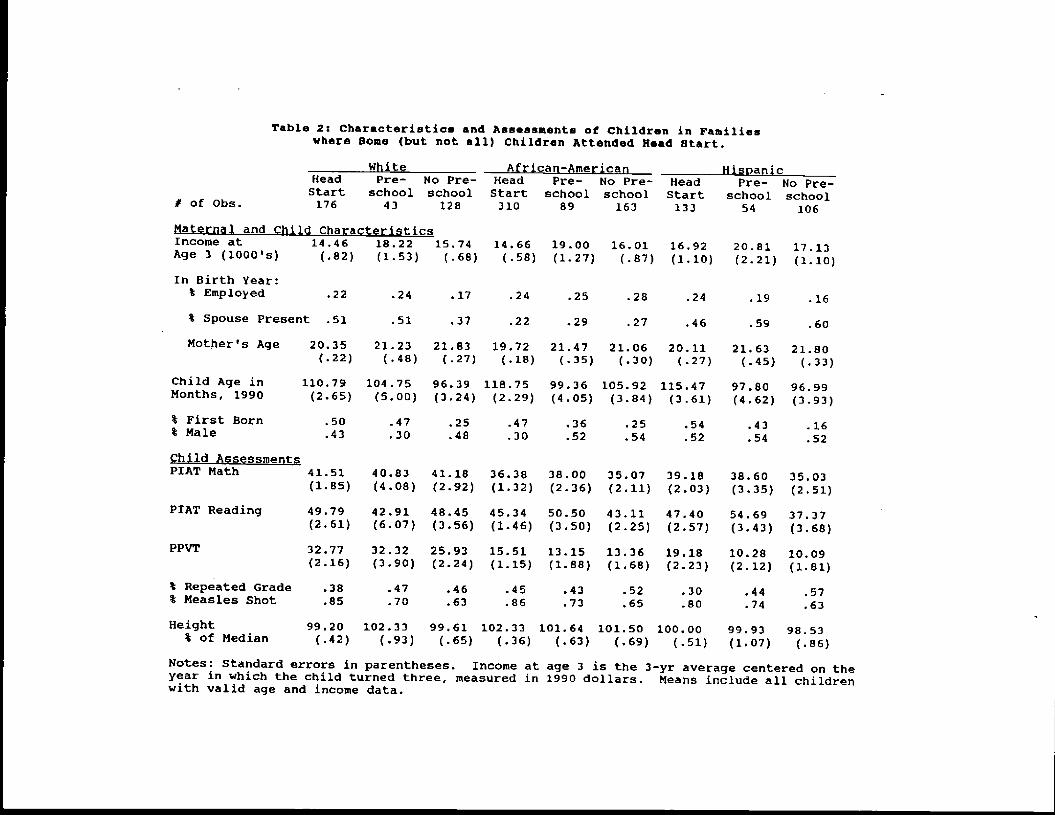
Table 2: Characteristic, and Assessments of Children in Familieswhere Dome (but not all) Children Attended Head start.
White African-American J-JisparijcHead Pre— No Pre- Head Pre— No Pre— Head Pre- No Pre-Start school school Start school school Start school school
I of Obs. 176 43 128 310 89 163 133 54 106
Maternal and Child CharacteristicsIncome at 14.46 18.22 15.74 14.66 19.00 16.01 16.92 20.81 17.1]Age 3 (1000's) (.82) (1.53) (.68) (.58) (1.27) (.87) (1.10) (2.21) (1.10)
In Birth Year:% Employed .22 .24 .17 .24 .25 .28 .24 .19 .16
% Spouse Present .51 .51 .37 .22 .29 .27 .46 .59 .60
Mother's Age 20.35 21.23 21.83 19.72 21.47 21.06 20.11 21.63 21.80(.22) (.48) (.27) (.18) (.35) (.30) (.27) (.45) (.33)
Child Age in 110.79 104.75 96.39 118.75 99.36 105.92 115.47 97.80 96.99Months 1990 (2.65) (5.00) (3.24) (2.29) (4.05) (3.84) (3.61) (4.62) (3.93)
% First Born .50 .47 .25 .47 .36 .25 .54 .43 .16% Male .4] .30 .48 .30 .52 .54 .52 .54 .52
Child AssessmentsflAT Math 41.51 40.83 41.18 36.38 38.00 35.07 39.18 38.60 35.03
(1.85) (4.08) (2.92) (1.32) (2.36) (2.11) (2.03) (3.35) (2.51)
PIAT Reading 49.79 42.91 48.45 45.34 50.50 43.11 47.40 54.69 37.37(2.61) (6.07) (3.56) (1.46) (3.50) (2.25) (2.57) (3.43) (3.68)
PPVT 32.77 32.32 25.93 15.51 13.15 13.36 19.18 10.28 10.09(2.16) (3.90) (2.24) (1.15) (1.88) (1.68) (2.23) (2.12) (1.81)
% Repeated Grade .38 .47 .46 .45 .43 .52 .30 .44 .57% Measles Shot .85 .70 .63 .86 .73 .65 .80 .74 .63Height 99.20 102.33 99.61 102.33 101.64 101.50 100.00 99.93 98.53
% of Median (.42) (.93) (.65) (.36) (.63) (.69) (.51) (1.07) (.86)
Notes: Standard errors in parentheses. Income at age 3 is the 3-yr average centered on theyear in which the child turned three, measured in 1990 dollars. Means include all childrenwith valid age and income data.

Table 3: Read Start and Other Preschool Effects on Test Scores Including Mother Fixed Effects
_____— White - African—American - hispanicPIAT PIAT PPVT FlAT FIAT FPVT PIAT PIAT PPVTMATh READING MATh! READING MATH READING
Head Start 2.66 .fl 5.04 1.58 —1.66 —.75 .31 8.74 9.4291) (.19) (1.78) (.75) (.61) (.45) (.10) (2.08) (3.55)
Other Preschool 3.43 —1.11 —.26 —1.44 1.73 .64 —2.10 5.64 3.01(1.61) (.42) (.13) (.63) (.57) (.38) (.71) (1.37) (1.22)
Log Income 2.42 .64 —.36 —3.33 —1.77 —2.16 6.03 4.43 1.11at age 3 (1.12) (.24) (.18) (1.80) (.73) (1.52) (2.58) (1.48) (.5))
Male .37 2.63 .23 1.59 4.62 .55 5.35 5.01 —.33(.27) (1.57) (.18) (1.12) (2.64) (.51) (2.67) (1.79) (.19)
Age in Months; .05 —.06 .16 .04 —.16 .13 .09 —.1) .021990 (1.14) (1.15) (4.37) (1.27) (3.28) (5.41) (1.82) (1.52) (.44)
First Born 1.54 2.93 1.54 —4.76 .98 —1.09 —2.21 4.05 3.29(.84) (1.27) (.89) (2.56) (.41) (.78) (.87) (1.15) (1.54)
# observations 1299 918 1607 1061 806 1110 573 384 643
R—squared .65 .69 .71 .63 .67 .69 .61 .65 .74Mean Dep. Var. 49.76 55.89 39.47 38.09 45.97 14.67 38.59 47.42 20.09
B: Coefficients on Head Start and PreschoolL Children >= 8 years oldHead Start 2.83 2.11 9.30 —1.45 —.38 —2.16 .99 7.10 9.92
(.74) (.49) (2.10) (.52) (.12) (.87) (.22) (1.35) (2.58)
Other Preschool 5.77 1.00 .22 5.44 2.92 2.82 —.91 —.53 3.14(2.03) (.33) (.07) (1.64) (.79) (.97) (.18) (.09) (.75)
I Observations 912 754 967 736 662 718 385 321 391R—squared .74 .75 .81 .71 .73 .77 .67 .66 .82Mean Dep. Var. 50.39 54.66 41.45 36.98 43.64 16.43 39.19 45.4) 20.18
Notes:T-statistics in parentheses.
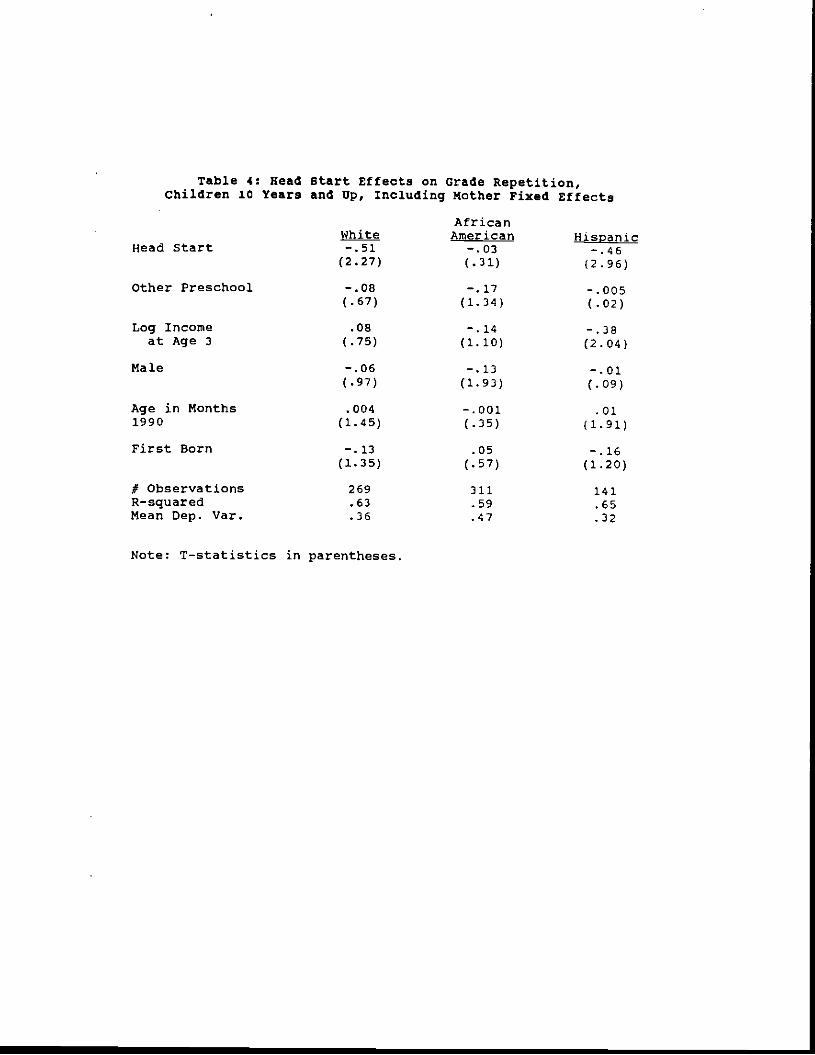
Table 4: Head Start Effects on Grade Repetition,Children 10 Years and Up, Including Mother Fixed Effects
AfricanWhite American Hispanic
Head Start —.51 —.03 -.46(2.27) (.31) (2.96)
Other Preschool —.08 —.17 -.005(.67) (1.34) (.02)
Log Income .08 —.14 -.38at Age 3 (.75) (1.10) (2.04)
Male —.06 —.13 —.01(.97) (1.93) (.09)
Age in Months .004 -.001 .011990 (1.45) (.35) (1.91)
First Born -.13 .05 -.16(1.35) (.57) (1.20)
I Observations 269 311 141H-squared .63 .59 .65Mean Dep. Var. .36 .47 .32
Note: T-statistics in parentheses.
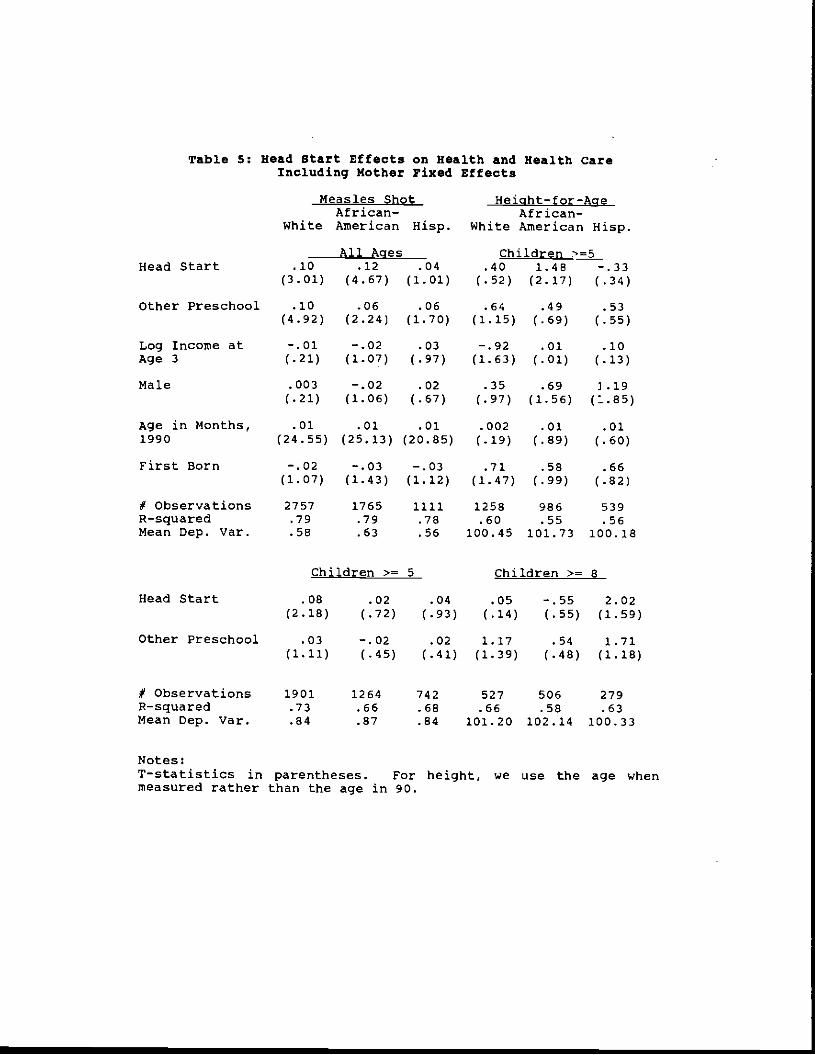
Table 5: Head Start Effects on Health and Health CareIncluding Mother Fixed Effects
Measles Shot Height-for-AgeAfrican— African—
White American Hisp. White American Hisp.
All Ages Children -'=5Head Start .10 .12 .04 .40 1.48 —.33
(3.01) (4.67) (1.01) (.52) (2.17) (.34)
Other Preschool .10 .06 .06 .64 .49 .53(4.92) (2.24) (1.70) (1.15) (.69) (.55)
Log Income at -.01 —.02 .03 —.92 .01 .10Age 3 (.21) (1.07) (.97) (1.63) (.01) (.13)
Male .003 —.02 .02 .35 .59 1.19(.21) (1.06) (.57) (.97) (1.56) (:.85)
Age in Months, .01 .01 .01 .002 .01 .011990 (24.55) (25.13) (20.85) (.19) (.89) (.60)
First Born —.02 —.03 —.03 .71 .58 .66(1.07) (1.43) (1.12) (1.47) (.99) (.82)
# Observations 2757 1765 1111 1258 986 539R—squared .79 .79 .78 .60 .55 .56Mean Dep. Var. .58 .63 .56 100.45 101.73 100.18
Children >= 5 Children >= 8
Head Start .08 .02 .04 .05 —.55 2.02(2.19) (.72) (.93) (.14) (.55) (1.59)
Other Preschool .03 —.02 .02 1.17 .54 1.71(1.11) (.45) (.41) (1.39) (.48) (1.18)
# Observations 1901 1264 742 527 506 279R—squared .73 .66 .68 .66 .58 .63Mean Dep. Var. .84 .87 .84 101.20 102.14 100.33
Notes:T—statistics in parentheses. For height, we use the age whenmeasured rather than the age in 90.
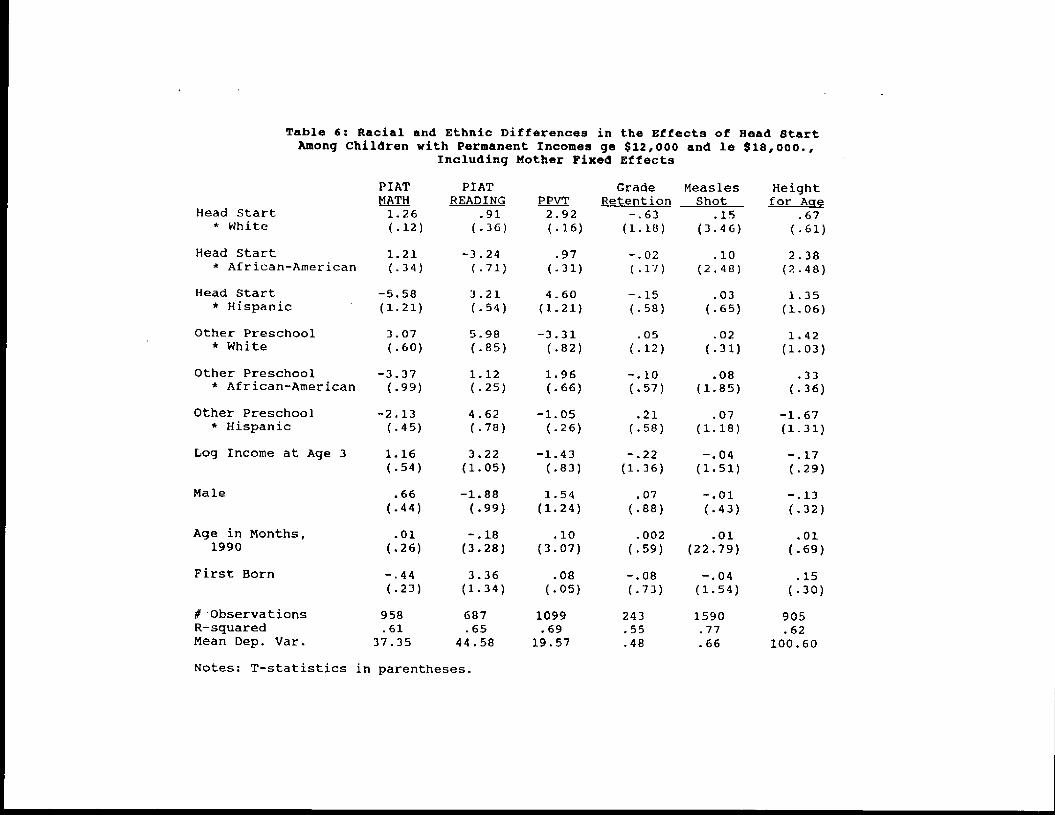
Table 6: Racial and Ethnic Differences in the Effects of Head StartAmong Children with Permanent Incomes ge $12,000 and Xe $10,000.,
Including Mother Fixed Effects
PIAT flAT Grade Measles HeightMATH READING PPVT Retention Shot for Aq
Head start 1.26 .91 2.92 -.63 .15 .67* White (.12) (.36) (.16) (1.18) (3.46) (.61)
Head Start 1.21 —3.24 .97 —.02 .10 2.38* African—American (.34) (.71) (-31) (.17) (2.48) (2.48)
Head start —5.58 3.21 4.60 —.15 .03 1.35* Hispanic (1.21) (.54) (1.21) (.58) (.65) (1.06)
Other Preschool 3.07 5.98 —3.31 .05 .02 1.42* White (.60) (.85) (.82) (.12) (.31) (1.03)
Other Preschool -3.37 1.12 1.96 -.10 .08 .33* African—American (.99) (.25) (.66) (.57) (1.85) (.36)
Other Preschool —2.13 4.62 -1.05 .21 .07 -1.67* Hispanic (.45) (.78) (.26) (.58) (1.18) (1.31)
Log Income at Age 3 1.16 3.22 —1.43 —.22 —.04 —.17(.54) (1.05) (.83) (1.36) (1.51) (.29)
Male .66 —1.88 1.54 .07 —.01 —.13(.44) (.99) (1.24) (.88) (.43) (.32)
Age in Months, .01 —.18 .10 .002 .01 .011990 (.26) (3.28) (3.07) (.59) (22.79) (.69)
First Born —.44 3.36 .08 —.08 —.04 .15(.23) (1.34) (.05) (.73) (1.54) (.30)
I Observations 958 687 1099 243 1590 905R—squared .61 .65 .69 .55 .77 .62Mean Dep. Var. 37.35 44.58 19.57 .48 .66 100.60
Notes: P—statistics in parentheses.
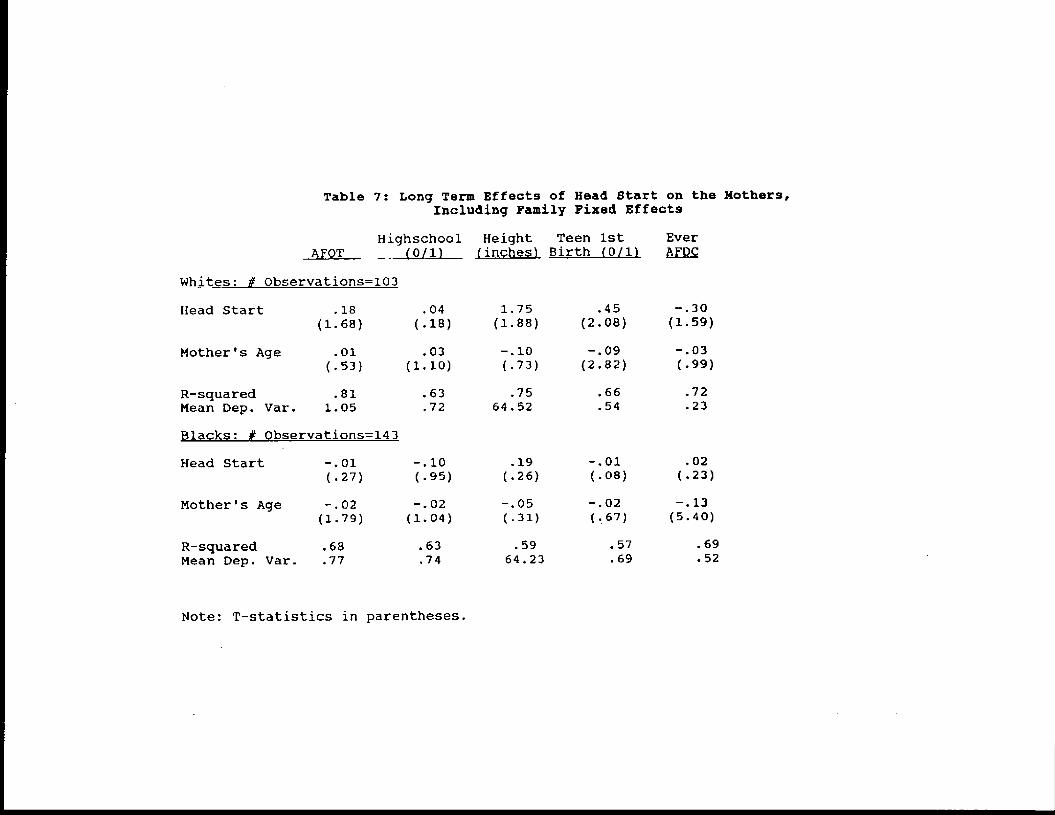
Table 7: Long Term Effects of Head Start on the Mothers,Including Family Fixed Effects
1-Iighschool Height Teen 1st EverAFOT —- (0/1) (inches) Birth (0/1) AFDC
Whites: # Observations=103
Head Start .18 .04 1.75 .45 —.30
(1.68) (.18) (1.88) (2.08) (1.59)
Mother's Age .01 .03 —.10 —.09 -.03
(.53) (1.10) (.73) (2.82) (.99)
R—squared .81 .63 .75 .66 .72Mean Dep. Var. 1.05 .72 64.52 .54 .23
Blacks: # Observationsl43
Head Start —.01 -.10 .19 -.01 .02
(.27) (.95) (.26) (.08) (.23)
Mother'sAge -.02 -.02 -.05 —.02 -.13
(1.79) (1.04) (.31) (.67) (5.40)
R—squared .68 .63 .59 .57 .69
Mean Dep. Var. .77 .74 64.23 .69 .52
Note: T—statistics in parentheses.
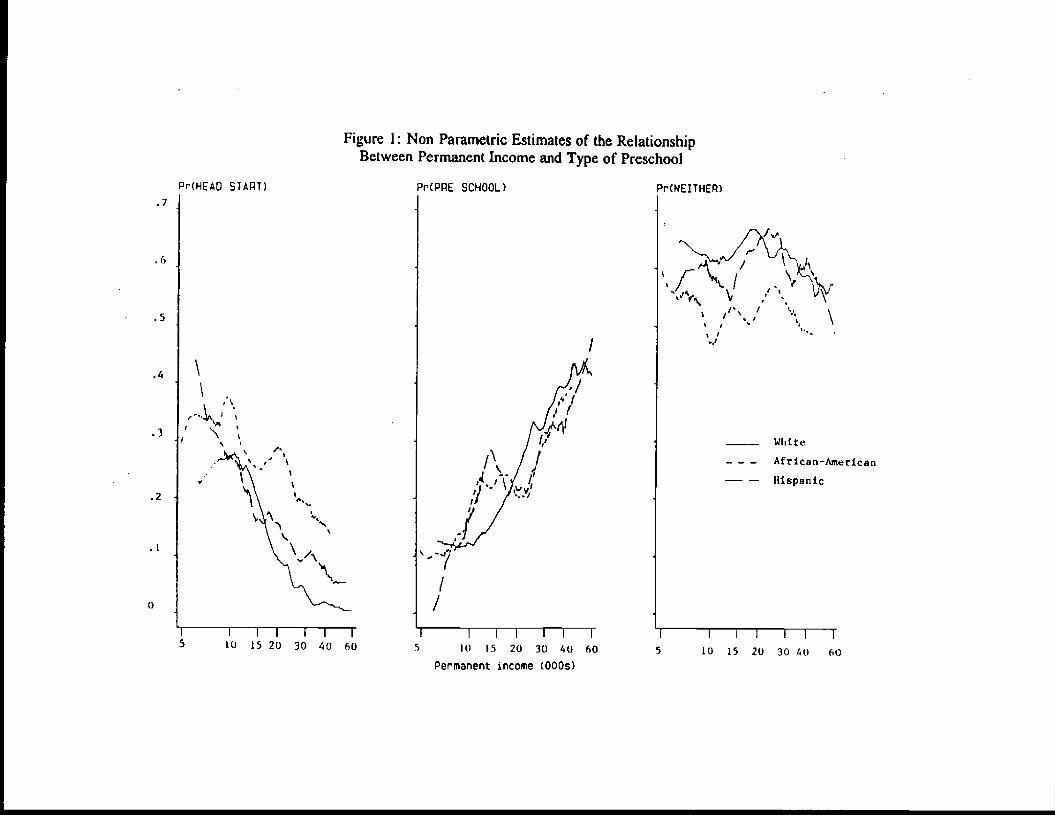
Figure 1: Non Parametric Estimates of the RelationshipBetween Permanent Income and Type of Preschool
I I I I I I5 10 iS 20 30 40 60
Permanent income WOOS)
N/S1 LI
Jc\ \, r'I /
-1' I —
—/
°rCPRE SCHOOL) PrC NEITHER)PrIHEAD START).7
•6
.5
.4
.3
.2
.1
1)
/
I4\
White
-. — — Afrjcan—eriean— — Hispanic
//
I I I I I I I
S 10 15 20 30 40 60I I I I I
5 10 15 20 3040 60
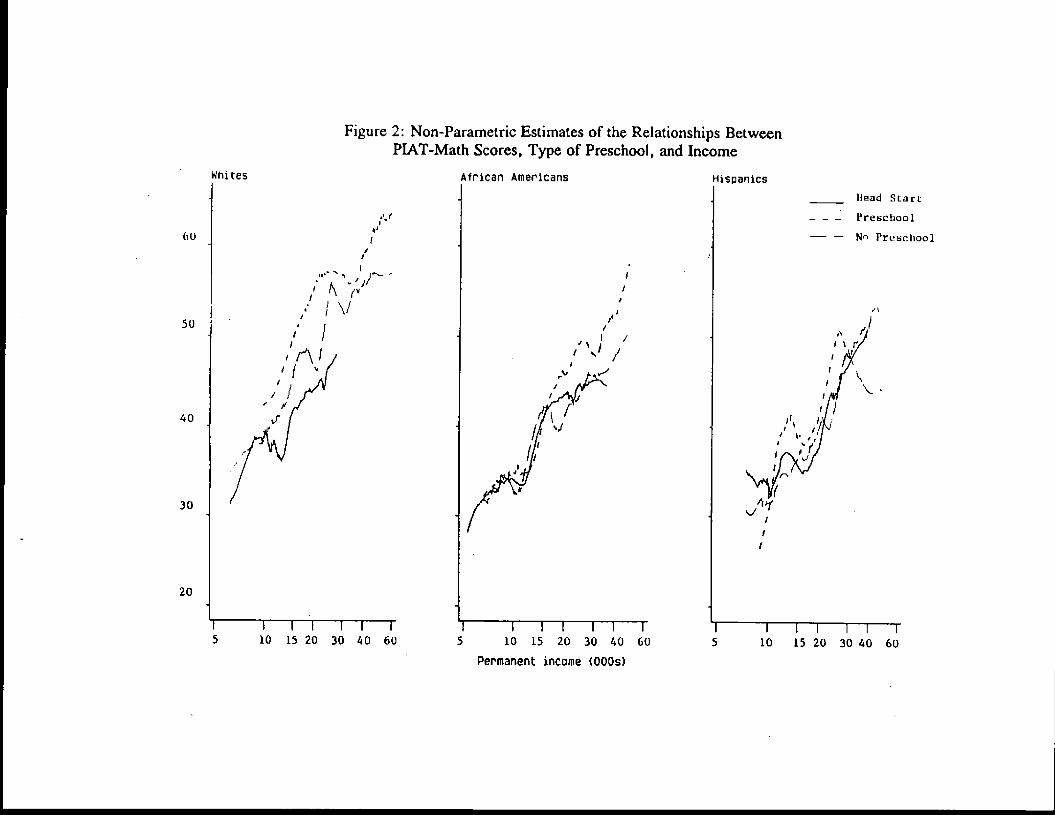
if -'I'(V
Ii/ i\iII11fi
I C —I-5 10 15 20 30 40 60
Permanent income (000s)
I I I I I I I5 10 1520 3040 60
Whites
Figure 2: Non-Parametric Estimates of the Relationships BetweenPL&T-Math Scores, Type of Preschool, and Income
('Ii
African Americans
$
Hispanics
50
______ Head Start— — — Preschool— — N Preschool
40
'I
1%
30
A
20
I I I I I I5 10 1520 3040 60
/ll?
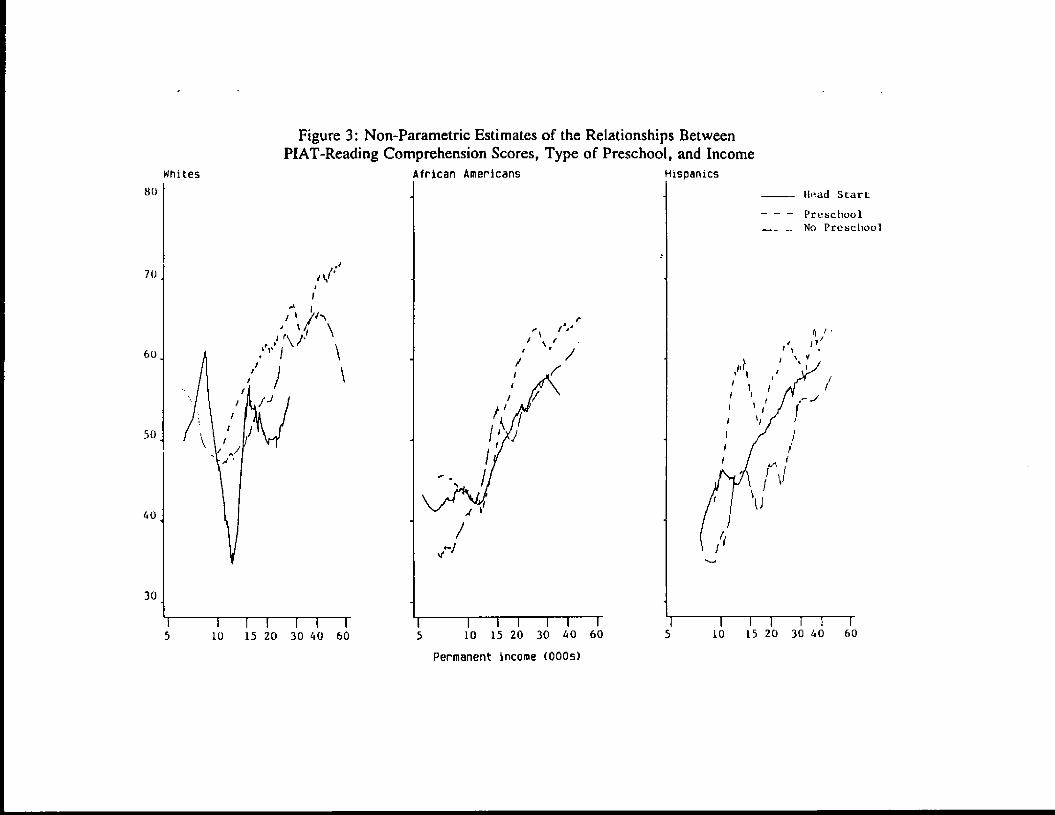
Figure 3: Non-Parametric Estimates of the Relationships BetweenPIAT-Reading Comprehension Scores, Type of Preschool, and Income
African Americans HispanicsWhites
1
Head Start— — — Preschool— No Preschool
80
70
60
50
40
30
p
/ 1¼tIlI' f
It
/i 7'I
I'SI
F-
I
/SIFt.-,
1'
1'p
I ¶ I I I i I I I l——I.— I I I I 1 1
5 10 1520304060 5 10 1520304060 5 10 15203040Permanent income (COOs)
60
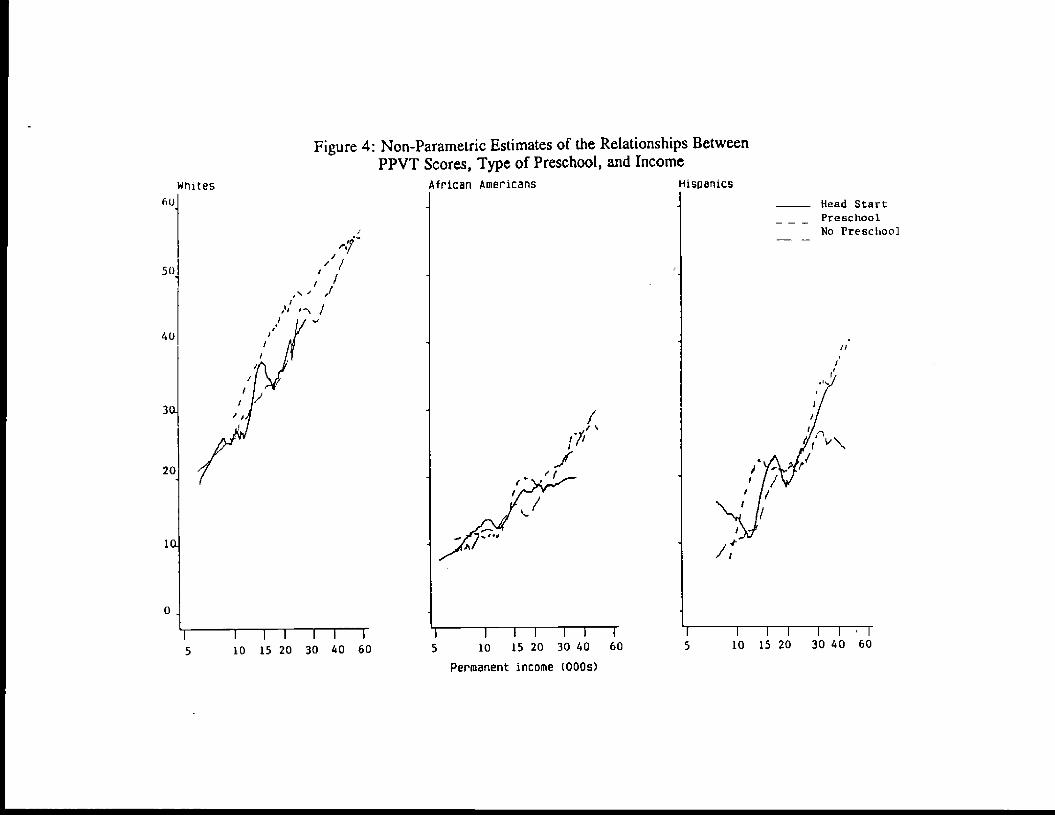
Figure 4: Non-Parametric Estimates of the Relationships BetweenPPVT Scores, Type of Preschool, and Income
African Americans Hispanics
4 1 I I I I II60 5 10 1520 3040 60
wrutes
/ I1/'I,\d /l 4\ /SI
60
50
40
3C
20
'C
0
II
Head StartPreschoolNo Preschool
II
(
L /I
I I Ii I I
5 10 15203040
/1
60I I I I
5 10 1520 3040Permanent income (000s)
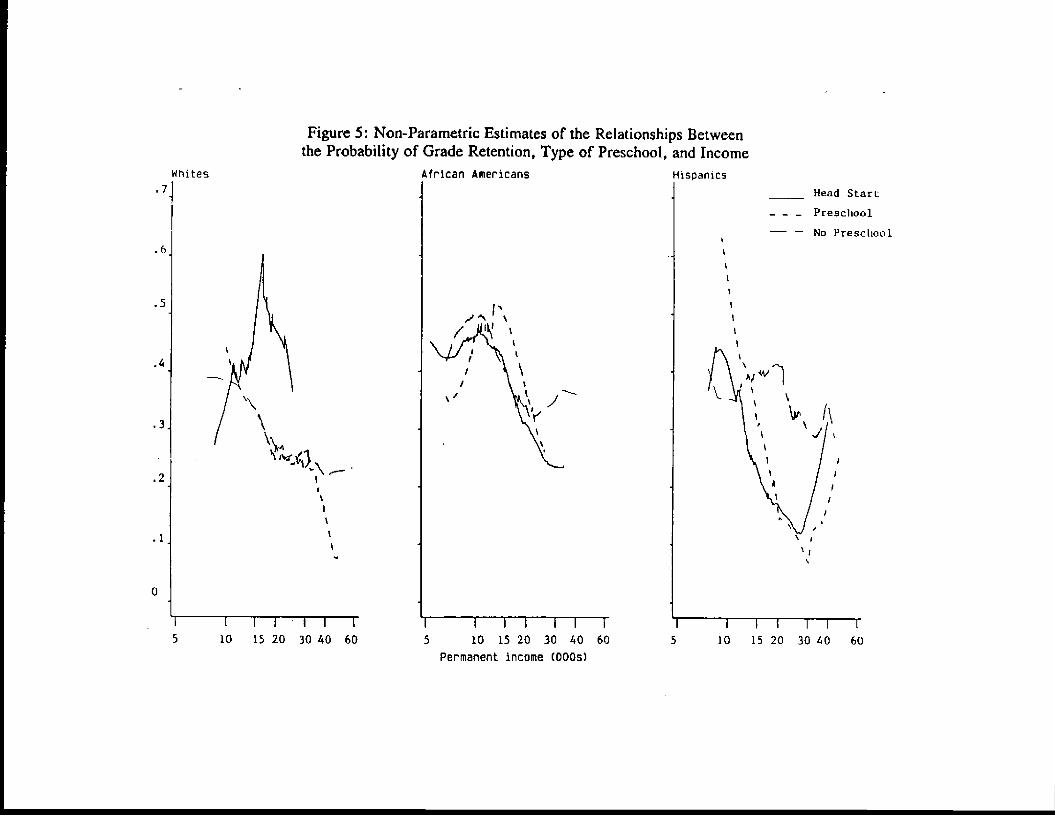
Figure 5: Non-Parametric Estimates of the Relationships Betweenthe Probability of Grade Retention, Type of Preschool, and Income
Whites African Americans Llispanics______ Head Start
— — — Preschool— — No Preschool
.7
• C)
.5
.4
.3
.2
.1
0
V
I F I I
5 10 1520 3040 60
'I4'
I I II5 10 15 20
I
30I I I I F IF T
40 60 5 10 15 20 30 40 60
Permanent Income (ODDs)
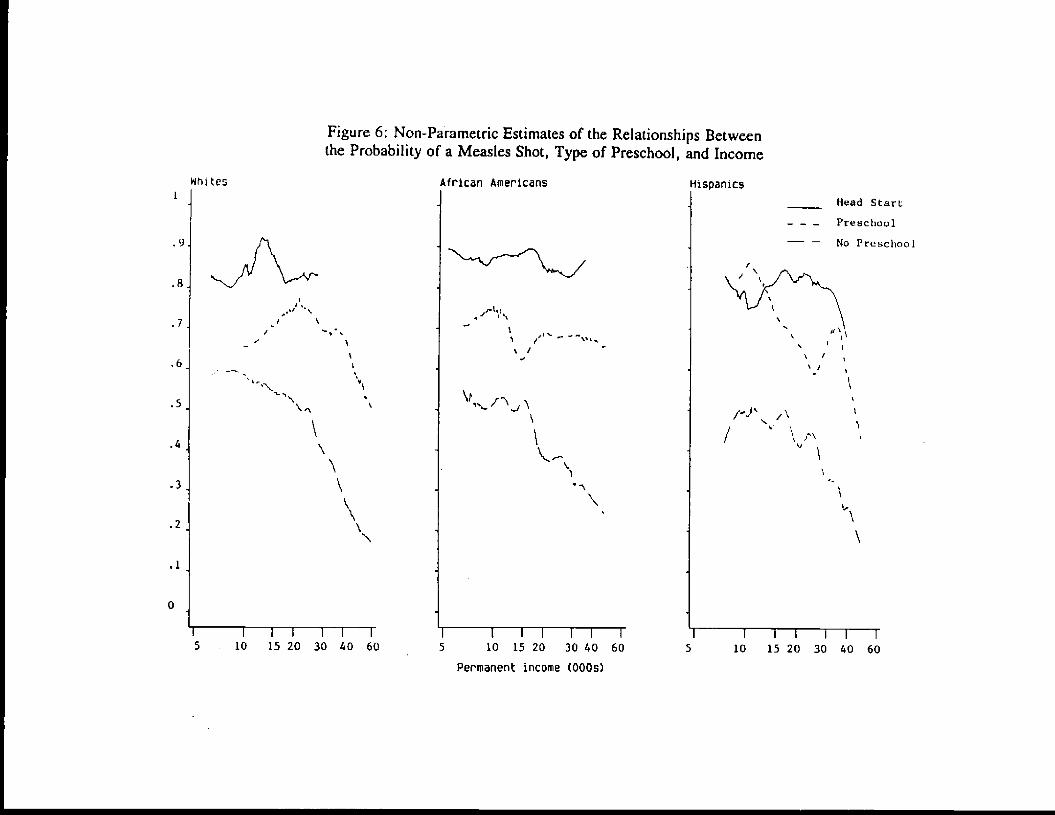
Figure 6: Non-Parametric Estimates of the Relationships Betweenthe Probability of a Measles Shot, Type of Preschool, and Income
African Americans Hispanics_____ Head Start
— — — Preschool— — No Preschool• .
/ '\.4 \
.3 \
.2N
.1
0
I 1 11 I I II II I I II II5.10 1520304060 5 101520 304060 5 10 1520304060Permanent income (000s}
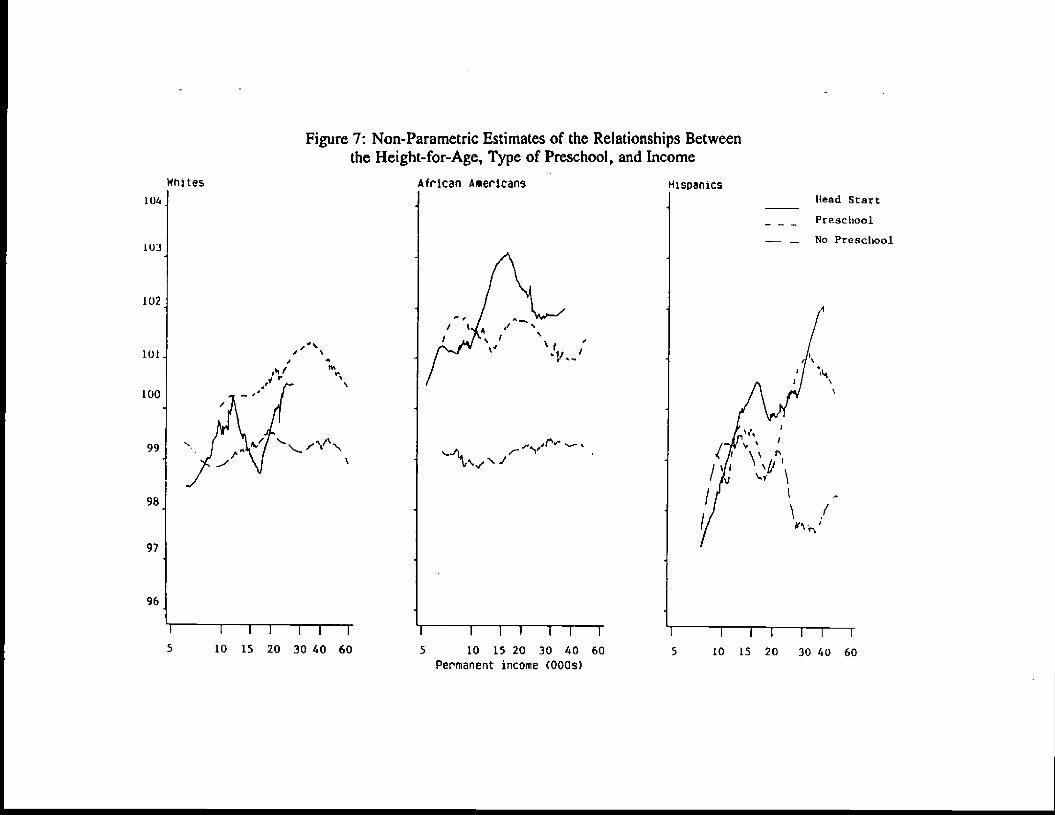
Figure 7: Non-Parametric Estimates of the Relationships Betweenthe Height-for-Age, Type of Preschool, and Income
/
I I I I I I
5 10 1520304060Permanent income (000$)
Preschool
— — No Preschool
African Americans HispanicsHead Start
I I.
Whites104
103
102
101 I •i
100
99
98
97
96
Va'V.-,
j
•1
F F •1 I I I
5 10 15 20 3040 60
.1t4
p
"V
\ I,v\. I
/I
I F I 1 1 F F
5 10 15 20 3040 60
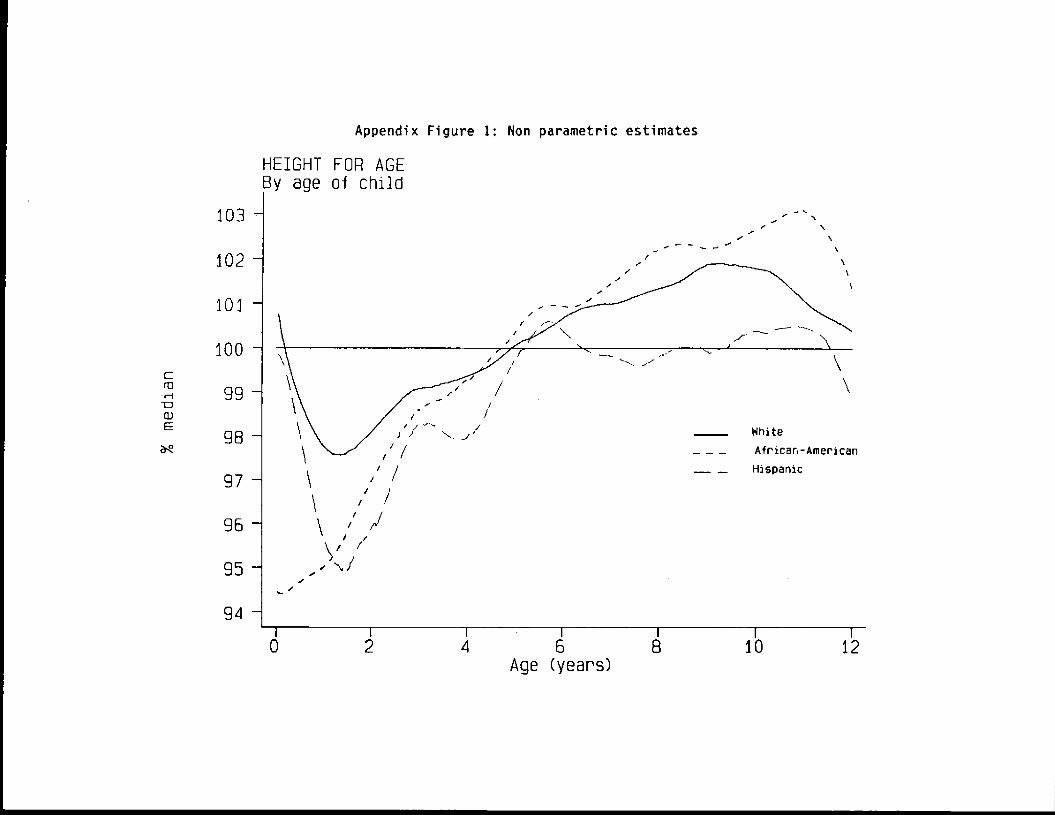
Appendix Figure 1: Non parametric estimates
HEIGHT FOP AGEBy age ot child
—— '4,
CIDr1-Da)E
103
102 -
101 -
100
99 -
98 -
97 -
96 -
95 -
94 -
// I
/ /ii'F /if/
\"I 11fl1
\>
White
Africa r - American
Hispanic
4
Age (years)
ib
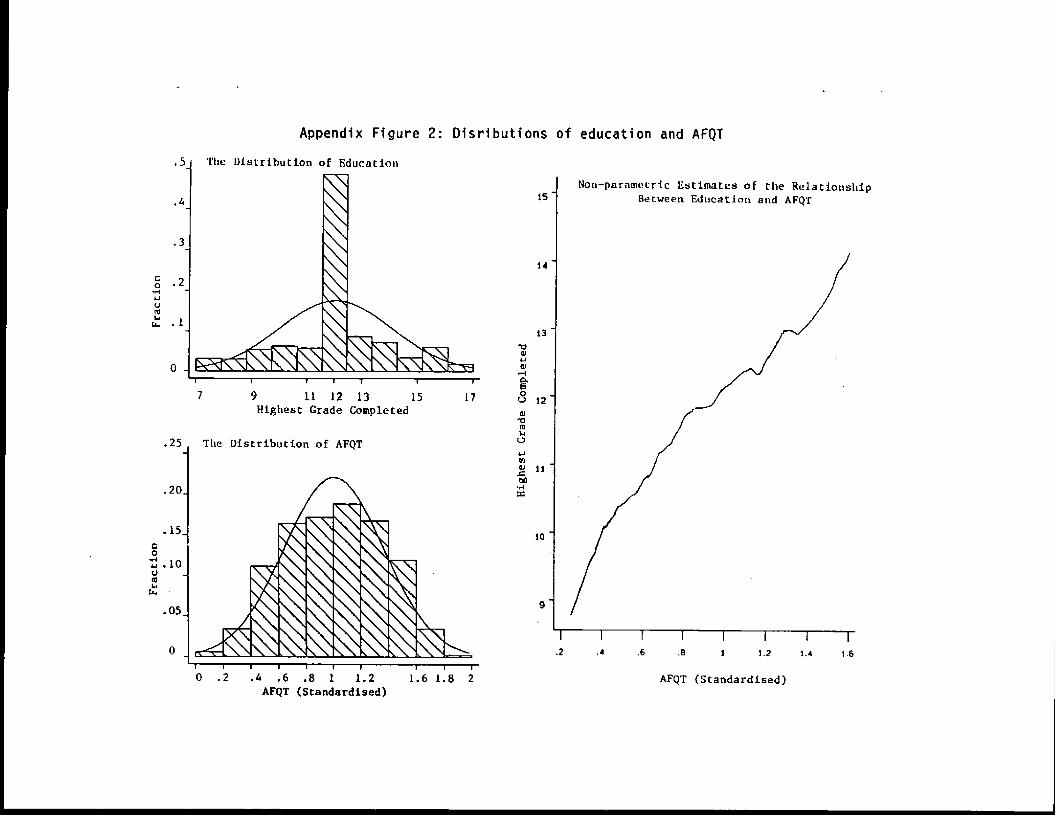
C0s-iU5I-i
Appendix Figure 2: Disributions of education and AFQT
.5 The Distribution of Education
00-4'I.UCL4
14
13••0a4-ia
1.15 L7 U 12a0aC,
4-i5ari
N
N
15Non—parametric Estimates of the Relationship
Between Education and AFQT.4
.3
.2
.1
0
.25
.20.
• 15.
I I I I
7 9 11 12 13Highest Grade Completed
The Distribution of AFQT
11
to
/r-,Ecc\\
05
0 NI0 .2
9
I I I I I 1 1 1
1.6 1.8 2
.2
.4 .6 .8 1 1.2 AFQT (Standardised)AFQT (Standardised)
I I I I I I I
.4 .6 .8 1 1.2 1.4 1.6


