
OER Corporate Presentation March 2015 - Oando PLC · CORPORATE PRESENTATION May 2015 Energy...
37
CORPORATE PRESENTATION May 2015 Energy Resources Inc.
-
Upload
nguyenhanh -
Category
Documents
-
view
215 -
download
0
Transcript of OER Corporate Presentation March 2015 - Oando PLC · CORPORATE PRESENTATION May 2015 Energy...
CORPORATEPRESENTATION
May 2015
Energy Resources Inc.
Disclaimer
This presentation includes certain forward looking statements with respect to certain development projects, potential collaborative partnerships, results of operations and certain plans and objectives of the Company including, in particular and without limitation, the statements regarding potential sales revenues from projects, both current and under development, possible launch dates for new projects, ability to successfully integrate acquisitions or achieve production targets, and any revenue and profit guidance. By their very nature forward looking statements involve risk and uncertainty that could cause actual results and developments to differ materially from those expressed or implied. The significant risks related to the Company’s business which could cause the Company’s actual results and developments to differ materially from those forward looking statements are discussed in the Company’s annual report and other filings. All forward looking statements in this presentation are based on information known to the Company on the date hereof. The Company will not publicly update or revise any forward looking statements, whether as a result of new information, future events or otherwise, other than is required by law.
Past performance is no guide to future performance and persons needing advice should consult an independent financial adviser. All estimates of reserves and resources are classified in line with NI 51-101 regulations and Canadian Oil & Gas Evaluation Handbook standards. All estimates are from
stIndependent Reserves Evaluator Report having an effective date of
BOEs [or McfGEs, or other applicable units of equivalency] may be misleading, particularly if used in isolation. A BOE conversion ratio of 6 Mcf: 1 bbl [or an McfGE conversion ratio of 1 bbl: 6 Mcf] is based on an energy equivalency conversion method primarily applicable at the burner tip and does not represent a value equivalency at the wellhead.
The estimates of reserves and future net revenue for individual properties may not reflect the same confidence level as estimates of reserves and future net revenue for all properties, due to the effects of aggregation.
Reserves: Reserves are volumes of hydrocarbons and associated substances estimated to be commercially recoverable from known accumulations from a given date forward by established technology under specified economic conditions and government regulations. Specified economic conditions may be current economic conditions in the case of constant price and un-inflated cost forecasts (as required by many financial regulatory authorities) or they may be reasonably anticipated economic conditions in the case of escalated price and inflated cost forecasts.
Possible Reserves: Possible reserves are quantities of recoverable hydrocarbons estimated on the basis of engineering and geological data that are less complete and less conclusive than the data used in estimates of probable reserves. Possible reserves are less certain to be recovered than proved or probable reserves which means for purposes of reserves classification there is a 10% probability that more than these reserves will be recovered, i.e. there is a 90% probability that less than these reserves will be recovered. This category includes those reserves that may be recovered by an enhanced recovery scheme that is not in operation and where there is reasonable doubt as to its chance of success.
Proved Reserves: Proved reserves are those reserves that can be estimated with a high degree of certainty on the basis of an analysis of drilling, geological, geophysical and engineering data. A high degree of certainty generally means, for the purposes of reserve classification, that it is likely that the actual remaining quantities recovered will exceed the estimated proved reserves and there is a 90% confidence that at least these reserves will be produced, i.e. there is only a 10% probability that less than these reserves will be recovered. In general reserves are considered proved only if supported by actual production or formation testing. In certain instances proved reserves may be assigned on the basis of log and/or core analysis if analogous reservoirs are known to be economically productive. Proved reserves are also assigned for enhanced recovery processes which have been demonstrated to be economically and technically successful in the reservoir either by pilot testing or by analogy to installed projects in analogous reservoirs.
Probable Reserves: Probable reserves are quantities of recoverable hydrocarbons estimated on the basis of engineering and geological data that are similar to those used for proved reserves but that lack, for various reasons, the certainty required to classify the reserves are proved. Probable reserves are less certain to be recovered than proved reserves; which means, for purposes of reserves classification, that there is 50% probability that more than the Proved plus Probable Additional reserves will actually be recovered. These include reserves that would be recoverable if a more efficient recovery mechanism develops than was assumed in estimating proved reserves; reserves that depend on successful work-over or mechanical changes for recovery; reserves that require infill drilling and reserves from an enhanced recovery process which has yet to be established and pilot tested but appears to have favorable conditions
OER
This presentation does not constitute an invitation to underwrite, subscribe for, or otherwise acquire or dispose of any Oando Energy Resources Inc (the “Company”) shares or other securities.
2
31 December 2014.
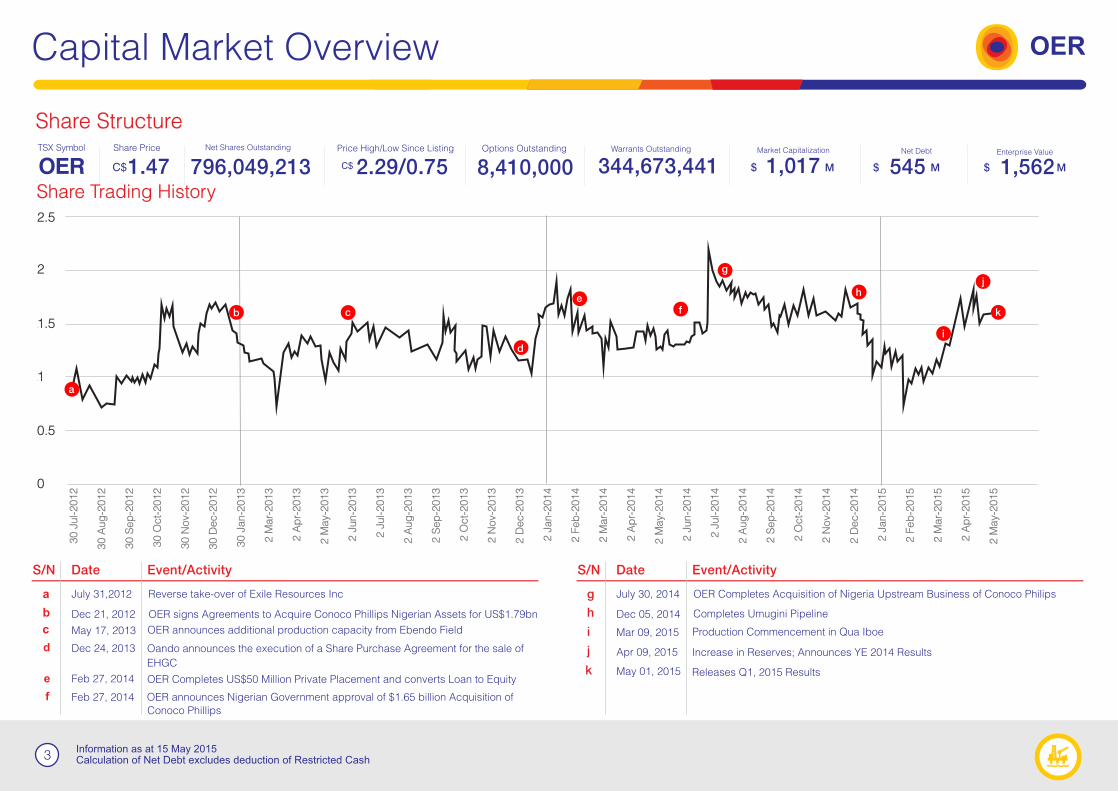
Share Structure
1,5621.47 2.29/0.75 344,673,4418,410,000Enterprise ValueMarket Capitalization Net Debt
1,017$ 545$ MM $ M
Capital Market Overview
Information as at 15 May 2015
OER
3
Share Trading History
2.5
2
1.5
1
0.5
0
c
d
ef
g
30 J
ul-2012
30 A
ug
-2012
30 S
ep
-2012
30 O
ct-
2012
30 N
ov-
2012
30 D
ec-2
012
30 J
an-2
013
2 M
ar-
2013
2 A
pr-
2013
2 M
ay-
2013
2 J
un-2
013
2 J
ul-2013
2 A
ug
-2013
2 S
ep
-2013
2 O
ct-
2013
2 N
ov-
2013
2 D
ec-2
013
2 J
an-2
014
2 F
eb
-2014
2 M
ar-
2014
2 A
pr-
2014
2 M
ay-
2014
2 J
un-2
014
2 J
ul-2014
2 A
ug
-2014
2 S
ep
-2014
2 O
ct-
2014
2 N
ov-
2014
2 D
ec-2
014
2 J
an-2
015
2 F
eb
-2015
2 M
ar-
2015
2 A
pr-
2015
2 M
ay-
2015
Date Event/ActivityS/N
Reverse take-over of Exile Resources Inc
OER signs Agreements to Acquire Conoco Phillips Nigerian Assets for US$1.79bn
OER announces additional production capacity from Ebendo Field
Oando announces the execution of a Share Purchase Agreement for the sale of
EHGC
OER Completes US$50 Million Private Placement and converts Loan to Equity
OER announces Nigerian Government approval of $1.65 billion Acquisition of
Conoco Phillips
July 31,2012
Dec 21, 2012
May 17, 2013
Dec 24, 2013
Feb 27, 2014
Feb 27, 2014
Date Event/ActivityS/N
OER Completes Acquisition of Nigeria Upstream Business of Conoco Philips
Completes Umugini Pipeline
Production Commencement in Qua Iboe
Increase in Reserves; Announces YE 2014 Results
Releases Q1, 2015 Results
July 30, 2014
Dec 05, 2014
Mar 09, 2015
Apr 09, 2015
May 01, 2015
g
h
i
j
k
h
b
a
i
j
k
796,049,213
Calculation of Net Debt excludes deduction of Restricted Cash

Historical Context
Ebendo productionramp up
OER
Formation of the largest indigenous oil and gas producer in Nigeria
4
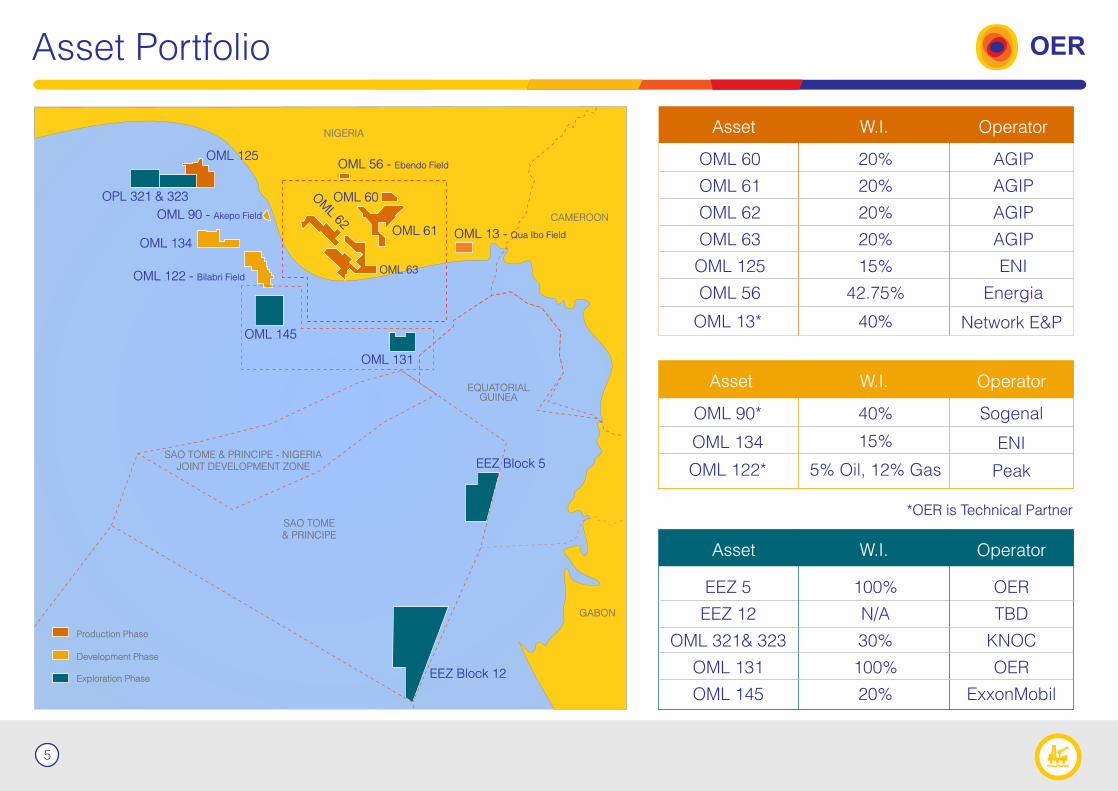
Asset Portfolio
OML 60
OML 61
OML 62
OML 63
OML 125
OML 56
20%
20%
20%
20%
15%
42.75%
AGIP
AGIP
AGIP
AGIP
ENI
Energia
Asset W.I. Operator
OML 90*
OML 13*
OML 134
OML 122*
40%
40%
15%
5% Oil, 12% Gas
Sogenal
Network E&P
ENI
Peak
Asset W.I. Operator
EEZ 5
EEZ 12
OML 321& 323
OML 131
OML 145
100%
N/A
30%
100%
20%
OER
TBD
KNOC
OER
ExxonMobil
Asset W.I. Operator
OML 125
NIGERIA
OPL 321 & 323
OML 134
OML 122 - Bilabri Field
OML 90 - Akepo Field
OML 56 - Ebendo Field
CAMEROON
EQUATORIALGUINEA
EEZ Block 5
SAO TOME& PRINCIPE
Production Phase
Development Phase
Exploration Phase
SAO TOME & PRINCIPE - NIGERIAJOINT DEVELOPMENT ZONE
GABON
EEZ Block 12
OML 145
OML 131
OM
L 62
OML 60
OML 61
OML 63
OML 13 - Qua Ibo Field
*OER is Technical Partner
OER
5
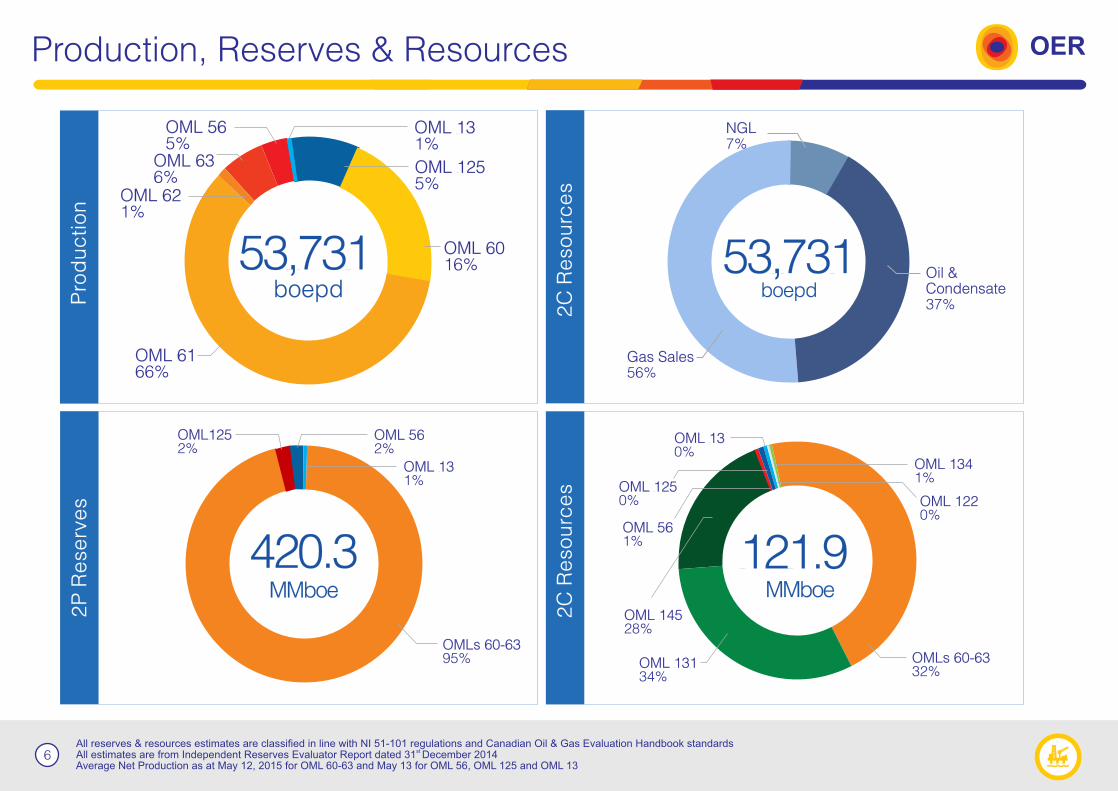
Production, Reserves & Resources
All reserves & resources estimates are classified in line with NI 51-101 regulations and Canadian Oil & Gas Evaluation Handbook standards stAll estimates are from Independent Reserves Evaluator Report dated 31 December 2014
Average Net Production as at May 12, 2015 for OML 60-63 and May 13 for OML 56, OML 125 and OML 13
OER
6
2P
Re
se
rve
s
2C
Re
so
urc
es
Pro
du
ctio
n
OMLs 60-6332%
OML 145 28%
121.9MMboe
OML 131 34%
OML 13 0%
OML 134 1%
OML 122 0%
OML 56 1%
OML 125 0%
53,731
OML 62 1%
OML 636%
OML 56 5%
OML 6166%
boepd
OML 125 5%
OML 6016%
420.3MMboe
OML 562%
OMLs 60-6395%
OML1252%
OML 131%
OML 13 1%
2C
Re
so
urc
es
Oil & Condensate37%
NGL7%
Gas Sales56%
53,731boepd

Capital Structure
Assumes closing share price of US$1.41 as at 08 May 2015All information in US Dollars
OERM
ark
et C
ap
italis
ation
1,017
Oando PLC 93.8%
Public 6.2%
US$ M
Net D
eb
t
545
Senior Structured Facility LIBOR + 5%1 Year Tenor
RBL Facility LIBOR + 8.5% 5.5 Year Tenor
US$ M
Ente
rprise
Valu
e
1,562
Debt35%
Market Capitalization65%
US$
Senior CorporateFacility LIBOR + 9.5% 6 Year Tenor
7
M
Calculation for Net Debt excludes deduction of Restricted Cash
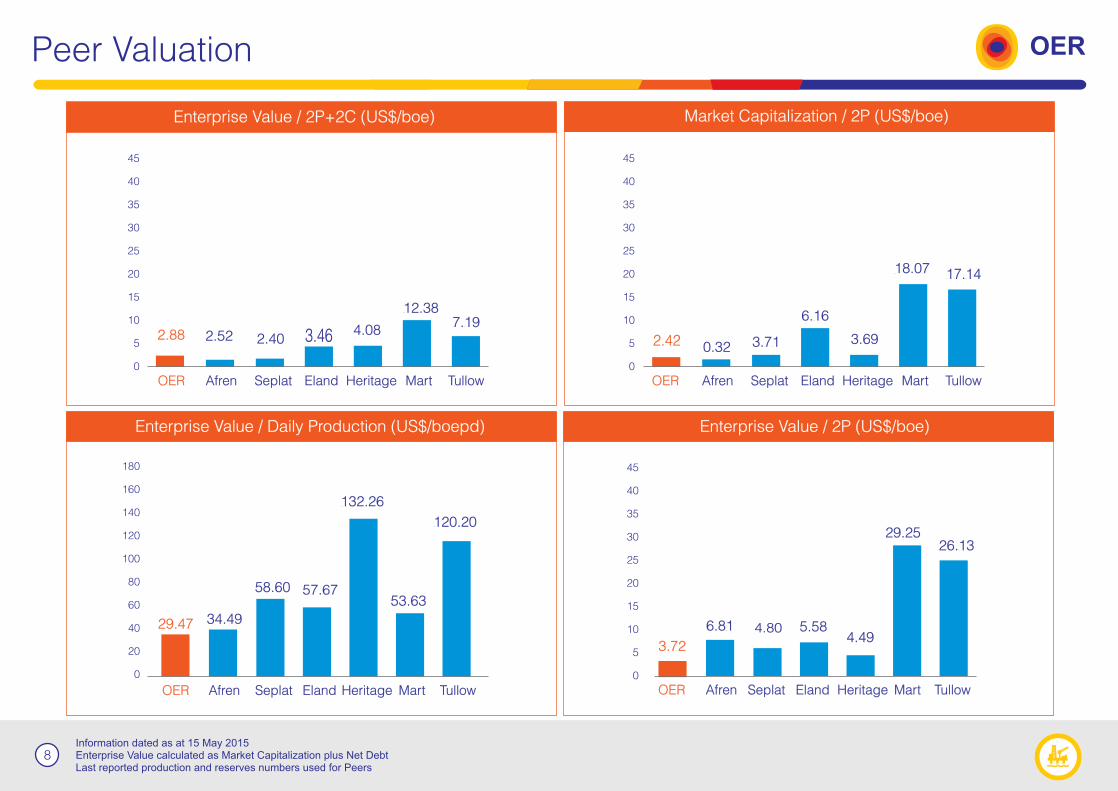
Information dated as at 15 May 2015Enterprise Value calculated as Market Capitalization plus Net DebtLast reported production and reserves numbers used for Peers
Peer Valuation OER
8
Enterprise Value / Daily Production (US$/boepd)
OER Afren Seplat Eland Heritage Mart Tullow
180
160
140
120
100
80
60
40
20
0
Enterprise Value / 2P (US$/boe)
Market Capitalization / 2P (US$/boe)
OER Afren Seplat Eland Heritage Mart Tullow
45
40
35
30
25
20
15
10
5
0
Enterprise Value / 2P+2C (US$/boe)
OER Afren Seplat Eland Heritage Mart Tullow
45
40
35
30
25
20
15
10
5
0
OER Afren Seplat Eland Heritage Mart Tullow
45
40
35
30
25
20
15
10
5
0
2.88 2.52 2.40 3.46 4.08
12.387.19
2.42 0.32 3.71
6.16
3.69
18.07 17.14
29.47 34.49
58.60 57.67
132.26
53.63
120.20
3.72
6.81 4.80 5.584.49
29.2526.13
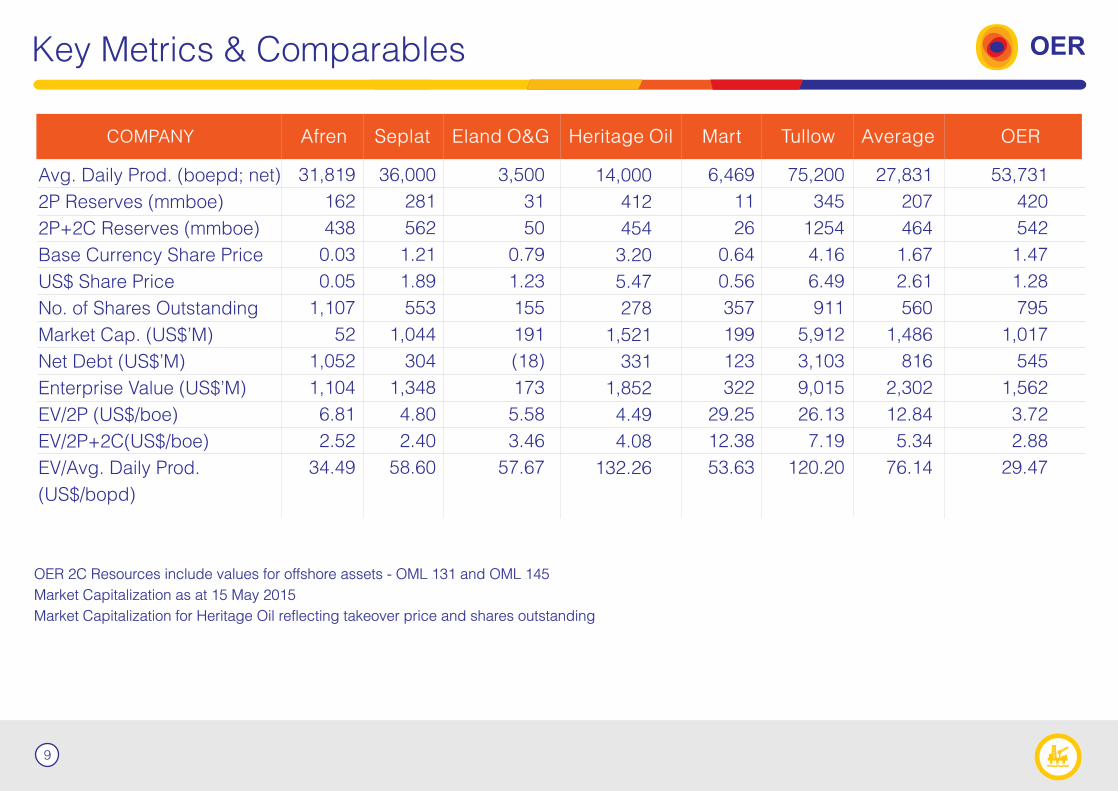
Key Metrics & Comparables
OER 2C Resources include values for offshore assets - OML 131 and OML 145
Market Capitalization as at 15 May 2015
Market Capitalization for Heritage Oil reflecting takeover price and shares outstanding
OER
9
Avg. Daily Prod. (boepd; net)
2P Reserves (mmboe)
2P+2C Reserves (mmboe)
Base Currency Share Price
US$ Share Price
No. of Shares Outstanding
Market Cap. (US$’M)
Net Debt (US$’M)
Enterprise Value (US$’M)
EV/2P (US$/boe)
EV/2P+2C(US$/boe)
EV/Avg. Daily Prod.
(US$/bopd)
COMPANY Afren Seplat Heritage OilEland O&G Mart Tullow Average OER
31,819
162
438
0.03
0.05
1,107
52
1,052
1,104
6.81
2.52
34.49
36,000
281
562
1.21
1.89
553
1,044
304
1,348
4.80
2.40
58.60
3,500
31
50
0.79
1.23
155
191
(18)
173
5.58
3.46
57.67
14,000
412
454
3.20
5.47
278
1,521
331
1,852
4.49
4.08
132.26
6,469
11
26
0.64
0.56
357
199
123
322
29.25
12.38
53.63
75,200
345
1254
4.16
6.49
911
5,912
3,103
9,015
26.13
7.19
120.20
27,831
207
464
1.67
2.61
560
1,486
816
2,302
12.84
5.34
76.14
53,731
420
542
1.47
1.28
795
1,017
545
1,562
3.72
2.88
29.47

Exploration & Production Growth Strategy OER
GROWTHSTRATEGY
Competitive Advantage
Indigenous status and capacityPresence in local communities, local partnerships and relationshipsCapital raising capabilities, through TSX listing
Value Drivers
De-risk existing resources portfolio and bring both existing and new assets on-streamCreate sole-risk opportunities within NAOC JVAcquisition of proven reserves and near term producing assetsReduce crude oil theft by improved surveillance and securityIncrease protable production through eld exploitation & improved reservior management
Identication, access & acquisition of opportunities in the O&G Industry
Marginal eld programmesIOCs divestment plansGovernment bid roundsM&A activity
Disciplined approach to capitalstructure & valuation
Financial disciplineBalance sheet restructuringDebt reductionLower risk
Growing Reserves & Resources
10
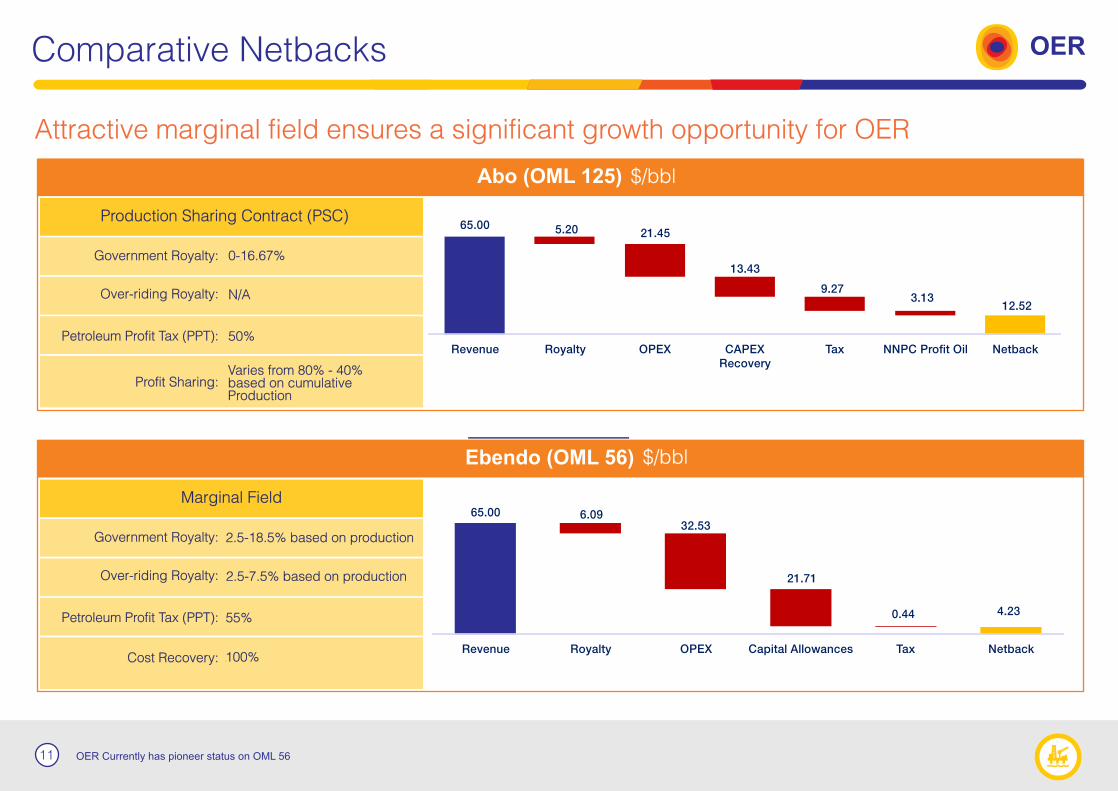
Attractive marginal field ensures a significant growth opportunity for OER
Comparative Netbacks OER
11 OER Currently has pioneer status on OML 56
65.00
12.52
5.20 21.45
13.43
9.273.13
Revenue Royalty OPEX CAPEXRecovery
Tax NNPC Profit Oil Netback
65.00
4.23
6.0932.53
21.71
0.44
Revenue Royalty OPEX Capital Allowances Tax Netback
$/bbl
$/bbl
Production Sharing Contract (PSC)
Government Royalty:
Over-riding Royalty:
Petroleum Profit Tax (PPT):
Profit Sharing:
0-16.67%
N/A
50%
Varies from 80% - 40%based on cumulative Production
Marginal Field
Government Royalty:
Over-riding Royalty:
Petroleum Profit Tax (PPT):
Cost Recovery:
2.5-18.5% based on production
55%
100%
2.5-7.5% based on production
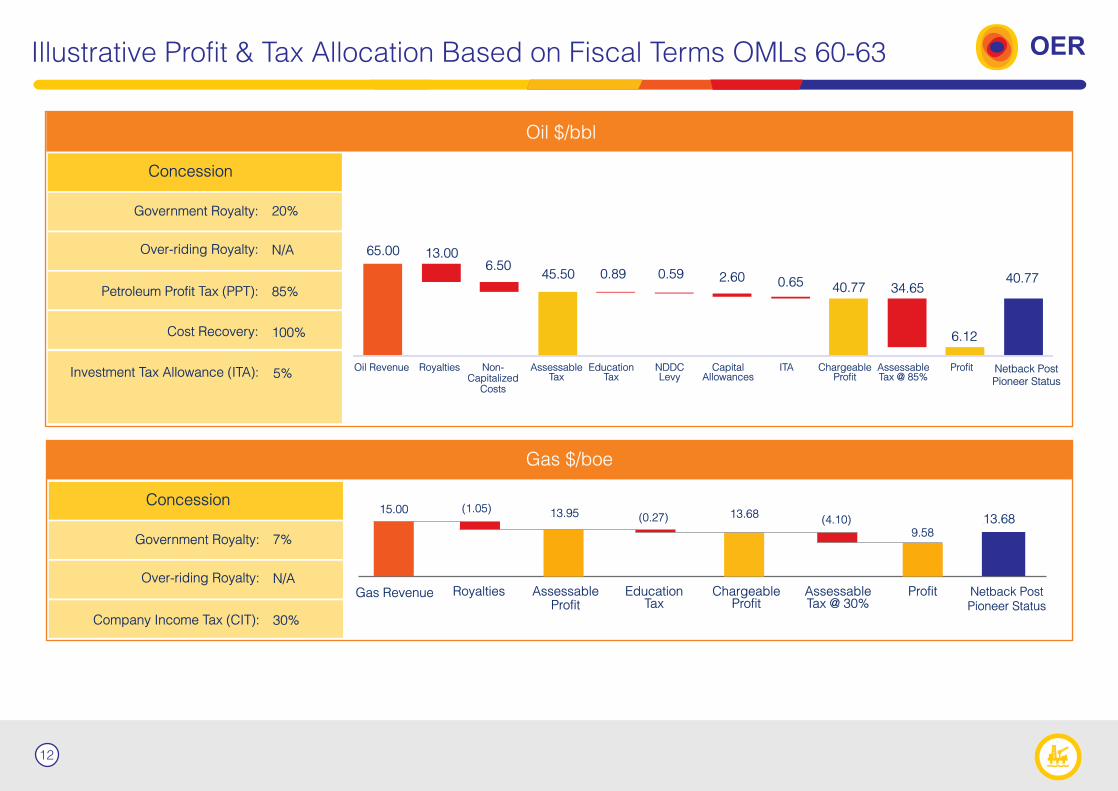
Illustrative Profit & Tax Allocation Based on Fiscal Terms OMLs 60-63 OER
12
Oil Revenue Royalties Non-Capitalized
Costs
AssessableTax
EducationTax
NDDC Levy
CapitalAllowances
ITA Chargeable Profit
AssessableTax @ 85%
Profit
Gas Revenue Royalties AssessableProfit
EducationTax
Chargeable Profit
15.00 13.95 13.68
AssessableTax @ 30%
Profit
9.58
Netback Post Pioneer Status
13.68
Netback Post Pioneer Status
(4.10)(0.27)(1.05)
Gas $/boe
Oil $/bbl
Concession
Government Royalty:
Over-riding Royalty:
Petroleum Profit Tax (PPT):
Cost Recovery:
Investment Tax Allowance (ITA):
20%
N/A
85%
100%
5%
Concession
Government Royalty:
Over-riding Royalty:
Company Income Tax (CIT):
7%
N/A
30%
65.00
45.5040.77
6.12
40.77
13.006.50
0.89 0.59 2.60 0.65 34.65

13
Omamofe Boyo is a Director of Oando Energy Resources as well as the Deputy Group Chief Executive of Oando plc. Before taking up this position, he doubled as the Executive Director, Marketing of Oando plc and CEO of Oando Supply & Trading. Between 2004 and 2006, he transformed Oando Supply & Trading into Africa’s largest private sector trading company.
Board of Directors & Advisers OER
Independent Auditors
Transfer Agent & Registrar
Independent Reserves Evaluator
Bill Watson | Lead Director
Wale Tinubu | Chairman, Director Omamofe Boyo | Director
John Orange | Director
Wale Tinubu has pioneered the execution of world-class initiatives in the region as an ethical business leader, entrepreneur and philanthropist. As well as being Chairman and Director of Oando Energy Resources, he Co-founded Ocean & Oil Group in 1994 and has been the Group Chief Executive of Oando plc since 2001. In 2002, led the largest ever acquisition of a quoted Nigerian Company, Agip.
Bill Watson is a seasoned oil and gas professional with more than 35 years’ experience, including 20 years in executive and middle management roles worldwide. He most recently served as Husky Energy’s Chief Operating Officer, SE Asia.
John Orange possesses a wide breadth of experience in the oil and gas industry. He served as a senior executive for the BP group from 1967 to 1996, and is on the boards of various public and private exploration and production companies. Other roles include serving as a Director at Premier Oil, Exile, and Vostok Energy
25+ 25+
Pade Durotoye | CEO, Director
Served as the CEO of OEPL from June 2010 until July 2012. Until 2010, Mr. Durotoye served as the Managing Director & CEO of Ocean and Oil Holdings Group. Prior to his work at Ocean and Oil, Mr. Durotoye spent more than 19 years with Schlumberger Oilfield Services where he held various management roles.25+
35+
40+
Philippe Laborde | Director
Philippe Laborde is an experienced oil and gas professional with 35 years of industry experience. He is the founder and CEO of Olaeum Energy, a start-up venture capital company focused on oil and gas investments across Africa. He also co-founded DB Petroleum – an upstream joint venture between Dubai World and Benny Steinmetz Group – and acted as its CEO for the Africa and the Middle East region. He spent over 20 years in progressively senior international positions at Elf Aquitaine.
35+
Roland Royal | Director
Ronald Royal was President & General Manager of Esso Chad from 2002 until his retirement in 2007 where he oversaw the development of the Chad Development Project. Prior to 2002, he was the General Manager & Production Manager of Esso REP in France for 12 years. He was awarded the title of “Chevalier de l’Ordre National du Chad” for his contribution to the economic development of Chad in 2003.
40+
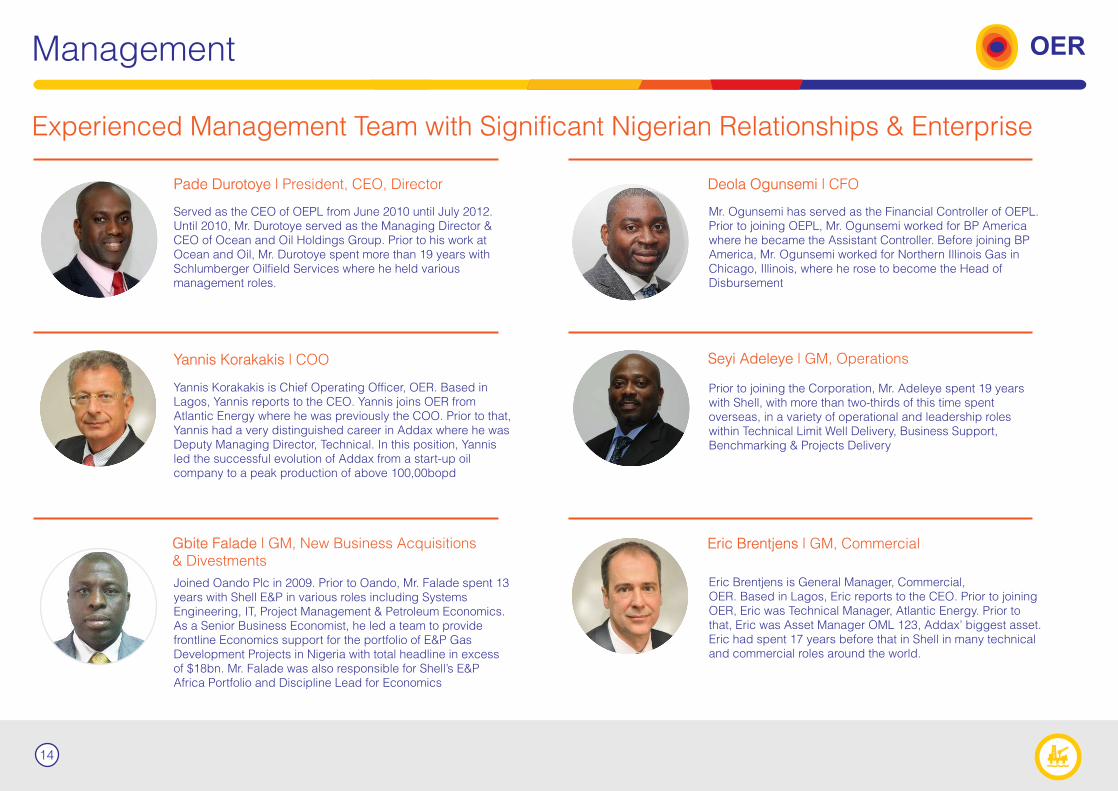
Management
Gbite Falade | GM, New Business Acquisitions & Divestments
Yannis Korakakis | COO
Pade Durotoye | President, CEO, Director Deola Ogunsemi | CFO
Seyi Adeleye | GM, Operations
Eric Brentjens | GM, Commercial
OER
Experienced Management Team with Significant Nigerian Relationships & Enterprise
Served as the CEO of OEPL from June 2010 until July 2012. Until 2010, Mr. Durotoye served as the Managing Director & CEO of Ocean and Oil Holdings Group. Prior to his work at Ocean and Oil, Mr. Durotoye spent more than 19 years with Schlumberger Oilfield Services where he held various management roles.
Yannis Korakakis is Chief Operating Officer, OER. Based in Lagos, Yannis reports to the CEO. Yannis joins OER from Atlantic Energy where he was previously the COO. Prior to that, Yannis had a very distinguished career in Addax where he was Deputy Managing Director, Technical. In this position, Yannis led the successful evolution of Addax from a start-up oil company to a peak production of above 100,00bopd
Joined Oando Plc in 2009. Prior to Oando, Mr. Falade spent 13 years with Shell E&P in various roles including Systems Engineering, IT, Project Management & Petroleum Economics. As a Senior Business Economist, he led a team to provide frontline Economics support for the portfolio of E&P Gas Development Projects in Nigeria with total headline in excess of $18bn. Mr. Falade was also responsible for Shell’s E&P Africa Portfolio and Discipline Lead for Economics
Mr. Ogunsemi has served as the Financial Controller of OEPL. Prior to joining OEPL, Mr. Ogunsemi worked for BP America where he became the Assistant Controller. Before joining BP America, Mr. Ogunsemi worked for Northern Illinois Gas in Chicago, Illinois, where he rose to become the Head of Disbursement
Prior to joining the Corporation, Mr. Adeleye spent 19 years with Shell, with more than two-thirds of this time spent overseas, in a variety of operational and leadership roles within Technical Limit Well Delivery, Business Support, Benchmarking & Projects Delivery
Eric Brentjens is General Manager, Commercial, OER. Based in Lagos, Eric reports to the CEO. Prior to joining OER, Eric was Technical Manager, Atlantic Energy. Prior to that, Eric was Asset Manager OML 123, Addax’ biggest asset. Eric had spent 17 years before that in Shell in many technical and commercial roles around the world.
14
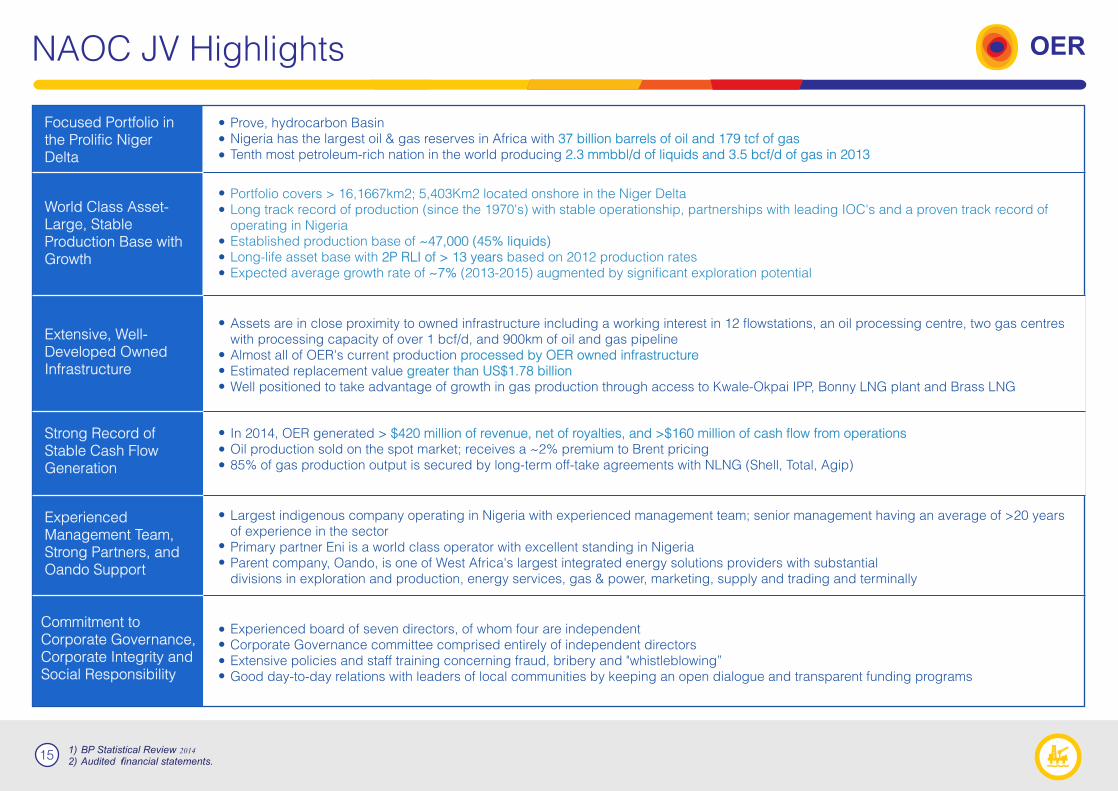
NAOC JV Highlights OER
15
Focused Portfolio in the Prolific Niger Delta
World Class Asset-Large, Stable Production Base with Growth
Extensive, Well-Developed Owned Infrastructure
Strong Record of Stable Cash Flow Generation
Experienced Management Team, Strong Partners, and Oando Support
Commitment to Corporate Governance, Corporate Integrity and Social Responsibility
Prove, hydrocarbon BasinNigeria has the largest oil & gas reserves in Africa with 37 billion barrels of oil and 179 tcf of gasTenth most petroleum-rich nation in the world producing 2.3 mmbbl/d of liquids and 3.5 bcf/d of gas in 2013
Portfolio covers > 16,1667km2; 5,403Km2 located onshore in the Niger DeltaLong track record of production (since the 1970's) with stable operationship, partnerships with leading IOC's and a proven track record of operating in NigeriaEstablished production base of ~47,000 (45% liquids)Long-life asset base with based on 2012 production rates2P RLI of > 13 yearsExpected average growth rate of (2013-2015) augmented by significant exploration potential~7%
Assets are in close proximity to owned infrastructure including a working interest in 12 flowstations, an oil processing centre, two gas centres with processing capacity of over 1 bcf/d, and 900km of oil and gas pipelineAlmost all of OER's current production processed by OER owned infrastructure Estimated replacement value greater than US$1.78 billionWell positioned to take advantage of growth in gas production through access to Kwale-Okpai IPP, Bonny LNG plant and Brass LNG
In 2014, OER generated > $420 million of revenue, net of royalties, and >$160 million of cash flow from operationsOil production sold on the spot market; receives a ~2% premium to Brent pricing85% of gas production output is secured by long-term off-take agreements with NLNG (Shell, Total, Agip)
Largest indigenous company operating in Nigeria with experienced management team; senior management having an average of >20 years of experience in the sectorPrimary partner Eni is a world class operator with excellent standing in Nigeria Parent company, Oando, is one of West Africa's largest integrated energy solutions providers with substantial divisions in exploration and production, energy services, gas & power, marketing, supply and trading and terminally
Experienced board of seven directors, of whom four are independent Corporate Governance committee comprised entirely of independent directorsExtensive policies and staff training concerning fraud, bribery and "whistleblowing”Good day-to-day relations with leaders of local communities by keeping an open dialogue and transparent funding programs
2014
All Reserves & Resources estimates are classified in line with NI 51-101 regulations and Canadian Oil & Gas Evaluation Handbook standards.
All estimates are from Independent ReservesEvaluator report dated 31st December 2014
Appendix
16
The Nigerian Operating Environment
17
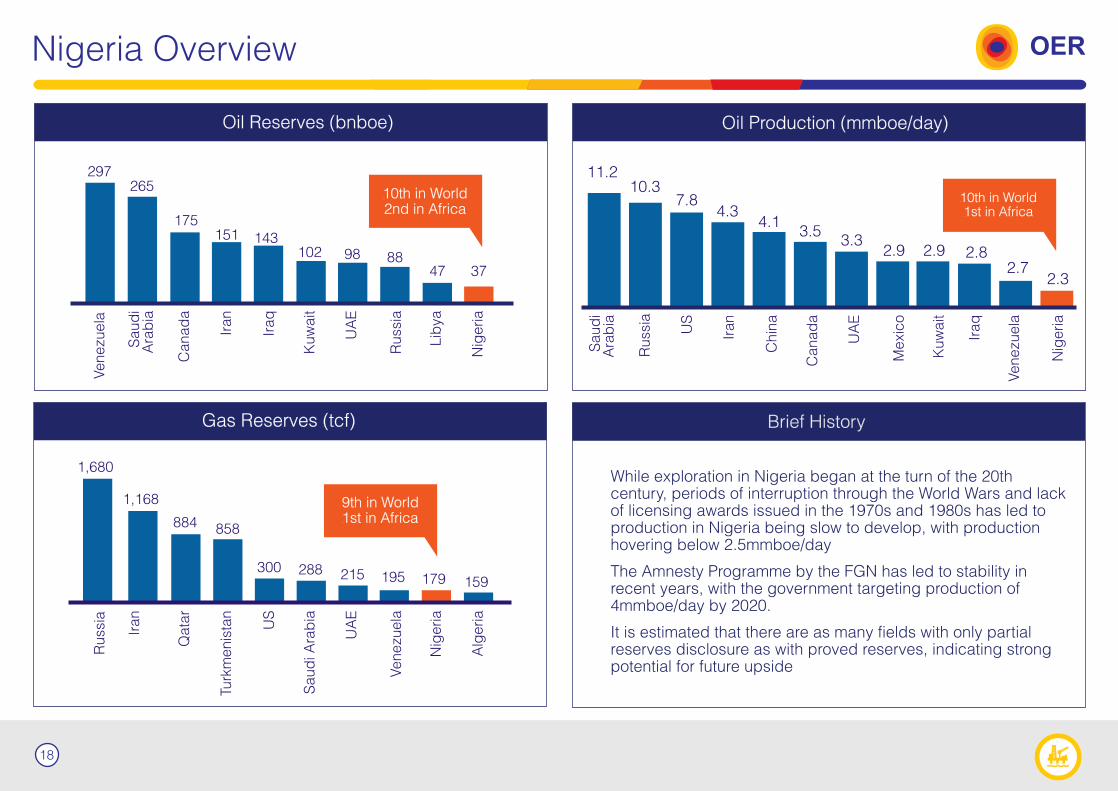
While exploration in Nigeria began at the turn of the 20th century, periods of interruption through the World Wars and lack of licensing awards issued in the 1970s and 1980s has led to production in Nigeria being slow to develop, with production hovering below 2.5mmboe/day
The Amnesty Programme by the FGN has led to stability in recent years, with the government targeting production of 4mmboe/day by 2020.
It is estimated that there are as many fields with only partial reserves disclosure as with proved reserves, indicating strong potential for future upside
297265
175151 143
102 98 8847 37
10th in World2nd in Africa
Oil Reserves (bnboe)
Gas Reserves (tcf)
1,680
1,168
884 858
300 288 215 195 179 159
11.210.3
7.84.3
4.13.5
3.32.9 2.8
2.72.3
Venezu
ela
Saud
iA
rab
ia
Canad
a
Iran
Iraq
Kuw
ait
UA
E
Russ
ia
Lib
ya
Nig
eria
2.9
Brief History
Russ
ia
Iran
Qata
r
Turk
menis
tan
US
Saud
i Ara
bia
UA
E
Venezu
ela
Nig
eria
Alg
eria
Oil Production (mmboe/day)
Russ
ia
Saud
iA
rab
ia
US
Iran
Chin
a
Canad
a
UA
E
Mexi
co
Kuw
ait
Iraq
Venezu
ela
Nig
eria
10th in World1st in Africa
9th in World1st in Africa
Nigeria Overview OER
18
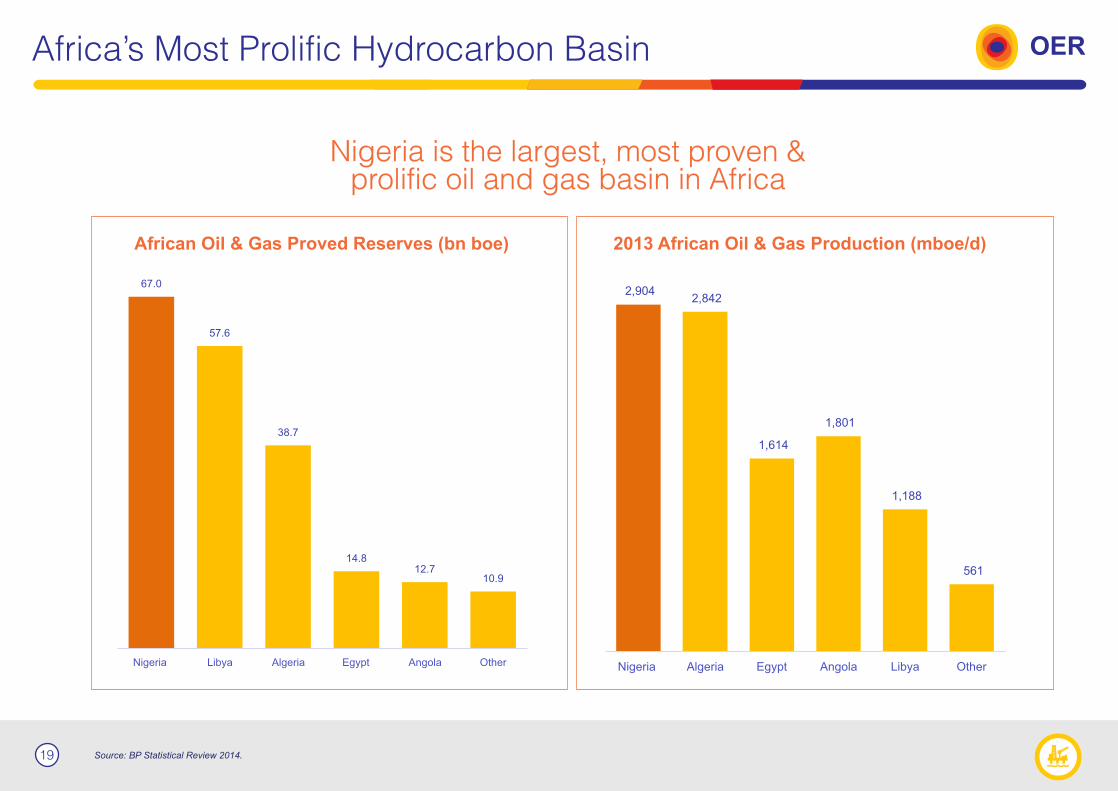
Nigeria is the largest, most proven &prolific oil and gas basin in Africa
Africa’s Most Prolific Hydrocarbon Basin OER
19
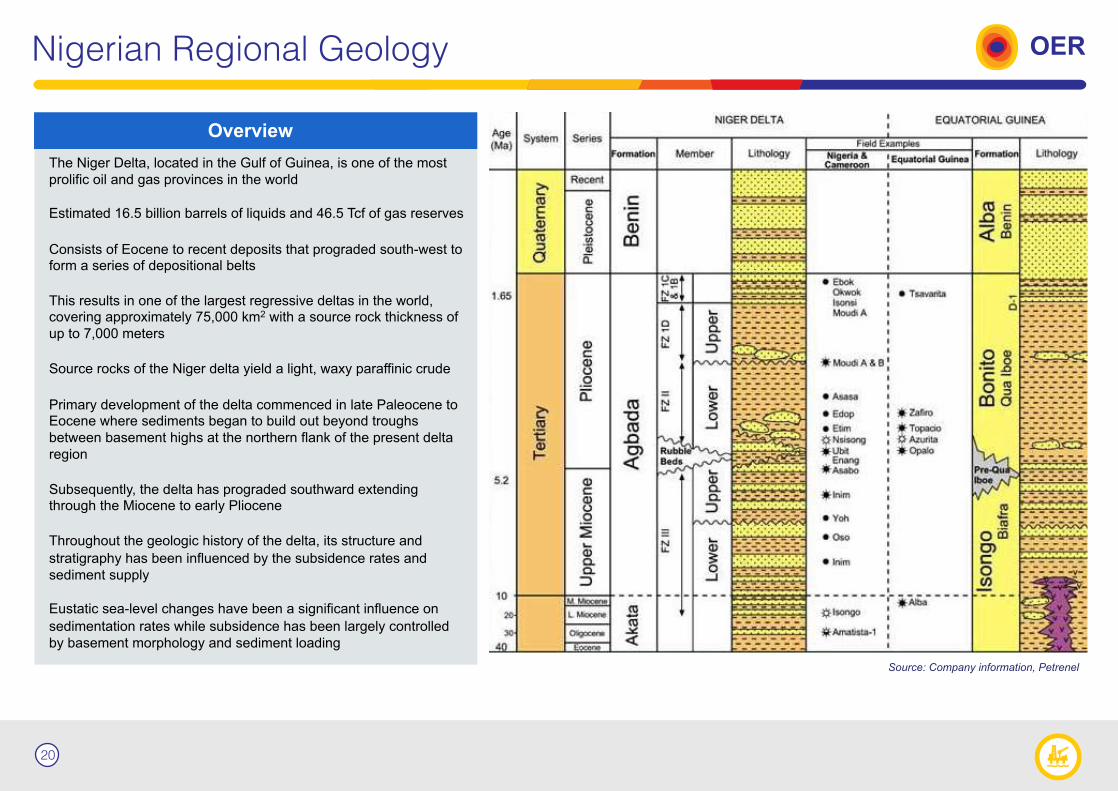
Nigerian Regional Geology OER
20
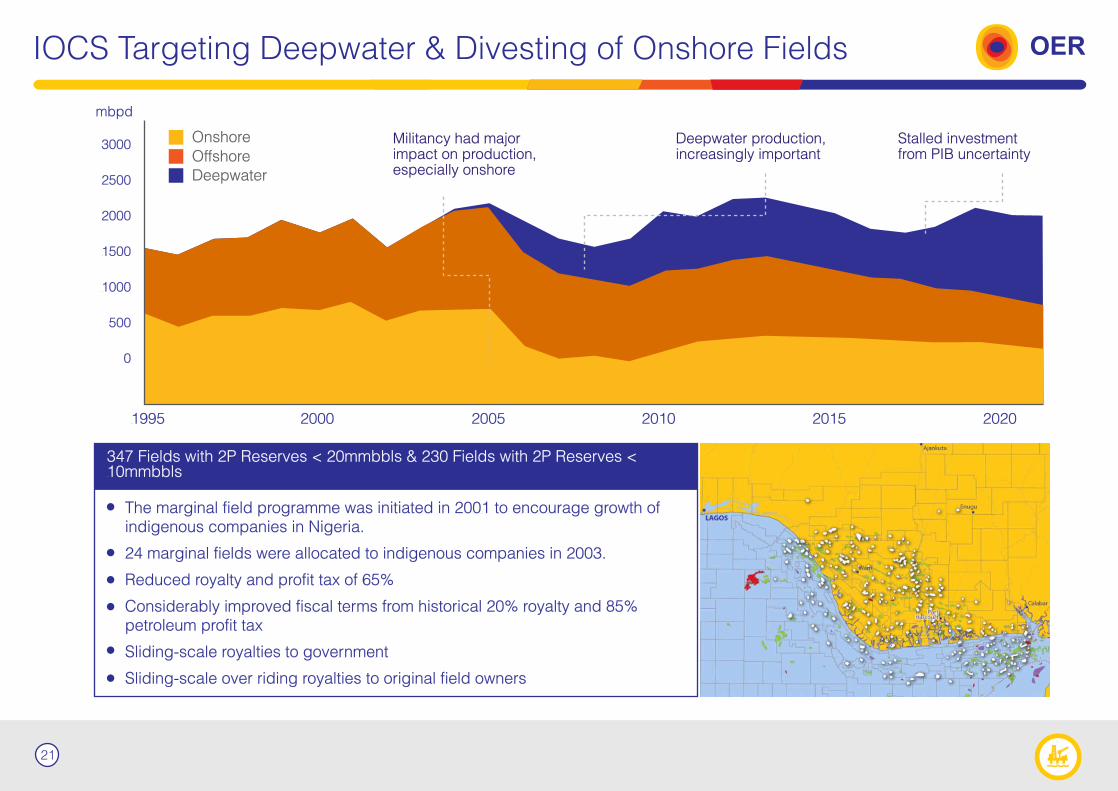
IOCS Targeting Deepwater & Divesting of Onshore Fields
3000
2500
2000
1500
1000
500
0
1995 2000 2005 2010 2015 2020
Militancy had major impact on production, especially onshore
Deepwater production, increasingly important
Stalled investment from PIB uncertainty
The marginal field programme was initiated in 2001 to encourage growth of indigenous companies in Nigeria.
24 marginal fields were allocated to indigenous companies in 2003.
Reduced royalty and profit tax of 65%
Considerably improved fiscal terms from historical 20% royalty and 85% petroleum profit tax
Sliding-scale royalties to government
Sliding-scale over riding royalties to original field owners
Onshore
OffshoreDeepwater
347 Fields with 2P Reserves < 20mmbbls & 230 Fields with 2P Reserves < 10mmbbls
mbpd
OER
21
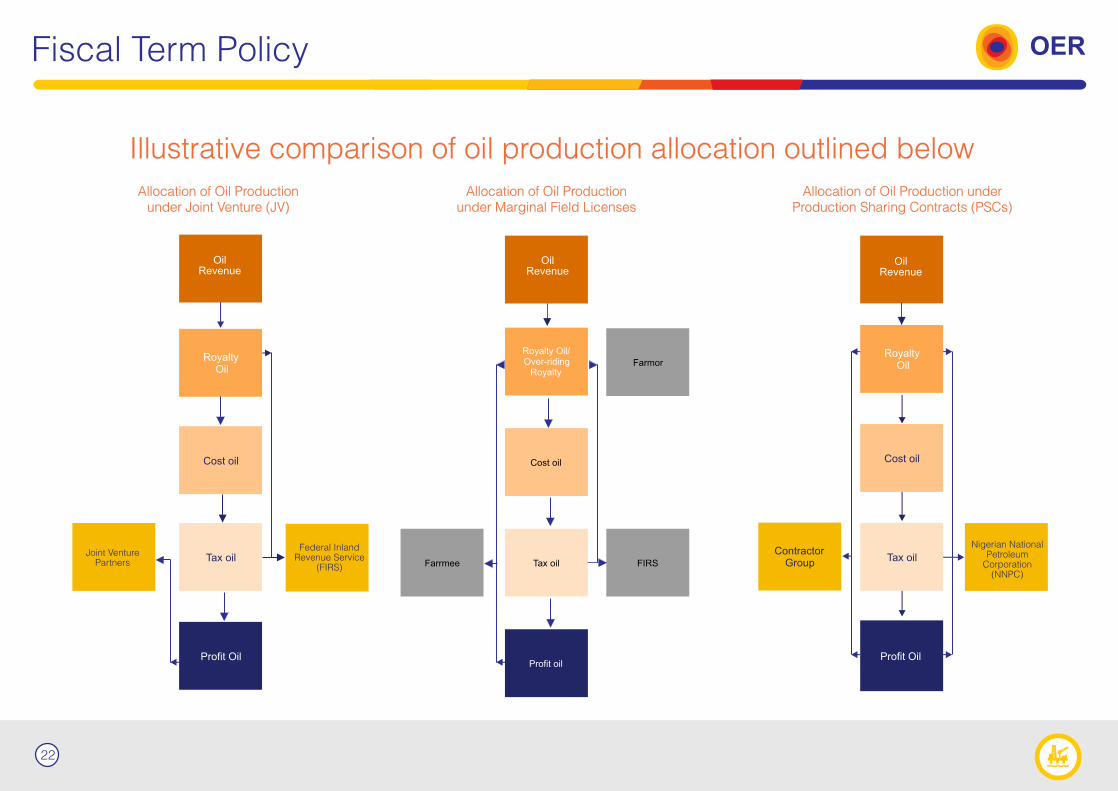
Illustrative comparison of oil production allocation outlined below
Fiscal Term Policy OER
22
Allocation of Oil Production under Joint Venture (JV)
Allocation of Oil Production under Marginal Field Licenses
Allocation of Oil Production under Production Sharing Contracts (PSCs)
Oil Revenue
Oil Revenue
Oil Revenue
Federal InlandRevenue Service
(FIRS)
Nigerian NationalPetroleum
Corporation(NNPC)
Joint VenturePartners
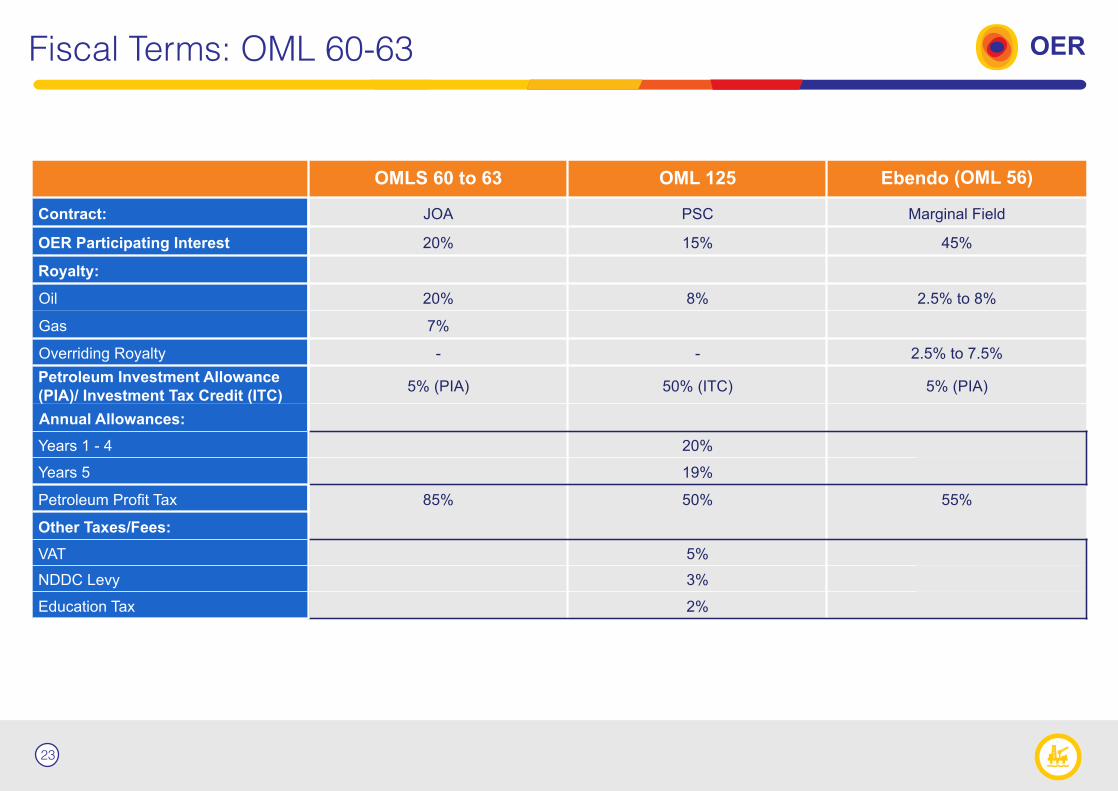
Fiscal Terms: OML 60-63 OER
23
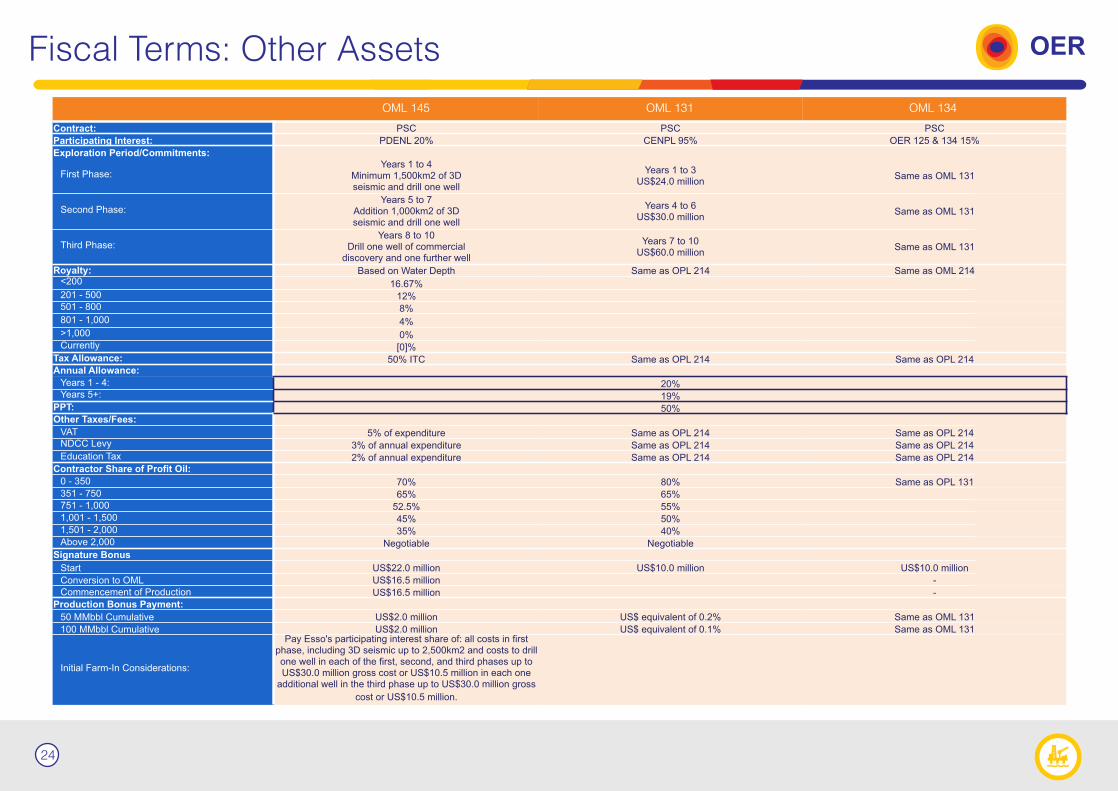
Fiscal Terms: Other Assets OER
OML 145 OML 131 OML 134
24
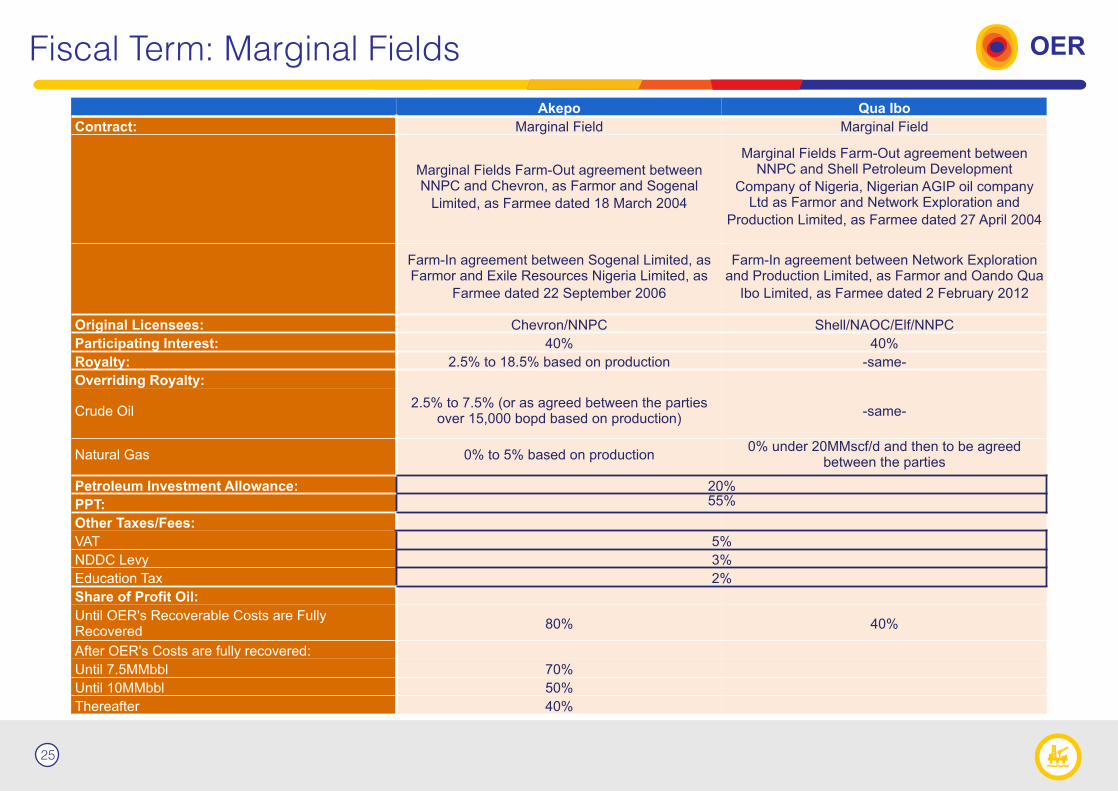
Fiscal Term: Marginal Fields OER
25
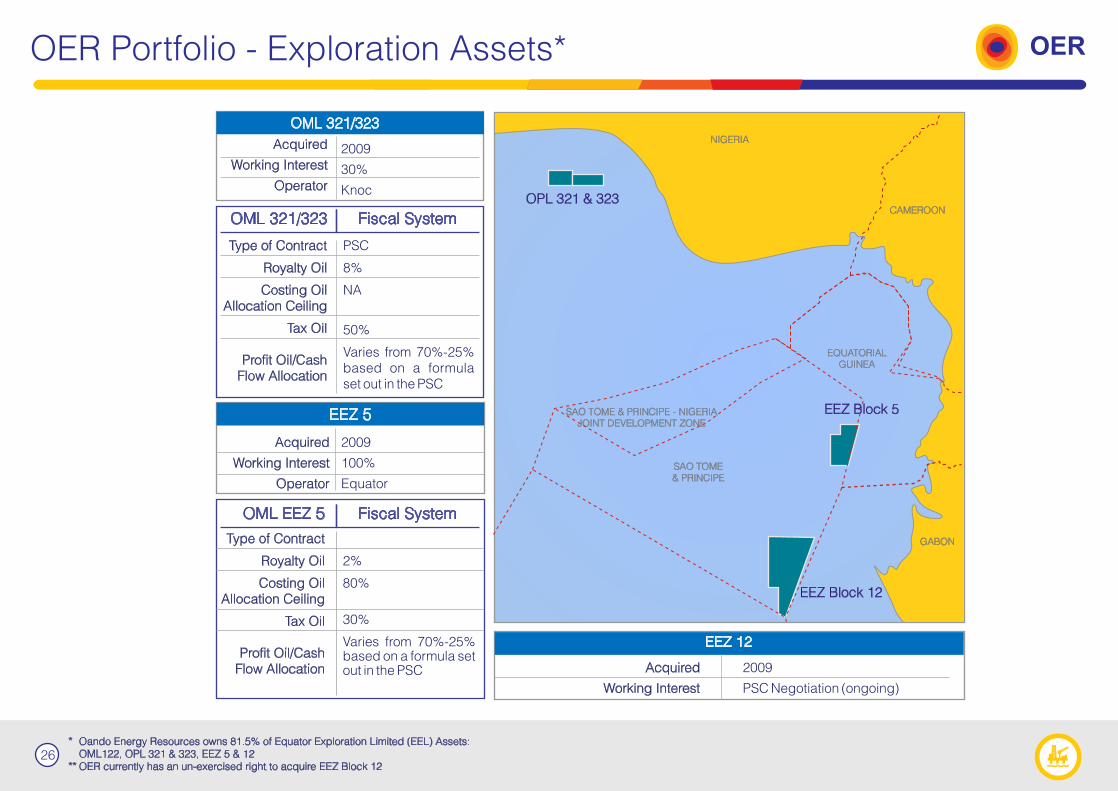
OER Portfolio - Exploration Assets* OER
26
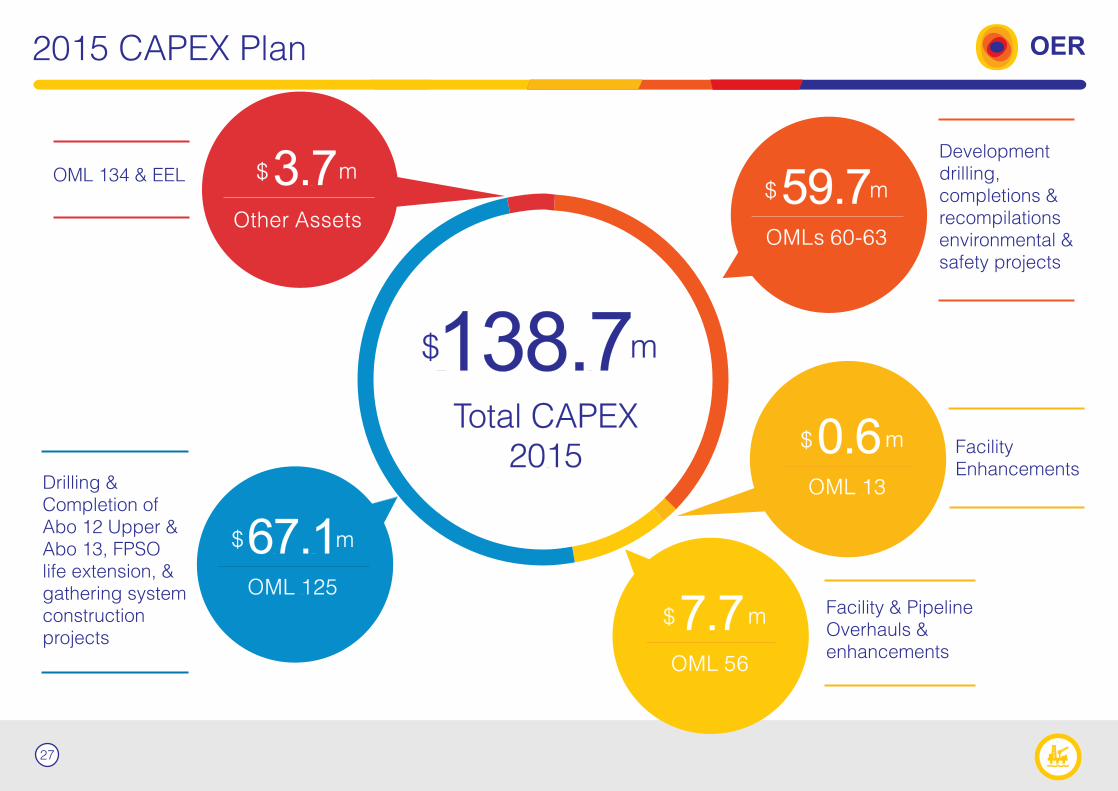
2015 CAPEX Plan OER
27
138.7m
Total CAPEX2015
$
59.7m$
OMLs 60-63
Development drilling, completions & recompilations environmental & safety projects
7.7m$
OML 56
Facility & Pipeline Overhauls & enhancements
0.6m$
OML 13
Facility Enhancements
67.1m$
OML 125
Drilling & Completion of Abo 12 Upper & Abo 13, FPSO life extension, & gathering system construction projects
3.7m$
Other Assets
OML 134 & EEL
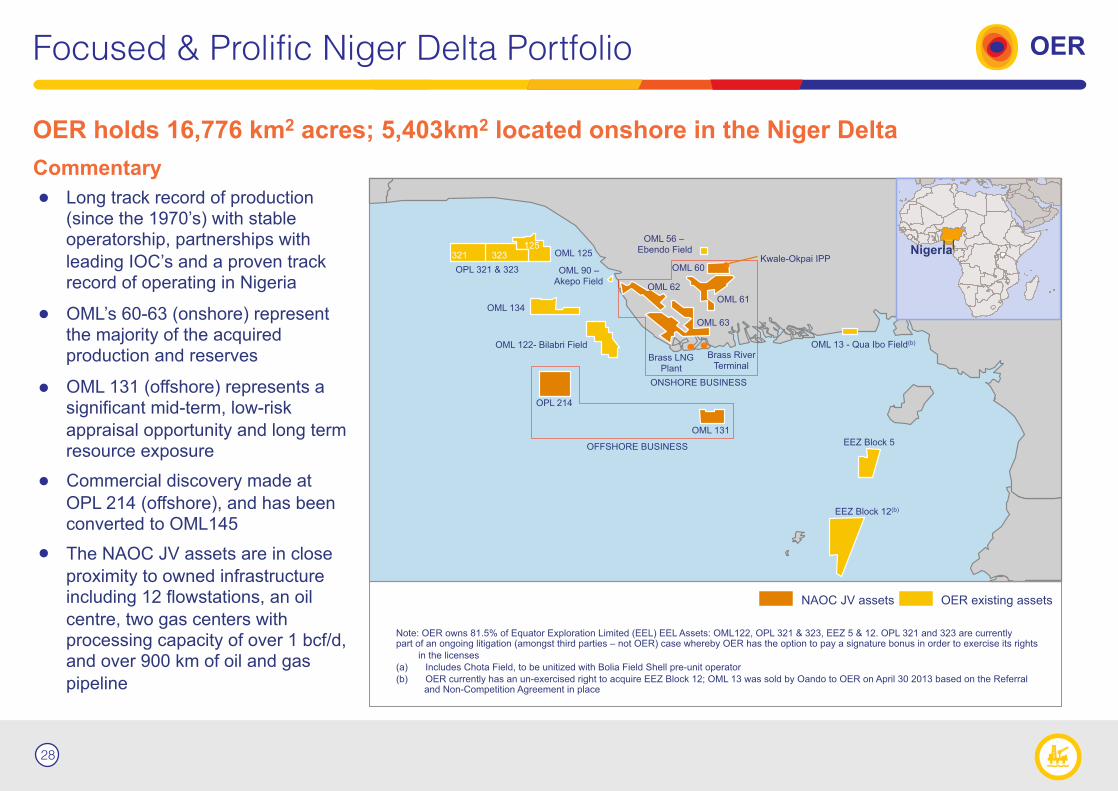
Focused & Prolific Niger Delta Portfolio OER
28
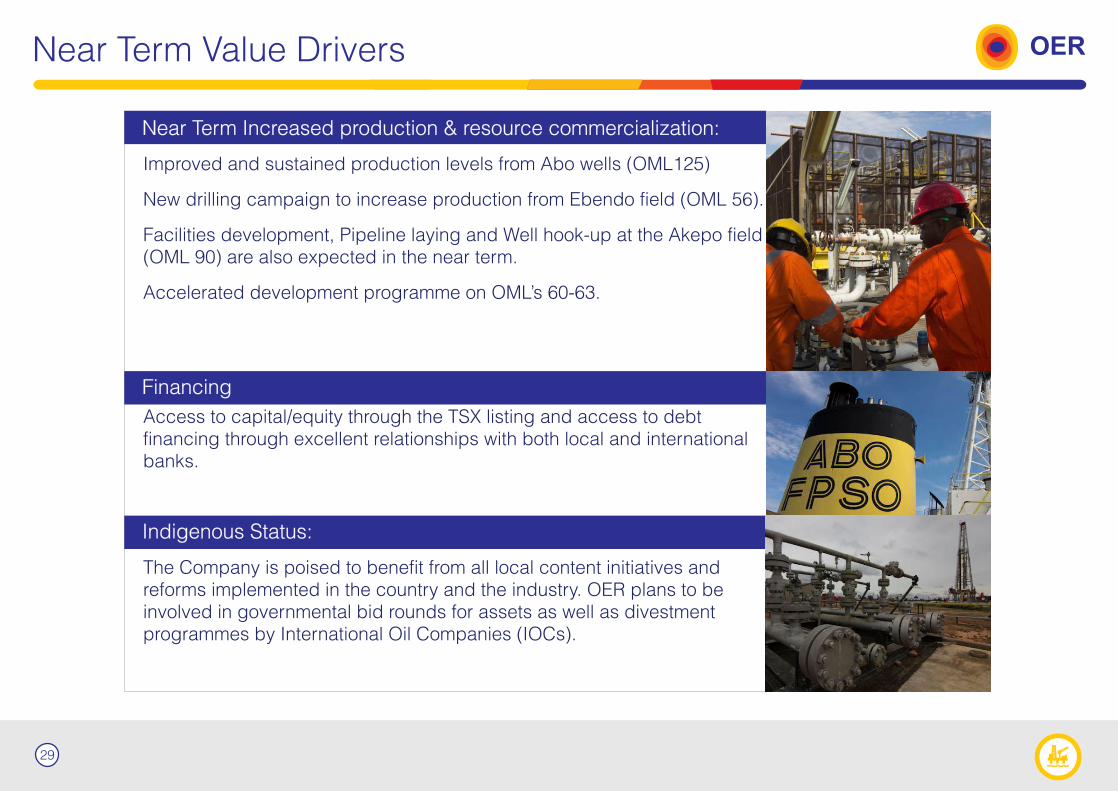
Improved and sustained production levels from Abo wells (OML125)
New drilling campaign to increase production from Ebendo field (OML 56).
Facilities development, Pipeline laying and Well hook-up at the Akepo field (OML 90) are also expected in the near term.
Accelerated development programme on OML’s 60-63.
Access to capital/equity through the TSX listing and access to debt financing through excellent relationships with both local and international banks.
The Company is poised to benefit from all local content initiatives and reforms implemented in the country and the industry. OER plans to be involved in governmental bid rounds for assets as well as divestment programmes by International Oil Companies (IOCs).
Indigenous Status:
Financing
Near Term Increased production & resource commercialization:
OER
29
Near Term Value Drivers
Extensive, Owned Infrastructure OER
30
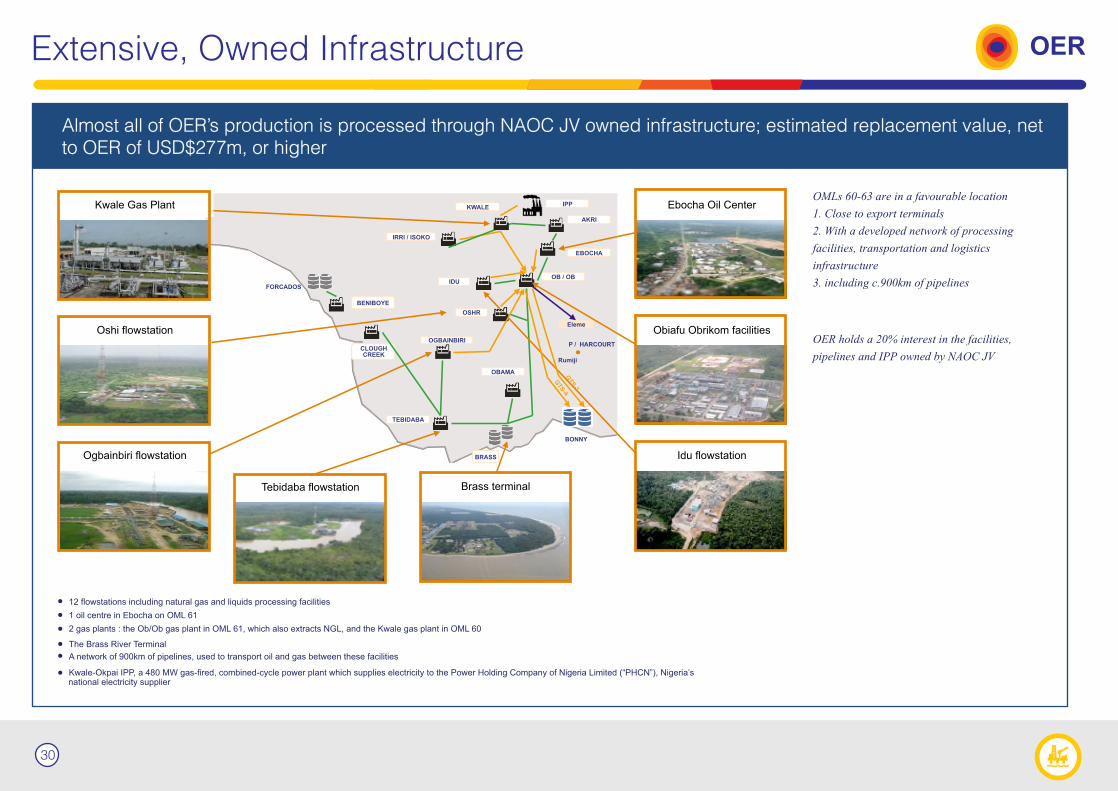
Almost all of OER’s production is processed through NAOC JV owned infrastructure; estimated replacement value, net to OER of USD$277m, or higher
OER holds a 20% interest in the facilities, pipelines and IPP owned by NAOC JV
OMLs 60-63 are in a favourable location1. Close to export terminals2. With a developed network of processing facilities, transportation and logistics infrastructure3. including c.900km of pipelines

Future Growth Opportunities OER
31
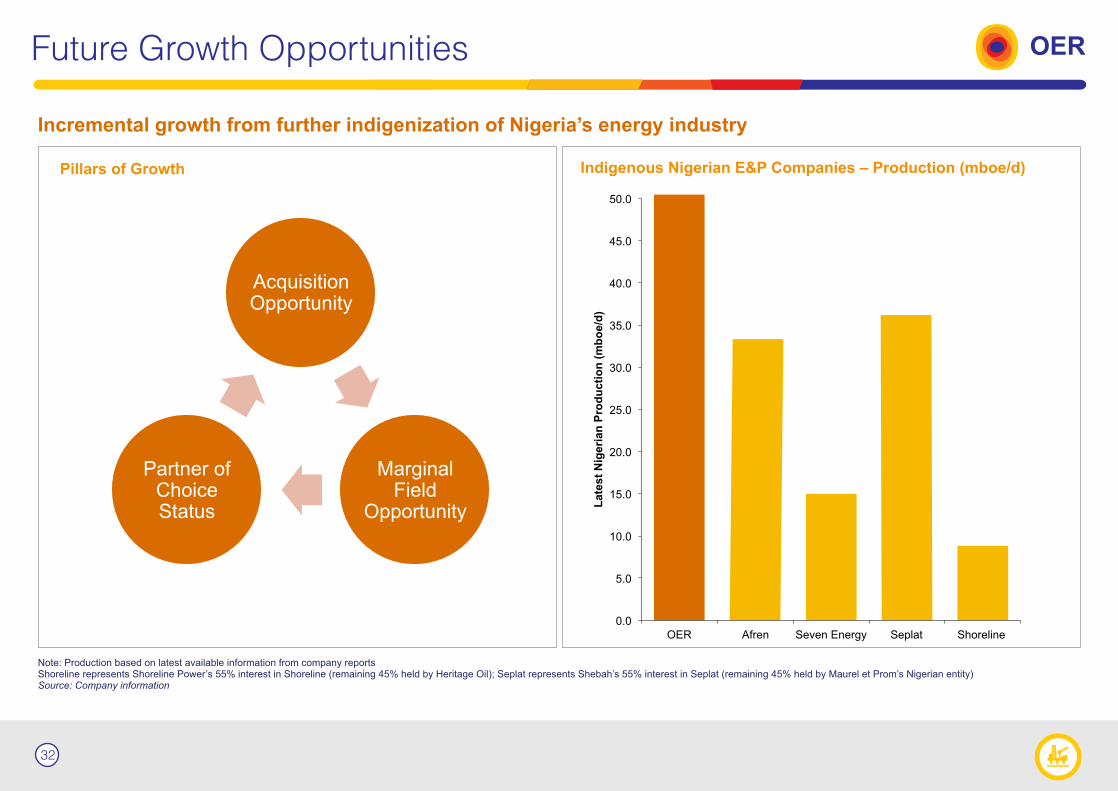
Future Growth Opportunities OER
32
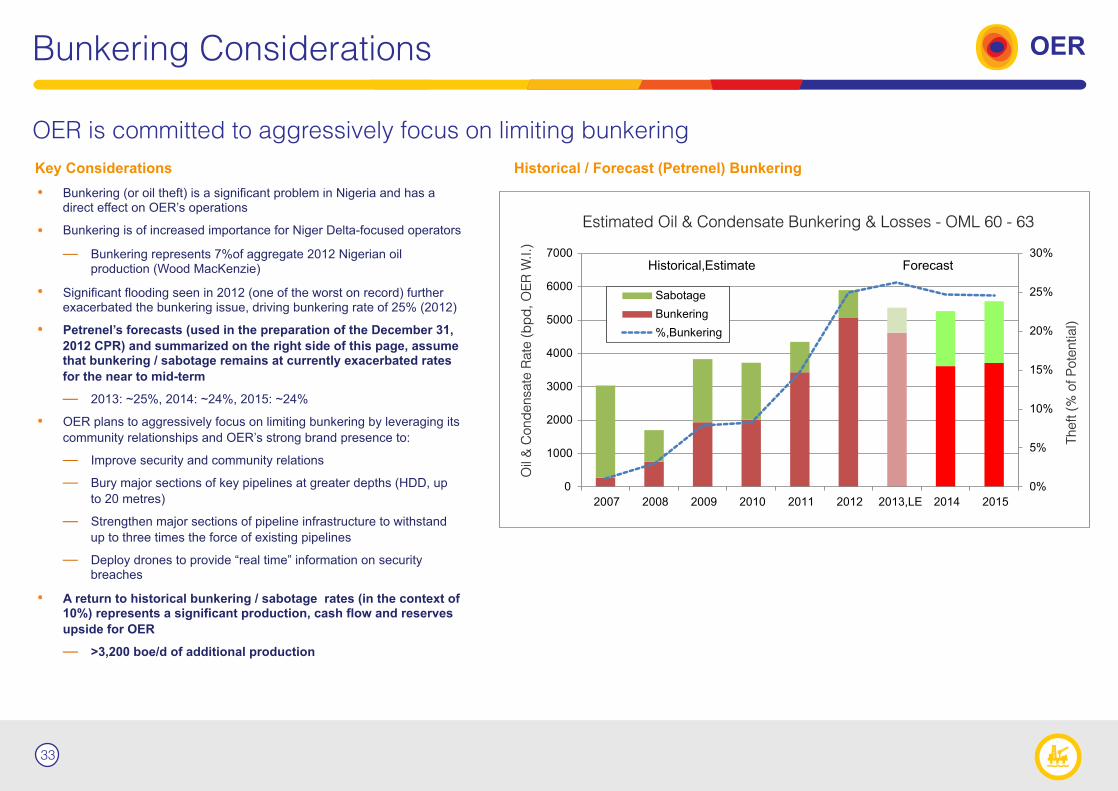
OER is committed to aggressively focus on limiting bunkering
Bunkering Considerations OER
33
Estimated Oil & Condensate Bunkering & Losses - OML 60 - 63
Oil
& C
ond
ensa
te R
ate
(b
pd
, O
ER
W.I.)
Theft (
% o
f P
ote
ntia
l)
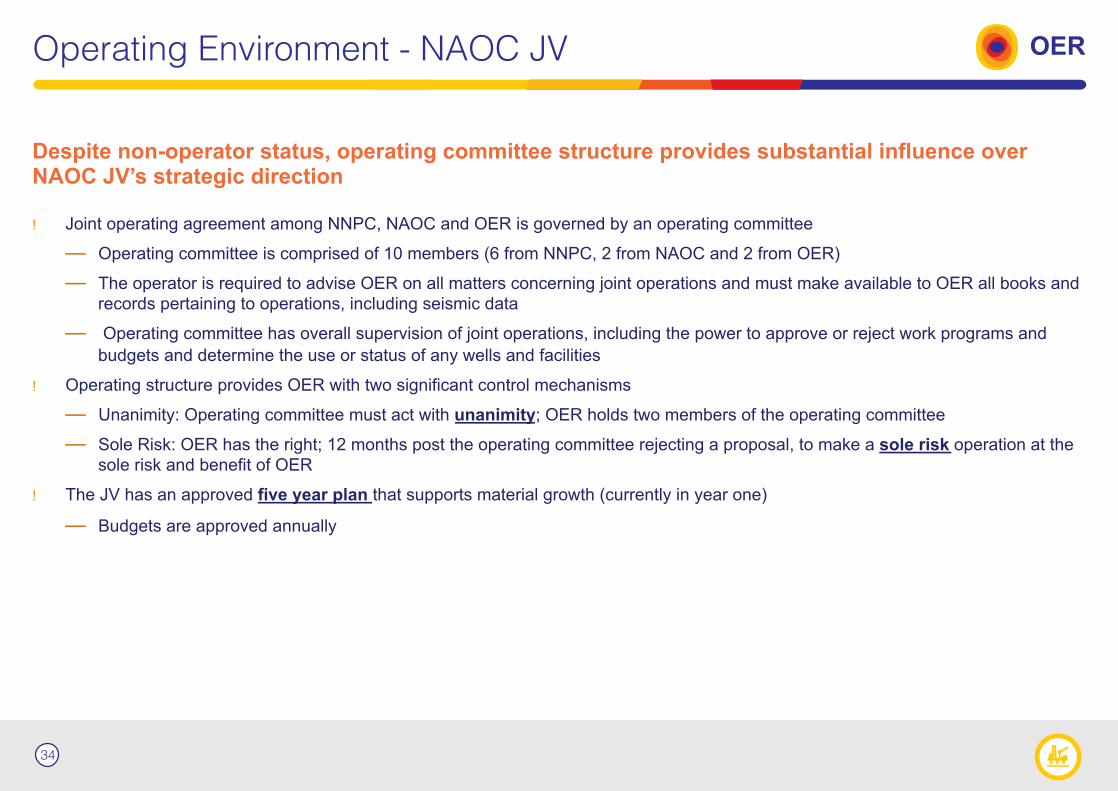
Operating Environment - NAOC JV OER
34
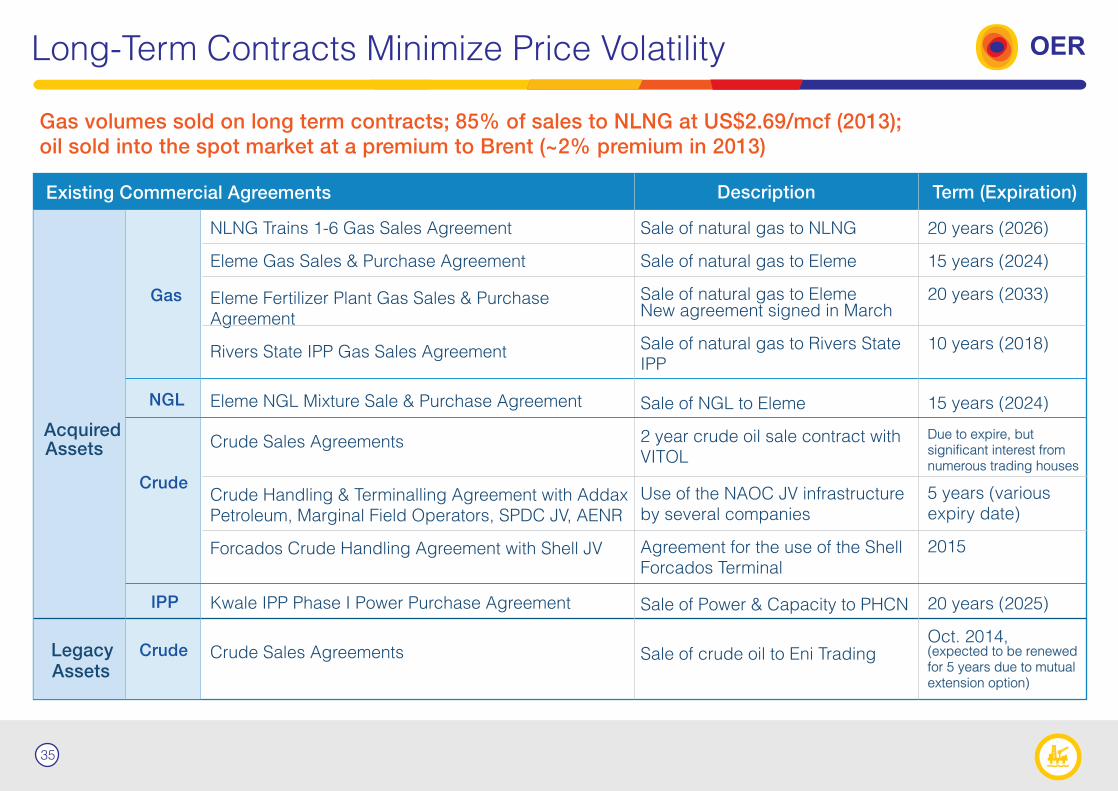
Long-Term Contracts Minimize Price Volatility OER
Existing Commercial Agreements Description Term (Expiration)
NLNG Trains 1-6 Gas Sales Agreement
Eleme Gas Sales & Purchase Agreement
Eleme Fertilizer Plant Gas Sales & Purchase Agreement
Rivers State IPP Gas Sales Agreement
Eleme NGL Mixture Sale & Purchase Agreement
Crude Sales Agreements
Crude Handling & Terminalling Agreement with Addax Petroleum, Marginal Field Operators, SPDC JV, AENR
Forcados Crude Handling Agreement with Shell JV
Kwale IPP Phase I Power Purchase Agreement
Crude Sales Agreements
Gas
NGL
AcquiredAssets
Crude
Legacy Crude
IPP
Existing Commercial Agreements
Sale of natural gas to NLNG
Sale of natural gas to Eleme
Sale of natural gas to ElemeNew agreement signed in March
Sale of natural gas to Rivers State IPP
Sale of NGL to Eleme
2 year crude oil sale contract with VITOL
Use of the NAOC JV infrastructure by several companies
Agreement for the use of the Shell Forcados Terminal
Sale of Power & Capacity to PHCN
Sale of crude oil to Eni Trading
20 years (2026)
15 years (2024)
20 years (2033)
10 years (2018)
15 years (2024)
Due to expire, but significant interest from numerous trading houses
5 years (various expiry date)
2015
20 years (2025)
Oct. 2014, (expected to be renewed for 5 years due to mutual extension option)
Gas volumes sold on long term contracts; 85% of sales to NLNG at US$2.69/mcf (2013); oil sold into the spot market at a premium to Brent (~2% premium in 2013)
35
Assets
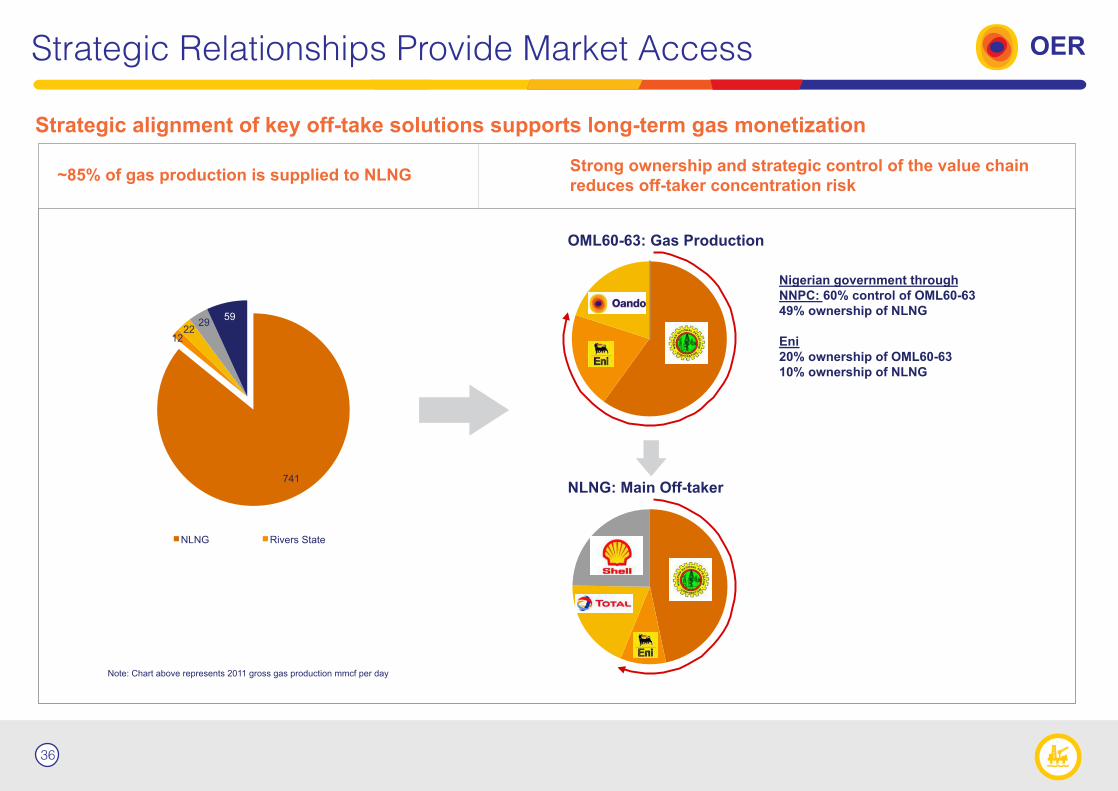
Strategic Relationships Provide Market Access OER
36

Contact OER
Contact Details
Energy Resources
Head, Corporate Development & Investor Relations
+234 (1) [email protected]
Tokunboh Akindele
37