October 8, 2007 NAR Research Market Update. Why Buy Now? Time of “crisis” often turns out to...
34
October 8, 2007 NAR Research Market Update
-
Upload
howard-hubbard -
Category
Documents
-
view
216 -
download
2
Transcript of October 8, 2007 NAR Research Market Update. Why Buy Now? Time of “crisis” often turns out to...

October 8, 2007October 8, 2007
NAR ResearchNAR Research
Market Update Market Update

Why Buy Now?Why Buy Now?• Time of “crisis” often turns out to have been a time of Time of “crisis” often turns out to have been a time of
opportunity in hindsightopportunity in hindsight• Wide selection of housing inventoryWide selection of housing inventory• Favorable mortgage ratesFavorable mortgage rates
• Prime borrowers – low favorable conforming rate loansPrime borrowers – low favorable conforming rate loans• Jumbo borrowers – rates coming down after August Jumbo borrowers – rates coming down after August
credit crunchcredit crunch• Non-prime borrowers – moving away from the risky Non-prime borrowers – moving away from the risky
subprime loans into safer FHA loans (Major reform in subprime loans into safer FHA loans (Major reform in FHA program taking place) FHA program taking place)
• Worst in credit crunch is over – Alan GreenspanWorst in credit crunch is over – Alan Greenspan• More jobs, more income, more wealth --- significant pent-up More jobs, more income, more wealth --- significant pent-up
demand --- buy before others dodemand --- buy before others do• Homeowners in it for the long-term nearly always come out Homeowners in it for the long-term nearly always come out
ahead in building wealth ahead in building wealth

Latest Key DataLatest Key DataIndicatorIndicator Trend from a Trend from a
year agoyear agoCommentComment
Existing Home SalesExisting Home Sales Down 13%Down 13% Impact of August credit Impact of August credit crunchcrunch
Home PriceHome Price Up 0.2%Up 0.2% First increase in 13 monthsFirst increase in 13 months
Single-family Single-family
Housing StartsHousing Starts
Down 27%Down 27% Good news to thin out Good news to thin out inventoryinventory
Existing home Existing home inventoryinventory
Up 19%Up 19% A lot of choices for buyersA lot of choices for buyers
Mortgage RatesMortgage Rates 6.3%6.3% Historically favorableHistorically favorable
Net New JobsNet New Jobs 1.6 million 1.6 million Pent-up demand Pent-up demand accumulatingaccumulating
Aggregate Income Aggregate Income Up 7%Up 7% Plenty of financial Plenty of financial wherewithal wherewithal

Monthly Existing-Home Sales(from 7 million in peak to 5.5 million now)
Monthly Existing-Home Sales(from 7 million in peak to 5.5 million now)
5,000
6,000
7,000
8,000
Source: NARSource: NAR
In thousand units
Peak

Annual Existing-Home Sales and Forecast
(5th best year in 2007 and recovery in 2008)
Annual Existing-Home Sales and Forecast
(5th best year in 2007 and recovery in 2008)
0
2,000
4,000
6,000
8,000
Source: NARSource: NAR
In thousand units

Existing Home Inventory(From 2 million to 4.5 million)
Existing Home Inventory(From 2 million to 4.5 million)
0
1,000,000
2,000,000
3,000,000
4,000,000
5,000,000
Source: NARSource: NAR

New Home Inventory(Already Topped Out)
New Home Inventory(Already Topped Out)
200,000
300,000
400,000
500,000
600,000
Source: CensusSource: Census

Single-Family Housing Starts(Major fall – but, good trend to control inventory)
Single-Family Housing Starts(Major fall – but, good trend to control inventory)
0
500
1,000
1,500
2,000
Source: CensusSource: Census

Home Price Change(1st rise in 13 months)
Home Price Change(1st rise in 13 months)
-6
-3
0
3
6
9
12
15
18
Source: NARSource: NAR

Home Price Change in the Northeast
(First region to undergo a slump – but now already into a respectable recovery)
Home Price Change in the Northeast
(First region to undergo a slump – but now already into a respectable recovery)
-5
0
5
10
15
20
25
Source: NARSource: NAR
Positive Gains
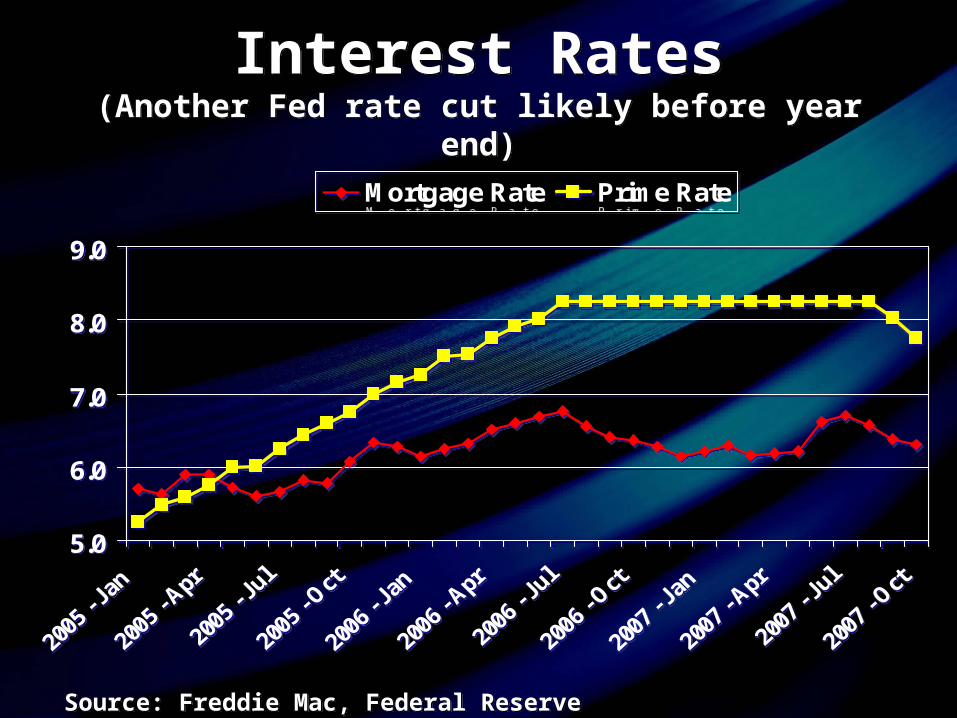
Interest Rates(Another Fed rate cut likely before year end)
Interest Rates(Another Fed rate cut likely before year end)
5.0
6.0
7.0
8.0
9.0
Mortgage Rate Prime Rate
5.0
6.0
7.0
8.0
9.0
Mortgage Rate Prime Rate
Source: Freddie Mac, Federal ReserveSource: Freddie Mac, Federal Reserve

Jumbo Loan Rate Spread(August panic over – but still not back to norm)
Jumbo Loan Rate Spread(August panic over – but still not back to norm)
0.0
25.0
50.0
75.0
100.0
1/5/
2007
1/19
/200
7
2/2/
2007
2/16
/200
7
3/2/
2007
3/16
/200
7
3/30
/200
7
4/13
/200
7
4/27
/200
7
5/11
/200
7
5/25
/200
7
6/8/
2007
6/22
/200
7
7/6/
2007
7/20
/200
7
8/3/
2007
8/17
/200
7
8/31
/200
7
9/14
/200
7
9/28
/200
7
0.0
25.0
50.0
75.0
100.0
1/5/
2007
1/19
/200
7
2/2/
2007
2/16
/200
7
3/2/
2007
3/16
/200
7
3/30
/200
7
4/13
/200
7
4/27
/200
7
5/11
/200
7
5/25
/200
7
6/8/
2007
6/22
/200
7
7/6/
2007
7/20
/200
7
8/3/
2007
8/17
/200
7
8/31
/200
7
9/14
/200
7
9/28
/200
7
Source: Freddie MacSource: Freddie Mac
Basis Points

U.S. Job Gains- Less Strong(Still 4 million new jobs in past 24 months – time period when sales were falling …. points to Accumulating pent-up demand)
U.S. Job Gains- Less Strong(Still 4 million new jobs in past 24 months – time period when sales were falling …. points to Accumulating pent-up demand)
-3
-2
-1
0
1
2
3
4
Source: BLSSource: BLS
12-month payroll job changes in millions

Resetting Mortgage BurdenResetting Mortgage Burden• There are $450 billion in resetting mortgages over the There are $450 billion in resetting mortgages over the
next 12 months (about 2 million loans)next 12 months (about 2 million loans) – If all reset (without any refis) to rates 4 to 5 percentage If all reset (without any refis) to rates 4 to 5 percentage
points higher, then $18 to $22 billion in additional mortgage points higher, then $18 to $22 billion in additional mortgage paymentspayments
– About 10% to 20% (worst case scenario) of subprimes will About 10% to 20% (worst case scenario) of subprimes will default … 200,000 to 400,000 additional inventory default … 200,000 to 400,000 additional inventory
• Personal Income (aggregate) to rise by $700 billion in Personal Income (aggregate) to rise by $700 billion in 20072007
• Resets are burdensome and will raise foreclosures. Resets are burdensome and will raise foreclosures. But the impact to the economy is small in relation to But the impact to the economy is small in relation to the positive income gains ... and the impact on the positive income gains ... and the impact on overall inventory is about 5% to 10% to the current overall inventory is about 5% to 10% to the current inventory.inventory.
• There are $450 billion in resetting mortgages over the There are $450 billion in resetting mortgages over the next 12 months (about 2 million loans)next 12 months (about 2 million loans)
– If all reset (without any refis) to rates 4 to 5 percentage If all reset (without any refis) to rates 4 to 5 percentage points higher, then $18 to $22 billion in additional mortgage points higher, then $18 to $22 billion in additional mortgage paymentspayments
– About 10% to 20% (worst case scenario) of subprimes will About 10% to 20% (worst case scenario) of subprimes will default … 200,000 to 400,000 additional inventory default … 200,000 to 400,000 additional inventory
• Personal Income (aggregate) to rise by $700 billion in Personal Income (aggregate) to rise by $700 billion in 20072007
• Resets are burdensome and will raise foreclosures. Resets are burdensome and will raise foreclosures. But the impact to the economy is small in relation to But the impact to the economy is small in relation to the positive income gains ... and the impact on the positive income gains ... and the impact on overall inventory is about 5% to 10% to the current overall inventory is about 5% to 10% to the current inventory.inventory.

Bottom LineBottom Line• Home sales weak and growing inventoryHome sales weak and growing inventory• The national median home price – interestingly - The national median home price – interestingly -
remains flat remains flat • Local price trends vary – Northeast showing good Local price trends vary – Northeast showing good
appreciationappreciation– Seattle, Austin, Raleigh, and 2/3 of the country Seattle, Austin, Raleigh, and 2/3 of the country
with price gainswith price gains• Job gains evidently supporting pricesJob gains evidently supporting prices• Plenty of wealth -- solid income gains and record Plenty of wealth -- solid income gains and record
high stock markethigh stock market• Pent-up demand accumulatingPent-up demand accumulating• Few more months of “bad” press coverageFew more months of “bad” press coverage• Media coverage to become positive in 2008Media coverage to become positive in 2008• Forecast: 2008 will be better than 2007; 2009 to Forecast: 2008 will be better than 2007; 2009 to
improve furtherimprove further
• Home sales weak and growing inventoryHome sales weak and growing inventory• The national median home price – interestingly - The national median home price – interestingly -
remains flat remains flat • Local price trends vary – Northeast showing good Local price trends vary – Northeast showing good
appreciationappreciation– Seattle, Austin, Raleigh, and 2/3 of the country Seattle, Austin, Raleigh, and 2/3 of the country
with price gainswith price gains• Job gains evidently supporting pricesJob gains evidently supporting prices• Plenty of wealth -- solid income gains and record Plenty of wealth -- solid income gains and record
high stock markethigh stock market• Pent-up demand accumulatingPent-up demand accumulating• Few more months of “bad” press coverageFew more months of “bad” press coverage• Media coverage to become positive in 2008Media coverage to become positive in 2008• Forecast: 2008 will be better than 2007; 2009 to Forecast: 2008 will be better than 2007; 2009 to
improve furtherimprove further

Consumer MessagesConsumer Messages

Something appears Out of Whack!(If viewing solely by home price and income, but … next page)
Something appears Out of Whack!(If viewing solely by home price and income, but … next page)
50
100
150
200
250
Income Home Price
50
100
150
200
250
Income Home Price
Income and Price set to Index of 100 in 1990
Source: NAR

Rates: Near 45-Year Lows(Low rate permit people to take out a larger loan with less burden)
Rates: Near 45-Year Lows(Low rate permit people to take out a larger loan with less burden)
Source: Freddie MacSource: Freddie Mac
1970s9% average
1980s13% average
1990s8% average
2000s6.5% average

Mortgage Obligation to Income(better indicator of to assess “bubble” and it is not out of whack)
Manageable and not out of Whack
Mortgage Obligation to Income(better indicator of to assess “bubble” and it is not out of whack)
Manageable and not out of Whack
10
15
20
25
30
1990
- Ja
n
1991
- Ja
n
1992
- Ja
n
1993
- Ja
n
1994
- Ja
n
1995
- Ja
n
1996
- Ja
n
1997
- Ja
n
1998
- Ja
n
1999
- Ja
n
2000
- Ja
n
2001
- Ja
n
2002
- Ja
n
2003
- Ja
n
2004
- Ja
n
2005
- Ja
n
2006
- Ja
n
2007
- Ja
n
U.S. Average
Source: NAR
%

Apartment Rents(Rising rents force some renters to about ownership)
Apartment Rents(Rising rents force some renters to about ownership)
-2.0%
-1.0%
0.0%
1.0%
2.0%
3.0%
4.0%
5.0%
Rent Growth
Source: Torto-Wheaton ResearchSource: Torto-Wheaton Research
%

Subprime Loan Exposure(subprime makes up less than 10% of homeowners)
Subprime Loan Exposure(subprime makes up less than 10% of homeowners)
Prime50%
FHA+VA6%Sub-
prime9%
Free + Clear
Homes35%
Source: NAR Estimate

Foreclosed Homes(less than 10% of subprime owners make up more than ½ of
foreclosures)
Foreclosed Homes(less than 10% of subprime owners make up more than ½ of
foreclosures)
Prime
33%
FHA+
VA
14%
Sub-
prime
53%
Source: NAR Estimate

0.0
2.0
4.0
6.0
8.0
10.0
Prime VA FHA Sub-primeFixed
Sub-primeARM
0.0
2.0
4.0
6.0
8.0
10.0
Prime VA FHA Sub-primeFixed
Sub-primeARM
Foreclosure Rates by Loan Type 2007 Q2
(Problem is principally the resetting subprime loans)
Foreclosure Rates by Loan Type 2007 Q2
(Problem is principally the resetting subprime loans)
Data: MBA

0%
20%
40%
60%
Prime VA FHA Sub-prime
0%
20%
40%
60%
Prime VA FHA Sub-prime
Foreclosure Probability once becoming Delinquent
(Latest Foreclosure/Delinquency ratio)
Foreclosure Probability once becoming Delinquent
(Latest Foreclosure/Delinquency ratio)
Better Loss Mitigation Programs for VA and FHA

FHA Loan ImpactFHA Loan Impact
• FHA had been the choice for first-time FHA had been the choice for first-time homebuyers and for those with blemished homebuyers and for those with blemished credit in the pastcredit in the past
• FHA dramatically lost market share to FHA dramatically lost market share to subprime loans in the past 5 yearssubprime loans in the past 5 years
• FHA interest rates are much more favorable FHA interest rates are much more favorable than APR of subprime loans (after than APR of subprime loans (after considering resets)considering resets)
• Major FHA reform will better help first time Major FHA reform will better help first time homebuyers to enter the market homebuyers to enter the market

FHA Market Share for Home PurchaseFHA Market Share for Home Purchase
0%
5%
10%
15%
20%
2000 2001 2002 2003 2004 2005 2006 2007 est.
2008forecast
2009forecast
Source: HMDA,NAR estimate

U.S. Job Gains(Still 4 million new jobs in past 24 months – time period when sales were falling …. points to Accumulating pent-up demand)
U.S. Job Gains(Still 4 million new jobs in past 24 months – time period when sales were falling …. points to Accumulating pent-up demand)
-3
-2
-1
0
1
2
3
4
Source: BLSSource: BLS
12-month payroll job changes in millions
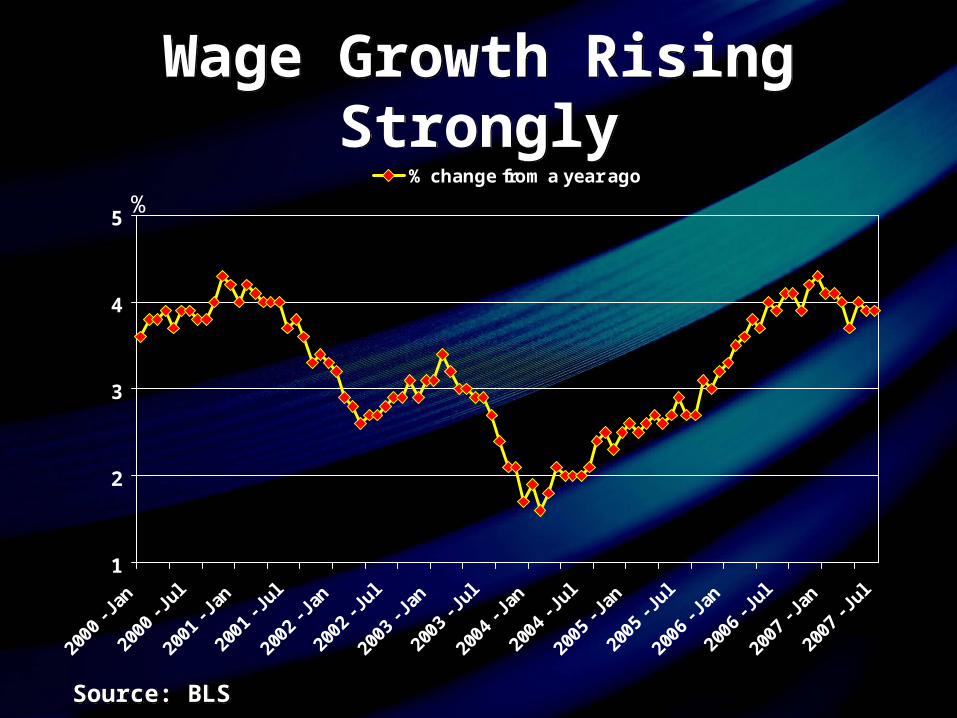
Wage Growth Rising StronglyWage Growth Rising Strongly
1
2
3
4
5
2000
- Ja
n
2000
- Ju
l
2001
- Ja
n
2001
- Ju
l
2002
- Ja
n
2002
- Ju
l
2003
- Ja
n
2003
- Ju
l
2004
- Ja
n
2004
- Ju
l
2005
- Ja
n
2005
- Ju
l
2006
- Ja
n
2006
- Ju
l
2007
- Ja
n
2007
- Ju
l
% change from a year ago
%
Source: BLSSource: BLS

Total U.S. Wages and Salary Disbursement Rising StronglyTotal U.S. Wages and Salary
Disbursement Rising Strongly
4,000
5,000
6,000
7,000
2000
- Q
1
2000
- Q
3
2001
- Q
1
2001
- Q
3
2002
- Q
1
2002
- Q
3
2003
- Q
1
2003
- Q
3
2004
- Q
1
2004
- Q
3
2005
- Q
1
2005
- Q
3
2006
- Q
1
2006
- Q
3
2007
- Q
1
Source: BEASource: BEA
$ billion

Corporate Profits – at near Record High
Corporate Profits – at near Record High
500
1,000
1,500
2,000
2000
- Q
1
2000
- Q
3
2001
- Q
1
2001
- Q
3
2002
- Q
1
2002
- Q
3
2003
- Q
1
2003
- Q
3
2004
- Q
1
2004
- Q
3
2005
- Q
1
2005
- Q
3
2006
- Q
1
2006
- Q
3
2007
- Q
1
Source: BEASource: BEA
$ billion

Stock Market at Record HighS&P 500 Index
Stock Market at Record HighS&P 500 Index
800
1000
1200
1400
1600
2000
- Ja
n
2000
- Ju
l
2001
- Ja
n
2001
- Ju
l
2002
- Ja
n
2002
- Ju
l
2003
- Ja
n
2003
- Ju
l
2004
- Ja
n
2004
- Ju
l
2005
- Ja
n
2005
- Ju
l
2006
- Ja
n
2006
- Ju
l
2007
- Ja
n
2007
- Ju
l
Source: NYSESource: NYSE

$0
$50,000
$100,000
$150,000
$200,000
Renter Homeowner
1995 1998 2001 2004
$0
$50,000
$100,000
$150,000
$200,000
Renter Homeowner
1995 1998 2001 2004
Best Evidence:Household Wealth Accumulation
Best Evidence:Household Wealth Accumulation
Source: Federal Reserve
Median Net Worth
$184,400$184,400
$4,000

$10,000 $10,000 $10,000$23,600
$35,200
$110,300
$0
$50,000
$100,000
$150,000
Stock Market(normal market)
Stock Market(bull market)
Homeowner(normal market)
Now 10-years later
$10,000 $10,000 $10,000$23,600
$35,200
$110,300
$0
$50,000
$100,000
$150,000
Stock Market(normal market)
Stock Market(bull market)
Homeowner(normal market)
Now 10-years later
Wealth Accumulation –The Power of Leverage for Homeowners
($10,000 down payment on a $200,000 home)
Wealth Accumulation –The Power of Leverage for Homeowners
($10,000 down payment on a $200,000 home)
10% appreciations 15% appreciations 5% appreciations

Why Buy Now? – Repeat the MantraWhy Buy Now? – Repeat the Mantra
• Time of “crisis” often turns out to have been a time of Time of “crisis” often turns out to have been a time of opportunity in hindsightopportunity in hindsight
• Wide selection of housing inventoryWide selection of housing inventory• Favorable mortgage ratesFavorable mortgage rates
• Prime borrowers – low favorable conforming rate loansPrime borrowers – low favorable conforming rate loans• Jumbo borrowers – rates coming down after August Jumbo borrowers – rates coming down after August
credit crunchcredit crunch• Non-prime borrowers – moving away from the risky Non-prime borrowers – moving away from the risky
subprime loans into safer FHA loans (Major reform in subprime loans into safer FHA loans (Major reform in FHA program taking place) FHA program taking place)
• Worst in credit crunch is over – Alan GreenspanWorst in credit crunch is over – Alan Greenspan• More jobs, more income, more wealth --- significant pent-up More jobs, more income, more wealth --- significant pent-up
demand --- buy before others dodemand --- buy before others do• Homeowners in it for the long-term nearly always come out Homeowners in it for the long-term nearly always come out
ahead in building wealth ahead in building wealth