

October 3rd, 2021
20
NORTH AMERICAN TRACKER October 3 rd , 2021 E D I T I O N
Transcript of October 3rd, 2021
N O R T H A M E R I C A N T R A C K E R
October 3rd, 2021E D I T I O N

METHODOLOGICAL APPROACH
2
METHODOLOGY
Leger, the largest Canadian-owned polling and marketing research firm, in collaborationwith The Canadian Press, conducted this web survey with a representative sample of 1,537Canadians and 1,001 Americans, over the age of 18, selected from LEO’s (Leger Opinion)representative panel. The questionnaire consisted of 25 questions and was completed in 10minutes on average. Data collection took place from September 24th, 2021, to September26th, 2021, via Computer-Assisted Web Interviewing technology (CAWI).
Using 2016 Census reference variables, the Canadian data was then analyzed and weightedby our statisticians according to gender, age, mother tongue, region, education level, andpresence of children in households in order to render a representative sample of the generalpopulation. Using 2010 U.S. Census reference variables, the American data was thenanalyzed and weighted by our statisticians according to gender, age, region, race/ethnicity,household size and education level in order to render a representative sample of the generalpopulation.

METHODOLOGICAL APPROACH
3
METHODOLOGY
The LEO (Leger Opinion) panel is the largest Canadian panel with over 400,000 representativepanelists from all regions of Canada. LEO was created by Leger based on a representativeCanadian sample of Canadian citizens with Internet access.
LEO's panelists were randomly selected (RDD) through Leger's call centre, panelists frommore hard-to-reach target groups were also added to the panel throughtargeted recruitment campaigns. The double opt-in selection process, a model to detectfraud and the renewal of 25% of the panel each year ensures complete respondent quality.To ensure a higher response rate and reach people on their mobile devices, Leger has alsodeveloped a high-performance Apple and Android application.
In fact, Leger is the only Canadian research firm offering both the number and quality ofpanelists. Most competing polling firms in Canada and the United States also use the LEOpanel.

METHODOLOGICAL APPROACH
4
METHODOLOGY
A margin of error cannot be associated with a non-probability sample in a panel survey. Forcomparison purposes, a probability sample of this size would have a margin of error ±2.5%,19 times out of 20 for the Canadian sample and of ±3.097%, 19 times out of 20 for theAmerican sample. The results presented in this study comply with the public opinionresearch standards and disclosure requirements of CRIC (the Canadian Research and InsightsCouncil) and the global ESOMAR network. Leger is a founding member of CRIC and is activelyinvolved in raising quality standards in the survey industry. President Jean-Marc Léger is amember of the CRIC’s Board of Directors and the Canadian representative of ESOMAR.

METHODOLOGICAL APPROACH
5
METHODOLOGY
2021 CANADIANFEDERAL ELECTION
LEGER SURVEYPublished in Le Journal de Montréal and The
National Post/PostmediaSeptember 18, 2021
33% 32% 19% 7% 6% 2%
33.7% 32.6% 17.8% 7.7% 5.0% 2.3%OFFICIAL RESULTS2021 Canadian Federal Election
Leger is the polling firm that has presented the most accurate data, on average, over the last ten years inCanada. During the last federal election in 2021, Leger was once again the most accurate firm in the country.This accuracy is attributed to the quality of the LEO panel and rigorous application of methodological rules byLeger's 600 employees, including 200 professionals in Leger's eight offices across Canada (Montreal, Toronto,Quebec City, Winnipeg, Calgary, Edmonton and Vancouver) and in the United States (Philadelphia).
Poll aggregator 338Canada.com gave Leger the highest rating among all polling firms in Canada for the accuracyof its studies. See https://338canada.com/pollster-ratings.htm
NOTES ON READING THIS REPORT
6
METHODOLOGY
The numbers presented have been rounded. However, the numbers before rounding wereused to calculate the sums presented and might therefore not correspond to the manualaddition of these numbers.
In this report, data in bold red characters indicates a significantly lower proportion than thatof other respondents. Conversely, data in bold green characters indicates a significantlyhigher proportion that that of other respondents.
A more detailed methodology is presented in the appendix.
If you have questions about the data presented in this report, please contact ChristianBourque, Associate and Executive Vice-President at the following e-mailaddress: [email protected] or Jack Jedwab, President & CEO of the Association forCanadian Studies: [email protected].
For any questions related to our services, or to request an interview, please contact usby clicking here.

JOE BIDEN AND KAMALA HARRIS' APPROVAL RATING

8
CTC631T. Overall, do you approve or disapprove of the way Joe Biden is handling his job as president?
In the event a respondent had no opinion, the following prompting question was asked: Even if you have not yet made up your mind, do you tend to approve or disapprove the way Joe Biden is handling his job as president?
Base: All respondents (n=1,001)
BIDEN’S APPROVAL RATING (1/2)
Am
eri
can
Su
rve
y
46%52%
2%
Approve Disapprove Unsure

9
CTC631T. Overall, do you approve or disapprove of the way Joe Biden is handling his job as president?
In the event a respondent had no opinion, the following prompting question was asked: Even if you have not yet made up your mind, do you tend to approve or disapprove the way Joe Biden is handling his job as president?
Base: All respondents
BIDEN’S APPROVAL RATING (2/2)
Am
eri
can
Su
rve
y
TOTALUSA
North-East
Mid-West
South West 18-34 35-54 55+ Male FemaleVoted
forTrump
Voted for
Biden
Voted for
other
TOTAL Sept. 13th
Gap
Weighted n= 1,001 179 217 371 233 271 363 366 485 516 371 403 16 1,002
Unweighted n= 1,001 197 194 364 246 194 354 453 489 512 339 448 37 1,002
Approve 46% 49% 46% 41% 51% 49% 48% 42% 47% 45% 11% 82% 26% 48% -2
Disapprove 52% 48% 51% 58% 48% 50% 50% 56% 52% 52% 89% 17% 74% 50% +2
Unsure 2% 3% 3% 1% 1% 1% 2% 2% 1% 3% 0% 0% 0% 3% -1

10
CTC632T. Overall, do you approve or disapprove of the way Kamala Harris is handling her job as vice president?
In the event a respondent had no opinion, the following prompting question was asked: Even if you have not yet made up your mind, do you tend to approve or disapprove the way Kamala Harris is handling her job as vice president?
Base: All respondents (n=1,001)
HARRIS’ APPROVAL RATING (1/2)
Am
eri
can
Su
rve
y
43%
54%
3%
Approve Disapprove Unsure

11
CTC632T. Overall, do you approve or disapprove of the way Kamala Harris is handling her job as vice president?
In the event a respondent had no opinion, the following prompting question was asked: Even if you have not yet made up your mind, do you tend to approve or disapprove the way Kamala Harris is handling her job as vice president?
Base: All respondents
HARRIS’ APPROVAL RATING (2/2)
Am
eri
can
Su
rve
y
TOTALUSA
North-East
Mid-West
South West 18-34 35-54 55+ Male FemaleVoted
forTrump
Voted for
Biden
Voted for
other
TOTAL Sept.13th
Gap
Weighted n = 1,001 179 217 371 233 271 363 366 485 516 371 403 16 1,002
Unweighted n = 1,001 197 194 364 246 194 354 453 489 512 339 448 37 1,002
Approve 43% 48% 44% 38% 46% 44% 47% 38% 45% 41% 9% 80% 18% 45% -2
Disapprove 54% 50% 52% 58% 52% 52% 50% 60% 53% 55% 91% 20% 82% 52% +2
Unsure 3% 2% 4% 4% 2% 4% 3% 3% 2% 4% 0% 0% 0% 3% -

12
CTC631 and CTC632. Overall, do you approve or disapprove of the way Joe Biden/Kamala Harris is handling his job as president/vice president?
In the event a respondent had no opinion, the following prompting question was asked: Even if you have not yet made up your mind, do you tend to approve or disapprove the way Joe Biden/Kamala Harris is handling his job as president/vice president?
Base: All respondents
JOE BIDEN AND KAMALA HARRIS’ APPROVALRATING - EVOLUTION
Am
eri
can
Su
rve
y
51% 49% 49% 49%44% 45% 43%
56% 54% 53% 51% 48% 48% 46%
0%
10%
20%
30%
40%
50%
60%
70%
80%
90%
100%
July 5th, 2021 July 22nd, 2021 August 2nd, 2021 August 16th, 2021 August 30th, 2021 September 13th,2021
September 27th,2021
Kamala Harris Joe Biden
% Approve presented

CONTACT US
More than 400,000 panelistsat your disposal
Add your question(s) to our weekly Omnibus to surveythe population of your choice! It’s a flexible, fast,efficient and economical solution.
OMNIBUSTYPE n= REGIONS
NATIONAL 1,500 CANADA
PROVINCIAL 1,000 QC, ON, AB, BC
MUNICIPAL 500 QC, MTL, TOR, CAL, EDM, VAN
WESTERN 1,500 BC, AB, SK, MB
AMERICAN 1,000 4 CENSUS REGIONS
WOULD YOU LIKE TO SURVEY CANADIANS AND/OR AMERICANS?

APPENDIX

15
The table below presents the Canadian geographic distribution of respondents before weighting.
The table below presents the American geographic distribution of respondents before weighting.
Province Unweighted Weighted
British Columbia 160 208
Alberta 129 172
Manitoba/Saskatchewan 125 100
Ontario 612 590
Quebec 409 361
Atlantic 102 105
US Region Unweighted Weighted
NorthEast 197 179
MidWest 194 217
South 364 371
West 246 233
DETAILED METHODOLOGYWEIGHTED AND UNWEIGHTED SAMPLE

16
DETAILED METHODOLOGYWEIGHTED AND UNWEIGHTED SAMPLE FOR CANADA
The following tables present the demographic distribution of respondents according to gender, age and language(mother tongue) for Canada.
The sample thus collected has a minimum weighting factor of 0.2658 and a maximum weighting factor of 4.6749. Theweighted variance is 0.5475.
GENDER Unweighted Weighted
Male 866 747
Female 671 790
AGE Unweighted Weighted
Between 18 and 34 410 419
Between 35 and 54 602 524
55 or over 525 594
LANGUAGE (MOTHER TONGUE) Unweighted Weighted
English 963 1,017
French 354 320
Other 217 196
17
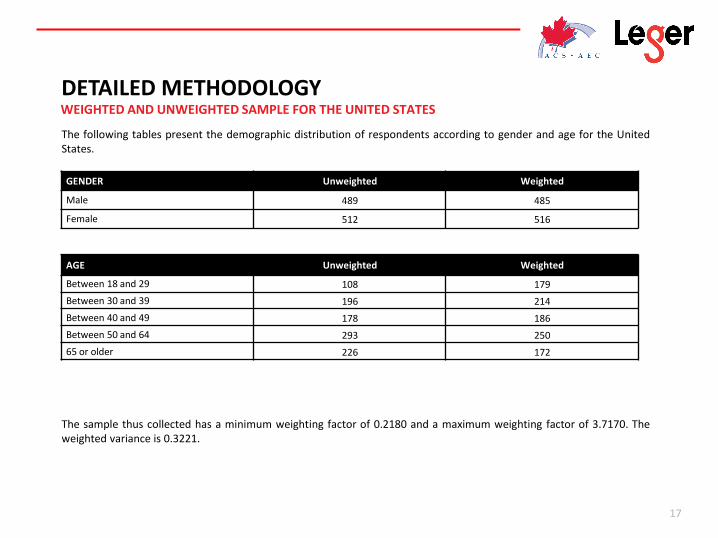
DETAILED METHODOLOGYWEIGHTED AND UNWEIGHTED SAMPLE FOR THE UNITED STATES
The following tables present the demographic distribution of respondents according to gender and age for the UnitedStates.
The sample thus collected has a minimum weighting factor of 0.2180 and a maximum weighting factor of 3.7170. Theweighted variance is 0.3221.
GENDER Unweighted Weighted
Male 489 485
Female 512 516
AGE Unweighted Weighted
Between 18 and 29 108 179
Between 30 and 39 196 214
Between 40 and 49 178 186
Between 50 and 64 293 250
65 or older 226 172

185• Leger
Marketing research and polling
• Leger MetriCXStrategic and operational customerexperience consulting services
• Leger Analytics (LEA)Data modelling and analysis
• Leger Opinion (LEO)Panel management
• Leger CommunityOnline community management
• Leger DigitalDigital strategy and user experience
• International researchWorldwide Independent Network (WIN)
MONTREAL | QUEBEC CITY | TORONTO | WINNIPEG
EDMONTON | CALGARY | VANCOUVER | PHILADELPHIA
EMPLOYEES CONSULTANTS
600
8OFFICES
18
OUR SERVICES

OUR COMMITMENTS TO QUALITY
Leger is a member of the Canadian Research Insights Council (CRIC), the industry association for the market/survey/insights research industry.
Leger is a member of ESOMAR (European Society for Opinion and Market
Research), the global association of opinion polls and marketing research
professionals. As such, Leger is committed to applying the international
ICC/ESOMAR code of Market, Opinion and Social Research and Data Analytics.
Leger is also a member of the Insights Association, the American Association
of Marketing Research Analytics.
Leger is a sponsor of CAIP Canada, Canada's professional body for Certified
Analytics and Insights Professionals who uphold CRIC's marketing research and
public opinion research standards. CAIP Canada is globally endorsed by ESOMAR
and the MRII/University of Georgia.
19