October 26, 2017 METI (Ministry of Economy, Trade and ... · Reference Materials for Ito Review...
27
Reference Materials for Ito Review 2.0 October 26, 2017 METI (Ministry of Economy, Trade and Industry)
Transcript of October 26, 2017 METI (Ministry of Economy, Trade and ... · Reference Materials for Ito Review...

Reference Materials for Ito Review 2.0
October 26, 2017 METI
(Ministry of Economy, Trade and Industry)
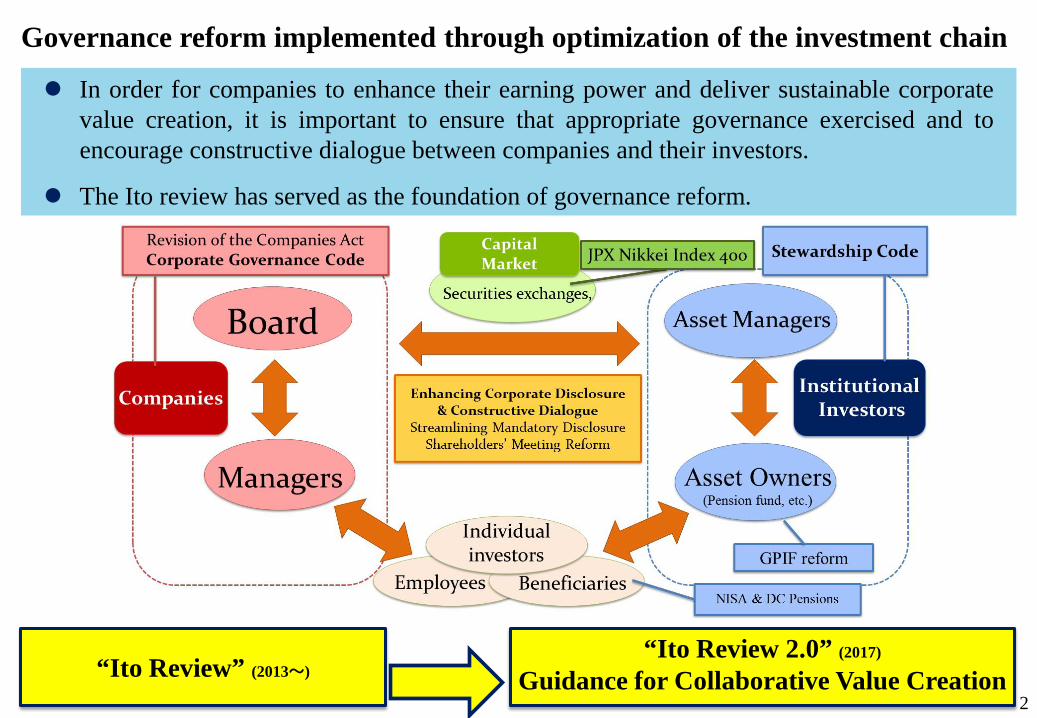
“Ito Review” (2013~) “Ito Review 2.0” (2017)
Guidance for Collaborative Value Creation
In order for companies to enhance their earning power and deliver sustainable corporate value creation, it is important to ensure that appropriate governance exercised and to encourage constructive dialogue between companies and their investors.
The Ito review has served as the foundation of governance reform.
Governance reform implemented through optimization of the investment chain
2

3
(Reference) Relationship between measures related to corporate governance and the growth strategy Major activities Status of implementation
Japan Revitalization
Strategy
Ito Review Start in July 2013 →Final report in August 2014
JPX Nikkei Index 400 Calculation started in January 2014
Japan's Stewardship Code Published in February 2014
Revision of the Companies Act Put into force in May 2015
Japan Revitalization
Strategy Revised in 2014
The Management Investor Forum Started in June 2015
Corporate Governance Code Application started in June 2015
The Study Group concerning Promoting Dialogue between Companies and Investors for Sustainable Growth Report published in April 2015
Japan Revitalization
Strategy Revised in 2015
The Corporate Governance System Study Group Report published in July 2015
Study Group on Promoting Electronification of Processes for Shareholder Meetings Report published in April 2016
“Working Group on Corporate Disclosure” of the Financial System Council Report published in April 2016
The Council of Experts Concerning the Follow-up of Japan’s Stewardship Code and Japan’s Corporate Governance Code Study started in September 2015
Japan Revitalization
Strategy 2016
• The role and management method of the board of directors, election and dismissal of CEOs, succession plans, introduction of incentive-based remuneration, the role and functions of outside directors, etc. (The CGS (Corporate Governance System) Study Group)
Study started in July 2016 ⇒Guidance published in March 2017
• Judgment and evaluation of long-term investments by companies, viewpoints of evaluation of medium- to long-term corporate value by investors, evaluation method, behavior of companies and investors, and dialogue and communication between companies and investors (The Study Group on Long-term Investment (Investment evaluating ESG Factors and Intangible Assets) toward Sustainable Growth)
Study started in August 2016 ⇒The Guidance for Collaborative Value Creation
published in May 2017 ⇒Ito Review 2.0 published in October 2017
• Realizing the most effective and efficient disclosure by the international standard (revision of the mandatory disclosure) in the first half of 2019
Conducting a study toward harmonization of the mandatory disclosure systems based on the Companies Act and the Financial Instruments and Exchange Act
• Enhancing information disclosure and realizing a dialogue-based general shareholders’ meeting process by conducting a further study and activities concerning measures to secure a period of time for shareholders to consider proposals and engage in dialogue in order to develop the most desirable dialogue environment from the global perspective
• The development of an environment for companies to rationally and appropriately set the schedule of general shareholders’ meetings and the reference dates
• Following up on activities by relevant parties to realize a dialogue-based general shareholder meeting process
• Introducing a system to extend the period of filing of corporate taxes until after the general shareholders’ meeting when revising the date of the meeting

4
Japanese companies’ earning power
The ROE in Japan has been improving since FY 2008 and has stayed at 7 to 8% in recent years.
Compared with the levels in the United States and Europe, the ROE in Japan is at a low level on the whole and varies little across companies.
Source: Bloomberg Note: The above figures are the median values for the TOPIX components
Source: Bloomberg Note: The ROE figures for the components of the TOPIX500, S&P500 and Bloomberg European500 over the nine years from 2008 to 2016 were obtained. The distribution was calculated through the classification of the median values of those figures.

Japan (TOPIX500) ROE (%) Profit Margin (%) Total Asset Turnover Equity MultiplierManufacturingindustry
8.36 5.53 0.81 1.78
Non-manufacturingindustry
9.10 4.86 0.85 2.23
Total 8.55 5.30 0.82 1.89
U.S. (S&P500) ROE (%) Profit Margin (%) Total Asset Turnover Equity MultiplierManufacturingindustry
18.15 10.27 0.67 2.53
Non-manufacturingindustry
13.96 6.95 0.57 2.81
Total 15.68 8.60 0.63 2.68
Europe (BE500) ROE (%) Profit Margin (%) Total Asset Turnover Equity MultiplierManufacturingindustry
13.41 7.19 0.76 2.29
Non-manufacturingindustry
12.86 6.06 0.60 2.85
Total 13.18 6.84 0.70 2.46
5
ROE (DuPont analysis)
Source: Bloomberg Note: Above are the ROE figures for the components of the TOPIX500, S&P500 and Bloomberg European500 in fiscal 2016 (all figures are median values).
Profit margin of the Japanese companies is lower than the U.S. and Europe, and it causes lower level of the ROE.

6
Trend in Japanese stock prices
Stock prices have been on an uptrend since the start of the Abenomics policy (since 2013).
Source: Bloomberg Note: The levels of the Nikkei stock average and the TOPIX in the period until the end of 2016 were converted into index figures with the levels as of the end of
2008 used as the base of 100.

7
Long-term performance of major indices On the other hand, over the past 26 years (from the end of 1990 to the end of 2016),
stock prices have remained stagnant only in Japan.
Source: Bloomberg Note: The levels of major indexes in the period until the end of 2016 were converted into index figures with the levels as of the end of 1990 used as the base of 100.
Trend in major stock indices in developed countries

8
PBR (Price Book-Value Ratio) analysis
In theory, when the PBR is less than 1, it means that the breakup value is higher than the existing return to shareholders.
PBR = Stock priceNet assets per share
= Market valuationNet assets
PBR (Price Book-Value Ratio)
Representing the ratio of net assets to market valuation. This is an indicator of how much companies’ stock prices are overvalued or undervalued relative to their net assets. A value of 1.0 or higher: Market valuation ≧ net assets
• The company’s growth potential is being highly evaluated. Intangible assets not reflected in financial assets are being highly evaluated.
A value of lower than 1.0: Market valuation < net assets • The breakup of the company would bring more profits to its shareholders
than they now receive as shareholder returns. • The company’s growth potential is not being highly evaluated.
Calculation formula Indicators for evaluating the corporate value Outline
Indicator of how efficiently companies’ gross assets are used in order to earn profits
ROE (Return On Equity)
ROA (Return On Asset)
PER (Price Earnings Ratio)
ROE = Net profitOwn capital
ROA = Net profitGross assets
PER = Stock price Net earnings per share
Indicator of how much profit companies are earning on invested capital
Indicator of how much companies’ stock prices are overvalued or undervalued relative to net profit and the ratio of net profit to market value.

9
Corporate value of Japanese companies (i)
Source: A list of PERs and PBRs (consolidated and non-consolidated bases) by company size and by industry, compiled by Japan Exchange Group
The PBR for Japanese companies (those listed on the Tokyo Stock Exchange’s First Section) has stayed at around 1.0.
0.0
0.5
1.0
1.5
2.0
Annual trend in the PBR for Japanese companies (those listed on the Tokyo Stock Exchange’s First Section)
10
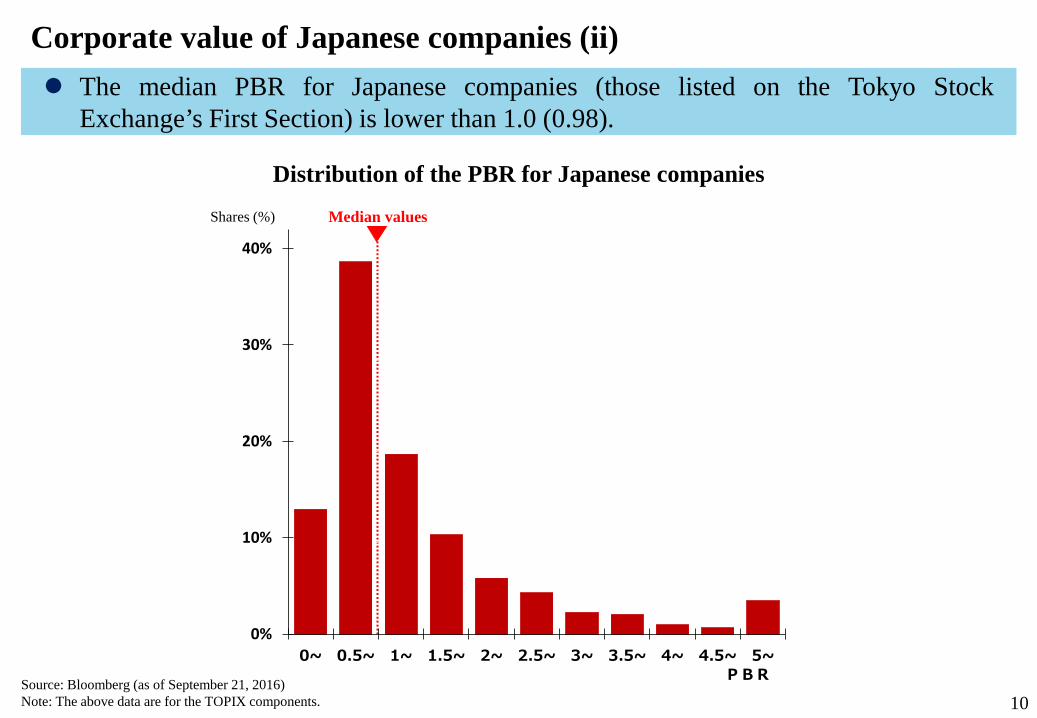
Corporate value of Japanese companies (ii)
Source: Bloomberg (as of September 21, 2016) Note: The above data are for the TOPIX components.
The median PBR for Japanese companies (those listed on the Tokyo Stock Exchange’s First Section) is lower than 1.0 (0.98).
中央値
0%
25%
50%
75%
100%
0%
10%
20%
30%
40%
0~ 0.5~ 1~ 1.5~ 2~ 2.5~ 3~ 3.5~ 4~ 4.5~ 5~PBR
企業の構成(%)
Distribution of the PBR for Japanese companies
Shares (%) Median values

11
Corporate value of Japanese companies (iii)
Source: Bloomberg (as of September 21, 2016) Note: The above data are for the components of the TOPIX and the NYSE composite index.
The median PBR for U.S. and German companies is higher than 2.0 (2.14 for U.S. companies and 2.01 for German companies)
中央値米国
中央値日本
0%
25%
50%
75%
100%
0%
10%
20%
30%
40%
0~ 0.5~ 1~ 1.5~ 2~ 2.5~ 3~ 3.5~ 4~ 4.5~ 5~0%
25%
50%
75%
100%
0%
10%
20%
30%
40%
0~ 0.5~ 1~ 1.5~ 2~ 2.5~ 3~ 3.5~ 4~ 4.5~ 5~
企業の構成(%)
PBR
中央値ドイツ
中央値日本
0%
25%
50%
75%
100%
0%
10%
20%
30%
40%
0~ 0.5~ 1~ 1.5~ 2~ 2.5~ 3~ 3.5~ 4~ 4.5~ 5~0%
25%
50%
75%
100%
0%
10%
20%
30%
40%
0~ 0.5~ 1~ 1.5~ 2~ 2.5~ 3~ 3.5~ 4~ 4.5~ 5~
企業の構成(%)
PBR
Distribution of the PBR for U.S. companies Distribution of the PBR for German companies
Source: Bloomberg (as of September 21, 2016) Note: The above data are for the component stocks of the TOPIX and
Börse Frankfurt’s prime all share index.
Shares (%) Median values
(U.S.) Median values
(Japan) Shares (%) Median values
(Germany) Median values
(Japan)
12
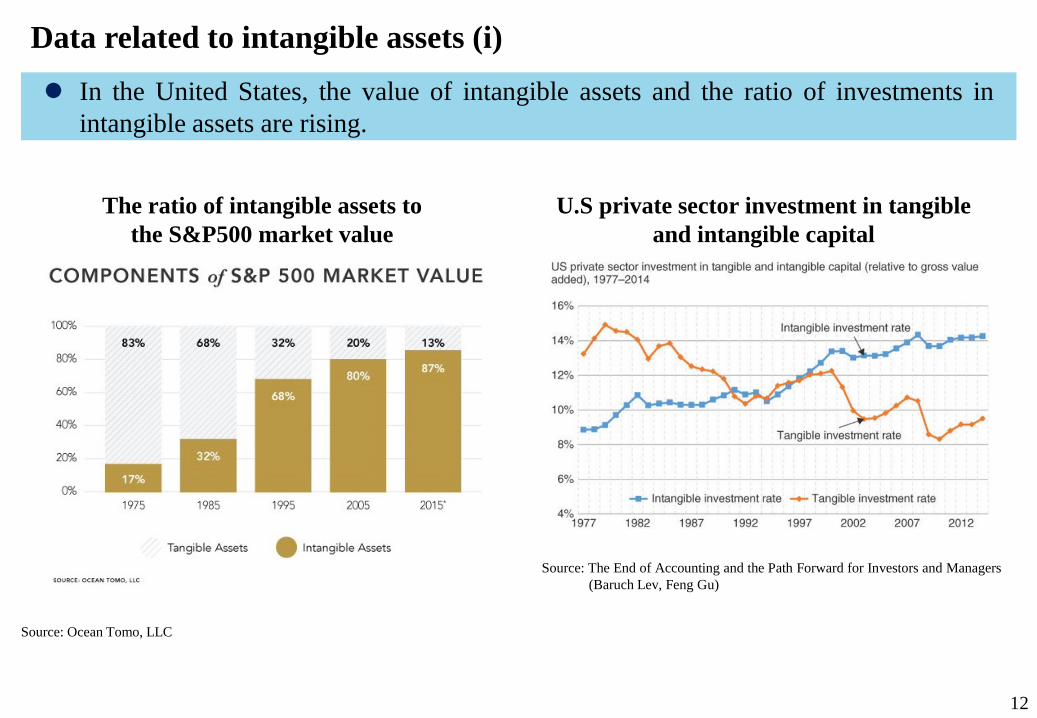
Data related to intangible assets (i)
Source: Ocean Tomo, LLC
In the United States, the value of intangible assets and the ratio of investments in intangible assets are rising.
Source: The End of Accounting and the Path Forward for Investors and Managers (Baruch Lev, Feng Gu)
The ratio of intangible assets to the S&P500 market value
U.S private sector investment in tangible and intangible capital

13
Data related to intangible assets (ii)
Source: Documents prepared by Prof. Miyagawa at the 4th meeting of the Study Group on Long-term Investment (Investment in ESG Factors and Intangible Assets) toward Sustainable Growth (November 10, 2016)
The amount of investments in intangible assets in Japan has been declining since hitting its peak in 2007.
Trend in investments in intangible assets
Trill
ion
yen
Investment in information equipment
R&D investment Other innovation-related investments Brand investment Investment for human resource
development and reorganization

14
Relationship with the ratios of tangible and non-tangible assets
Source: Bloomberg (as of September 21, 2016)
The ratio of tangible assets among the top 100 companies in terms of the PBR is higher than 90% only in Japan.
Analysis focusing on the ratio of tangible assets (the top and bottom 100 companies in terms of the PBR)

15
Data concerning R&D investment (i)
Source: Documents published by Google (Alphabet), Apple, Facebook and Amazon and the figures for the TOPIX Core30 from Bloomberg.
Global platform operators (GAFA: Google, Apple, Facebook and Amazon) have been increasing R&D investment year after year.
R&D expenditures of platform operators

16
Data concerning R&D investment (ii)
Source: “FY2016 Industrial Technology Survey Program: Survey on the Indicator of R&D Investment Efficiency (Phase II) Final Report,” Ministry of Economy, Trade and Industry
Japanese companies’ R&D activities have been becoming short-term in outlook.
R&D activities tilted heavily toward improvement of existing technologies
R&D investment becoming increasingly short-term in outlook

17
Increase in passive investments
Source: Investment Company Institute
Passive-index investments are growing worldwide.
Trend in the net asset amounts of active and index funds and ETFs
Cumulative fund inflows and outflows for U.S.-domiciled U.S. stock investment funds and ETFs
Source: Investment Company Institute, “2017 Investment Company Fact Book”

18
ESG - United Nation Principles for Responsible Investment (PRI) -
Source: UNPRI
1. We will incorporate ESG issues into investment analysis and decision-making processes. 2. We will be active owners and incorporate ESG issues into our ownership policies and practices. 3. We will seek appropriate disclosure on ESG issues by the entities in which we invest. 4. We will promote acceptance and implementation of the principles within the investment industry. 5. We will work together to enhance our effectiveness in implementing the principles. 6. We will each report on our activities and progress towards implementing the principles.
Governance (G) • executive pay • bribery and corruption • political lobbying and donations • board diversity and structure • tax strategy
Environmental (E) • climate change • greenhouse gas (GHG) emissions • resource depletion, including water • waste and pollution • deforestation
Social (S) • working conditions, including slavery and
child labour • local communities, including indigenous
communities • conflict • health and safety • employee relations and diversity
The Six Principles for Responsible Investment
ESG factors
19
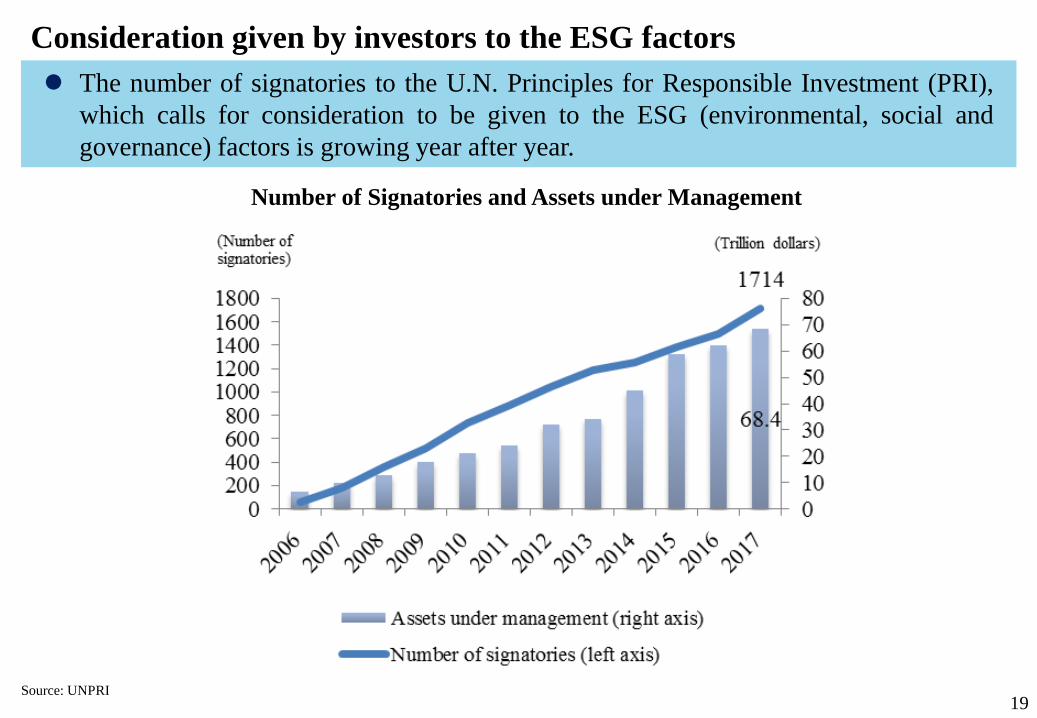
Consideration given by investors to the ESG factors
Source: UNPRI
The number of signatories to the U.N. Principles for Responsible Investment (PRI), which calls for consideration to be given to the ESG (environmental, social and governance) factors is growing year after year.
Number of Signatories and Assets under Management

20
(Reference) Activities of GPIF
Source: Government Pension Investment Fund (GPIF)
By promoting constructive dialogue between entrusted investment management institutions and investee companies, GPIF aims to develop a “win-win environment” in the investment chain in which a medium- to long-term rise in corporate value will lead to the growth of the Japanese economy as a whole, ultimately resulting in a rise in the return on investment.
(Examples of activity) Signing the PRI; publicly inviting proposals concerning ESG indexes; and holding an asset owner forum

21
Growing importance of non-financial information
Source: The End of Accounting and the Path Forward for Investors and Managers (Baruch Lev, Feng Gu)
The impact of non-financial information on stock price changes is growing.
Change in the sources of information that could affect stock price changes
22
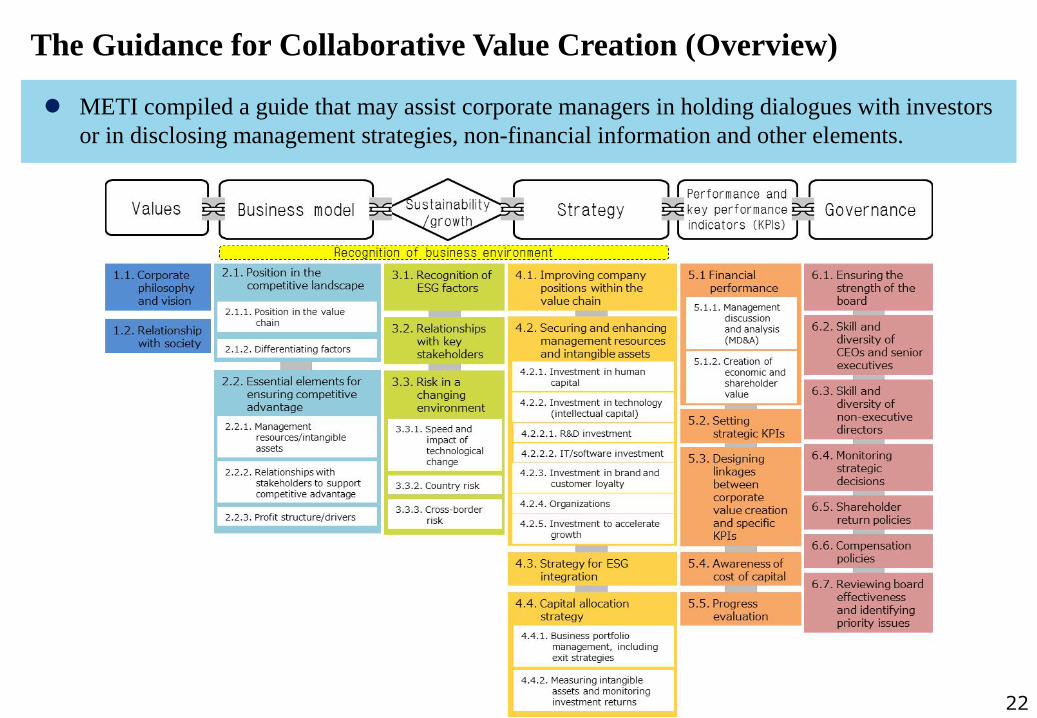
The Guidance for Collaborative Value Creation (Overview)
METI compiled a guide that may assist corporate managers in holding dialogues with investors or in disclosing management strategies, non-financial information and other elements.

• Seminars, workshops
• Deliberation and study on best practices
Economic organizations, etc.
Companies Sophistication of business strategies using the guidance Obtaining appropriate evaluation from investors through
integrated disclosure Obtaining support for strategic business and investment
decisions intended to achieve sustainable growth by securing the trust of investors with a long-term perspective (e.g. pension funds)
Constructive dialogue and engagement
Investors Sophistication of earnings and stock price forecasting using
the evaluation of companies Reducing risks and raising the return over the medium to
long term through the selection of superior companies Raising the return by encouraging investee companies to
improve their business management through dialogue
• Collaboration with award programs
• Use for analysts’ reports
Securities exchanges Financial intermediaries
• Seminars, workshops
• Use for analysis of companies and engagement activities
Investors, etc.
International initiatives ex. IIRC
Stewardship Code
Platform Deliberation on
practices Use for analysis
of companies
Integration into various measures
Corporate Governance Code
Guidance for Collaborative Value Creation Cooperation
Activities related to the Guidance for Collaborative Value Creation
23

24
Specific examples of future activities (i) TSE started using the Guidance for Collaborative Value Creation for the examination process
of the TSE Corporate Value Improvement Award (*). Prize winners are scheduled to be announced in January 2018.
* This award is given to listed companies of high corporate value and had implemented management deemed to improve corporate value through initiatives that consider capital cost and other investor concerns.
Source: Japan Exchange Group’s Website
Selection Process
Reflecting the intent and contents of the Guidance for Collaborative Value Creation
Company Name
Grand Prix Kao Corporation
Excellence Award
Meiji Holdings Co., Ltd.
START TODAY CO.,LTD.
Astellas Pharma Inc.
The winners of the 5th Corporate Value Improvement Award (FY2016)
Select 400 companies from among all TSE-Listed companies (approx. 3,500) based on average equity spread (ROE – cost of equity) or growth rate over the past few years.
Send out a questionnaire on management goals, awareness of capital cost, and other matters to the 400 companies selected. Calculate how far value creation has surpassed weighted average cost of capital (WACC), etc. based on a preset formula using figures etc. select 50 companies and announce them as candidates for the awards (announced in August 2017).
Sent out a detailed questionnaire on management approach to the 50 companies and assess their methods for achieving sustainable value-creating growth. Select approximately three companies based on the questionnaire and announce them as finalists (scheduled to be announced in November 2017).
The Listed Company Award Selection Committee interviews finalists’ management, and feedback is gathered form investors and analysts before determining the winners (scheduled to be released in January 2018).
1st Round
2nd Round
3rd Round
4th Round

<Examination points> 1. Whether the report covers the essential items prescribed under the IR framework set by
the IIRC and describes the company’s value creation scenario clearly and succinctly. 2. Whether the report identifies the results achieved in past business activities and challenges
to be resolved and clearly explains their relationship with the results in the current year and whether the report makes it possible to accurately foresee how the company’s business will evolve in the future and what risks the company may face in the future.
3. Whether the report clearly describes the value creation drivers regarding business activities and seeks to quantitatively express the drivers as KPIs and provide them in a form that enables comparison over time or comparison within the peer group. Whether the report describes the relationship between the KPIs and disclosed corporate data.
4. Whether the company is maintaining corporate governance in an appropriate manner so that the sustainability of business activities can be kept over the long term.
5. Whether the executive management team has consciousness about the company’s capital cost and is conducting business management from the perspective of the integration of financial and non-financial activities while giving consideration to the capital cost.
6. Whether the company implements reporting and disclosure with major stakeholders in mind and whether it also meets the information needs of other stakeholders by selecting and using appropriate disclosure media.
25
Specific examples of future activities (ii) WICI (*1) started using the Guidance for Collaborative Value Creation for the examination
process of WICI Japan Award for Excellence in Integrated Reporting (*2).
Source: WICI Japan's website
(*1) WICI is a private/public sector partnership for improving the reporting of intellectual assets and capital and key performance indicators that are of interest to shareholders and other stakeholders.
(*2) This award program selects winners based on annual reports issued by listed companies and other companies in the current year in recognition of their superiority in enabling readers to foresee the companies’ future situations by describing their value-creating activities in printed publications or via websites clearly and succinctly through the integration of financial and non-financial data.
The winners of the 4th WICI Japan Award for Excellence in Integrated Reporting (FY2016)
Reflecting the intent and contents of the Guidance for Collaborative Value Creation
FY2016
NSK Ltd.
MS&AD Insurance Group Holdings, Inc.
ITOCHU Corporation
OMRON Corporation
Hitachi Chemical Company, Ltd. (Encouragement Prize)

26
(Reference) Increase in integrated disclosure
Source: Survey of Integrated Reports in Japan 2016 (KPMG Japan, 2017) Note: The number of issuing companies is based on the list of Japanese Companies Issuing Self-Declared Integrated Reports in 2016 which is issued by the Corporate Value Reporting Lab.
The number of Japanese companies issuing integrated reports has been growing year after year.

27
Specific examples of future activities (iii) The Stock Research Center* started using the guidance for compilation of analyst
reports.
Source: Stock Research Center's website * Prepared through the integration of financial information with non-financial information, which is intellectual capital that determines future corporate value.
* SRC is an organization deploying activities aiming to make stock markets more active. In their activities, it prepares analyst reports from a neutral position, mainly featuring companies that investment analysts do not cover sufficiently, and releases them broadly to the public.
価値協創ガイダンスの趣旨・内容を反映
Stock Research Center (SRC)
A neutral analysis and report issuing institution
Issued reports are provided to general public at no cost through information media. Capital market
Investors,
information media, etc.
Analyst report “Holistic Company Report”
Reflecting the intent and contents of the Guidance for Collaborative Value Creation