Ocean acidification alters morphology of all otolith …Ocean acidification alters morphology of all...
45
A peer-reviewed version of this preprint was published in PeerJ on 7 January 2019. View the peer-reviewed version (peerj.com/articles/6152), which is the preferred citable publication unless you specifically need to cite this preprint. Holmberg RJ, Wilcox-Freeburg E, Rhyne AL, Tlusty MF, Stebbins A, Nye Jr. SW, Honig A, Johnston AE, San Antonio CM, Bourque B, Hannigan RE. 2019. Ocean acidification alters morphology of all otolith types in Clark’s anemonefish (Amphiprion clarkii) PeerJ 7:e6152 https://doi.org/10.7717/peerj.6152
Transcript of Ocean acidification alters morphology of all otolith …Ocean acidification alters morphology of all...

A peer-reviewed version of this preprint was published in PeerJ on 7January 2019.
View the peer-reviewed version (peerj.com/articles/6152), which is thepreferred citable publication unless you specifically need to cite this preprint.
Holmberg RJ, Wilcox-Freeburg E, Rhyne AL, Tlusty MF, Stebbins A, Nye Jr. SW,Honig A, Johnston AE, San Antonio CM, Bourque B, Hannigan RE. 2019. Oceanacidification alters morphology of all otolith types in Clark’s anemonefish(Amphiprion clarkii) PeerJ 7:e6152 https://doi.org/10.7717/peerj.6152
Ocean acidification alters morphology of all otolith types in
Clark’s anemonefish (Amphiprion clarkii)
Robert Holmberg Corresp., 1 , Eric Wilcox-Freeburg 1 , Andrew L Rhyne 2 , Michael F Tlusty 1 , Alan Stebbins 1 ,
Steven W Nye Jr. 1 , Aaron Honig 1 , Amy E Johnston 1 , Christine M San Antonio 1 , Bradford Bourque 2 , Robyn
E Hannigan 1
1 School for the Environment, University of Massachusetts at Boston, Boston, Massachusetts, United States
2 Department of Biology, Marine Biology and Environmental Science, Roger Williams University, Bristol, Rhode Island, United States
Corresponding Author: Robert Holmberg
Email address: [email protected]
Ocean acidification, the ongoing decline of surface ocean pH and [CO32-] due to absorption
of surplus atmospheric CO2, has far-reaching consequences for marine biota, especially
calcifiers. Among these are teleost fishes, which internally calcify otoliths, critical elements
of the inner ear and vestibular system. There is evidence in the literature that ocean
acidification increases otolith size and alters shape, perhaps impacting otic mechanics and
thus sensory perception. However, existing analyses of otolith morphological responses to
ocean acidification are limited to 2-dimensional morphometrics and shape analysis. Here,
we reared larval Clark’s anemonefish, Amphiprion clarkii (Bennett, 1830), in various
seawater pH treatments analogous to future ocean scenarios in a 3x-replicated
experimental design. Upon settlement, we removed all otoliths from each individual fish
and analyzed them for treatment effects on morphometrics including area, perimeter, and
circularity; further, we used scanning electron microscopy to screen otoliths visually for
evidence of treatment effects on lateral development, surface roughness, and vaterite
replacement. Our results corroborate those of other experiments with other taxa that
observed otolith growth with elevated pCO2, and provide evidence that lateral
development and surface roughness increased as well; we observed at least one of these
effects in all otolith types. Finally, we review previous work investigating ocean
acidification impacts on otolith morphology and hypotheses concerning function, placing
our observations in context. These impacts may have consequences teleost fitness in the
near-future ocean.
PeerJ Preprints | https://doi.org/10.7287/peerj.preprints.27040v1 | CC BY 4.0 Open Access | rec: 18 Jul 2018, publ: 18 Jul 2018

1 AUTHOR COVER PAGE
2
3 TITLE
4
5 Ocean acidification alters morphology of all otolith types in Clark’s anemonefish (Amphiprion
6 clarkii)
7
8 AUTHOR NAMES
9
10 Robert J Holmberga, Eric Wilcox-Freeburga, Andrew L Rhyneb, Michael F Tlustya, Alan
11 Stebbinsa, Steven W Nye Jr.a, Aaron Honiga, Amy E Johnstona, Christine M San Antonioa,
12 Bradford Bourqueb, Robyn E Hannigana
13
14 AUTHOR AFFILIATIONS
15
16 aSchool for the Environment, University of Massachusetts Boston, MA, 100 William T
17 Morrissey Blvd, Boston, MA 02125
18 bDepartment of Biology, Marine Biology and Environmental Science, Roger Williams
19 University, 1 Old Ferry Rd, Bristol, RI 02809
20
21 CORRESPONDING AUTHOR
22
23 Robert J Holmberg

25 ABSTRACT
26
27 Ocean acidification, the ongoing decline of surface ocean pH and [CO32-] due to absorption of
28 surplus atmospheric CO2, has far-reaching consequences for marine biota, especially calcifiers.
29 Among these are teleost fishes, which internally calcify otoliths, critical elements of the inner ear
30 and vestibular system. There is evidence in the literature that ocean acidification increases otolith
31 size and alters shape, perhaps impacting otic mechanics and thus sensory perception. However,
32 existing analyses of otolith morphological responses to ocean acidification are limited to 2-
33 dimensional morphometrics and shape analysis. Here, we reared larval Clark’s anemonefish,
34 Amphiprion clarkii (Bennett, 1830), in various seawater pH treatments analogous to future ocean
35 scenarios in a 3x-replicated experimental design. Upon settlement, we removed all otoliths from
36 each individual fish and analyzed them for treatment effects on morphometrics including area,
37 perimeter, and circularity; further, we used scanning electron microscopy to screen otoliths
38 visually for evidence of treatment effects on lateral development, surface roughness, and vaterite
39 replacement. Our results corroborate those of other experiments with other taxa that observed
40 otolith growth with elevated pCO2, and provide evidence that lateral development and surface
41 roughness increased as well; we observed at least one of these effects in all otolith types. Finally,
42 we review previous work investigating ocean acidification impacts on otolith morphology and
43 hypotheses concerning function, placing our observations in context. These impacts may have
44 consequences teleost fitness in the near-future ocean.
45
46 INTRODUCTION
47
48 Since the advent of the industrial revolution, humankind has inadvertently relocated a
49 significant volume of carbon to the troposphere, where it now resides as a greenhouse gas,
50 warming the earth via radiative forcing (IPCC, 2013). Global warming, however, is not the sole
51 consequence of surplus atmospheric CO2: the surface ocean has absorbed approximately 30% of
52 anthropogenic CO2 emissions (Mikaloff Fletcher et al., 2006; Le Quéré et al., 2010), contributing
53 to ocean acidification (Caldeira and Wickett, 2003). While this absorption is an important sink,
54 serving to abate the greenhouse effect (IPCC, 2013), it has consequences for marine ecosystems.
55 Following diffusion, aqueous CO2 impacts seawater chemistry in two ways: it causes decreases
56 in pH and the concentration of carbonate (CO32-) (Doney et al., 2009). Both are expected to
57 impact the fitness of marine biota, with cascading effects up to the ecosystem level (Fabry et al.,
58 2008). From population abundances to community shifts, ocean acidification has the potential to
59 alter the ecological landscape of the ocean (Gaylord et al., 2015).
60 The declining availability of free CO32- is particularly worrisome due to its implications
61 for marine calcifiers, which use calcium carbonate (CaCO3) to form body structures including
62 shells, teeth, and spines. Surface waters are normally supersaturated with CO32-, but as [CO3
2-]
63 decreases, calcifiers may struggle to precipitate CaCO3 (Gattuso and Buddemeier, 2000).
64 Furthermore, if seawater is undersaturated with respect to calcium carbonate minerals (e.g.
65 aragonite, Ar), existing structures may readily dissolve (Orr et al., 2005). A vast body of
66 literature expounds ocean acidification’s anticipated effects on calcifier fitness in the future
67 ocean, demonstrating variable degrees of severity (Hendriks et al., 2010; Kroeker et al., 2013).
68 Differential responses may depend on the specific biochemical pathways involved in
69 calcification (Ries et al., 2009), biological mechanisms for buffering pH changes in body fluids
70 (Munday et al., 2011a), energetics limiting physiological acclimation (Seibel et al., 2012), or
71 various ecological forces acting on an organism (Kroeker et al., 2012).
72 Our primary interests are the diverse impacts of ocean acidification on physiology and
73 calcification in teleost fishes. Teleostei is an extremely diverse infraclass of Actinopterygii
74 representing the modern bony fishes, comprised of more than 30,000 species and dominating
75 most aquatic habitats (Froese and Pauly, 2018). Heuer and Grosell (2014) reviewed numerous
76 effects of acidification on marine teleosts, including respiratory acidosis leading to sustained
77 elevation of blood plasma HCO3- (Esbaugh et al., 2012), cognitive disruption and behavioral
78 changes linked to inhibited GABAA neurotransmitter receptor function (Nilsson et al., 2012),
79 mixed impacts on standard and maximum metabolic rates with implications for aerobic scope
80 (Munday et al., 2009), and more. In addition, teleosts are internal calcifiers, precipitating CaCO3
81 in the intestinal lumen that aids water absorption and osmoregulation (Grosell, 2011), and
82 precipitating otoliths in the inner ear that are critical for mechanoreception (Moyle and Cech,
83 2004); these structures may be points of vulnerability for teleosts in the near-future ocean
84 (Ishimatsu et al., 2008; Munday et al., 2008; Heuer and Grosell, 2014).
85 Otoliths, or ear stones, are critical features located within the inner ear of teleost fishes,
86 formed by precipitation of CaCO3 around a protein-rich matrix and bathed in endolymph

87 (Panella, 1971). CaCO3 supersaturation is maintained in the endolymph by proton pumps in the
88 epithelial cells adjacent to the site of crystallization, which maintain the pH gradient required for
89 CO32- - HCO3
- balance (Ishimatsu et al., 2008). Otoliths exist in three pairs, with one from each
90 pair contained within each otolithic end organ (saccule, utricle, lagena) in each side of the head
91 proximally ventral to the brain: the aragonitic sagittae and lapilli, traditionally believed to
92 function for hearing and gravisense respectively, and the oft-vateritic asterisci, traditionally
93 believed to function for hearing like the sagittae – however, these functions are not strictly
94 delineated and may indeed overlap (Popper and Fay, 1993). When an otolith is disturbed by fish
95 movement or sound waves, it triggers sensory hair cells (maculae) lining the interior wall of its
96 chamber, which convert the force into electrical impulses interpreted by the brain. Likewise,
97 otoliths function as sensory organs for detecting balance, acceleration, and sound (Fekete, 2003;
98 Moyle and Cech, 2004).
99 Researchers recognize the potential for ocean acidification to impact otolith growth in
100 teleosts, especially during the sensitive larval phase, and many have demonstrated effects
101 experimentally (Table 1). Contrary to the hypothesis that ocean acidification will inhibit otolith
102 growth due to dwindling CO32- availability (Ishimatsu et al., 2008), elevated seawater pCO2
103 stimulates growth of sagittae and/or lapilli in many taxa. This growth is attributed to elevated
104 blood plasma [HCO3-], retained to buffer acidosis and transported into the endolymph where it
105 becomes substrate for CO32- aggregation (Checkley et al., 2009; Munday et al., 2011b; Heuer and
106 Grosell, 2014). Only one study (Mu et al. 2015) observed decreased otolith size in response to
107 elevated pCO2. Other studies (Franke and Clemmesen, 2011; Munday et al., 2011a; Simpson et
108 al., 2011; Frommel et al., 2013; Perry et al, 2015; Cattano et al., 2017; Martino et al., 2017;
109 Jarrold and Munday, 2018) observed no effects of pCO2 on otolith morphology.
110 The variability in otolith responses to ocean acidification is perhaps unsurprising given
111 the diversity of life histories exhibited by teleosts and apparent critical period of development.
112 However, evidence that acidification alters otolith size and shape has inspired hypotheses that
113 this could interfere with otic mechanics, and thus impair sensory perception in teleosts (Munday
114 et al., 2011b; Bignami et al., 2013b, 2014; Pimentel et al., 2014; Schade et al., 2014; Mu et al.,
115 2015; Réveillac et al., 2015; Shen et al., 2016; Faria et al., 2017; Martino et al., 2017; Martins,
116 2017; Mirasole et al., 2017; Coll-Lladó et al., 2018; Jarrold and Munday, 2018). Indeed, there is
117 some evidence that asymmetry of otolith size, shape, and mass may impair auditory/vestibular

118 function in some species with consequences for habitat detection and overall fitness (Lychakov
119 and Rebane, 2005; Gagliano et al., 2008; Anken et al., 2017). Munday et al. (2011b)
120 hypothesized that enhanced otolith growth in larval Amphiprion percula under ocean
121 acidification could impact fish performance and fitness, but acknowledged that some degree of
122 variation is normal. Others have echoed this hypothesis, adding that increased otolith size could
123 enhance auditory sensitivity to the benefit or detriment of the fish depending on life history
124 (Bignami et al., 2013b, 2014; Réveillac et al., 2015).
125 While most available studies quantified simple morphometrics to analyze pCO2 effects
126 on otolith morphology, the most informative among them augmented morphometrics with other
127 analyses, including complex shape analyses (e.g. Fourier analysis) (Munday et al., 2011a,b;
128 Simpson et al., 2011; Martino et al., 2017; Mirasole et al., 2017); mass, volume and density
129 analyses (Bignami et al. 2013a,b); and compositional analyses (e.g. LA-ICPMS) (Munday et al.,
130 2011b; Hurst et al., 2012; Martino et al., 2017; Mirasole et al., 2017; Coll-Lladó et al., 2018).
131 Similarly, scanning electron microscopy can be used to screen for treatment effects on aspects of
132 otolith morphology and composition that, although typically overlooked in simple morphometric
133 analysis, may impact ear function. To that end, we investigated a suite of mineralogical metrics
134 including: lateral development, defined as the degree of convexity of an otolith’s lateral face;
135 percent visible crystals, defined as an estimate of surface crystal density or grain, approximating
136 surface roughness; crystal habit, here defined as any deviation in crystal shape from the
137 predominant orthorhombic aragonite in sagittae and lapilli, or hexagonal vaterite in asterisci; and
138 overall mineralogy, here defined as relative proportion of orthorhombic aragonite versus
139 hexagonal vaterite visible on an otolith’s surface. The former two metrics estimate an otolith’s
140 surface topography and texture, and the latter two metrics estimate crystal features indicative of
141 composition, density, and stability under environmental stress. These metrics are intended as
142 first-pass screening tools; should they yield compelling evidence of treatment differences, they
143 could be followed with more rigorous methods to best quantify the variable (e.g., measuring
144 otolith height directly or determining CaCO3 polymorph composition with Raman spectroscopy).
145 Here, we investigate ocean acidification impacts on otolith morphology in larval Clark’s
146 anemonefish, Amphiprion clarkii (Bennett, 1830). A. clarkii is a teleost reef fish belonging to
147 Pomacentridae and inhabiting shallow reefs throughout the Indo-Pacific (Froese and Pauly,
148 2018). We chose this species both as a novel taxon and to enable intragenus comparison with

149 previous work (Munday et al., 2011b). We reared A. clarkii in various pH treatments analogous
150 to present and future ocean scenarios over a period of 10 days, from hatch to settlement. Our
151 experiment included a total of 480 larvae distributed among 12 aquaria in a fully randomized and
152 3x-replicated design. Following the experimental trial, we removed all six otoliths (sagittae,
153 lapilli, and asterisci) from each individual fish, performed automated morphometric analyses,
154 and performed visual estimation and analyses according to our suite of mineralogical metrics.
155 We also performed analyses of fish mortality, settlement timing, and somatic growth. Any
156 differences in otolith morphology may have implications for teleost sensory perception and
157 fitness in the near-future ocean.
158
159 MATERIALS & METHODS
160
161 Livestock: We completed all husbandry at Roger Williams University in Bristol, Rhode Island,
162 USA (IACUC #R-11-09-13), rearing several Amphiprion clarkii (Bennett, 1830) broodstock
163 pairs. Broodstock periodically laid clutches of eggs on porcelain tiles in aquaria (every 10-12
164 days), and we inspected them daily for quality and development. We selected the largest,
165 healthiest clutch, removed it the night before anticipated day of hatch (around day eight post-
166 deposition), and placed it in a separate, 50 gal hatching aquarium. We gently aerated eggs to
167 ensure sufficient oxygen diffusion without excess agitation. Upon hatch, we randomly
168 distributed A. clarkii larvae into 10 gal experimental aquaria at a density of 40 individuals per
169 aquarium, all the while maintaining minimal agitation. Throughout the experimental trial, we fed
170 larvae ad libitum with wild copepods from monoculture (Pseudodiaptomus spp.) in a background
171 of algae (Isochrysis spp.). We dosed Pseudodiaptomus spp. to densities of 5 mL-1 and 1 mL-1
172 (nauplii and adults respectively), as measured using a counting wheel, and Isochrysis spp. twice
173 daily to maintain a concentration of 40,000 cells mL-1, as measured using a cell counter
174 (Beckman Coulter Inc., Brea, CA).
175
176 Experimental Trial: Our experimental design consisted of four pCO2/pH treatments selected to
177 model various present and anticipated future ocean conditions: 1. 350 atm/pH 8.16 (control),
178 modern ocean conditions; 2. 800 atm/pH 7.80, approximate conditions projected for 2100 under
179 Representative Concentration Pathway (RCP) 8.5 (IPCC, 2013); 3. 1600 atm/pH 7.60, nearly

180 double 2100 levels under RCP 8.5 (IPCC, 2013); 4. 3000 atm/pH 7.30, a reasonable extreme
181 given additive coastal eutrophication-induced acidification (Wallace et al., 2014). We replicated
182 treatments three times and assigned them to 12 experimental units (aquaria) in a randomized
183 design. We drew seawater from Mt. Hope Bay, sterilized it using sodium hypochlorite and UV
184 light, filtered it to 1 m, and used it to fill experimental aquaria. We completed 25% water
185 changes every other day using drip buckets at 100 mL min-1. We measured seawater salinity and
186 temperature twice daily in all aquaria using a handheld meter (YSI, Yellow Springs, OH). We
187 measured seawater total alkalinity once every other day in all aquaria using a tabletop autotitrator
188 (Hanna Instruments, Smithfield, RI). We conducted the experimental trial within an
189 environmental chamber to maintain ambient air conditions at 28C, and covered aquaria with
190 loose fitting lids to minimize CO2 outgassing and evaporative heat loss. We aerated seawater
191 with house-supplied air connected to airstones to maintain dissolved oxygen. We achieved and
192 maintained experimental treatments by dosing CO2 gas through the airstones using a CO2 dosing
193 apparatus (Wilcox-Freeburg et al., 2013) controlled by hobbyist aquarium controllers (Digital
194 Aquatics, Woodinville, WA). We measured pHT of each aquarium continuously using research-
195 grade glass combination electrodes calibrated to synthetic seawater buffers (Byrne, 1987; Millero
196 et al., 1993), prepared from analytical reagent grade chemicals (Fisher Scientific, Hampton, NH).
197 The aquarium controller output pHT data every 1-3 seconds via RSS feed, which we
198 parsed/logged to a PC with a custom Python script (Wilcox-Freeburg, 2014) (Python Version
199 3.7.0a2; https://www.python.org/). We calculated average DIC, pCO2, and Ar for each
200 aquarium from measured seawater parameters with CO2calc
201 (https://soundwaves.usgs.gov/2011/03/research4.html). We concluded the experimental trial after
202 10 days, or approximately the duration of the species’ larval phase.
203
204 Data Collection: Upon conclusion of the experimental trial, and following euthanization of fish
205 with a lethal dose of tricaine mesylate (MS-222) in seawater, we counted each individual, placed
206 them on a Sedgewick rafter (1 mm), and photographed them with a digital camera-equipped
207 stereomicroscope at 10x-90x magnification. We calculated mortality counts (by aquarium) by
208 subtracting final fish counts from initial stocking density. We measured standard lengths of each
209 individual to 1/100 mm from stereomicrographs with ImageJ (Version 1.51n;
210 https://imagej.nih.gov/ij/), and averaged them by aquarium (arithmetic mean). Due to the natural
211 variation in time required for individuals to settle, some were unsettled when we ended the trial.
212 We determined settlement visually from stereomicrographs of each fish according to overall
213 development (i.e. presence of stripes, fin development, pigmentation, etc.), and tallied
214 proportions of settled fish versus total remaining fish for each aquarium. We excluded unsettled
215 fish data (standard length, otolith morphometric variables, otolith mineralogical variables) from
216 all further analyses (sample exclusion criteria were pre-established). Next, we dissected fish
217 using clean microsurgical techniques. We removed all six otoliths (two each of sagittae, lapilli,
218 and asterisci) under a polarizing stereo dissection microscope. We digitally photographed each
219 set of otoliths with the stereomicroscope at 90x magnification and subsequently mounted them to
220 aluminum scanning electron microscopy (SEM) stubs for later analysis. We quantified area,
221 perimeter, major axis, and minor axis of all six otoliths from all fish from stereomicrographs
222 with custom MATLAB image analysis software (Wilcox-Freeburg, 2014) (MATLAB Version
223 R2017b; https://www.mathworks.com/products/matlab.html). All otolith morphometrics were
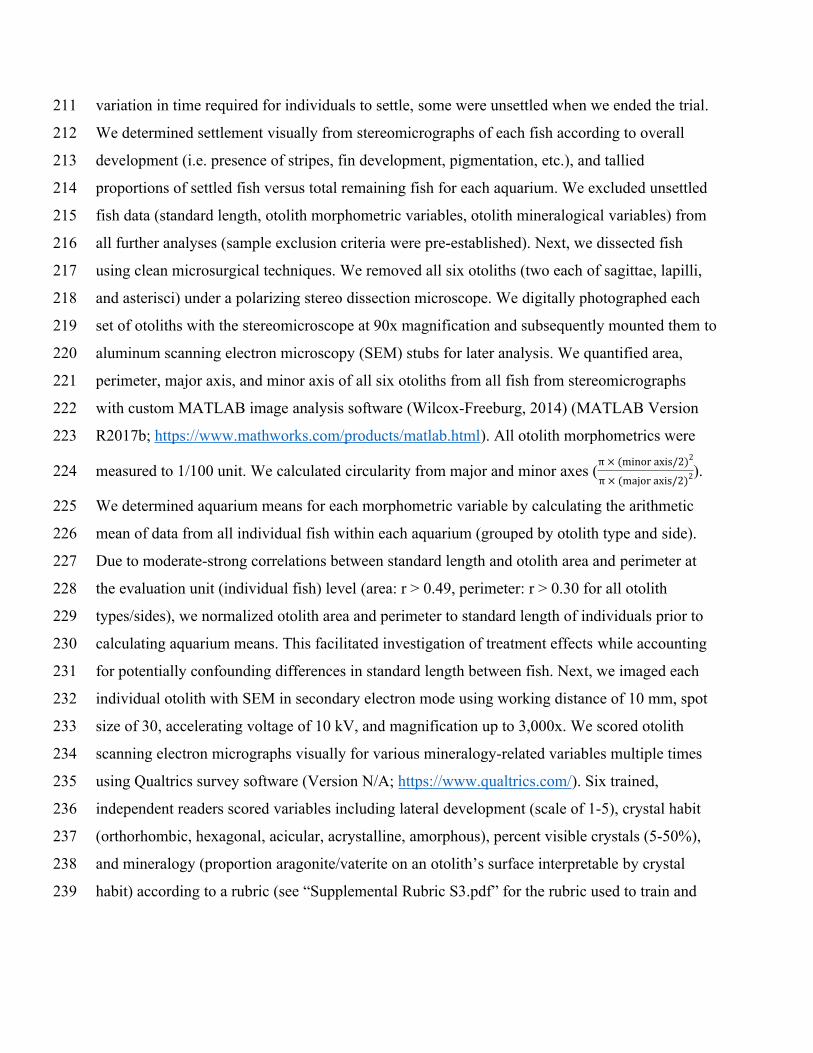
224 measured to 1/100 unit. We calculated circularity from major and minor axes ( ). π × (minor axis/2)
2π × (major axis/2)2
225 We determined aquarium means for each morphometric variable by calculating the arithmetic
226 mean of data from all individual fish within each aquarium (grouped by otolith type and side).
227 Due to moderate-strong correlations between standard length and otolith area and perimeter at
228 the evaluation unit (individual fish) level (area: r > 0.49, perimeter: r > 0.30 for all otolith
229 types/sides), we normalized otolith area and perimeter to standard length of individuals prior to
230 calculating aquarium means. This facilitated investigation of treatment effects while accounting
231 for potentially confounding differences in standard length between fish. Next, we imaged each
232 individual otolith with SEM in secondary electron mode using working distance of 10 mm, spot
233 size of 30, accelerating voltage of 10 kV, and magnification up to 3,000x. We scored otolith
234 scanning electron micrographs visually for various mineralogy-related variables multiple times
235 using Qualtrics survey software (Version N/A; https://www.qualtrics.com/). Six trained,
236 independent readers scored variables including lateral development (scale of 1-5), crystal habit
237 (orthorhombic, hexagonal, acicular, acrystalline, amorphous), percent visible crystals (5-50%),
238 and mineralogy (proportion aragonite/vaterite on an otolith’s surface interpretable by crystal
239 habit) according to a rubric (see “Supplemental Rubric S3.pdf” for the rubric used to train and

240 guide readers through scoring1). The rubric contains reference illustrations (and in the case of the
241 lateral development variable, micrographs) for each metric and lists categories to choose from
242 for scoring; for each metric, the readers were asked to choose the option that best categorizes
243 each otolith. Poor-quality micrographs due to mounting errors or broken otoliths were marked as
244 unusable and not scored. We generated otolith-specific raw data grouped by type and side for
245 each variable from the survey questions. We assigned each individual otolith the mode of survey
246 scores for each variable. If a two-way mode tie occurred, we selected the lower of the modes. If a
247 three-way mode tie occurred, we selected the median mode. For the lateral development and
248 percent visible crystals variables, we determined aquarium means by calculating the arithmetic
249 mean of the survey response mode for each otolith type and side, thus generating approximately
250 continuous aquarium means from ordinal data (Norman, 2010). The mineralogy and crystal habit
251 variables are nominal, so we determined the aquarium means by calculating the mode of the
252 otolith modes.
253
254 Statistical Analyses: We carried out all statistical analyses using R (Version 3.4.3; https://www.r-
255 project.org/). We considered polynomial models for all regression analyses, and performed
256 model selection using goodness of fit tests (i.e., F-tests for general linear models and chi-squared
257 tests for generalized linear models). We tested all binomial logistic regression models for
258 overdispersion. All statistical tests were two-tailed. We analyzed treatment effect on fish
259 mortality with binomial logistic regression analysis (link function = logit), with the proportion of
260 mortality counts (per aquarium)/aquarium stocking density as the response variable and pCO2 as
261 the explanatory variable. We investigated treatment effect on somatic growth with regression
262 analysis, with mean fish standard length (mm) as the response variable and pCO2 as the
263 explanatory variable. We investigated treatment effect on settlement time with binomial logistic
264 regression analysis, with the proportion of settled (per aquarium)/remaining fish (per aquarium)
265 at the end of the experimental trial as the response variable and pCO2 as the explanatory variable.
266 The crystal habit and mineralogy response variables exhibited no variance across any treatment
267 and otolith type, so we excluded them from further analysis. We performed principal component
268 analysis (PCA) on aquarium means for each otolith type and side. We ran PCA on the correlation
1 “Core development” in the rubric has been renamed “lateral development” in the manuscript. In the rubric, “core”
refers not to the otolith’s core but to the center of its lateral face.
269 matrix between the morphometric (area, perimeter, circularity) and survey (lateral development,
270 percent visible crystals) response variables using varimax rotation. We retained components with
271 eigenvalues greater than or equal to 1.0. We investigated treatment effects of pCO2 on otolith
272 morphometrics with regression analysis, with component scores as the response variables and
273 pCO2 as the explanatory variable. We performed regression analysis on all components
274 representing all otolith types and sides, and retained models in which pCO2 significantly
275 predicted the component.
276
277 RESULTS
278
279 Seawater Carbonate Chemistry:
280
281 Seawater carbonate chemistry parameters, including total pH (pHT), salinity (S), temperature (T),
282 total alkalinity (AT), dissolved inorganic carbon (DIC), partial pressure of CO2 (pCO2), and the
283 saturation state of aragonite (Ar) are reported as treatment means and standard deviations (for
284 measured parameters) in Table 2.
285
286 Mortality, Settlement and Somatic Growth:
287
288 Fish mortality and settlement percentages, as well as fish standard length measurements,
289 are reported as treatment means and standard deviations in Table 3. Despite high mortality
290 throughout the experimental trial (Fig. 1A), we observed no difference in the odds of fish
291 mortality between levels of treatment. However, we observed a difference in the timing of
292 settlement between levels of treatment: in a binomial logistic regression (Fig. 1B), pCO2
293 predicted the proportion of settled fish / remaining fish (2(1, 10) = 20.55, p = 0.0279). The odds
294 of settlement decreased by an estimated 4% with each 100 atm increase in pCO2 (95% CI: 0% –
295 7%, logit() = (-3.81E-4)x + 2.31 where y is binomial (m,)). pCO2 explained approximately
296 38% of the variation in the odds of settlement (Nagelkerke’s R2 = 0.38). We also observed a
297 difference in the somatic growth of fish between levels of treatment: in a linear regression (Fig.
298 1C), pCO2 predicted fish standard length (linear regression: F(1, 10) = 17.77, p = 0.0018). Fish
299 standard length decreased by 0.01 mm with each 100 atm increase in pCO2 (95% CI: 0.00 -

300 0.02 mm decrease, y = (-1.31E-4)x + 6.85), and pCO2 explained approximately 60% of the
301 variation in fish standard length (R2 = 0.60).
302
303 Otolith Morphometrics and Scoring:
304
305 Unstandardized otolith area and perimeter measurements, as well as circularity
306 measurements and estimates of two mineralogical metrics (lateral development and percent
307 visible crystals), are reported as treatment means and standard deviations for each otolith type in
308 Table 4. For the lateral development metric, the standard deviation of scores among the six
309 micrograph readers was 2.23; for 73% of samples, the standard deviation was 1 (the
310 difference between each successive category in the lateral development metric). For the percent
311 visible crystals metric, the standard deviation of scores among the six micrograph readers was
312 0.21; for 22% of samples, the standard deviation was 0.05 (the minimum difference between
313 two successive categories in the percent visible crystals metric), and for 93% of samples, the
314 standard deviation was 0.15 (the maximum difference between two successive categories).
315 Scoring for the crystal habit and mineralogy metrics never deviated from the norm for any otolith
316 type in any treatment (i.e., sagittae and lapilli were consistently scored as predominantly
317 aragonitic, exhibiting orthorhombic crystal habit; asterisci were assumed to be vateritic despite
318 exhibiting little to no identifiable crystal habit).
319
320 Principal Component Analysis:
321
322 For each otolith type and side, PCA produced two components with eigenvalues greater
323 than 1.0. These components, along with variances explained and loadings corresponding to each
324 otolith metric, are reported in Table 5.
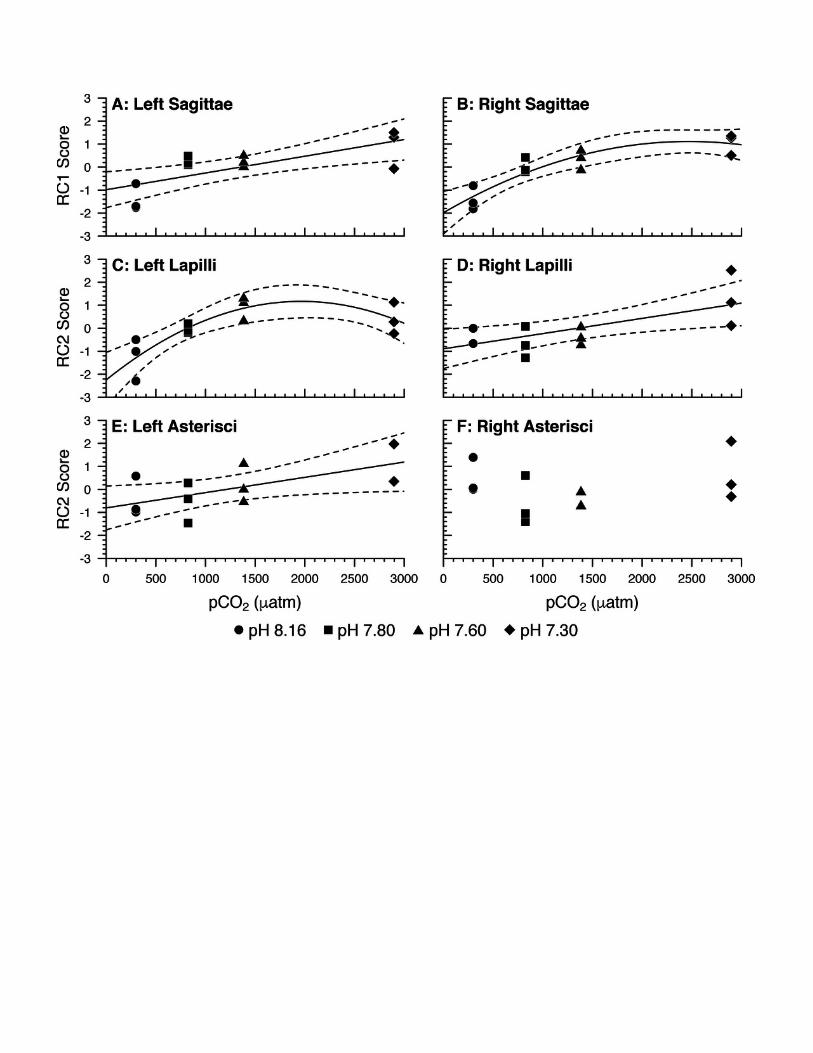
325 Left Sagittae (LS): RC1 correlated most strongly with lateral development, percent visible
326 crystals, and area/SL; RC1 correlated to a lesser degree with perimeter/SL. RC2 correlated most
327 strongly with circularity, perimeter/SL, and area/SL. Area/SL correlated more strongly with RC1
328 than RC2, whereas perimeter/SL correlated more strongly with RC2 than RC1. In a linear

329 regression (Fig. 2A), pCO2 predicted RC1 score (F(1, 10) = 11.98, p = 0.0061). RC1 score
330 increased by 0.07 with every 100 atm increase in pCO2 (95% CI: 0.03 - 0.12, y = (7.28E-4)x –
331 0.98). pCO2 accounted for 50% of the variability in RC1 score (R2 = 0.50). In summary: as pCO2
332 increased, left sagittae were rendered overall larger and wider in circumference, with more
333 pronounced lateral faces and rougher surface textures owed to greater visible crystal density.
334 Right Sagittae (RS): RC1 correlated most strongly with percent visible crystals, lateral
335 development, area/SL, and perimeter/SL. RC2 correlated most strongly with circularity,
336 perimeter/SL, and area/SL. Area/SL and perimeter/SL correlated more strongly with RC1 than
337 RC2. In a quadratic regression (Fig. 2B), pCO2 predicted RC1 score (F(2, 9) = 20.56, p = 0.0004,
338 y = (2.51E-3)x – (5.08E-7)x2 – 1.98). pCO2 accounted for 78% of the variability in RC1 score
339 (R2 = 0.78). In summary: as pCO2 increased, right sagittae responded according to the same
340 metrics, albeit with slightly stronger responses of area/SL and perimeter/SL.
341 While left and right sagittae were mostly consistent in their responses between sides, the
342 regression of left sagittae RC1 score against pCO2 was best represented as a linear model,
343 whereas the regression of right sagittae RC1 score against pCO2 was best represented as a
344 curvilinear (quadratic) model. This suggests that right sagittae RC1 score increased with pCO2
345 before leveling out between the pH 7.60 and pH 7.30 treatments and decreasing, perhaps
346 indicating asymmetry of response thresholds between sides.
347 Left lapilli (LL): RC1 correlated most strongly with percent visible crystals, lateral
348 development, and circularity. RC2 correlated most strongly with area/SL and perimeter/SL (r =
349 0.88). In a quadratic regression (Fig. 2C), pCO2 predicted RC2 score (F(2, 9) = 10.47, p =
350 0.0045, y = (3.48E-3)x – (8.86E-7)x2 – 2.25). pCO2 accounted for 63% of the variability in RC2
351 score (R2 = 0.63). In summary: as pCO2 increased, left lapilli were rendered larger and wider in
352 circumference.
353 Right Lapilli (RL): RC1 correlated most strongly with perimeter/SL, area/SL, and
354 circularity. RC2 correlated most strongly with percent visible crystals and lateral development.
355 In a linear regression (Fig. 2D), pCO2 predicted RC2 score (F(1, 10) = 8.21, p = 0.0168). RC2
356 score increased by 0.07 with every 100 atm increase in pCO2 (95% CI: 0.01 – 0.12, y = (6.62E-
357 4)x – 0.89). pCO2 accounted for 40% of the variability in RC2 score (R2 = 0.40). In summary: as

358 pCO2 increased, right lapilli were rendered rougher with more pronounced lateral faces despite
359 remaining approximately the same size.
360 Unlike the sagittae, the lapilli responded to treatment according to different metrics
361 depending on side. Like the sagittae, however, the lapilli exhibited differences in patterns of
362 response depending on side. As with the right sagittae, the regression of left lapilli RC2 score
363 against pCO2 was best represented as a curvilinear (quadratic) model: area/SL and perimeter/SL
364 increased through the pH 7.60 treatment only before falling slightly in the pH 7.30 treatment. In
365 contrast, the right lapilli response was best represented as a linear model, with no sign of leveling
366 out. This may indicate asymmetry of response thresholds between sides.
367 Left Asterisci (LA): RC1 correlated most strongly with perimeter/SL, area/SL, lateral
368 development, and percent visible crystals. RC2 correlated most strongly with circularity, percent
369 visible crystals, and perimeter/SL. Perimeter/SL correlated more strongly with RC1 than RC2,
370 whereas percent visible crystals correlated more strongly with RC2 than RC1. In a linear
371 regression (Fig. 2E), pCO2 predicted RC2 score (F(1, 9) = 5.61, p = 0.0420). RC2 score
372 increased by 0.07 with every 100 atm increase in pCO2 (95% CI: 0.00 – 0.13, y = (6.64E-4)x –
373 0.80). pCO2 accounted for 32% of the variability in RC2 score (R2 = 0.32). In summary: as pCO2
374 increased, left asterisci were rendered increasingly elliptical (rather than circular), rougher, and
375 wider in circumference. Notably, this is the only instance of 2-dimensional otolith shape change
376 that we observed in response to treatment, as well as the only otolith metric that decreased rather
377 than increased with increasing pCO2.
378 Right Asterisci (RA): RC1 correlated most strongly with perimeter/standard length,
379 area/SL, circularity, and percent visible crystals. RC2 correlated most strongly with lateral
380 development and percent visible crystals. Percent visible crystals correlated more strongly with
381 RC2 than RC1, but the difference was small. However, neither component predicted pCO2 (Fig.
382 2F). In summary: right asterisci were not observed to respond to increasing pCO2.
383 As with the lapilli, the asterisci responded differently depending on side. Indeed, the right
384 asterisci were the only otolith type/side that exhibited no response to treatment.
385
386
387 DISCUSSION
388
389 Fish Condition:
390
391 As might be expected when rearing many hundreds of fish in the most delicate early
392 stages of development, Amphiprion clarkii larvae experienced substantial mortality throughout
393 the experimental trial, and especially in the first few days after stocking. Specifically, 164 of the
394 480 stocked individuals survived until the end of the trial. Higher-than-usual mortality might be
395 attributed in part to the stress of moving larvae immediately post-hatch. Although there is
396 evidence in the literature of acute CO2 toxicity in larval teleosts, this is typically observed at
397 pCO2 levels far exceeding those evaluated here (i.e. > 48,000 uatm) (Kikkawa et al., 2003;
398 Ishimatsu et al., 2004; Kikkawa et al., 2004); indeed, we observed no evidence that treatment
399 instigated fish mortality. We concede that time-series analysis of fish mortality would have been
400 most appropriate, but due to the miniscule size and transparency of larvae throughout most of the
401 trial, as well as low visibility in the algae-darkened aquaria, counting mortalities as they occurred
402 was impractical. The sum of daily mortality counts did not match the difference of remaining
403 fish from initial stocking density, so we considered time-series analysis of mortality
404 inappropriate and used the latter for final mortality counts.
405 Although we observed no evidence of pCO2 impacting mortality in A. clarkii, we
406 investigated whether treatment could delay settlement and/or retard somatic growth sub-lethally.
407 Odds of on-time settlement were inversely correlated with pCO2 intensity, and the trend was
408 dramatic: the 4% decrease in odds of settlement with every 100 atm increase in pCO2 equates
409 to a 19% decrease with every 500 atm increase, or roughly 20% decrease with each treatment
410 level. We hypothesize that settlement delays could impact the later growth of A. clarkii as in
411 another reef fish, Thalassoma bifasciatum (Victor, 1986), although this knowledge gap requires
412 further investigation. Since settlement was evaluated just once at the end of the experimental
413 trial, and since unsettled fish were euthanized before achieving settlement, the magnitude of
414 settlement delay is unknown. We observed a similar sub-lethal effect of pCO2 on somatic
415 growth, albeit not as dramatic: though statistically significant, the reduction in fish standard
416 lengths with increasing pCO2 amounts to a small fraction of fish standard lengths. In summary:
417 treatment delayed fish settlement, but did not appreciably inhibit fish somatic growth, nor impact
418 fish mortality.
419
420 Otolith Morphology:
421
422 Otoliths exhibited diverse responses to treatment according to type and side. In response
423 to increasing seawater pCO2, all three otolith types exhibited increasing perimeter and percent
424 visible crystals, sagittae and lapilli exhibited increasing area and lateral development, and
425 asterisci exhibited differences in shape. However, while the sagittae changed according to the
426 same metrics regardless of side, the lapilli and asterisci changed according to different metrics
427 depending on side. These differences reveal important things about the nature of the metrics
428 under investigation. For example, while both sagittae responded to treatment by growing larger
429 with more pronounced lateral faces, these effects were segregated according to side in the lapilli;
430 this suggests that otolith area and lateral development are uncoupled rather than being two
431 immutably conjoined metrics of growth. For reasons like this, when investigating impacts of
432 ocean acidification or other stresses on otolith development, it is often informative to investigate
433 each otolith independently rather than investigating one type or pooling by type without regard to
434 side. Among the 24 studies reviewed here that analyzed ocean acidification impacts on otolith
435 morphology, five investigated lapilli (Bignami et al., 2013a,b, 2014; Maneja et al., 2013; Shen et
436 al., 2016; Cattano et al. 2017; Coll-Lladó et al., 2018), none investigated asterisci, and eight
437 segregated otoliths by side during morphometric analysis (at least six of which pooled them after
438 observing no evidence of asymmetry) (Franke and Clemmesen, 2011; Munday et al., 2011a,b;
439 Maneja et al., 2013; Bignami et al., 2014; Mu et al., 2015; Perry et al., 2015; Réveillac et al.,
440 2015; Martins, 2017; Jarrold and Munday 2018).
441 Researchers previously examined otolith development in teleost larvae reared under
442 acidified conditions, and despite differences in methodology and model species, it is possible to
443 draw comparisons to our own work. Notably, Munday et al.’s (2011b) study species (Amphiprion
444 percula) enables intragenus comparison with A. clarkii. Our results are consistent with those of
445 Munday et al. (2011b) and several others (Checkley et al., 2009; Bignami et al., 2013a,b, 2014;
446 Maneja et al., 2013; Pimentel et al., 2014; Réveillac et al., 2015; Schade et al., 2014; Shen et al.,
447 2016; Faria et al. 2017; Coll-Lladó et al. 2018) in that we also observed larger sagittal area at
448 elevated seawater pCO2. However, Munday et al. (2011b) observed growth in left sagittae only,
449 whereas we observed growth in both sagittae. Our results are further consistent with six of those
450 studies (Bignami et al., 2013a,b, 2014; Maneja et al., 2013, Shen et al., 2016; Coll-Lladó et al.
451 2018) in that we not only observed larger sagittae but also larger lapilli at elevated pCO2
452 (although we observed greater area in left lapilli only). Regarding otolith shape: our results are
453 consistent with five studies (Maneja et al., 2013; Réveillac et al., 2015; Martins, 2017; Mirasole
454 et al., 2017, Coll-Lladó et al., 2018) in that we observed altered otolith shape at elevated pCO2,
455 albeit in left asterisci only (rather than sagittae and/or lapilli).
456 Some of the observed effects of seawater pCO2 on otolith development may be
457 consequences of acid-base regulation triggered by respiratory acidosis. Heuer and Grosell (2014)
458 reviewed the physiological impacts of elevated pCO2 on fishes, including those related to acid-
459 base balance and otolith calcification. Fishes are exceptional acid-base regulators, capable of
460 normalizing pH in hours to days following onset of exposure to CO2 concentrations more than
461 tripling the most extreme treatment investigated here (10,000+ atm). This is achieved primarily
462 by metabolic adjustment: blood plasma HCO3- is absorbed/retained and H+ excreted by
463 modulating rates of transport across the gill epithelium. However, extracellular pCO2 and HCO3-
464 remain elevated following pH adjustment, and excess HCO3- is imported to the endolymph
465 where it becomes substrate for CO32- aggregation. Hydration of excess CO2 within the saccular
466 endolymph may further increase endolymph [HCO3-]. This may explain enhanced otolith size /
467 growth rate in response to elevated seawater pCO2 observed previously (Checkley et al., 2009;
468 Munday et al., 2011b; Bignami et al., 2013a,b, 2014; Maneja et al., 2013; Pimentel et al., 2014;
469 Schade et al., 2014; Réveillac et al., 2015; Shen et al., 2016; Faria et al., 2017; Mirasole et al.,
470 2017; Coll-Lladó et al., 2018): blood plasma HCO3- retained to buffer respiratory acidosis moves
471 into the endolymph, increasing endolymph [HCO3-] and CO3
2- incorporation into the otoliths,
472 thus enhancing net otolith calcification (Checkley et al., 2009; Munday et al., 2011b; Heuer and
473 Grosell, 2014). This may explain the increasing area, perimeter, and lateral development that we
474 observed in A. clarkii.
475
476 Otolith Function: Hypotheses and Speculation:
477

478 Since otoliths are critical components of the ears and vestibular organs (Fekete, 2003;
479 Moyle and Cech, 2004), and since otolith asymmetry impairs hearing and kinesthesia in some
480 fishes (Lychakov and Rebane, 2005; Gagliano et al., 2008; Anken et al., 2017), researchers have
481 expressed concern that ocean acidification-driven changes to otolith development may challenge
482 sensory perception in teleosts (Munday et al., 2011b; Bignami et al., 2013b, 2014; Pimentel et
483 al., 2014; Schade et al., 2014; Mu et al., 2015; Réveillac et al., 2015; Shen et al., 2016; Faria et
484 al., 2017; Martino et al., 2017; Martins, 2017; Mirasole et al., 2017; Coll-Lladó et al., 2018;
485 Jarrold and Munday, 2018). Available evidence supporting these hypotheses is limited to
486 theoretical models and rare experimental evidence outside the context of ocean acidification, but
487 pending more conclusive analyses, this evidence warrants review. Although speculative, altered
488 auditory/vestibular sensitivity could influence the ability of a fish to identify desirable habitat,
489 detect prey and predators, perceive changes to water flow, and maintain kinesthetic awareness,
490 all of which are important to larvae survival (Oxman et al., 2007; Bignami et al., 2013b). Fish
491 that are differentially sensitive to sound and/or kinesthesia due to ocean acidification-altered
492 otoliths could experience selective mortality from associated vectors, similar to how differential
493 behavior due to ocean acidification is associated with selective mortality from predation in
494 juvenile reef fish (Munday et al., 2012).
495 Hearing: Bignami et al. (2013b) observed increased sagittae and lapilli mass, volume,
496 and density in larval Rachycentron canadum at elevated seawater pCO2, and created a
497 mathematical model demonstrating increased displacement amplitude of sagittae, altering
498 maculae deformation thresholds and enabling detection of otherwise undetectable sounds.
499 Contrary to the hypothesis that larger sagittae would enhance hearing, however, larger sagittae
500 were associated with hearing impairment in juvenile red drum (Sciaenops ocellatus); those with
501 abnormally large sagittae failed to respond to acoustic stimuli at all (Browning et al., 2012). This
502 is probably because Sciaenops ocellatus sagittal mass remained constant despite greater volume
503 (Browning et al., 2012), whereas R. canadum otolith mass increased with volume (Bignami et
504 al., 2013b): entering Browning et al.’s mass and volume data into Bignami et al.’s equation for
505 calculating otolith displacement magnitude yields a 50% lesser displacement for abnormally
506 large Sciaenops ocellatus sagittae relative to normal sagittae – perhaps enough to reduce hearing
507 sensitivity below behavioral response thresholds. This hypothesis is supported by the observation
508 that Chinook salmon (Oncorhynchus tshawytscha) with at least one larger, less dense, vateritic

509 sagitta exhibited dramatically reduced hearing sensitivity relative to those with aragonitic
510 sagittae of equal mass (Oxman et al., 2007), and the calculation that Atlantic salmon (Salmo
511 salar) with vateritic sagittae lose otolith oscillation amplitude progressively according to degree
512 of vaterite replacement (Reimer et al., 2016). In summary, factors influencing an otolith’s
513 density, including CaCO3 polymorph and proportion of CaCO3/protein, are probably better
514 predictors of auditory/vestibular sensitivity than otolith size alone. While neither this study nor
515 one other (Munday et al., 2011b) observed evidence of vaterite replacement in otoliths at
516 elevated seawater pCO2, a recent study (Coll-Lladó et al., 2018) observed calcite replacement in
517 larval gilthead sea bream (Sparus aurata) sagittae and lapilli at elevated pCO2. Like vaterite,
518 calcite is a CaCO3 polymorph less dense than aragonite (Filho et al., 2014), so ocean
519 acidification-induced calcite replacement could similarly impair hearing in teleosts.
520 Kinesthesia: Besides auditory sensitivity, ocean acidification impacts on otolith
521 morphology or composition have the potential to interfere with vestibular sensitivity: increasing
522 otolith mass as evidenced by increasing area, perimeter, and lateral development could alter
523 displacement amplitude and impact gravisense. It is reasonable to suggest that altered gravisense
524 could challenge any teleost behavior involving movement, including hunting, predator
525 avoidance, and lateralization in the water column; indeed, it could manifest as listless or kinetotic
526 behavior akin to that observed in fishes reared under reduced gravity (Anken et al., 1998; Anken
527 and Rahmann, 1999; Beier, 1999; Hilbig et al., 2002; Anken et al., 2017). However, evidence for
528 these hypotheses is even more limited and speculative than that related to auditory sensitivity.
529 Notably, larval Mozambique tilapia (Oreochromis mossambicus) with area-asymmetric lapilli
530 were more susceptible to kinetoses under high quality microgravity than those with symmetric
531 lapilli (Anken et al., 2017). Bignami et al. (2013a, 2014) observed increased sagittae and lapilli
532 area and wider initial growth increments in larval R. canadum at elevated pCO2, as well as
533 overall larger sagittae and lapilli in larval Coryphaena hippurus, but did not observe compelling
534 effects on swimming activity or critical swimming speed – metrics related to vestibular function
535 – in either. Shen et al. (2016) observed increased sagittae and lapilli area under elevated pCO2,
536 but did not observe effects on gain or phase shift related to the vestibulo-ocular reflex. However,
537 neither Shen et al. nor Bignami et al. investigated otolith asymmetry. Since pCO2 influenced A.
538 clarkii lapilli and asterisci according to different metrics depending on side, we speculate effects
539 on gravisense in A. clarkii and other species exhibiting otolith asymmetry, as in Anken et al.

540 (2017), from ocean acidification. More research concurrently investigating fish kinesthesia and
541 ocean acidification impacts on otolith condition and asymmetry is needed to explore this
542 hypothesis.
543 Behavior: There is some empirical evidence linking anomalous otolith morphology to
544 anomalous fish behavior, presumably following from sensory interference. Juvenile Sciaenops
545 ocellatus that were hearing-impaired due to abnormally large sagittae exhibited greater visual
546 acuity than those with normal sagittae, as measured by response to visual stimuli; Browning et
547 al. (2012) attributed this to sensory compensation. Further, these specimens exhibited higher
548 cortisol levels, indicating greater stress; this was attributed to a heightened startle response upon
549 capture due to hearing impairment. Finally, the same specimens exhibited less schooling
550 behavior, although it is unclear if this is attributable to sagittal size. Among the available studies
551 that investigated ocean acidification impacts on otolith condition, few concurrently investigated
552 real-world fish behavior or response to sensory cues, and those that did were unable to link them;
553 studies either observed impacts on otolith condition without observing impacts on behavior
554 (Bignami et al., 2013a,2014), observed impacts on behavior (i.e., impaired avoidance of reef
555 noise) without observing impacts on otolith condition (Simpson et al., 2011), or observed
556 impacts on neither behavior (i.e., predator recognition) nor otolith condition (Cattano et al.,
557 2017). Given that impacts on otolith condition and fish behavior have been observed in several
558 species, but never simultaneously, research that observes both and tests for correlation between
559 them is needed to investigate hypotheses that the former influences the latter. Nevertheless, we
560 hypothesize that the observed effects of pCO2 on otolith development in A. clarkii could impact
561 sensory perception and behavior in ways similar to those described above. Behavioral anomalies
562 linked to ocean acidification effects on neurotransmitter function in teleosts (Nilsson et al., 2012;
563 Hamilton et al., 2013; Chivers et al., 2014; Heuer and Grosell, 2014; Lai et al., 2015) do not
564 preclude this hypothetical challenge to teleost fitness; it is a different cause-effect pathway
565 altogether, and may intensify or moderate these anomalies.
566
567 Lateral Development and Surface Roughness:
568
569 In addition to corroborating reports of otolith growth along the x and y axes (i.e.,
570 increasing area and perimeter) in young teleosts in response to increasing seawater pCO2, we

571 observed evidence for pCO2-induced otolith growth along the z-axis (i.e., upward growth from
572 the lateral face) in A. clarkii. Lateral development appears most conspicuous in sagittae, and
573 linked to treatment in sagittae and right lapilli, although we observed it in asterisci as well. While
574 lateral development occurs on the lateral face, which does not directly interact with maculae, it is
575 possible this CaCO3 aggregation will increase otolith mass at a magnitude greater than that
576 which is evident from increased 2-dimensional area and perimeter. Thus, sagittae exhibiting
577 advanced lateral development may have a wider displacement amplitude independent of area and
578 perimeter, enhancing auditory sensitivity as in Bignami et al. (2013b). Indeed, the
579 proportionately larger increase in sagittal and lapillar volume vs. area observed by Bignami et al.
580 (2013b) at elevated seawater pCO2 (as evidenced by increased area and volume but decreased
581 surface-area-to-volume ratio) could conceivably be attributed to lateral development, if not
582 regular growth. This hypothesis is independent of otolith composition, for which we observed no
583 evidence of having changed, but which undermined auditory sensitivity in some studies (Oxman
584 et al., 2007; Browning et al., 2012; Reimer et al., 2016). Also, since lateral development appears
585 to occur on only one face of the otolith (though the medial face was not investigated here, all
586 otoliths were imaged convex-side up, which was invariably the lateral face), its center of mass
587 likely changes as well, with unknown consequences for otic mechanics. Changing otolith shape
588 as evidenced by decreasing circularity in left asterisci could similarly affect maculae deformation
589 thresholds, further impacting auditory sensitivity (Oxman et al., 2007).
590 Some of our otoliths appear visibly smooth on the surface, while others appear rougher
591 due to the exposure of aragonite table edges and similar crystal activity. Estimating percent
592 visible crystals is akin to estimating otolith surface roughness. Our observation that percent
593 visible crystals increased with increasing pCO2 in sagittae, right lapilli, and left asterisci is
594 consistent with the characterization of rough-type otoliths as abnormal in other species (Béarez
595 et al., 2005; Ma et al., 2008; Browning et al., 2012). Increasing roughness could be a symptom of
596 haphazard CaCO3 aggregation, evidence of modified protein matrix deposition, or a snapshot of
597 an evolving CaCO3 crystal habit/polymorph baseline. While roughness seems unlikely to affect
598 otolith displacement amplitude, it could conceivably affect otic mechanics on its own. In several
599 species of catfishes including the upside-down catfish (Synodontis nigriventris), it was observed
600 that otoliths are rough on the ventral end only, driving maculae deformation by hooking them to
601 the otolith surface (Ohnishi et al., 2002). Should it occur on the macula-oriented medial face as

602 with the lateral face, ocean acidification-induced otolith roughness could improve maculae grip,
603 altering auditory and vestibular sensitivity. Furthermore, maculae could conceivably adhere to
604 regions of the otolith surface that are normally smooth, deforming them in unusual ways and
605 impacting sensory perception. However, these hypotheses are very speculative - more research
606 concurrently investigating fish behavior, ocean acidification-induced otolith roughness, and
607 maculae displacement is needed to explore this hypothesis.
608
609 CONCLUSIONS
610
611 Our work corroborates evidence of otolith growth and altered shape with increasing pCO2
612 reported for other taxa in a novel taxon, Amphiprion clarkii. In addition, we report evidence of
613 increasing otolith lateral development and surface roughness with increasing pCO2. Impacts were
614 observed in all otolith types, including the previously uninvestigated asterisci. We investigated
615 each otolith type and side independently, observing asymmetrical responses to pCO2 in lapilli
616 and asterisci. Our experimental design and analysis facilitated construction of pCO2 dose-
617 response curves, which we created for all otolith types and sides in A. clarkii excepting right
618 asterisci. These curves outline changes to multiple morphometric and mineralogical variables
619 and may be leveraged to predict responses to pCO2 conditions not investigated here. We
620 speculate that these responses could impact auditory and/or vestibular sensitivity in teleosts,
621 adding to previous observations and hypotheses involving sagittae and lapilli. In summary, our
622 work adds to the existing knowledge base regarding otolith response to ocean acidification,
623 which may aid in predicting and preserving teleost fitness in the near-future ocean.
624
625 ACKNOWLEDGMENTS
626
627 We would like to acknowledge Bill Robinson, Meng Zhou, Solange Brault, and Gene Gallagher
628 for advice and guidance; Bryanna Broadaway, Alex Eisen-Cuadra, Ashley Bulseco-McKim,
629 Jeremy Williams, Katie Flanders, and Nicole Henderson for assistance and support; and
630 undergraduates from Roger Williams University who assisted with the experimental trial and
631 data collection: Kristen Kiefer, Shawna Chamberlin, Jackie Mitchell, Drew Canfield, Allex
632 Gourlay, and Matt Muscara.

633 REFERENCES
634
635 Anken, R. H. and Rahmann, H. (1999). Effect of altered gravity on the neurobiology of fish.
636 Naturwissenschaften 86, 155–167.
637 Anken, R. H., Ibsch, M. and Rahmann, H. (1998). Neurobiology of fish under altered gravity
638 conditions. Brain Res. Rev. 28, 9–18.
639 Anken, R., Knie, M. and Hilbig, R. (2017). Inner ear otolith asymmetry in late-larval cichlid
640 fish (Oreochromis mossambicus, Perciformes) showing kinetotic behaviour under
641 diminished gravity. Sci. Rep. 7, 15630.
642 Béarez, P., Carlier, G., Lorand, J. P. and Parodi, G. C. (2005). Destructive and non-
643 destructive microanalysis of biocarbonates applied to anomalous otoliths of archaeological
644 and modern sciaenids (Teleostei) from Peru and Chile. Comptes Rendus - Biol. 328, 243–
645 252.
646 Beier, M. (1999). On the influence of altered gravity on the growth of fish inner ear otoliths.
647 Acta Astronaut. 44, 585–591.
648 Bignami, S., Sponaugle, S. and Cowen, R. K. (2013a). Response to ocean acidification in
649 larvae of a large tropical marine fish, Rachycentron canadum. Glob. Chang. Biol. 19, 996–
650 1006.
651 Bignami, S., Enochs, I. C., Manzello, D. P., Sponaugle, S. and Cowen, R. K. (2013b). Ocean
652 acidification alters the otoliths of a pantropical fish species with implications for sensory
653 function. Proc. Natl. Acad. Sci. 110, 7366–7370.
654 Bignami, S., Sponaugle, S. and Cowen, R. K. (2014). Effects of ocean acidification on the
655 larvae of a high-value pelagic fisheries species, Mahi-mahi Coryphaena hippurus. Aquat.
656 Biol. 21, 249–260.
657 Boulos, R. A., Zhang, F., Tjandra, E. S., Martin, A. D., Spagnoli, D. and Raston, C. L.
658 (2015). Spinning up the polymorphs of calcium carbonate. Sci. Rep. 4, 3616.
659 Browning, Z. S., Wilkes, A. A., Moore, E. J., Lancon, T. W. and Clubb, F. J. (2012). The
660 effect of otolith malformation on behavior and cortisol levels in juvenile red drum fish
661 (Sciaenops ocellatus). Comp. Med. 62, 251–256.
662 Byrne, R. H. (1987). Standardization of standard buffers by visible spectrometry. Anal. Chem.
663 59, 1479–1481.

664 Caldeira, K. and Wickett, M. E. (2003). Oceanography: anthropogenic carbon and ocean pH.
665 Nature 425, 365–365.
666 Cattano, C., Calò, A., Di Franco, A., Firmamento, R., Quattrocchi, F., Sdiri, K., Guidetti,
667 P. and Milazzo, M. (2017). Ocean acidification does not impair predator recognition but
668 increases juvenile growth in a temperate wrasse off CO2 seeps. Mar. Environ. Res. 132, 33–
669 40.
670 Checkley, D. M., Dickson, A. G., Takahashi, M., Radich, J. A., Eisenkolb, N. and Asch, R.
671 (2009). Elevated CO2 enhances otolith growth in young fish. Science (80-. ). 324, 1683–
672 1683.
673 Chivers, D. P., Mccormick, M. I., Nilsson, G. E., Munday, P. L., Watson, S. A., Meekan, M.
674 G., Mitchell, M. D., Corkill, K. C. and Ferrari, M. C. O. (2014). Impaired learning of
675 predators and lower prey survival under elevated CO2: a consequence of neurotransmitter
676 interference. Glob. Chang. Biol. 20, 515–522.
677 Coll-Lladó, C., Giebichenstein, J., Webb, P. B., Bridges, C. R. and De La Serrana, D. G.
678 (2018). Ocean acidification promotes otolith growth and calcite deposition in gilthead sea
679 bream (Sparus aurata) larvae. Sci. Rep. 8, 1–10.
680 Doney, S. C., Fabry, V. J., Feely, R. A. and Kleypas, J. A. (2009). Ocean acidification: the
681 other CO2 problem. Ann. Rev. Mar. Sci. 1, 169–192.
682 Esbaugh, A. J., Heuer, R. and Grosell, M. (2012). Impacts of ocean acidification on
683 respiratory gas exchange and acid-base balance in a marine teleost, Opsanus beta. J. Comp.
684 Physiol. B Biochem. Syst. Environ. Physiol. 182, 921–934.
685 Fabry, V. J., Seibel, B. A., Feely, R. A., Fabry, J. C. O. and Fabry, V. J. (2008). Impacts of
686 ocean acidification on marine fauna and ecosystem processes. ICES J. Mar. Sci. 65, 414–
687 432.
688 Faria, A. M., Filipe, S., Lopes, A. F., Oliveira, A. P., Gonçalves, E. J. and Ribeiro, L. (2017).
689 Effects of high pCO2 on early life development of pelagic spawning marine fish. Mar.
690 Freshw. Res. 68.
691 Fekete, D. M. (2003). Rocks that roll zebrafish. Science 302, 241–2.
692 Nakamura Filho, A., Almeida, A. C. de, Riera, H. E., Araújo, J. L. F. de, Gouveia, V. J. P.,
693 Carvalho, M. D. de and Cardoso, A. V. (2014). Polymorphism of CaCO3 and
694 microstructure of the shell of a Brazilian invasive mollusc (Limnoperna fortunei). Mater.

695 Res. 17, 15–22.
696 Franke, A. and Clemmesen, C. (2011). Effect of ocean acidification on early life stages of
697 Atlantic herring (Clupea harengus L.). Biogeosciences 8, 3697–3707.
698 Froese, R. and Pauly, D. (2018). Fishbase. FishBase.
699 Frommel, A. Y., Schubert, A., Piatkowski, U. and Clemmesen, C. (2013). Egg and early
700 larval stages of Baltic cod, Gadus morhua, are robust to high levels of ocean acidification.
701 Mar. Biol. 160, 1825–1834.
702 Gagliano, M., Depczynski, M., Simpson, S. D. and Moore, J. A. (2008). Dispersal without
703 errors: symmetrical ears tune into the right frequency for survival. Proc. R. Soc. B Biol. Sci.
704 275, 527–534.
705 Gattuso, J. and Buddemeier, R. W. (2000). Calcification and CO2. Nature 407, 311–313.
706 Gaylord, B., Kroeker, K. J., Sunday, J. M., Anderson, K. M., Barry, J. P., Brown, N. E.,
707 Connell, S. D., Dupont, S., Fabricius, K. E., Hall-Spencer, J. M., et al. (2015). Ocean
708 acidification through the lens of ecological theory. Ecology 96, 3–15.
709 Grosell, M. (2011). Intestinal anion exchange in marine teleosts is involved in osmoregulation
710 and contributes to the oceanic inorganic carbon cycle. Acta Physiol. (Oxf). 202, 421–434.
711 Hamilton, T. J., Holcombe, A. and Tresguerres, M. (2013). CO2-induced ocean acidification
712 increases anxiety in Rockfish via alteration of GABAA receptor functioning. Proc. R. Soc. B
713 Biol. Sci. 281, 20132509–20132509.
714 Hendriks, I. E., Duarte, C. M. and Álvarez, M. (2010). Vulnerability of marine biodiversity to
715 ocean acidification: a meta-analysis. Estuar. Coast. Shelf Sci. 86, 157–164.
716 Heuer, R. M. and Grosell, M. (2014). Physiological impacts of elevated carbon dioxide and
717 ocean acidification on fish. AJP Regul. Integr. Comp. Physiol. 307, R1061–R1084.
718 Hilbig, R., Anken, R. H., Sonntag, G., Höhne, S., Henneberg, J., Kretschmer, N. and
719 Rahmann, H. (2002). Effects of altered gravity on the swimming behaviour of fish. Adv.
720 Sp. Res. 30, 835–841.
721 Hurst, T. P., Fernandez, E. R., Mathis, J. T., Miller, J. A., Stinson, C. M. and Ahgeak, E. F.
722 (2012). Resiliency of juvenile walleye pollock to projected levels of ocean acidification.
723 Aquat. Biol. 17, 247–259.
724 IPCC (2013). Climate Change 2013: The Physical Science Basis. Contribution of Working
725 Group I to the Fifth Assessment Report of the Intergovernmental Panel on Climate Change.

726 (ed. Stocker, T. F.), Qin, D.), Plattner, G.-K.), Tignor, M.), Allen, S. K.), Boschung, J.),
727 Nauels, A.), Xia, Y.), V., B.), and P.M., M.).
728 Ishimatsu, A., Kikkawa, T., Hayashi, M., Lee, K.-S. and Kita, J. (2004). Effects of CO2 on
729 marine fish: larvae and adults. J. Oceanogr. 60, 731–741.
730 Ishimatsu, A., Hayashi, M. and Kikkawa, T. (2008). Fishes in high-CO2, acidified oceans.
731 Mar. Ecol. Prog. Ser. 373, 295–302.
732 Jarrold, M. D. and Munday, P. L. (2018). Diel CO2 cycles do not modify juvenile growth,
733 survival and otolith development in two coral reef fish under ocean acidification. Mar. Biol.
734 165, 1–12.
735 Kikkawa, T., Ishimatsu, A. and Kita, J. (2003). Acute CO2 tolerance during the early
736 developmental stages of four marine teleosts. Environ. Toxicol. 18, 375–382.
737 Kikkawa, T., Kita, J. and Ishimatsu, A. (2004). Comparison of the lethal effect of CO2 and
738 acidification on red sea bream (Pagrus major) during the early developmental stages. Mar.
739 Pollut. Bull. 48, 108–110.
740 Kroeker, K. J., Micheli, F. and Gambi, M. C. (2012). Ocean acidification causes ecosystem
741 shifts via altered competitive interactions. Nat. Clim. Chang. 3, 156–159.
742 Kroeker, K. J., Kordas, R. L., Crim, R., Hendriks, I. E., Ramajo, L., Singh, G. S., Duarte,
743 C. M. and Gattuso, J. P. (2013). Impacts of ocean acidification on marine organisms:
744 quantifying sensitivities and interaction with warming. Glob. Chang. Biol. 19, 1884–1896.
745 Lai, F., Jutfelt, F. and Nilsson, G. E. (2015). Altered neurotransmitter function in CO2-exposed
746 stickleback (Gasterosteus aculeatus): a temperate model species for ocean acidification
747 research. Conserv. Physiol. 3, 1-6.
748 Le Quéré, C., Takahashi, T., Buitenhuis, E. T., Rödenbeck, C. and Sutherland, S. C. (2010).
749 Impact of climate change and variability on the global oceanic sink of CO2. Global
750 Biogeochem. Cycles 24, n/a-n/a.
751 Lychakov, D. V. and Rebane, Y. T. (2005). Fish otolith mass asymmetry: Morphometry and
752 influence on acoustic functionality. Hear. Res. 201, 55–69.
753 Ma, T., Kuroki, M., Miller, M. J., Ishida, R. and Tsukamoto, K. (2008). Morphology and
754 microchemistry of abnormal otoliths in the ayu, Plecoglossus altivelis. Environ. Biol. Fishes
755 83, 155–167.
756 Maneja, R. H., Frommel, A. Y., Geffen, A. J., Folkvord, A., Piatkowski, U., Chang, M. Y.

757 and Clemmesen, C. (2013). Effects of ocean acidification on the calcification of otoliths of
758 larval Atlantic cod Gadus morhua. Mar. Ecol. Prog. Ser. 477, 251–258.
759 Martino, J., Doubleday, Z. A., Woodcock, S. H. and Gillanders, B. M. (2017). Elevated
760 carbon dioxide and temperature affects otolith development, but not chemistry, in a
761 diadromous fish. J. Exp. Mar. Bio. Ecol. 495, 57–64.
762 Martins, S. I. G. (2017). Impacts of CO2-induced ocean acidification on predator detection
763 ability and developementof temperate fish. PhD thesis, ISPA - Instituto Universitário de
764 Ciências Psicológicas, Sociais e da Vida, Lisboa, Portugal.
765 Mikaloff Fletcher, S. E., Gruber, N., Jacobson, A. R., Doney, S. C., Dutkiewicz, S., Gerber,
766 M., Follows, M., Joos, F., Lindsay, K., Menemenlis, D., et al. (2006). Inverse estimates of
767 anthropogenic CO2 uptake, transport, and storage by the ocean. Global Biogeochem. Cycles
768 20, 1–16.
769 Millero, F. J., Zhang, J. Z., Fiol, S., Sotolongo, S., Roy, R. N., Lee, K. and Mane, S. (1993).
770 The use of buffers to measure the pH of seawater. Mar. Chem. 44, 143–152.
771 Mirasole, A., Gillanders, B. M., Reis-Santos, P., Grassa, F., Capasso, G., Scopelliti, G.,
772 Mazzola, A. and Vizzini, S. (2017). The influence of high pCO2 on otolith shape, chemical
773 and carbon isotope composition of six coastal fish species in a Mediterranean shallow CO2
774 vent. Mar. Biol. 164, 1–15.
775 Moyle, P. B. and Cech, J. J. (2004). Fishes, An Introduction to Ichtyology. 5th ed. (ed. Lee, C.),
776 Chung, T.), Kuhl, M.), and Bradley, K.) San Francisco: Pearson Benjamin Cummings.
777 Mu, J., Jin, F., Wang, J., Zheng, N., Cong, Y. and Wang, J. Y. (2015). Effects of CO2-driven
778 ocean acidification on early life stages of marine medaka (Oryzias melastigma).
779 Biogeosciences 12, 3861–3868.
780 Munday, P. L., Jones, G. P., Pratchett, M. S. and Williams, A. J. (2008). Climate change and
781 the future for coral reef fishes. Fish Fish. 9, 261–285.
782 Munday, P. L., Crawley, N. E. and Nilsson, G. E. (2009). Interacting effects of elevated
783 temperature and ocean acidification on the aerobic performance of coral reef fishes. Mar.
784 Ecol. Prog. Ser. 388, 235–242.
785 Munday, P. L., Gagliano, M., Donelson, J. M., Dixson, D. L. and Thorrold, S. R. (2011a).
786 Ocean acidification does not affect the early life history development of a tropical marine
787 fish. Mar. Ecol. Prog. Ser. 423, 211–221.

788 Munday, P. L., Hernaman, V., Dixson, D. L. and Thorrold, S. R. (2011b). Effect of ocean
789 acidification on otolith development in larvae of a tropical marine fish. Biogeosciences 8,
790 1631–1641.
791 Munday, P. L., McCormick, M. I., Meekan, M. G., Dixson, D. L., Watson, S., Ferrari, M.
792 C. O. and Chivers, D. P. (2012). Selective mortality associated with variation on CO2
793 tolerance in a marine fish. Ocean Acidif. 1, 1–5.
794 Nilsson, G. E., Dixson, D. L., Domenici, P., McCormick, M. I., Sørensen, C., Watson, S.-A.
795 and Munday, P. L. (2012). Near-future carbon dioxide levels alter fish behaviour by
796 interfering with neurotransmitter function. Nat. Clim. Chang. 2, 201–204.
797 Norman, G. (2010). Likert scales, levels of measurement and the “laws” of statistics. Adv. Heal.
798 Sci. Educ. 15, 625–632.
799 Ohnishi, K., Yamamoto, T., Ogawa, Y., Takahashi, A., Yamashita, M. and Ohnishi, T.
800 (2002). High transmittance of X-rays in the utricular otolith of upside-down swimming
801 catfish, Synodontis nigriventris. Biol. Sci. Space. 16, 18–21.
802 Orr, J. C., Fabry, V. J., Aumont, O., Bopp, L., Doney, S. C., Feely, R. A., Gnanadesikan,
803 A., Gruber, N., Ishida, A., Joos, F., et al. (2005). Anthropogenic ocean acidification over
804 the twenty-first century and its impact on calcifying organisms. Nature 437, 681–686.
805 Oxman, D. S., Barnett-Johnson, R., Smith, M. E., Coffin, A., Miller, D. L., Josephson, R.
806 and Popper, A. N. (2007). The effect of vaterite deposition on sound reception, ototlith
807 morphology, and inner ear sensory epithelia in hatchery-reared chinook salmon
808 (Oncorhynchus tshawytscha). Can. J. Fish. Aquat. Sci. 64, 1469–1478.
809 Panella, G. (1971). Fish otoliths: daily growth layers and periodical patterns. Science (80-. ).
810 173, 1124–1127.
811 Perry, D. M., Redman, D. H., Widman, J. C., Meseck, S., King, A. and Pereira, J. J. (2015).
812 Effect of ocean acidification on growth and otolith condition of juvenile scup, Stenotomus
813 chrysops. Ecol. Evol. 5, 4187–4196.
814 Pimentel, M. S., Faleiro, F., Dionisio, G., Repolho, T., Pousao-Ferreira, P., Machado, J. and
815 Rosa, R. (2014). Defective skeletogenesis and oversized otoliths in fish early stages in a
816 changing ocean. J. Exp. Biol. 217, 2062–2070.
817 Popper, A. N. and Fay, R. R. (1993). Sound detection and processing by fish: critical review
818 and major research questions. Brain. Behav. Evol.

819 Reimer, T., Dempster, T., Warren-Myers, F., Jensen, A. J. and Swearer, S. E. (2016). High
820 prevalence of vaterite in sagittal otoliths causes hearing impairment in farmed fish. Sci. Rep.
821 6, 25249.
822 Reimer, T., Dempster, T., Wargelius, A., Fjelldal, P. G., Hansen, T., Glover, K. A., Solberg,
823 M. F. and Swearer, S. E. (2017). Rapid growth causes abnormal vaterite formation in
824 farmed fish otoliths. J. Exp. Biol. 220, 2965–2969.
825 Réveillac, E., Lacoue-Labarthe, T., Oberhänsli, F., Teyssié, J. L., Jeffree, R., Gattuso, J. P.
826 and Martin, S. (2015). Ocean acidification reshapes the otolith-body allometry of growth
827 in juvenile sea bream. J. Exp. Mar. Bio. Ecol. 463, 87–94.
828 Ries, J. B., Cohen, A. L. and McCorkle, D. C. (2009). Marine calcifiers exhibit mixed
829 responses to CO2-induced ocean acidification. Geology 37, 1131–1134.
830 Schade, F. M., Clemmesen, C. and Mathias Wegner, K. (2014). Within- and transgenerational
831 effects of ocean acidification on life history of marine three-spined stickleback
832 (Gasterosteus aculeatus). Mar. Biol. 161, 1667–1676.
833 Seibel, B. A., Maas, A. E. and Dierssen, H. M. (2012). Energetic plasticity underlies a variable
834 response to ocean acidification in the pteropod, Limacina helicina antarctica. PLoS One 7,
835 e30464.
836 Shen, S. G., Chen, F., Schoppik, D. E. and Checkley, D. M. (2016). Otolith size and the
837 vestibulo-ocular reflex of larvae of white seabass Atractoscion nobilis at high pCO2. Mar.
838 Ecol. Prog. Ser. 553, 173–182.
839 Simpson, S. D., Munday, P. L., Wittenrich, M. L., Manassa, R., Dixson, D. L., Gagliano, M.
840 and Yan, H. Y. (2011). Ocean acidification erodes crucial auditory behaviour in a marine
841 fish. Biol. Lett. 7, 917–920.
842 Tomas, J. and Geffen, A. J. (2003). Morphometry and composition of aragonite and vaterite
843 otoliths of deformed laboratory reared juvenile herring from two populations. J. Fish Biol.
844 63, 1383–1401.
845 Victor, B. C. (1986). Delayed metamorphosis with reduced larval growth in a coral reef fish
846 (Thalassoma bifasciatum). Can. J. Fish. Aquat. Sci. 43, 1208–1213.
847 Wallace, R. B., Baumann, H., Grear, J. S., Aller, R. C. and Gobler, C. J. (2014). Coastal
848 ocean acidification: The other eutrophication problem. Estuar. Coast. Shelf Sci. 148, 1–13.
849 Wilcox-Freeburg, E. D. (2014). Exploring the link between otolith growth and function along

850 the biological continuum in the context of ocean acidification. PhD thesis, University of
851 Massachusetts Boston, Boston, MA.
852 Wilcox-Freeburg, E., Rhyne, A., Robinson, W. E., Tlusty, M., Bourque, B. and Hannigan,
853 R. E. (2013). A comparison of two pH-stat carbon dioxide dosing systems for ocean
854 acidification experiments. Limnol. Oceanogr. Methods 11, 485–494.
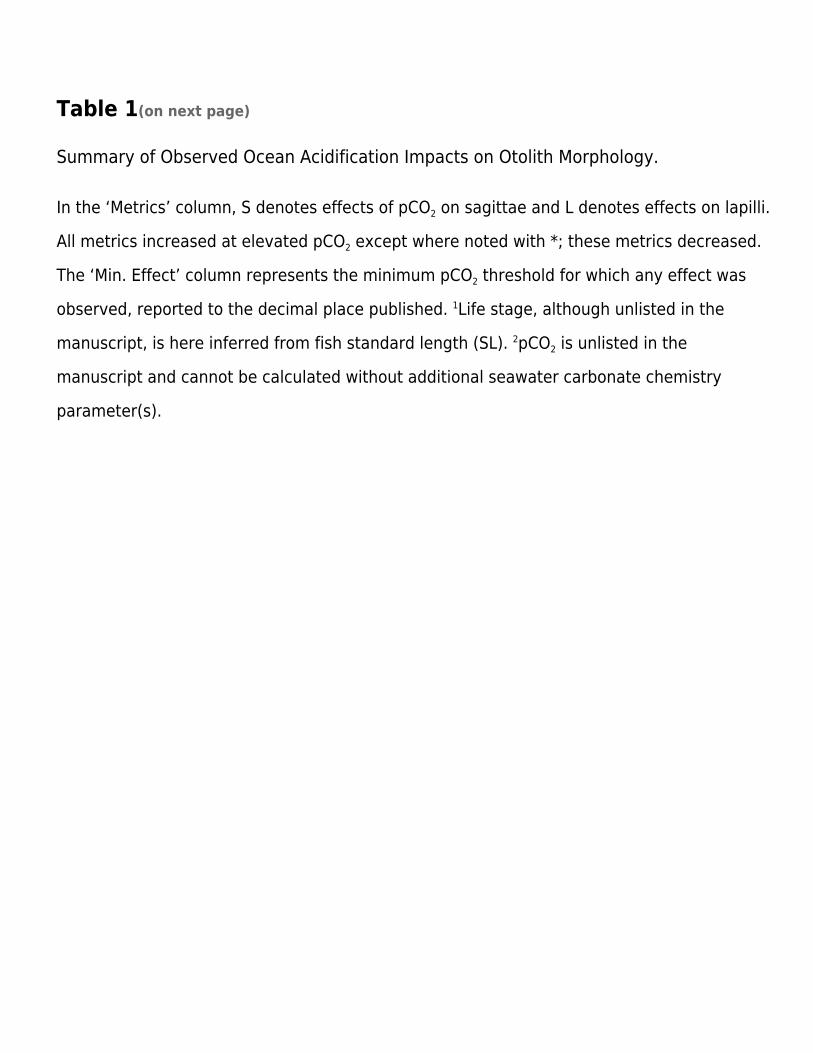
Table 1(on next page)
Summary of Observed Ocean Acidification Impacts on Otolith Morphology.
In the ‘Metrics’ column, S denotes effects of pCO2 on sagittae and L denotes effects on lapilli.
All metrics increased at elevated pCO2 except where noted with *; these metrics decreased.
The ‘Min. Effect’ column represents the minimum pCO2 threshold for which any effect was
observed, reported to the decimal place published. 1Life stage, although unlisted in the
manuscript, is here inferred from fish standard length (SL). 2pCO2 is unlisted in the
manuscript and cannot be calculated without additional seawater carbonate chemistry
parameter(s).

Citation Species Life Stage Metrics Min. Effect
(atm)
Checkley et al. 2009 Atractoscion nobilis Larval S Area 993
Munday et al. 2011b Amphiprion percula Larval S Area, Length 1721.4
Hurst et al. 2012 Theragra chalcogramma Juvenile S Mean Incr. Width 478
Bignami et al. 2013a,b Rachycentron canadum Larval S Mass; S,L Area, Vol.,
Dens., Area/Vol.*
800
Maneja et al. 2013 Gadus morhua Larval S,L Area; S Roundness;
L Roundness*
1800
Bignami et al. 2014 Coryphaena hippurus Larval S,L Area 1190
Pimentel et al. 2014 Solea senegalensis Larval S Area 1600
Schade et al. 2014 Gasterosteus aculeatus Juvenile S Area 1167
Mu et al. 2015 Oryzias melastigma Larval S Area* 2372.6
Réveillac et al. 2015 Sparus aurata Juvenile S Calc. Rate, Area/TL,
Roundness*
726
Shen et al. 2016 Atractoscion nobilis Larval S,L Area 2500
Faria et al. 2017 Argyrosomus regius Larval S Area, Perimeter,
Width
1900
Diplodus sargus Larval S Area, Perimeter 1100
Solea senegalensis Larval S Area, Perimeter 1900
Martins 2017 Lepadogaster
lepadogaster
Larval S Roundness 1541.68
Mirasole et al. 2017 Diplodus vulgaris Juvenile1 S Shape, Relative
Length
pH 7.82
Gobius bucchichi Adult1 S Shape pH 7.82
Coll-Lladó et al. 2018 Sparus aurata Larval S,L Area, Perimeter,
Shape Irregularity
1159
1

Table 2(on next page)
Seawater carbonate chemistry parameters.
Values represent aquaria means (n = 3 for each treatment); standard deviations listed in
parentheses for measured parameters.

Treatment
(pHT)
S (ppt) T (C) AT (mol
kg-1)
DIC (mol
kg-1)
pCO2
(atm)
Ar
8.16 (0.04) 35.00
(0.30)
28.20
(0.40)
2440
(147)
2018 299.4 4.84
7.80 (0.01) 35.00
(0.30)
28.20
(0.40)
2440
(152)
2237 825.5 2.54
7.60 (0.01) 35.00
(0.30)
28.30
(0.40)
2432
(140)
2318 1384.3 1.70
7.30 (0.01) 35.00
(0.30)
28.20
(0.40)
2418
(140)
2415 2897.0 0.89
1

Table 3(on next page)
Fish condition statistics.
Mortality and settlement values are means of all replicate aquaria percentages (n = 3 for
each treatment); standard deviations listed in parentheses. Standard length values are
combined means of all replicate aquaria means (n = 3 for each treatment); pooled standard
deviations listed in parentheses.

pH Treatment Mortality (%) Settlement (%) Standard Length
(mm)
8.16 34 (24) 90 (6) 6.82 (0.26)
7.80 55 (4) 98 (3) 6.74 (0.29)
7.60 44 (8) 75 (9) 6.69 (0.25)
7.30 49 (34) 82 (5) 6.42 (0.19)
1

Table 4(on next page)
Otolith condition statistics.
Values are combined means of all replicate aquaria means (n = 3 for each treatment); pooled
standard deviations listed in parentheses. Circularity is a dimensionless ratio. Lateral
development is estimated on a scale of 1 (least developed) to 5 (most developed). Percent
visible crystals is estimated on a scale of 5-50% visible crystals (i.e., surface area coverage).
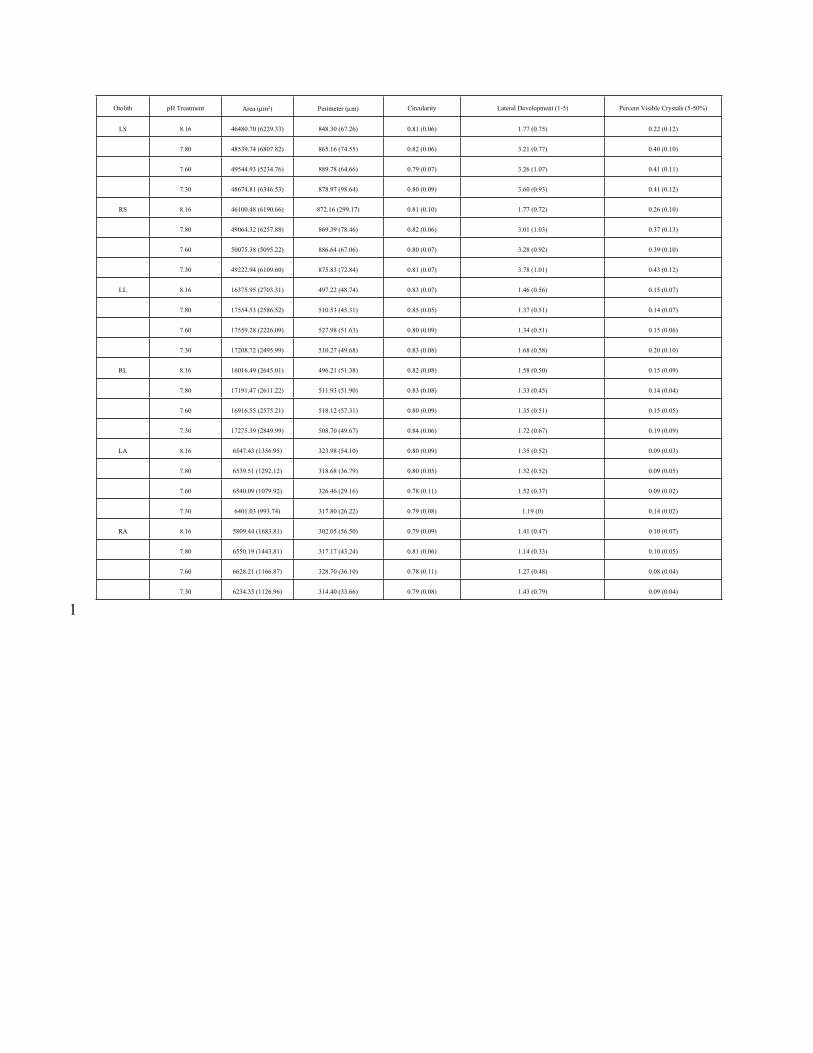
Otolith pH Treatment Area (m2) Perimeter (m) Circularity Lateral Development (1-5) Percent Visible Crystals (5-50%)
LS 8.16 46480.70 (6229.33) 848.30 (67.26) 0.81 (0.06) 1.77 (0.75) 0.22 (0.12)
7.80 48539.74 (6807.82) 865.16 (74.55) 0.82 (0.06) 3.21 (0.77) 0.40 (0.10)
7.60 49544.93 (5234.76) 889.78 (64.66) 0.79 (0.07) 3.26 (1.07) 0.41 (0.11)
7.30 48674.81 (6346.53) 878.97 (98.64) 0.80 (0.09) 3.60 (0.93) 0.41 (0.12)
RS 8.16 46100.48 (6190.66) 872.16 (299.17) 0.81 (0.10) 1.77 (0.72) 0.26 (0.10)
7.80 49064.32 (6257.88) 869.39 (78.46) 0.82 (0.06) 3.01 (1.03) 0.37 (0.13)
7.60 50075.38 (5095.22) 886.64 (67.06) 0.80 (0.07) 3.28 (0.92) 0.39 (0.10)
7.30 49222.94 (6109.60) 875.83 (72.84) 0.81 (0.07) 3.78 (1.01) 0.43 (0.12)
LL 8.16 16375.95 (2703.31) 497.22 (48.74) 0.83 (0.07) 1.46 (0.56) 0.15 (0.07)
7.80 17554.53 (2586.52) 510.53 (45.31) 0.85 (0.05) 1.37 (0.51) 0.14 (0.07)
7.60 17559.28 (2226.09) 527.98 (51.63) 0.80 (0.09) 1.34 (0.51) 0.15 (0.06)
7.30 17208.72 (2495.99) 510.27 (49.68) 0.83 (0.08) 1.68 (0.58) 0.20 (0.10)
RL 8.16 16016.49 (2645.01) 496.21 (51.38) 0.82 (0.08) 1.58 (0.50) 0.15 (0.09)
7.80 17191.47 (2611.22) 511.93 (51.90) 0.83 (0.08) 1.33 (0.45) 0.14 (0.04)
7.60 16916.55 (2575.21) 518.12 (57.31) 0.80 (0.09) 1.35 (0.51) 0.15 (0.05)
7.30 17275.39 (2849.99) 508.70 (49.67) 0.84 (0.06) 1.72 (0.67) 0.19 (0.09)
LA 8.16 6547.43 (1356.95) 323.98 (54.10) 0.80 (0.09) 1.35 (0.52) 0.09 (0.03)
7.80 6539.51 (1292.12) 318.68 (36.79) 0.80 (0.05) 1.32 (0.52) 0.09 (0.05)
7.60 6540.09 (1079.92) 326.46 (29.16) 0.78 (0.11) 1.52 (0.37) 0.09 (0.02)
7.30 6401.03 (993.74) 317.80 (26.22) 0.79 (0.08) 1.19 (0) 0.14 (0.02)
RA 8.16 5809.44 (1683.81) 302.05 (56.50) 0.79 (0.09) 1.41 (0.47) 0.10 (0.07)
7.80 6550.19 (1443.81) 317.17 (43.24) 0.81 (0.06) 1.14 (0.33) 0.10 (0.05)
7.60 6628.21 (1166.87) 328.70 (36.10) 0.78 (0.11) 1.27 (0.48) 0.08 (0.04)
7.30 6234.35 (1126.96) 314.40 (33.66) 0.79 (0.08) 1.43 (0.79) 0.09 (0.04)
1

Table 5(on next page)
Component Variances and Loadings.
Loadings corresponding to various Amphiprion clarkii otolith morphological parameters, the
variance of which composes the rotated components in Fig. 2 and other components that we
excluded from the analysis. Also included are the variances associated with each component
and the total variance associated with components.

Otolith Component Variance
(%)
Area/SL Perimeter/SL Circularity Lateral
Development
Percent
Visible
Crystals
Left
Sagittae
RC1 48 0.63 0.39 0.09 0.97 0.94
RC2 37 0.62 0.84 -0.86 0.06 0.15
Total 85
Right
Sagittae
RC1 57 0.74 0.68 0.01 0.95 0.97
RC2 31 0.47 0.65 -0.94 0.09 -0.03
Total 88
Left
Lapilli
RC1 45 -0.10 -0.32 0.70 0.88 0.94
RC2 35 0.92 0.88 -0.22 -0.31 -0.06
Total 80
Right
Lapilli
RC1 43 0.88 0.99 -0.64 -0.09 -0.02
RC2 34 0.02 0.07 0.26 0.88 0.92
Total 77
Left
Asterisci
RC1 44 0.80 0.82 -0.20 -0.76 -0.52
RC2 34 -0.16 0.49 -0.92 0.00 0.75
Total 78
Right
Asterisci
RC1 50 0.89 0.98 -0.73 -0.06 0.48
RC2 24 -0.16 0.08 -0.31 0.91 0.50
Total 74
1

Figure 1
Effects of Seawater pCO2 on Fish Condition.
(A) Odds of Amphiprion clarkii mortality by pH/pCO2 treatment (legend). Regression lines
(solid) and 95% confidence bands (dotted) represent significant relations between pH/pCO2
treatment and (B) odds of on-time A. clarkii settlement (p = 0.0279); (C) A. clarkii standard
length (p = 0.0018). Data points represent (A, B) binomial proportions by aquarium; (C)
aquarium means. N = 12, n = 3 except where (B) 100% of fish in an aquarium settled on
time (N = 10, n = 1 for pH 7.80 treatment only).
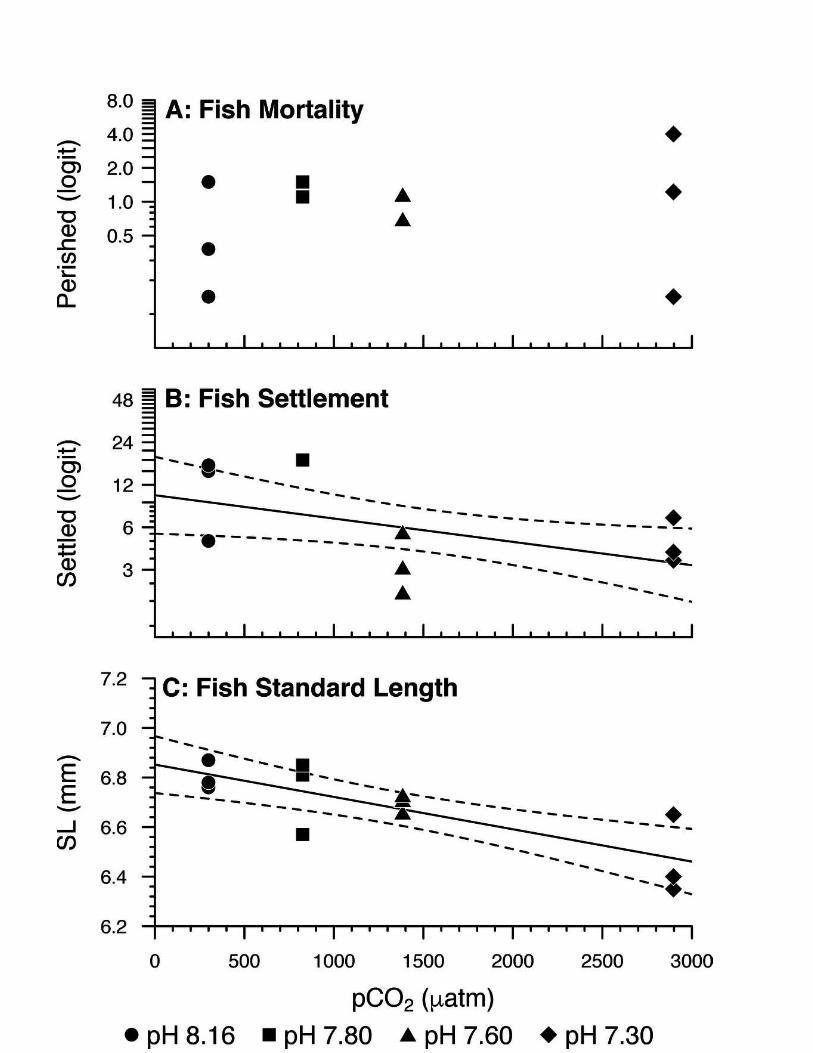

Figure 2
Effects of Seawater pCO2 on Otolith Morphology.
Regression lines (solid) and 95% confidence bands (dotted) represent significant relations
between pH/pCO2 treatment (legend) and (A, B, C, D, E) rotated component (RC) scores
representing Amphiprion clarkii otolith morphological variables, grouped by otolith type and
side (A: p = 0.0061; B: p = 0.0004; C: p = 0.0045; D: p = 0.0168; E: p = 0.0420). Right
asterisci components vs. pCO2 did not yield significant relations, but RC2 scores are plotted
for illustrative consistency. Data points represent aquaria. N = 12, n = 3 except where (E) no
data is available for an aquarium (N = 11, n = 2 for pH = 7.30 treatment only). See Table 3
for otolith morphological variables and corresponding PCA loadings.