NY Green Bank · NYGB_2017_Business_Plan_PSC_Filing_FINAL.docx . ... 22 Figure 9: 2017 – 18 Plan...
62
NY Green Bank Annual Review 2016 – 17 and Annual Business Plan 2017 – 18 Case 13-M-0412 June 19, 2017
Transcript of NY Green Bank · NYGB_2017_Business_Plan_PSC_Filing_FINAL.docx . ... 22 Figure 9: 2017 – 18 Plan...
NY Green Bank
Annual Review 2016 – 17 and
Annual Business Plan 2017 – 18
Case 13-M-0412
June 19, 2017

i
NYGB_2017_Business_Plan_PSC_Filing_FINAL.docx
Contents
Part I: NY Green Bank Overview
Overview ................................................................................................................................................ 4 Review & Plan Purpose ......................................................................................................................... 5 Mission ................................................................................................................................................... 5 Key Investment Criteria .......................................................................................................................... 6 Investment Considerations .................................................................................................................... 6
Additionality .......................................................................................................................... 6 Transformation of Clean Energy Financing Markets............................................................ 7 Impact & Public Benefits ...................................................................................................... 7 Transaction Size & Participation .......................................................................................... 7
Goals & Key Performance Indicators ..................................................................................................... 8 Impact & Reporting ................................................................................................................................ 9
Methodology to Assess NYGB Impact ............................................................................... 10 Impact Reporting ................................................................................................................ 11
Part II: Annual Review 2016 – 17
Overview of Performance & Results .................................................................................................... 14 2016 – 17 Plan Deliverables ................................................................................................................ 17 Significant Portfolio Growth .................................................................................................................. 18 Financial Performance & Self-Sufficiency ............................................................................................ 19 Impact Benefits for All New Yorkers .................................................................................................... 21 Capital Installment of $150.0 Million & Ongoing Liquidity .................................................................... 23 Active Pipeline of at Least $300.0 Million ............................................................................................ 23 Targeted Investment Solicitations ........................................................................................................ 23 RFP Enhancements ............................................................................................................................. 24 Syndicate Participation in NYS Clean Energy Development ............................................................... 24 Proposer, Capital Provider & Stakeholder Engagement ...................................................................... 24 Evaluation, Measurement & Verification .............................................................................................. 26 Fund Administration & Loan/Investment Servicing .............................................................................. 26 CRM, Transaction, Pipeline & Portfolio Management ......................................................................... 26 Metrics Plan Revision & Stakeholder Process ..................................................................................... 26 Risk Framework & Processes .............................................................................................................. 27 Additional Activities .............................................................................................................................. 27
Green Bank Network Activities........................................................................................... 27 Continued NYS Leadership ................................................................................................ 27
Part III: Annual Business Plan 2017 – 18
2017 – 18 Plan Deliverables ................................................................................................................ 30 2017 – 18 Activities to Meet Objectives & Deliverables ....................................................................... 31
Building & Maintaining Active Pipeline ............................................................................... 31 Revenue & Expense Targets ............................................................................................. 32 Optimizing Performance & Impact ..................................................................................... 32 Further Mobilizing Capital to Invest in NYS Clean Energy ................................................ 33 Continued Market & Stakeholder Outreach ....................................................................... 33 Cultivating Opportunities Related to New State Programs & Initiatives ............................ 33

ii
NYGB_2017_Business_Plan_PSC_Filing_FINAL.docx
Growing Impact Benefits .................................................................................................... 35 Baseline Evaluations of the Investment Portfolio ............................................................... 36 Attracting & Retaining Required Staff ................................................................................ 37
Figures Figure 1: Mission Statement ..................................................................................................................................... 5 Figure 2: Key Investment Criteria ............................................................................................................................. 6 Figure 3: First-Year Calculation Methodology ........................................................................................................ 11 Figure 4: Calculation of Impact Benefits ................................................................................................................. 12 Figure 5: 2016 – 17 Overarching Objectives & Summary Results ......................................................................... 14 Figure 6: Overall Investments to Date Month-By-Month, 2016 – 17 Plan Year ..................................................... 19 Figure 7: Annual Revenues vs. Expenses 2015 – 16 & 2016 – 17 ........................................................................ 20 Figure 8: Estimated Portfolio Lifetime GHG Emissions Reductions as of March 31, 2017 .................................... 22 Figure 9: 2017 – 18 Plan Objectives ...................................................................................................................... 29 Figure 10: On Track to Meet Key CEF Goals as of March 31, 2017 ...................................................................... 36 Figure 11: Governance & Oversight Environment .................................................................................................. 56 Figure 12: Transaction Process .............................................................................................................................. 59 Tables Table 1: Goals, Key Performance Indicators & Metrics ............................................................................................ 8 Table 2: 2016 – 17 Plan Deliverables & Status ...................................................................................................... 17 Table 3: Net Income (Loss) .................................................................................................................................... 20 Table 4: Allocated Capital Position ......................................................................................................................... 21 Table 5: 2017 – 18 Plan Deliverables..................................................................................................................... 30 Table 6: Actual & Forecast Net Income (Loss) ....................................................................................................... 32 Table 7: Key Business Risks .................................................................................................................................. 53 Schedules Schedule 1: 2016 – 17 Investments ........................................................................................................................ 44 Schedule 2: Risk Management & Oversight Framework......................................................................................... 52 Schedule 3: Investment Process ............................................................................................................................. 59
1
NYGB_2017_Business_Plan_PSC_Filing_FINAL.docx
Letter from the President of NY Green Bank
The fiscal year that ended March 31, 2017 was an excellent one for NY Green Bank. We had set three overarching objectives for the fiscal year: (1) commit $200 million to clean energy investments; (2) have expected total value of projects deployed in the State of New York be at least three times NY Green Bank’s commitment on average across the portfolio; and (3) grow revenue and manage costs to put NYGB on pace to reach positive net income in 2018. We met each of these objectives.
Over the course of the fiscal year we committed over $291 million of capital across 19 transactions in support of up to $1.1 billion in total value of clean energy deployment in the State of New York. These transactions, together with our existing investments, are expected to reduce greenhouse gas emissions by up to 6.4 million metric tons – equivalent to taking 70,000 cars off the road for 20 years. We also generated net income for the year, one year ahead of schedule.
At fiscal year-end, our overall completed investments since inception totaled over $346 million and our pipeline of investment opportunities continues to be strong. The combination of a portfolio of meaningful scale and a substantial pipeline of transactions positions NY Green Bank as a leading investor in clean energy/sustainable infrastructure, with a focus on transactions that are economically viable at commercial financing terms but lack the precedent and scale to receive broad support from traditional financing market participants.
A substantial funded portfolio that reflects commercial financing terms, prudent risk management and efficient operations has resulted in current positive net income. NY Green Bank’s positive net income supports an enduring organization that can maintain focus on NY Green Bank’s critical mission and objectives as part of a strong and coherent energy strategy across the State. In addition, these elements provide an important market signal that will attract additional types of investors and investment to clean energy/sustainable infrastructure.
To build cleaner infrastructure, technology financed by NY Green Bank includes energy efficiency, wind, solar, and fuel cells. End-user types benefitting from our financings include residential, commercial and industrial, and MUSH (municipalities, universities, schools and hospitals). End-user contract types financed by NY Green Bank include PPAs (power purchase agreements), ESAs (energy savings agreements), leases and loans.
NY Green Bank’s accomplishments and portfolio reflect the successful implementation of Governor Andrew M. Cuomo’s original plan and vision for NY Green Bank: to serve as the nation’s largest green bank, with $1 billion in capitalization, to accelerate clean energy deployment in New York State by working in collaboration with the private sector to transform financing markets.
Building upon our momentum, NY Green Bank will work to further accelerate clean energy deployment with all corresponding energy and environmental impacts, mobilize third-party capital and maintain self-sufficiency by generating net income. As with any investment portfolio, there will be periodic fluctuations in earnings, but our trajectory points to net income generation on average over the coming years. Specific objectives for the fiscal year ending March 31, 2018 include increasing NY Green Bank’s investment commitments to at least $550 million (cumulative) with related total expected project deployment in the State of NY of at least $1.65 billion.
Based upon our current pipeline, we expect our portfolio at March 31, 2018 to include energy efficiency, wind, solar, fuel cells, storage, community distributed generation, sustainable transportation, microgrids and LED streetlighting. We will continue to be responsive to market activity and demand, and be innovative in establishing credible financing approaches for new clean energy infrastructure models that are economically viable, replicable and scalable.
Meeting our objectives in the coming year, as was the case in the past year, will be the result of numerous ongoing and strategic activities across all aspects of NY Green Bank. The following pages set out our key

2
NYGB_2017_Business_Plan_PSC_Filing_FINAL.docx
objectives, milestones and the ongoing and strategic activities in support of our objectives, as well as describe our performance and activities in the 2016 – 17 fiscal year.
The NY Green Bank team has worked diligently since inception to build the foundation that has led to our now being an established clean energy finance leader, and will continue to execute on a daily basis those activities required to meet our objectives. Contributing to achievement of the aggressive climate and clean energy goals in the State of New York in collaboration with the private sector so that all New Yorkers can enjoy clean energy choices, affordable, reliable and resilient energy supply and the corresponding environmental benefits, remains our central motivation. The talent and dedication of the NY Green Bank team, with the continued support of our colleagues at NYSERDA, the NY Green Bank Advisory Committee, New York State agencies, and our many other stakeholders makes me highly confident that NY Green Bank will continue to fulfill its mission – and we look forward to doing so.
Alfred Griffin President June 19, 2017

3
NYGB_2017_Business_Plan_PSC_Filing_FINAL.docx
Part I
NY Green Bank Overview

4
NYGB_2017_Business_Plan_PSC_Filing_FINAL.docx
Introduction
This Annual Review 2016 – 17 and Annual Business Plan 2017 – 18 (the “Review and Plan”) has been prepared by NY Green Bank (“NYGB”) to inform all stakeholders, existing and potential clients, counterparties and all other interested entities of:
(a) NYGB’s activities and performance in the last fiscal year;1 and
(b) NYGB’s strategic objectives for 2017 – 18, together with an outline of the activities NYGB is undertaking to achieve those objectives.
To help navigate the information contained in this document, this Review and Plan has been structured into three separate parts:
(a) Part I: NY Green Bank Overview, providing information about NYGB’s mission and its role in the context of energy strategy within New York State (“NYS” or the “State”);
(b) Part II: Annual Review, describing the activities of NYGB in 2016 – 17 and its performance against plan;
and (c) Part III: Annual Business Plan for 2017 – 18.
Overview
NYGB was created as a $1.0 billion investment fund to accelerate clean energy deployment in New York State and is globally recognized as a leading sustainable infrastructure investor. NYGB’s participation in a growing number of transactions continues to spur clean energy development in the State, with all the corresponding benefits for New York residents and more broadly. NYGB is a division of the New York State Energy Research and Development Authority (“NYSERDA”). NYGB works to increase the size, volume and breadth of clean energy investment activity throughout the State, expand the base of investors focused on NYS clean energy, and increase clean energy market participants’ access to capital on commercial terms. To achieve these overarching objectives, NYGB collaborates with the private sector to develop transaction structures and methodologies that overcome typical clean energy investment barriers. These barriers include challenges in evaluating risk and addressing the needs of distributed energy and efficiency projects where underwriting may be geared more towards larger opportunities and/or towards groups of somewhat homogeneous investments to make up larger portfolios. NYGB focuses on opportunities that create attractive precedents, standardized practices and roadmaps that capital providers can readily replicate and scale. As funders “crowd in” to a particular area within the clean energy landscape, NYGB moves on to other areas that have received less investor interest. To solve client problems in real-time, and address capital provider needs, NYGB operates within private sector time horizons and commercial norms. For more information on NYGB’s growing Investment Portfolio, and how industry participants and capital providers can do business with NYGB, please see www.greenbank.ny.gov.
1 NYGB operates on a fiscal year starting April 1 and ending the following March 31.
Defined terms used, but not separately described, in the text of this document have the meanings respectively given to them in Section 4: Glossary & Definitions.

5
NYGB_2017_Business_Plan_PSC_Filing_FINAL.docx
Review & Plan Purpose
In reporting NYGB’s performance, NYGB reviews all plans to ensure ongoing strategic alignment with the direction provided by the NYS Public Service Commission (the “Commission”) in the “Order Authorizing the Clean Energy Fund Framework” issued and effective January 21, 2016 (the “CEF Order”).2 This includes, importantly, that NYGB activities continue to contribute directly to the objectives of the current State Energy Plan (“SEP”) and Clean Energy Standard (“CES”) “through [NYGB’s] ability to drive down costs associated with meeting [SEP and CES] objectives.”3 This Review and Plan also reflects NYGB’s role in New York’s Clean Energy Fund (“CEF”), which was created pursuant to the CEF Order. The CEF is a $5.3 billion commitment over 10 years,4 and part of Governor Andrew M. Cuomo’s Reforming the Energy Vision (“REV”) strategy to advance clean energy growth and innovation, while driving economic development across NYS and reducing ratepayer collections. For more information on the CEF and REV strategy, see www.nyserda.ny.gov/About/Clean-Energy-Fund and www.ny.gov/programs/reforming-energy-vision-rev. Each investment made by NYGB contributes to the primary CEF outcomes of greenhouse gas (“GHG”) emissions reductions, customer bill savings, energy efficiency, clean energy generation and mobilization of capital. In turn, the CEF objectives support the CES goal of 50.0% energy generation from renewable sources, and the SEP goals of 23.0% reduction in building GHG emissions from 2012 levels, which together further the SEP goal of 40.0% reduction in GHG emissions from 1990 levels – all to be achieved by 2030. This Review and Plan is a product of NYGB’s annual strategy review and business planning process contemplated at its Inception.5 Previous business plans (respectively the “2014 Plan”,6 “2015 Plan”,7 and “2016 Plan”8) are available at www.greenbank.ny.gov/About/Public-Filings.
Mission
NYGB’s mission is set out in Figure 1. Figure 1: Mission Statement
The key elements of NYGB’s mission are to collaborate with private sector participants, implement solutions that overcome market barriers and transform financial markets to attract greater private sector investment in clean energy by enabling greater scale, new and expanded asset classes and increased liquidity. NYGB has observed many common financial market barriers to clean energy projects in the State that constrain growth in the clean energy sector, including: lack of transaction standardization, deficient scale and volume, less understood project sponsors and counterparty credits, insufficient data on underlying debt (or equity) investments and/or technology performance and underdeveloped or nonexistent capital markets for clean energy projects. Variation in these themes exists across clean energy investments, with such barriers limiting investment at scale into otherwise attractive renewable energy and energy efficiency opportunities.
2 Cases 14-M-0094 et al., page 74. 3 Ibid. 4 January 2016 through December 2025. 5 “Inception” means the inception of NYGB pursuant to, and as of the date of, the Initial Capitalization Order in December 2013. Case 13-M-
0412, “Order Establishing New York Green Bank and Providing Initial Capitalization”, issued and effective December 19, 2013 (the “Initial Capitalization Order”), Ordering Clause 5, page 24.
6 NY Green Bank Business Plan, Case 13-M-0412, filed June 2014. 7 NY Green Bank Business Plan, Case 13‐M‐0412, filed June 2015. 8 NY Green Bank Business Plan, Case 13-M-0412, filed June 2016.
To accelerate clean energy deployment in New York State by working in collaboration with the private sector
to transform financing markets

6
NYGB_2017_Business_Plan_PSC_Filing_FINAL.docx
NYGB follows certain important operating principles to increase private sector market participation by:
(a) Focusing on wholesale capital markets (that is, providing structured financial products to developers and specific projects that will result in clean energy benefits for all New Yorkers at scale – rather than funding consumers/homeowners directly);
(b) Structuring financial products to foster replicable clean energy investments;
(c) Pricing financial products consistently with commercial approaches to credit quality and risk, earning a return on investment to preserve and grow its capital base;
(d) Collaborating, rather than competing, with market participants that are already making progress in, or can demonstrate an ability to engage the financial markets but where that progress is constrained by the lack of available financing; and
(e) Recycling its capital into new clean energy projects when income is generated and as investments mature or are realized, maximizing the impact of its capital across multiple deployments.
Key Investment Criteria
NYGB’s key investment criteria, applied to all potential transactions, are defined by the Commission in the Initial Capitalization Order9 and are reproduced in Figure 2. Figure 2: Key Investment Criteria
Investment Considerations
In applying the key investment criteria, NYGB expands upon and supplements the central concepts, including in connection with additionality, market transformation, impact benefits and transaction size and participation, each of which is discussed below.
Additionality
Additionality is an important part of NYGB’s consideration of all proposed investments, and is defined as follows:
(a) The unique benefit that NYGB brings to the proposed financing or investment arrangement; and (b) If any proposed project:
9 Ordering Clause 6, pages 24 - 25.
Transactions will have expected financial returns such that the revenues of NYGB on a portfolio basis will be in excess of expected portfolio losses;
Transactions will be expected to contribute to financial market transformation in terms of:
Scale; Improved private sector participation; Level of awareness and confidence in clean energy investments; and/or Other aspects of market transformation; and
Transactions will have the potential for energy savings and/or clean energy generation that will
contribute to GHG emissions reductions in support of New York’s clean energy policies.

7
NYGB_2017_Business_Plan_PSC_Filing_FINAL.docx
i. Would likely not occur given the current state of the private markets; or ii. Might occur in the private markets but would likely:
Involve less favorable terms as to tenor, cost, fees and other key transaction attributes; Not happen at the market breadth needed to scale the sector; Not involve the same level of focus on the NYS market; or Not happen as quickly.
Transformation of Clean Energy Financing Markets
NYGB also assesses each proposed investment’s contribution to clean energy financial market transformation in NYS through the:
(a) Type and amount of capital applied to total project costs (referred to as mobilization or leverage of capital);
(b) Ability to scale or replicate the transaction to drive larger volume(s) of clean energy finance; and
(c) Increased awareness of, and confidence in, clean energy investments, driven by: i. Evolution of private sector institutional underwriting; and ii. Progress made toward capital markets solutions for:
Contract standardization; Aggregation; and Data harvesting.
Impact & Public Benefits
NYGB also considers the expected impact and public benefits of certain clean energy outcomes as determined by:
(a) Estimated energy savings, peak load reduction and/or clean energy generation; (b) Other estimated GHG reduction benefits to the extent included in proposed project(s) (outside those
achieved through direct energy savings and/or clean energy generation); (c) The cost-effectiveness of proposed project(s); and (d) The strength of the plan pursuant to which a counterparty (or designated third-party) will track, record,
and report performance data.
Transaction Size & Participation
NYGB considers various transaction sizes and participation levels (i.e., senior secured debt, equity), but largely expects its participation in any investment opportunity (whether related to a single asset or project portfolio) to fall within the range of $5.0 – $50.0 million. Details of the types of transactions which NYGB considers, including illustrative guidelines for eligible renewable energy and energy efficiency investments, are included in NYGB’s open solicitations for proposals (the “Investment RFPs”).10
10 NYGB currently has three open investment solicitations, all of which are ongoing: RFP 1: “Clean Energy Financing Arrangements”; RFP 7:
“Construction & Back-Leveraged Financing for Ground-Mounted Solar Generation Systems Targeting Corporate & Industrial End-Users”; and RFP 8: “Financing Arrangements for Renewable & Energy Efficiency Projects: Office, Commercial & Industrial, and Multi-Family Real Estate Properties”. All Investment RFPs are available at www.greenbank.ny.gov/Working-with-Us/Propose-an-Investment, including access to the portal for the online submission of investment proposals.

8
NYGB_2017_Business_Plan_PSC_Filing_FINAL.docx
Goals & Key Performance Indicators
The mission and key investment criteria drive NYGB’s goals, which collectively shape the path NYGB pursues to accomplish its mission. In turn, NYGB’s goals guide all stakeholders (such as employees, clients, counterparties, industry participants, investors, ratepayers and the public) as to where NYGB will focus its resources. To manage NYGB’s performance, NYGB has set key performance indicators (“KPIs”), which are tracked to assess NYGB’s progress toward its goals. These KPIs tie to NYGB’s metrics and periodic reporting pursuant to the Metrics, Reporting & Evaluation Plan (Version 3.0)11 (the “Metrics Plan”). KPIs and metrics are the measures which may be used to evaluate NYGB performance and provide transparency into, and accountability for, NYGB activities. These KPIs are set out in Table 1.12 Table 1: Goals, Key Performance Indicators & Metrics
NYGB Goals
Key Performance Indicators
Metrics
Attract Capital to
Clean Energy Capital Markets in
NYS
Mobilizing capital Mobilization Ratio13 of Total Project Costs (Cumulative) to NYGB investment
Portfolio driving material clean energy investments across NYS
Total Project Costs (Cumulative) enabled by NYGB ($)
Growing portfolio Overall Investments to Date ($) Strong Active Pipeline14 Active Pipeline ($) Stimulating new clean energy
proposals in NYS Investment proposals received
(cumulative) ($)
Be Self-Sufficient Revenue growth paving the way to
self-sufficiency Revenues (cumulative) ($) Expenses (cumulative) ($)
11 Case 13-M-0412, filed with the Commission on June 20, 2016. 12 Table 1 contains selected metrics that most directly tie to NYGB’s goals and is not intended to be a complete listing of all metrics on which
NYGB reports. For these details, see NYGB’s quarterly and annual Metrics reports available at: www.greenbank.ny.gov/About/Public-Filings.
13 Note that Mobilization Ratio includes the effects of capital recycling. Central to achieving NYGB’s objectives is its ability to efficiently recycle funds. Unlike a pool of public funds that is dispensed once to qualifying projects as non-refundable grants or subsidies, funds entrusted to NYGB are disbursed under commercial arrangements generating investment income and requiring repayment in accordance with agreed terms for each product and counterparty. This means that as each dollar from NYGB cycles through successive investments, benefits will compound. The effective rate of accumulation of these benefits is directly tied to the weighted average expected holding periods of the financial products that NYGB provides to its clients. Further, as the commercial markets expand into, and increasingly accommodate, clean energy finance needs previously supported by NYGB, the multiplier effect on NYGB’s activities and investments will continue.
14 “Active Pipeline” means, at any time and for any period, the sum (expressed in dollars) of the proposed NYGB investment amount in all NYGB active transactions in the Pipeline where, in relation to each transaction: (a) there is agreement in principle between the parties; (b) there is momentum in moving the transaction forward; (c) conditions to investment are expected to be met; and (d) NYGB is dynamically proceeding towards and through “greenlight” recommendation, Investment & Risk Committee (“IRC”) approval and transaction execution. Unlike other metrics that are cumulative measures since NYGB’s Inception, Active Pipeline is a point in time measure. As momentum behind individual transactions fluctuates while advancing toward execution due to various factors, including many not under NYGB’s control, transactions may move in and out of the Active Pipeline.

9
NYGB_2017_Business_Plan_PSC_Filing_FINAL.docx
NYGB Goals
Key Performance Indicators
Metrics
Deliver Energy & Environmental Impact Benefits
Contributing to CEF objectives and in turn REV and the CES (by supporting increased deployment of renewable energy, distributed energy & energy efficiency)
Estimated energy and environmental benefits: Lifetime energy saved by fuel type
from energy efficiency projects (MWh/MMBtu) and/or Lifetime clean energy generated (MWh);
First-Year energy saved by fuel type from energy efficiency projects (MWh/MMBtu) and/or estimated First-Year clean energy generated (MWh);
Lifetime and First-Year energy saved from CHP (MWh);
Lifetime and First-Year energy savings from CHP (MMBtu);
Clean energy generation installed capacity (MW) from CHP;
Other clean energy generation installed capacity (MW); and
GHG emissions reductions (metric tons); and
Installed energy and environmental benefits: Energy saved by fuel type from
energy efficiency projects (MWh/MMBtu) and/or actual clean energy generated (MWh);
Primary energy saved from CHP (Btu);
Clean energy generation installed capacity (MW), if applicable; and
GHG emissions reductions (metric tons).
The KPIs and metrics described in Table 1 flow through all aspects of NYGB’s business from investment and portfolio management through risk and compliance, operations and finance, and legal and regulatory, aligning the entirety of NYGB’s activities against its goals. NYGB files metrics reports on a quarterly basis that lay out its performance in a transparent manner for the Commission, ratepayers and other stakeholders. In addition, pursuant to the Metrics Plan, NYGB reports on installed energy and environmental performance across the Investment Portfolio on an annual basis and also files an Annual Financial Metrics Report (focused largely on financial and risk metrics, including NYGB’s Audited Financials). All metrics reports are available at www.greenbank.ny.gov/About/Public-Filings.
Impact & Reporting
One of NYGB’s key investment criteria is to ensure that transactions have the potential for energy savings and/or clean energy generation that contribute to GHG emissions reductions in support of REV, CEF and SEP objectives. Specific impacts that are tracked include estimated clean energy generation, installed capacity, energy savings from efficiency measures (MWh (electricity) and MMBtu (fuel)), as well as estimated GHG emissions reductions (collectively, “Impact Benefits”). The CEF Order includes 10-year minimum goals, measured as cumulative annual benefits across a number of

10
NYGB_2017_Business_Plan_PSC_Filing_FINAL.docx
identified aspects.15 The target contribution of NYGB’s Investment Portfolio over the “Useful Life” of all underlying projects (collectively, the “Projects”) toward each of those goals16 comprises the “Impact Benefit Objectives” and includes:
(a) 62.0 million MWh clean energy generated;
(b) 137.0 million MMBtu saved through efficiency;
(c) 29.0 million metric tons of GHG emissions reductions; and
(d) A Mobilization Ratio of 8:1. Central to measuring and monitoring impact are the concepts of estimated benefits for both “first-year” and “lifetime” durations. “First-Year” refers to estimates of energy savings and clean energy generation in NYS for all projects expected to be installed and placed in service for the first year after the availability period for NYGB capital has expired. In most cases, this will not coincide with the first year of NYGB’s investment, taking into account delayed draw schedules while projects are being constructed and/or portfolios of distributed assets are being built. First-Year metrics are also the basis for calculating the lifetime energy savings of the projects which benefit from NYGB investment (“Lifetime” benefits), depending on the expected Useful Life of the technologies deployed.
Methodology to Assess NYGB Impact
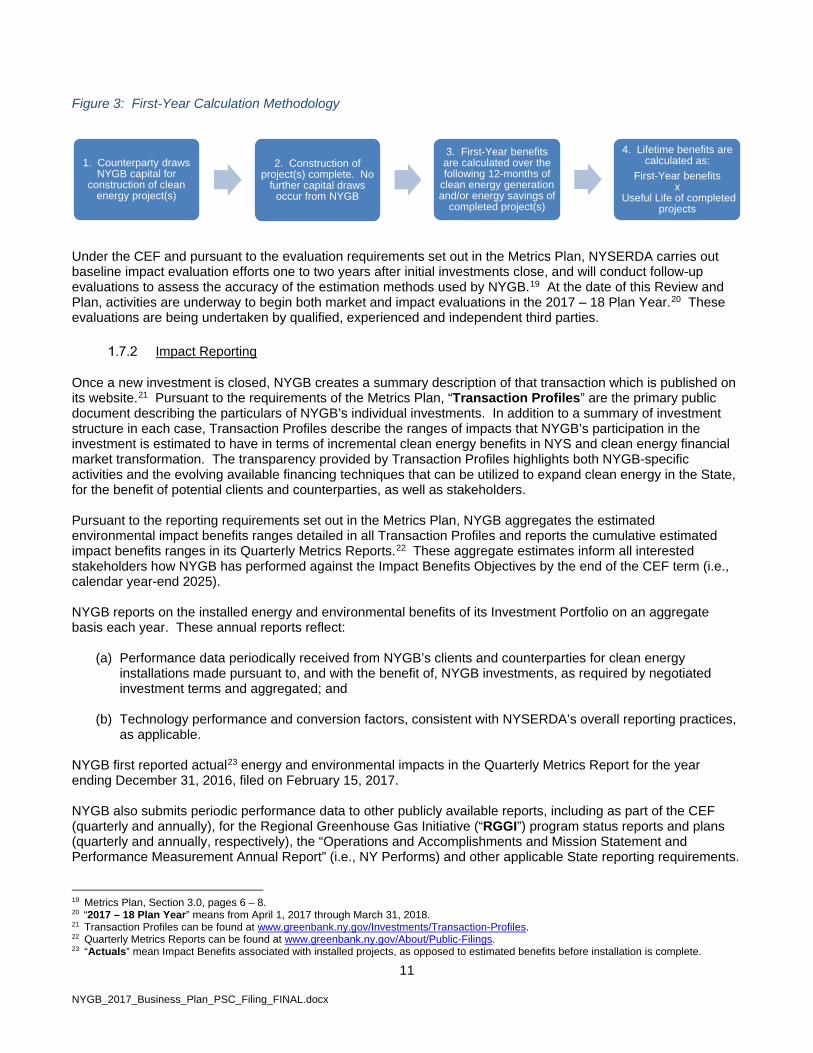
In managing its investment process and activity to achieve the Impact Benefit Objectives, NYGB first engages its prospective (or existing) counterparties (prior to closing a new investment). In particular, NYGB assesses the scope of all Projects underlying any proposed NYGB investment and determines acceptable data sets and calculations needed to estimate the corresponding potential Impact Benefits. Estimates reflect clean energy technologies utilized, installed capacity, number of systems to be deployed, operational yield of systems (i.e., capacity factors), industry-accepted electrical and fuel energy conversion factors, and Useful Life of systems. To control for exogenous factors (e.g., project ramp times, delays and seasonality), NYGB works with its clients to identify low and high estimates of expected Impact Benefits, on both a Lifetime and First-Year basis.17 To further ensure that the impact assessment methodology for any given investment is consistent with NYSERDA’s methodologies, NYGB leverages the experience of NYSERDA’s performance management team with respect to current best practices and industry knowledge in NYS. After a transaction has been reviewed by, and received a recommendation to proceed from, NYGB’s Greenlight Committee (as shown in Figure 12,18 contained in Schedule 3), NYGB estimates the First-Year and Lifetime metrics in NYS for all projects associated with NYGB investments. Once energy savings and/or clean energy generation are estimated, NYGB calculates the estimated GHG emissions reductions – for both First-Year and Lifetime – utilizing the electrical and fuel energy conversion factors consistent with the CEF. Figure 3 illustrates the steps involved in the calculation of First-Year metrics.
15 CEF Order, Ordering Clause 2, page 106. 16 CEF Order, page 41. 17 All “first-year” metrics are estimates and refer to the first year of estimated benefits (e.g., energy saved, installed capacity, GHGs etc.) which
are expected to occur when each underlying project is fully installed. This means that estimated first-year benefits across NYGB’s portfolio do not (and are not intended to) correspond to installed benefits in any given year, and instead represent cumulative estimated benefits across the portfolio based on transactions executed through the CEF term. Note that underlying projects will usually be installed over one or more years following execution of investment agreements (reflecting project development/implementation and funding deployment cycles). The sum of all estimated first-year measures will approximate the total annual CEF benefits goals for NYGB investments at the end of the CEF term (i.e., in 2025). As set out in Section 2.2.2 of the Metrics Plan, NYGB reports on installed energy and environmental benefits associated with NYGB’s investments in the prescribed form annually, with such reporting included in the Quarterly Metrics Report for each quarter ending December 31.
18 Such a recommendation occurs after a proposed investment has passed NYGB’s Scoring Committee, after the commencement of due diligence for a transaction, including credit analysis and negotiation of transaction terms.
11
NYGB_2017_Business_Plan_PSC_Filing_FINAL.docx
Figure 3: First-Year Calculation Methodology
Under the CEF and pursuant to the evaluation requirements set out in the Metrics Plan, NYSERDA carries out baseline impact evaluation efforts one to two years after initial investments close, and will conduct follow-up evaluations to assess the accuracy of the estimation methods used by NYGB.19 At the date of this Review and Plan, activities are underway to begin both market and impact evaluations in the 2017 – 18 Plan Year.20 These evaluations are being undertaken by qualified, experienced and independent third parties.
Impact Reporting
Once a new investment is closed, NYGB creates a summary description of that transaction which is published on its website.21 Pursuant to the requirements of the Metrics Plan, “Transaction Profiles” are the primary public document describing the particulars of NYGB’s individual investments. In addition to a summary of investment structure in each case, Transaction Profiles describe the ranges of impacts that NYGB’s participation in the investment is estimated to have in terms of incremental clean energy benefits in NYS and clean energy financial market transformation. The transparency provided by Transaction Profiles highlights both NYGB-specific activities and the evolving available financing techniques that can be utilized to expand clean energy in the State, for the benefit of potential clients and counterparties, as well as stakeholders. Pursuant to the reporting requirements set out in the Metrics Plan, NYGB aggregates the estimated environmental impact benefits ranges detailed in all Transaction Profiles and reports the cumulative estimated impact benefits ranges in its Quarterly Metrics Reports.22 These aggregate estimates inform all interested stakeholders how NYGB has performed against the Impact Benefits Objectives by the end of the CEF term (i.e., calendar year-end 2025). NYGB reports on the installed energy and environmental benefits of its Investment Portfolio on an aggregate basis each year. These annual reports reflect:
(a) Performance data periodically received from NYGB’s clients and counterparties for clean energy installations made pursuant to, and with the benefit of, NYGB investments, as required by negotiated investment terms and aggregated; and
(b) Technology performance and conversion factors, consistent with NYSERDA’s overall reporting practices,
as applicable.
NYGB first reported actual23 energy and environmental impacts in the Quarterly Metrics Report for the year ending December 31, 2016, filed on February 15, 2017. NYGB also submits periodic performance data to other publicly available reports, including as part of the CEF (quarterly and annually), for the Regional Greenhouse Gas Initiative (“RGGI”) program status reports and plans (quarterly and annually, respectively), the “Operations and Accomplishments and Mission Statement and Performance Measurement Annual Report” (i.e., NY Performs) and other applicable State reporting requirements. 19 Metrics Plan, Section 3.0, pages 6 – 8. 20 “2017 – 18 Plan Year” means from April 1, 2017 through March 31, 2018. 21 Transaction Profiles can be found at www.greenbank.ny.gov/Investments/Transaction-Profiles. 22 Quarterly Metrics Reports can be found at www.greenbank.ny.gov/About/Public-Filings. 23 “Actuals” mean Impact Benefits associated with installed projects, as opposed to estimated benefits before installation is complete.
1. Counterparty draws NYGB capital for
construction of clean energy project(s)
2. Construction of project(s) complete. No
further capital draws occur from NYGB
3. First-Year benefits are calculated over the following 12-months of
clean energy generation and/or energy savings of
completed project(s)
4. Lifetime benefits are calculated as:
First-Year benefitsx
Useful Life of completed projects
12
NYGB_2017_Business_Plan_PSC_Filing_FINAL.docx
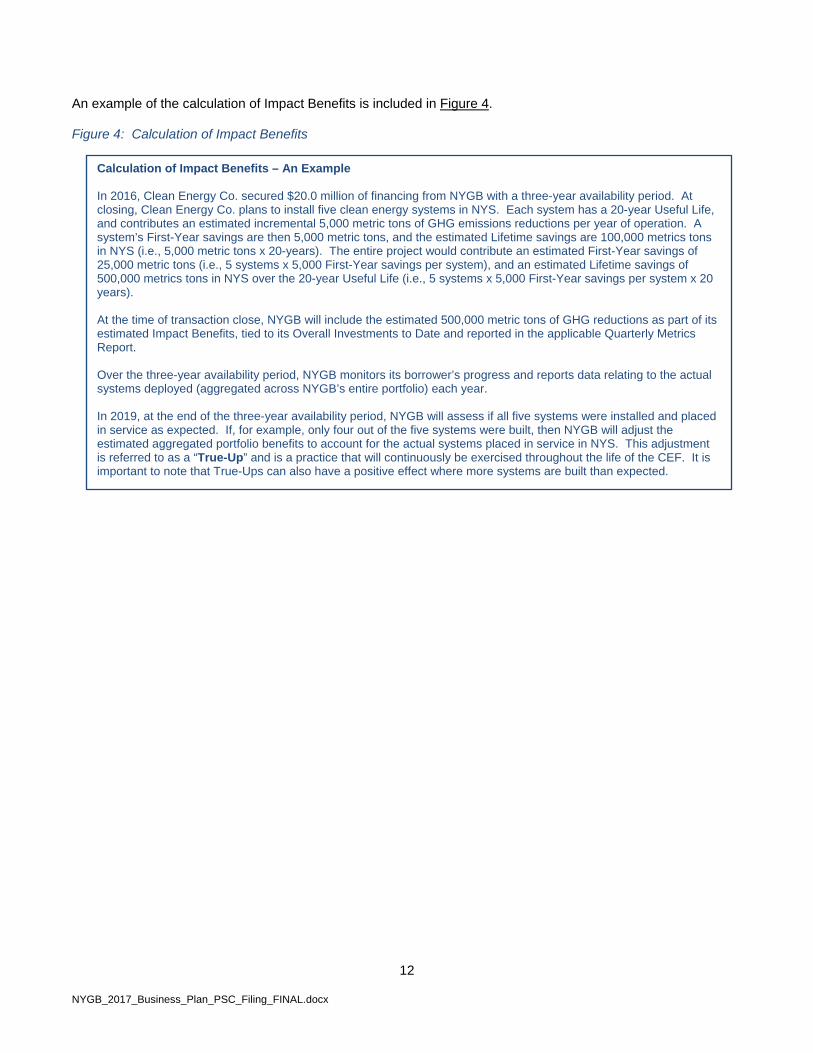
An example of the calculation of Impact Benefits is included in Figure 4. Figure 4: Calculation of Impact Benefits
Calculation of Impact Benefits – An Example In 2016, Clean Energy Co. secured $20.0 million of financing from NYGB with a three-year availability period. At closing, Clean Energy Co. plans to install five clean energy systems in NYS. Each system has a 20-year Useful Life, and contributes an estimated incremental 5,000 metric tons of GHG emissions reductions per year of operation. A system’s First-Year savings are then 5,000 metric tons, and the estimated Lifetime savings are 100,000 metrics tons in NYS (i.e., 5,000 metric tons x 20-years). The entire project would contribute an estimated First-Year savings of 25,000 metric tons (i.e., 5 systems x 5,000 First-Year savings per system), and an estimated Lifetime savings of 500,000 metrics tons in NYS over the 20-year Useful Life (i.e., 5 systems x 5,000 First-Year savings per system x 20 years). At the time of transaction close, NYGB will include the estimated 500,000 metric tons of GHG reductions as part of its estimated Impact Benefits, tied to its Overall Investments to Date and reported in the applicable Quarterly Metrics Report. Over the three-year availability period, NYGB monitors its borrower’s progress and reports data relating to the actual systems deployed (aggregated across NYGB’s entire portfolio) each year. In 2019, at the end of the three-year availability period, NYGB will assess if all five systems were installed and placed in service as expected. If, for example, only four out of the five systems were built, then NYGB will adjust the estimated aggregated portfolio benefits to account for the actual systems placed in service in NYS. This adjustment is referred to as a “True-Up” and is a practice that will continuously be exercised throughout the life of the CEF. It is important to note that True-Ups can also have a positive effect where more systems are built than expected.

13
NYGB_2017_Business_Plan_PSC_Filing_FINAL.docx
Part II
Annual Review 2016 – 17

14
NYGB_2017_Business_Plan_PSC_Filing_FINAL.docx
Annual Review 2016 – 17
Overview of Performance & Results
In this Part II, NYGB discusses its progress over the previous fiscal year (“2016 – 17 Plan Year”),24 with respect to its objectives set out in the 2016 Plan as shown below in Figure 5. More detail on all aspects of NYGB’s performance and activities – both investment and operational – are provided in the balance of this Part II, including discussion of NYGB’s financials and impact. Figure 5: 2016 – 17 Overarching Objectives & Summary Results
24 Throughout this Review and Plan, NYGB refers to the “2016 – 17 Plan Year” to represent NYGB’s fiscal year and to ensure consistency
and comparability with financial and other results measured and reported over the fiscal year.
Overarching Objectives: Put ratepayer money to work, prudently:
Commit $200.0 million to NYGB investments over the next year, equating to an average of $50.0 million in closed transactions per quarter.
Mobilize capital: Achieve an average, portfolio-
wide Mobilization Ratio of at least 3:1, driving towards a ratio of 8:1 across all NYGB investments by the end of the CEF term in 2025.
Drive toward self-sustainability: Continue to
grow revenues and manage costs to reach self-sufficiency in 2018.
Summary Results: $291.6 million committed to clean energy in
NYS through 19 new investments, all of which are described in Schedule 1: 2016 – 17 Investments.
Mobilization Ratio in the 2016 – 17 Plan Year
was consistent with maintaining at least a 3:1 ratio on average across NYGB’s portfolio (at March 31, 2017 this ratio was in the range of 2.9:1 and 4.1:1).
Net income of $2.7 million in the 2016 – 17
Plan Year, resulting in self-sufficiency one full year earlier than expected.

15
NYGB_2017_Business_Plan_PSC_Filing_FINAL.docx
NYGB received over $2.0 billion in investment proposals since Inception. The Active Pipeline of potential investments proceeding to close was $591.7 million.25 NYGB’s Investment Portfolio supports clean energy projects with Total Project Costs (Cumulative) between $1.0 and $1.4 billion in aggregate, based on Overall Investments to Date of $346.1 million.
NYGB’s Investment Portfolio as a whole represents an expected Mobilization Ratio26 in line with the target level of 3:1,27 which will be realized as planned clean energy projects are successfully implemented by NYGB’s clients and counterparties. Over 10 years, assuming periodic reinvestment in comparable transactions, the expected Mobilization Ratio remains on track to meet or exceed 8:1. Continued revenue growth – $12.9 million in revenues have been realized since NYGB’s Inception, with net income generated for the 2016 – 17 Plan Year and for the first time. NYGB’s Overall Investments to Date drive estimated lifetime GHG emissions reductions of between 4.3 and 6.4 million metric tons, equivalent to removing between 50,000 and 70,000 cars from the road for a period of 20 years
25 Note that at any time, the value of the Active Pipeline is separate from the value of the Investment Portfolio. For example, as of March 31,
2017, the $591.7 million in Active Pipeline does not include the $346.1 million in closed transactions that comprises NYGB’s Overall Investments to Date.
26 The Mobilization Ratio is the ratio of Total Project Costs (Cumulative) to NYGB Overall Investments to Date. 27 Given the range of Total Project Costs (Cumulative) that NYGB investments mobilize, the Mobilization Ratio also represents a range; of
2.9:1 to 4.1:1 as of March 31, 2017.
Strong Active Pipeline
Driving Material Clean Energy Investments Across NYS
Mobilizing Capital
Revenue Growth Paving the Way to Self-Sufficiency
Contributing to CEF Objectives, REV & the
CES
Investment Performance at a Glance As of March 31, 2017
Stimulating Clean Energy Proposals in the State

16
NYGB_2017_Business_Plan_PSC_Filing_FINAL.docx
NYGB deployed more than $320.0 million in the 2016 – 17 Plan Year28 across more than 150 separate disbursements of funds pursuant to investments, averaging two to three fundings every week. NYGB also managed 70 separate repayments and received 165 interest payments, all in connection with the existing Investment Portfolio.29 NYGB made more than 11 public filings (e.g., Quarterly Metrics Reports, Annual Financial Metrics Report, 2016 Plan, and Financial Statements),30 issued eight press releases, hosted two webinars and published its regular, seasonal newsletters during the 2016 – 17 Plan Year. It also provided reporting into periodic RGGI, CEF and other State disclosures. NYGB focused on streamlining, centralizing, automating, and standardizing various processes and data related to Investment RFP intake, impact benefits and other operations. The results of these activities improved NYGB’s overall efficiency.
NYGB conducted thousands of meetings and conversations with clean energy market participants, presented at 61 clean energy industry events, and engaged in broad outreach related to NYGB activities through Statewide Meeting Series events, discussions around two new Requests for Information (“RFIs”), industry round tables, working groups, regular mailings, a new LinkedIn page and interviews with industry stakeholders. At March 31, 2017, NYGB had 19 employees across Investment & Portfolio Management, Risk & Compliance, Legal & Regulatory and Operations & Finance functions, representing lean staffing given the level of activity.
28 Source: NYGB analysis; SS&C data. Deployed Funds in this instance do not net out principal repayments as defined by the Metrics Plan. 29 Source: NYGB analysis; NYGB data. 30 All are available at: www.greenbank.ny.gov/About/Public-Filings and www.greenbank.ny.gov/Resources/Publications-and-Events.
Operational Performance at a Glance As of March 31, 2017
High Degree of Transparency into Activities
Improving Data Capture & Reporting
Continued Outreach to Market Participants &
Stakeholders
Operating Efficiently
Infrastructure Developed to Manage Growing Portfolio

17
NYGB_2017_Business_Plan_PSC_Filing_FINAL.docx
2016 – 17 Plan Deliverables
NYGB described its specific deliverables for the 2016 – 17 Plan Year in the 2016 Plan. NYGB succeeded in meeting these deliverables, summarized below in Table 2. The 2016 Plan also outlined the key activities which NYGB would undertake in the 2016 – 17 Plan Year in furtherance of its mission and goals. The balance of this Part II specifically addresses deliverables and performance in each activity area. Table 2: 2016 – 17 Plan Deliverables & Status
Category Deliverable Status Strong Active Pipeline Active Pipeline Maintain an Active Pipeline
of at least $300.0 million. Achieved: The Active Pipeline of potential
investments proceeding to close was $591.7 million at March 31, 2017 (see Section 2.7).
CRM, Transaction Pipeline & Portfolio Management Infrastructure
Implementation of third-party platform, full “go live”.
Achieved: NYGB brought its customer relationship management (“CRM”), transaction, pipeline and portfolio management infrastructure from selection of DealCloud Inc. (“DealCloud”) as preferred provider to “go live” in the 2016 – 17 Plan Year (see Section 2.14).
Portfolio Driving Material Clean Energy Investments Across NYS Committed Funds Commit $200.0 million to
NYGB investments per year, equating to an average of $50.0 million in closed transactions per quarter.
Achieved: NYGB closed 19 transactions totaling $291.6 million during the 2016 – 17 Plan Year (see Section 2.3).
Financing Ground-Mounted Solar Systems Targeting Corporate & Industrial End-Users
Publicly issue RFP. Achieved: NYGB launched RFP 7: Construction & Back-Leveraged Financing for Ground-Mounted Solar Generation Systems Targeting Corporate & Industrial End Users (see Section 2.8).
Financing Commercial Real Estate & Multi-Family Solar System &/or Energy Efficiency Purchases
Publicly issue RFP. Achieved: NYGB launched RFP 8: Financing Arrangements for Renewable & Energy Efficiency Projects: Office, Commercial & Industrial, and Multi-Family Real Estate Properties (see Section 2.8).
Fund Administration & Loan/Investment Servicing Infrastructure
Implementation of third-party platform, full “go live”.
Achieved: In January 2017, NYGB and SS&C Technologies (“SS&C”) completed detailed system design and implementation to accommodate all NYGB processes and procedures – as well as reflect all historic data and transactions since Inception, including achieving “go live” (see Section 2.13).

18
NYGB_2017_Business_Plan_PSC_Filing_FINAL.docx
Category Deliverable Status Available Capital Satisfy the Cash Release
Trigger pursuant to the Initial Capitalization Order through achieving a portfolio size of $150.0 million.
Achieved: On August 5, 2016, NYSERDA made a compliance filing with the Commission confirming that NYGB had committed $150.0 million to fully negotiated, signed and closed agreements (see Section 2.6).
Mobilizing Capital Mobilization Ratio Achieve an average,
portfolio-wide Mobilization Ratio of at least 3:1, driving towards a ratio of 8:1 across all NYGB investments by the end of the CEF term in 2025.
Achieved: Every dollar of NYGB investment as of March 31, 2017 is estimated to generate on average three dollars in total clean energy investment in the State (i.e., Total Project Costs (Cumulative)), with a trajectory that is expected to achieve at least the required 8:1 ratio by the end of the CEF in 2025 (see Section 2.5).
Significant Portfolio Growth
NYGB closed 19 investments totaling $291.6 million during the 2016 – 17 Plan Year, amounting to a new investment closing every 19 days on average. These new investments facilitate clean energy development in NYS in collaboration with private sector participants with an aggregate estimated total project cost in the range of $744.6 million to $1.1 billion. At March 31, 2017, NYGB’s Overall Investments to Date was $346.1 million. Summaries of all transactions which NYGB closed in 2016 – 17 are contained in Schedule 1 and Figure 6 below shows Overall Investments to Date by month during the previous fiscal year.

19
NYGB_2017_Business_Plan_PSC_Filing_FINAL.docx
Figure 6: Overall Investments to Date Month-By-Month, 2016 – 17 Plan Year
Financial Performance & Self-Sufficiency
NYGB’s strong Investment Portfolio has driven significant growth in Operating Revenues for the 2016 – 17 Plan Year. NYGB’s performance overall in the past year has therefore produced annual net income for the first time, evidencing NYGB’s successful establishment as a sustainable investor of choice in clean energy financing markets that is responsive to the needs of its clients and counterparties. Annual net income marks a fundamental milestone representing NYGB’s achievement of self-sufficiency. This milestone has been reached one full year early: by March 31, 2017 versus the target of March 31, 2018 first articulated in the “Clean Energy Fund Information Supplement”, filed by NYSERDA with the Commission on June 25, 2015 (the “CEF Information Supplement”).31 The trend towards self-sufficiency over the past two fiscal years, driven by NYGB’s total revenues and expenses on an annual basis, is shown in Figure 7.
31 Available at www.greenbank.ny.gov/-/media/greenbanknew/files/2015-NYGB-Clean-Energy-Fund-Information-Supplement.pdf.
$346.1
$-
$50
$100
$150
$200
$250
$300
$350
$400
$ M
illio
ns
Source: NYGB Analysis; DealCloud Data

20
NYGB_2017_Business_Plan_PSC_Filing_FINAL.docx
Figure 7: Annual Revenues vs. Expenses 2015 – 16 & 2016 – 17
Additional financial highlights are discussed in this Section 2.4. Detailed financial information is included in NYGB’s Audited Financials, which will be included in NYGB’s Annual Financial Metrics Report to be filed on June 29, 2017. NYGB’s income statement for the past fiscal year, showing net income of $2.7 million, is included in Table 3. Table 3: Net Income (Loss)
(Amounts in $ thousands)
March 31, 2017
March 31, 2016
Operating Revenues: Fees $3,399 402 Loans and financing receivables interest 5,373 126 Total operating revenues: 8,772 528 Operating Expenses:
Salaries and benefits 4,371 4,053 Investment-related expenses 520 211 Program operating costs 914 174 General and administrative expenses 979 889 Depreciation 124 120
NY State assessments 124 91 Total operating expenses 7,032 5,538 Non-Operating Revenues:
Investment income 921 1,280 Total non-operating revenues 921 1,280 Net income (loss) $2,661 (3,730)
$1.8
$9.7
$5.5
$7.0
$(3.7)
$2.7
$(6)
$(4)
$(2)
$-
$2
$4
$6
$8
$10
$12FY '15-16 FY '16-17
$ M
illio
ns
Revenues Expenses Net Income Net Loss
Source: NYGB Analysis; Financial Statement Data

21
NYGB_2017_Business_Plan_PSC_Filing_FINAL.docx
The key components driving NYGB’s financial results in the last fiscal year include:
(a) An increase of $8.2 million in Total Operating Revenues from the prior year, comprising fees and interest. Fees (i.e., closing, undrawn/commitment and administrative fees) were $3.4 million and interest on these investments was $5.4 million. These respectively represent significant increases from 2015 – 16 and are a direct product of the growth in NYGB’s Investment Portfolio during the year;
(b) Investment Income declined $0.4 million, as a result of NYGB putting money to work across its substantially larger clean energy Investment Portfolio and thereby reducing its average investment balance;32
(c) Total Operating Expenses increased $1.5 million, most significantly driven by increases in Investment-Related Expenses and Program Operating Costs, both of which tend to scale with investment activity;
(d) Salaries and Benefits, which includes NYGB staff salary expenses, allocated fringe benefit expenses, and NYSERDA-allocated administrative salary expenses, increased $0.3 million from the prior year. This occurred due to an increase in NYGB’s staffing as well as an increase in the overall pool of allocable expenses of which NYGB pays it pro-rata share;
(e) General and Administrative Expenses, which include allocable costs such as rent, utilities, and insurance, increased $0.1 million due to an increase in NYGB’s pro-rata share; and
(f) Depreciation and NY State Assessments reflect NYGB’s allocable share of NYSERDA’s depreciation and NYSERDA’s cost recovery fee assessment from the State of New York respectively.
NYGB’s allocated capital position is set out in Table 4 and reflects the funding of capital installments to NYGB pursuant to the Commission Orders.33 NYGB’s forecasted liquidity needs are fully addressed through access to funded capital installments up to $1.0 billion in aggregate that will occur as further NYGB transaction commitments are made, consistent with the administration of the CEF by NYSERDA, or through the use of a credit facility as described in the CEF Order34 (the “NYGB Credit Facility”), if and when required. Table 4: Allocated Capital Position
(Amounts in $ thousands) March 31, 2017 March 31, 2016 Allocated Capital (beg) $218,500 218,500 Capital Installment 150,000 - Allocated Capital (end) $368,500 218,500
Impact Benefits for All New Yorkers
At the end of the fiscal year NYGB’s Investment Portfolio was expected to deliver between 217.0 and 341.0 MW of clean energy installed capacity and produce estimated lifetime clean energy generation of between 5.89 and 9.71 million MWh in NYS. At the same time, the Investment Portfolio was expected to contribute at least 162.0 MW of new installed capacity to the residential energy sector, with another 19.0 MW (minimum, expected) to be installed in the commercial and industrial (“C&I”), municipal-university-school-hospital (“MUSH”) and community distributed generation (“CDG”) end-user segments in aggregate. The remaining 36.0 MW of clean energy installed capacity is attributed to other investments in NYGB’s Investment Portfolio.
32 It is NYGB’s practice to invest any cash balances from time to time in low risk instruments. 33 Part of NYGB’s establishment involved the authorization of $17.5 million of the initial capitalization of $218.5 million for start-up and
administration expenses. At March 31, 2017, NYGB’s cumulative (direct and indirect) operating expenses were $16.7 million, leaving a balance of $0.8 million of the allocated administrative expense allowance. In addition, at the end of the same period, NYGB’s cumulative (operating and non-operating) revenues totaled $12.9 million. These funds are available and being used for further NYGB sustainable infrastructure investments. Once the $17.5 million in allocated administrative expenses has been expended in full, NYGB’s expenses will be met by revenues, with any excess revenues being applied to NYGB’s sustainable infrastructure investing activities.
34 CEF Order, page 108.

22
NYGB_2017_Business_Plan_PSC_Filing_FINAL.docx
From an energy efficiency perspective, NYGB made investments in combined heat and power (“CHP”), fuel cell technology, light emitting diode (“LED”) lighting retrofits, heating, ventilation and air conditioning (“HVAC”) and other building retrofits. The Investment Portfolio is expected to contribute an estimated range of 9.39 – 10.26 million MMBtu cumulative lifetime net fuel energy savings from fuel efficiency measures (net of CHP fuel usage), and 1.13 – 1.23 million MWh cumulative lifetime energy savings from electrical efficiency measures. The growth in NYGB’s clean energy investments in the 2016 – 17 Plan Year means that its Investment Portfolio is expected to deliver between 4.26 and 6.37 million metric tons in lifetime GHG emissions reductions, a significant increase from 1.6 million metric tons estimated at the end of 2015 – 16. This is equivalent to removing between 50,000 and 70,000 cars off the roads for the next 20 years. Complementary to energy and environmental outcomes, NYGB investments assist counterparties in scaling their businesses. Increased activity and scale is expected to drive additional job creation in the State as clean energy projects continue to be originated, developed, operated and maintained for years to come. Figure 8 (below) illustrates how certain Impact Benefits of NYGB’s Investment Portfolio as of March 31, 2017 are expected to be realized over the CEF term as clean energy projects are completed, put into service and operate for their expected useful lives. For each NYGB investment, clean energy project(s) are developed during its capital availability period. These periods vary depending upon the particulars of each investment and currently range from less than one year to over five years in duration. Capital committed can either be deployed in full at the time of transaction execution, or throughout the capital availability period (e.g., when certain milestones are achieved, such as when permitting is achieved, equipment orders placed and funds drawn to pay for delivery and construction). On expiration of the capital availability period, all systems built and placed in service will begin their First-Year of generating impact benefits. NYGB uses the technology’s Useful Life to calculate the Lifetime Impact Benefits, and will report this as a realized Impact Benefit, hence why Figure 8 illustrates the Investment Portfolio’s realization of Lifetime GHG Emissions Reductions on an installed basis. Figure 8: Estimated Portfolio Lifetime GHG Emissions Reductions as of March 31, 2017
This relationship between capital committed and realization of Impact Benefits is non-linear, as NYGB expects to

23
NYGB_2017_Business_Plan_PSC_Filing_FINAL.docx
commit capital at a rate of $50.0 million per quarter on average (i.e., $200.0 million per year), whereas the deployment of systems in NYS will be realized over multi-year periods as counterparties develop new projects in the future, hence the lagged profile shown in Figure 8. The First-Year benefits of the Investment Portfolio as of March 31, 2017 are expected to be fully realized in 2022, which is estimated to yield between 230,000 and 321,000 metric tons of First-Year GHG emission reductions, resulting in Lifetime GHG emissions reductions between 4.26 and 6.37 million metric tons in NYS. In terms of capital mobilization, NYGB’s Investment Portfolio as of March 31, 2017 is estimated to generate three times its value in total clean energy project costs on average across the portfolio, with a trajectory that is expected to achieve at least the required eight times multiple over the CEF’s 10-year life.35
Capital Installment of $150.0 Million & Ongoing Liquidity
The CEF Order established incremental ratepayer collections in varying amounts from 2016 through 2025 totaling $631.5 million to complete funding of NYGB’s authorized $1.0 billion capital. On August 5, 2016, NYSERDA made a compliance filing with the Commission confirming that NYGB had committed $150.0 million to fully negotiated, executed and closed agreements pursuant to the “Order Approving Additional Capitalization with Modification for New York Green Bank” issued and effective July 17, 2015.36 Following this filing, NYGB received a further capital installment of $150.0 million. NYGB’s forecasted liquidity needs are fully addressed through access to funded capital installments (up to the authorized $1.0 billion) that will occur as further NYGB transaction commitments are made, consistent with the administration of the CEF by NYSERDA, or through the NYGB Credit Facility, if and when required.
Active Pipeline of at Least $300.0 Million
NYGB has received over $2.0 billion in investment proposals from Inception and through March 31, 2017. Its Active Pipeline of potential investments proceeding towards close was $591.7 million as of March 31, 2017, and continues to be diversified across technology, location, and end-user segments. The average Active Pipeline per quarter during the 2016 – 17 Plan Year was $588.1 million.
Targeted Investment Solicitations
To complement RFP 1,37 in March 2017, NYGB launched two additional specific product RFPs as the culmination of two separate multi-month processes (each including extensive industry meetings and input conducted in the first quarter of the 2016 – 17 Plan Year, and round table discussions convened on September 16, 2016). NYGB’s activity in the clean energy financing market enables it to identify project types seemingly impeded by financing barriers that NYGB may be positioned to address with a targeted offering. In March 2017, NYGB launched the following Investment RFPs, both of which are ongoing (i.e., without any specified closing date, such that proposals are reviewed on a rolling basis as received):
(a) RFP 7: Construction & Back-Leveraged Financing for Ground-Mounted Solar Generation Systems Targeting Corporate & Industrial End Users (“RFP 7”). RFP 7 is targeted at developers of photovoltaic (“PV”) solar projects selling to C&I and other institutional organizations in NYS which plan to utilize third-party tax equity and seek back-leveraged financing for projects that: (1) realize revenue from power generation sold to C&I users and through compensation mechanisms in accordance with applicable laws, regulations or administrative proceedings; (2) use approved technology;38 (3) are in the advanced stage of development; and (4) are ground-mounted, canopy-mounted and non-residential rooftop PV solar projects; and
35 For a complete list of NYGB’s estimated impact benefits as of March 31, 2017, see Metrics, Reporting & Evaluation, Quarterly Report No.
11 (Through March 31, 2017), available at www.greenbank.ny.gov/-/media/greenbanknew/files/2017-NYGB-Quarterly-Report-March.pdf. 36 Cases 13-M-0412 and 14-M-0094. This compliance filing is available at www.greenbank.ny.gov/About/Public-Filings. 37 On March 31, 2017, NYGB publicly issued its updated Request for Proposals No. 1 Version 3.0 (“RFP 1”). RFP 1 was originally issued by
NYGB in February 2014 and was subject to minor revisions in July 2014 (Version 2.0). 38 Approved technology for the purposes of RFP 7 includes “Tier 1” suppliers which means, in the context of PV project financing, those top
tier module manufacturers that are considered “bankable”.

24
NYGB_2017_Business_Plan_PSC_Filing_FINAL.docx
(b) RFP 8: Financing Arrangements for Renewable & Energy Efficiency Projects: Office, Commercial &
Industrial, and Multi-Family Real Estate Properties (“RFP 8”). RFP 8 is targeted at commercial and multi-family building owners, relevant lenders and investors, and clean energy contractors/service providers focused on such properties, seeking to finance the purchase of energy efficiency and/or renewable energy assets.
Both new investment solicitations, together with all related documentation and instructions, are publicly available on NYGB’s website at www.greenbank.ny.gov/Working-with-Us/Propose-an-Investment.
RFP Enhancements
NYGB further optimized its investment intake process by revising its Investment RFPs, commencing with revisions to RFP 1. There is more to be done in the 2017 – 18 Plan Year, as discussed further in Sections 3.2.1 and 3.2.3. In addition, NYGB created new resources for those proposing investments (“Proposers”). The new “RFP Resources” include additional materials to provide greater clarity to Proposers on NYGB requirements. NYGB also published a standardized, indicative term sheet. NYGB’s standardized term sheet identifies common terms considered in structuring investments. Having indicative NYGB terms and conditions available in the marketplace allows Proposers and others to understand NYGB’s commercial structures and approaches early in clean energy project development and enhances understanding and efficiencies throughout the investment process. RFP Resources (including the indicative term sheet and illustrative guidelines for eligible technologies) are available at: www.greenbank.ny.gov/Resources/RFP-Resources.
Syndicate Participation in NYS Clean Energy Development
NYGB successfully engaged eight syndicate groups during the 2016 – 17 Plan Year. Participating in financing syndicates attracts large investment pools and national clean energy providers that might not ordinarily focus on or prioritize development in NYS. By drawing clean energy participants that operate at scale into NYS, NYGB will continue to accelerate realization of CEF, CES and SEP objectives, as well as contribute to clean energy financial market transformation.
Proposer, Capital Provider & Stakeholder Engagement
During the 2016 – 17 Plan Year, NYGB conducted thousands of meetings and conversations with clean energy market participants, presented at 61 clean energy industry events, and engaged in broad outreach related to NYGB activities through Statewide Meeting Series events, discussions following the release of two RFIs, industry round tables, working groups, Quarterly Metrics Report webinars, press releases, regular mailings, a new LinkedIn page and interviews with industry stakeholders. Highlights include:
(a) Involved in ongoing process and meetings focused on addressing clean energy access for low and moderate income (“LMI”) households, including participation in the NYSERDA Low-Income Forum on Energy (LIFE) Conference39 and other discussions around LMI issues relating to the Value of Distributed Energy Resources (“VDER”) proceedings,40 and continued discussions with various Community Development Finance Institutions (“CDFIs”) to identify potential collaborations with NYGB;
(b) Spoke at NYS Economic Development Council’s Annual Meeting in Albany on innovative financing
structures to support economic development in the State through clean energy finance; (c) Engaged with NY Prize Community Microgrid competition participants, including announcing on March
23, 2017 NYGB’s ability to facilitate up to $50.0 million in financing assistance per project to Stage 3 39 www.nyserda.ny.gov/All-Programs/Programs/Low-Income-Forum-on-Energy. 40 Case 15E-0751, www3.dps.ny.gov/W/PSCWeb.nsf/All/8A5F3592472A270C8525808800517BDD?OpenDocument.

25
NYGB_2017_Business_Plan_PSC_Filing_FINAL.docx
winners, subject to NYGB’s investment criteria, due diligence and financial analysis; (d) Participated in the NY-BEST Annual Storage Investment Conference, Green Bonds Americas 2016 and
the Opening Ceremony of NY Energy Week; (e) Discussed NYSERDA’s role in advancing clean energy initiatives with hundreds of attendees at the Great
NYS Fair in Syracuse in August 2016, with a focus on incentives available for homes and small businesses;
(f) Held multiple events around the State as part of the annual Statewide Meeting Series, including in
Mohawk Valley (Utica), Western New York (Buffalo), Central New York (Syracuse), the Capital Region (Albany), Long Island (Farmingdale), Southern Tier (Binghamton) and Mid-Hudson (Poughkeepsie). NYGB also continued interactions with regional representatives from Empire State Development to maximize coordination and reach;
(g) Held stakeholder meetings in September 2016 with interested developers, tax equity providers, advisors
and lenders as part of two RFIs that NYGB issued in June 2016. Information received in those stakeholder discussions resulted in the issuance (and promotion) of new RFPs 7 and 8;
(h) Hosted several industry round tables for market participants from various segments of the clean energy
marketplace, including energy storage, C&I energy efficiency, and CDG sectors, focusing on financing gaps and market barriers hindering wide-scale deployment throughout the State;
(i) Organized and hosted a working group with New York’s investor-owned utilities to explore opportunities
for collaboration, including municipal street light conversions, on-bill recovery financing options and REV demonstration projects;
(j) Held the first two of an ongoing series of Quarterly Metrics Reports webinars for interested parties, as part
of more regular and structured outreach to stakeholders on NYGB’s performance and activities; (k) Issued press releases highlighting six new transactions in the first quarter of 2017,41 13 new transactions
in 2016,42 NYGB’s first transaction to expand fuel cell use in NYS,43 an energy efficiency equipment financing transaction with Long Island’s Northport School District,44 progress on Green Bank Network mobilization goals,45 a transaction facilitating residential solar financing for over 8,000 homes in NYS,46 and a transaction accelerating construction of residential solar projects in more than 5,000 homes in NYS;47
(l) Published NYGB’s 2016 Fall Newsletter, outlining recent investments and other NYGB developments; (m) Launched a LinkedIn page to keep interested stakeholders, counterparties and others updated on NYGB
activities, job openings, RFP opportunities and other organizational updates; (n) Conducted numerous interviews with reporters, journalists, researchers, and industry stakeholders
seeking NYGB input into issues around its capital solutions to advance clean energy deployment, environmental, social and governance (“ESG”) investing, public-private partnerships, NYGB’s role in the State’s evolving clean energy transition and other areas of focus;
(o) Continued development of a Statewide approach to structuring, financing and implementing LED street
41 www.greenbank.ny.gov/News/In-The-News/2017-04-27-NY-Green-Bank-Closed-Record-New-Transactions. 42 www.greenbank.ny.gov/News/In-The-News/2017-01-18-NY-Green-Bank-Announces-Closing-of-13-Transactions-in-2016. 43 www.greenbank.ny.gov/News/In-The-News/2016-12-23-First-Transaction-to-Expand-Fuel-Cell-Use. 44 www.greenbank.ny.gov/News/In-The-News/2016-11-01-NY-Green-Bank-Northport-Long-Island-Energy-Financing. 45 www.greenbank.ny.gov/News/In-The-News/2016-10-27-Green-Bank-Network-Announces-Milestone-at-OECD-Green-Investment-
Financing-Forum. 46 www.greenbank.ny.gov/News/In-The-News/2016-08-05-NY-Green-Announces-Closing-of-37-Million-Solar-Transaction. 47 www.greenbank.ny.gov/News/In-The-News/2016-06-27-NY-Green-Bank-Announces-Closing-of-25-Million-Construction-Loan.

26
NYGB_2017_Business_Plan_PSC_Filing_FINAL.docx
lighting, together with interested utilities and municipalities; and (p) Held conversations with family offices and other investors seeking to deploy capital toward meeting
certain ESG and Socially Responsible Investment (“SRI”) goals in NYS, to advance efforts to ensure that investments advance non-financial outcomes in measurable ways.
Evaluation, Measurement & Verification
In the last quarter of the 2016 – 17 Plan Year, NYSERDA and NYGB commenced the specific design and implementation of a long-term review of the Investment Portfolio, including a framework to determine how to execute the baseline evaluation48 for both financial market transformation and energy and environmental impact. Transaction Profiles outline the planned market characterization baseline and market transformation potential, along with the proposed method of outcome evaluation and timeframe, for each NYGB investment. Baseline evaluation activities across the whole NYGB portfolio will commence in the 2017 – 18 Plan Year, based on investments closed in the period ending March 31, 2017 (discussed further in Section 3.2.8).
Fund Administration & Loan/Investment Servicing
In March 2016, NYGB publicly issued its “Request for Proposals – Fund Administration, Loan/Investment Servicing (“RFP 4”). RFP 4 was launched to retain independent fund administration and loan/investment servicing to help meet and manage NYGB’s middle- and back-office needs consistent with industry best practices for comparable funds (in both the private and public sectors), while taking into account the unique aspects of NYGB. This represented a refinement and relaunch of a process commenced in Spring 2015 that failed to yield an arrangement with a suitably qualified counterparty on acceptable terms and conditions. RFP 4 submissions were due March 28, 2016 and NYGB’s evaluation of the responses received occurred in the second quarter of 2016, with the selection of SS&C as the preferred provider.49 Following execution of a service contract between SS&C and NYGB in August 2016, the NYGB, NYSERDA and SS&C teams undertook to build and implement the platform, loading all historical financial and investment data. In January 2017, NYGB and SS&C completed detailed system design and implementation to accommodate all NYGB processes and procedures – as well as reflect all historic data and transactions since Inception, including achieving “go live”. NYGB is already realizing material efficiencies since “go live” of the platform and the creation of more end-to-end processes and reduction of duplicative and/or highly manual activities.
CRM, Transaction, Pipeline & Portfolio Management
In March 2016, NYGB publicly issued an RFP for CRM, Transaction Pipeline & Portfolio Management (“RFP 5”) services to retain a third-party platform to provide NYGB with a secure, robust and cost-effective platform to help NYGB manage its transaction pipeline, portfolio and internal and external reporting requirements. Proposals were received in late March 2016, resulting in the selection, contractual negotiation, and implementation of the DealCloud platform for NYGB between March and November 2016.50 In December 2016, NYGB and DealCloud launched a customized system and achieved “go live” and NYGB continues to optimize and customize the system to maximize effectiveness, efficiencies and user experience.
Metrics Plan Revision & Stakeholder Process
As required by the CEF Order, NYGB completed activities related to the revision of the Metrics Plan. To create maximum opportunity for interested parties to provide input into the revised Metrics Plan, NYGB organized and hosted a number of focus group sessions in Albany and New York City during April and May 2016. These sessions involved outreach to interested stakeholders, other interested parties and the NYS Department of Public
48 A baseline evaluation is the initial measurement of a metric or indicator collected early in the investment term. The purpose of the baseline
information is to assess the effect of the investment, both before and after execution. The baseline evaluation occurs during the early stages of an investment term, with a follow up evaluation occurring some defined period after the investment has reached maturity.
49 “NY Green Bank Selects SS&C for Loan Servicing, Investment Servicing, and Fund Administration,” May 10, 2017, available at: www.ssctech.com/AboutUs/PressRelease/tabid/593/Default.aspx?N=857&yr=.
50 “NY Green Bank Chooses DealCloud,” January 18, 2017, available at: www.dealcloud.com/Insights/PressAndMedia/NYGreenBank.

27
NYGB_2017_Business_Plan_PSC_Filing_FINAL.docx
Service (“DPS”) staff. All comments and inputs were collated and reviewed by theme, and considered in preparing the revised Metrics Plan. The revised version of the Metrics Plan was filed on June 20, 2016. To provide transparency to all parties, NYGB prepared a separate document (the Stakeholder Input & Disposition Document), filed contemporaneously with the revised Metrics Plan.51
Risk Framework & Processes
NYGB is exposed to two types of risks, those inherent to its investment selection and portfolio management activities, and those driven by internal and external factors that impact its ability to perform as an enterprise. NYGB must effectively manage its exposure to both categories of risk to grow its Investment Portfolio, remain self-sustaining and contribute to CEF, CES and SEP objectives. Over the past year, NYGB continued to refine the various procedures it previously put in place to identify, assess and mitigate investment selection risk as it evaluates prospective transactions and transaction participants. NYGB has established funding protocols for its portfolio and operations (specifying conditions that must be satisfied prior to NYGB funding) and monitoring criteria consistent with NYGB’s investment approval. Funding protocols also require multiple levels of approvals, from both investment and control functions. NYGB has instituted thorough investment monitoring processes including monthly, quarterly and annual transaction reviews to assess performance; quarterly reviews that compare operating and financial results and investment value with expectations; and quarterly portfolio and pipeline reviews with the IRC. NYGB assesses and rates the risk associated with each transaction individually and monitors these risks on an individual and portfolio basis, maintaining overall risk of loss within defined limits. Further information with respect to NYGB’s risk management and oversight framework is included in Schedule 2.
Additional Activities
Green Bank Network Activities
Since the launch of the international Green Bank Network (“Network”) in December of 2015, the group has strengthened its infrastructure as a unit, including the launch of a new website and the early stages of aggregating collective information relating to overall impact. As greater interest in the Green Bank model continues to emerge from states, municipalities, nations and global organizations, the Network serves as a useful resource in terms of amplified messaging and coordination. The Network has also provided consistent input around certain transaction and technology types along with evaluation methodologies which help all member Green Banks to leverage applicable lessons learned elsewhere and potentially expedite the speed with which they are able to deliver on their mandates.
Continued NYS Leadership
In response to a growing number of inquiries from interested parties around the world, NYGB presented on its mission, evaluation process, and other components of the business to groups and individuals representing a wide variety of stakeholder groups. Those audiences included, but were not limited to: representatives exploring collaborative opportunities as part of an ongoing US-Brazil Climate Change Working Group; individuals involved with the development of a Green Bank in India; public officials developing a Green Bank model for Ontario; an Australian firm focused on the role of financing in the electricity market transition; a group of high-level Ukrainian officials seeking better understanding of low emissions development strategies in NYS – particularly how to address market barriers for greater investment mobilization into clean energy technologies; representatives from the International Finance Corporation and Tata Clean Tech Group, interested in innovative clean energy financing opportunities; representatives from the Private Sector Facility of the Green Climate Fund, interested in public-private partnership models to advance climate finance solutions; and Canadian high level government officials on the topic of ESG investing and finance. 51 “NY Green Bank Metrics Plan 3.0 Stakeholder Input & Disposition”, June 20, 2016, (Case 13-M-0412), available at:
www.greenbank.ny.gov/-/media/greenbanknew/files/Metrics30StakeholderInputDisposition.pdf.

28
NYGB_2017_Business_Plan_PSC_Filing_FINAL.docx
Part III
Annual Business Plan 2017 – 18

29
NYGB_2017_Business_Plan_PSC_Filing_FINAL.docx
2017 – 18 Plan Objectives
NYGB made 24 investments as of March 31, 2017, and continues to build its experience and reputation in the sustainable infrastructure investment sector. The 2017 – 18 Plan Year is one where a relentless focus on successful execution and continuing to build NYGB’s track record to further secure targeted financial, energy and environmental outcomes are paramount. The 2017 – 18 Plan Year is also one in which NYGB seeks to further institutionalize all aspects of its business (i.e., formalize, standardize and streamline all business practices). These actions remain part of the core strategy as NYGB continues to mirror a private sector approach to investment management and further demonstrate the viability and commerciality of clean energy investments in NYS using a creative, problem-solving approach. Given the tight focus on execution, NYGB’s overarching objectives in 2017 – 18 remain consistent at the highest levels, as set out in Figure 9. Figure 9: 2017 – 18 Plan Objectives
Put ratepayer money to work, prudently: Commit $550.0 million (cumulative) to NYGB investments over the fiscal year ending March 31, 2018, with an average of $50.0 million in closed transactions per quarter.
Mobilize capital: Maintain an average, portfolio-wide Mobilization Ratio of at least 3:1 (the ratio of
Total Project Costs (Cumulative) to NYGB Overall Investments to Date), driving towards a ratio of at least 8:1 across all NYGB investments by the end of the CEF term in 2025.
Maintain self-sufficiency: Continue to grow revenues and manage expenses to maintain self-
sufficiency and generate net income.

30
NYGB_2017_Business_Plan_PSC_Filing_FINAL.docx
2017 – 18 Plan Deliverables
Specific deliverables that collectively mark progress in meeting NYGB’s overarching objectives are set out in Table 5. Progress against the 2017 – 18 Plan Deliverables (collectively, the “Plan Deliverables”) will be reported in Quarterly Metrics Reports, filed pursuant to the Metrics Plan, together with a brief narrative (as appropriate) of status and an explanation of any material variances relative to expectations. This is in addition to the normal scope of quarterly reporting, including with respect to Impact Benefits. Table 5: 2017 – 18 Plan Deliverables
Category Deliverable Strong Active Pipeline
Active Pipeline Maintain an Active Pipeline of at least $300.0 million on average throughout the year.
Create an online portal for submission of Investment RFPs to NYGB with straight-through processing and data collection in NYGB’s CRM system to make management and reporting tools more efficient and effective.
Portfolio Driving Material Clean Energy Investments Across NYS Committed Funds Commit $550.0 million (cumulative) to NYGB investments, equating
to an average of $50.0 million in closed transactions per quarter. Issue CDG RFP Publicly Issue RFP. Issue Interconnection Bridge Loan RFP
Publicly issue RFP.
Perform Initial Evaluation Activities
Engage with independent evaluators to conduct baseline assessments for both financial market transformation and energy and environmental impact of NYGB’s Investment Portfolio.
Mobilizing Capital Mobilization Ratio Achieve an average, portfolio-wide Mobilization Ratio of at least
3:1, driving towards a ratio of 8:1 across all NYGB investments by the end of the CEF term in 2025.
Each of the Plan Deliverables tie directly to achievement of NYGB’s mission discussed in Section 1.3. By sourcing, structuring, negotiating and entering into clean energy investments meeting its investment criteria on commercial terms, NYGB will continue to provide financial, energy and environmental and capital mobilization outcomes consistent with near, mid and end of CEF term goals.

31
NYGB_2017_Business_Plan_PSC_Filing_FINAL.docx
2017 – 18 Activities to Meet Objectives & Deliverables
Building & Maintaining Active Pipeline
NYGB will remain focused on the key areas of its investment management business that are critical to continued growth in the Investment Portfolio, namely, lead generation and origination efforts (including marketing and outreach), conversion of leads to proposals and proposals to closed transactions by executing on a series of initiatives, as described below. The quality, depth and breadth of NYGB’s pipeline are fundamental drivers to transform the markets for clean energy finance in NYS and deliver Impact Benefits. Accordingly, NYGB’s 2017 – 2018 activities are anchored in continued development and maintenance of origination activities and strong pipeline. This is achieved through ongoing outreach to, and interaction with, a wide variety of potential Proposers and NYGB’s constant collaboration with clients and counterparties. Other related activities include:
(a) Issue CDG RFP: Providing all ratepayers with access to renewable electric power if they choose is a State-level priority. In July 2015, the Commission established a program called Community Distributed Generation (“CDG Program”)52 to provide opportunities for customers unable to site solar, small wind, or other distributed generation on their own property to participate directly in off-site projects.53 Community solar, for example, refers to solar-electric systems that provide power and/or financial benefit to, or are owned by, multiple community members.54 This represents a new market opportunity without standardization and NYGB will continue to work with the CDG Program and otherwise to overcome financial barriers to achieve greater deployment of CDG projects in NYS, incorporating VDER concepts in financing structures.
(b) Issue Interconnection Bridge Loan RFP: NYGB has made two investments that address a particular
market barrier currently facing CDG projects in NYS. That is, project sponsors are often expected to pay for interconnection upgrade expenses with equity funds as they finalize construction financing arrangements. This results in a relatively inefficient use of sponsor equity, in turn restricting project deployment efforts and effectively limiting the amount of CDG being installed in NYS.
NYGB plans to issue an “Interconnection Bridge Loan RFP” that will encourage a more efficient use of sponsor equity and support CDG, and potentially other distributed generation, project development efforts in NYS. As with prior Investment RFPs, NYGB intends to present standardized terms to qualified clean energy market and financing participants for potential bridge financing to overcome this existing barrier. NYGB’s role is expected to create an easier path forward for developers and enable greater deployment of community and other distributed generation assets throughout the State and encourage third-party financing participation.
(c) Further Develop CRM System: NYGB will put additional focus on tracking and reporting leads through its CRM system and expects to develop certain reports that will be used regularly to remind those with origination duties of the contacts they have made that could convert leads to proposals (e.g., tickler systems to track follow-up with leads, developing the system that captures notes from leads, and tying together relevant information for particular opportunities in one centralized location).
(d) Improve Presentation & Marketing Materials: NYGB will improve its communications with potential
Proposers and stakeholders throughout NYS and beyond by focusing its efforts to improve various marketing and other materials (e.g., improving the quality and visualization of NYGB materials).
(e) Improve Proposal Intake (RFP) Process: NYGB recognizes the importance of operating consistently with
industry best practice approaches – both in the private and public sectors, while simultaneously adhering
52 Case 15-E-0082, “Order Establishing a Community Distributed Generation Program and Making Other Findings”, issued and effective July
17, 2015. 53 Ibid. 54 See, for example, U.S. Department of Energy, “A Guide to Community Solar”, available at www.nrel.gov/docs/fy11osti/49930.pdf.

32
NYGB_2017_Business_Plan_PSC_Filing_FINAL.docx
to all applicable NYS and NYSERDA regulations and policies. In the 2016 – 17 Plan Year, NYGB made some progress in streamlining its investment proposal intake process. NYGB seeks to further refine its portal to allow for even greater efficiency and less manual intervention for both Proposers and NYGB in the capture and evaluation of all necessary information for better business planning and management purposes. In the 2017 – 18 Plan Year, NYGB seeks to implement a fully web-based solution allowing for online submissions, with data that directly feeds its CRM platform through form fillable fields with automated data capture and reporting.
Revenue & Expense Targets
NYGB will be managed with a view to meet the forecast Revenue, Expense and Net Income targets set out in Table 6. Table 6: Actual & Forecast Net Income (Loss)
Actual FY 2015 – 16
Actual FY 2016 – 17
Forecast FY 2017 – 1855
% Change 2017 – 18
Forecast to FY 2016 – 17 Actual
Revenues $1.8 million $9.7 million $18.0 million 85.6% Expenses $5.5 million $7.0 million $12.5 million 78.6% Net Income (Loss) ($3.7 million) $2.7 million $5.5 million 103.7% Source: NYGB Audited Financials; NYGB analysis
Optimizing Performance & Impact
(a) Continued Emphasis on Investment Evaluation & Portfolio Management: As investment volumes increase and drive efficiencies of scope and scale, NYGB will remain prudent and adhere to the Commission’s key investment criteria. Rigor in the diligence process, oversight of each commitment and active portfolio management will continue to be emphasized. A judicious approach to staffing is necessary to ensure that NYGB has sufficient resources to continue origination, conversion and ongoing monitoring in connection with existing investment execution and management as the Investment Portfolio grows.
(b) Continue Best-Practice Risk Management: Effective risk management efforts ultimately result in higher
return on investments and greater public benefits, both of which advance NYGB’s goal of maintaining self-sufficiency and help ensure that NYGB remains a prudent steward of the considerable ratepayer funds with which it is entrusted. NYGB will continue efforts to maintain excellence in its risk and compliance tools and frameworks as well as its internal operations and procedures. As its Investment Portfolio grows, NYGB will continue reviews on a monthly, quarterly and annual basis to manage performance and identify and address risks and any issues as they may arise.
(c) Standardize, Formalize & Streamline Business Practices: As the Investment Portfolio grows, ongoing
opportunities exist for NYGB to reduce transaction costs by standardizing documents and procedures, and thereby exert downward pressure on capital costs across the market by gathering and making data available on project and investment performance (subject to commercial confidentiality practices and the protection of competitive information). Standardizing contracts and procedures plays an important role in developing capital markets for clean energy assets.
As part of its investment process, NYGB will continue to develop standardized business-level and legal term sheets and legal documentation in order to provide increased investment efficiencies over time, demonstrate best practices and further contribute to standardization. Improving market understanding of
55 The 2017 – 18 projected revenue and cost figures represent NYGB management’s best estimates at the date of this Plan. While due care
has been used in the preparation of forecast and estimated information, actual results may vary in a materially positive or negative manner. Forecasts and estimates are subject to uncertainty and contingencies outside NYGB’s control.

33
NYGB_2017_Business_Plan_PSC_Filing_FINAL.docx
clean energy asset classes in the State should produce more efficient and cheaper capital pricing for eligible technologies. Together, these efforts will help reduce remaining obstacles to private capital providers in scaling up their clean energy investment activity.
As an internal matter, NYGB will focus efforts to support the Investment and Portfolio Management functions by seeking ways to efficiently and effectively perform all middle and back-office functions, including managing those activities performed by service providers (e.g., SS&C for fund administration and loan/investment services) and reporting to all areas of the business and externally to stakeholders.
Further Mobilizing Capital to Invest in NYS Clean Energy
NYGB has demonstrated that many of the financial market barriers to clean energy projects in NYS are surmountable. Transferring its experience and approaches to the private sector by collaborating on scalable and replicable transactions remains a focus and priority for NYGB. NYGB will continue to employ measures it has used to date (such as described individually in Transaction Profiles) to accelerate clean energy deployment and mobilize third-party capital at the transaction level, and will work to innovate new approaches to mobilize transaction-level capital. Having become an established leader in the clean energy finance market with a sizable funded portfolio across multiple transactions, NYGB is also in position to demonstrate the attractiveness of a variety of clean energy investments on both a risk/return basis and in terms of Impact Benefits. Given NYGB’s success in unlocking opportunities in the clean energy market, its established team, established operations and continued robust pipeline, NYGB will also consider alternatives to mobilize third-party capital at the portfolio level, which has the potential to deliver even greater benefits to ratepayers. Although certain financial participants are, and will continue to be, participants in the individual transactions that NYGB supports, there is a meaningful set of institutional investors seeking to invest in clean energy deployment, but require the scale and ongoing investment opportunity only provided at a portfolio-level via NYGB’s activities. As such direct portfolio investment would be an additional and potentially highly impactful way to further accelerate third-party capital into NYGB’s target market, NYGB will work to determine the viability and attractiveness of this form of mobilization. NYGB’s approach can be scaled or replicated elsewhere and NYGB stands ready to collaborate with state partners and other parties through the U.S. Climate Alliance and other venues.
Continued Market & Stakeholder Outreach
NYGB will continue many of the initiatives commenced in the 2016 – 17 Plan Year and prior, including its newsletters, quarterly webinars, and various other efforts to interact with and update a large range of market participants. Further, NYGB will continue to provide extensive information to other stakeholders and the public, including through required filings such as annual business plans, quarterly and annual metrics reports, and detailed Transaction Profiles for all closed investments. This information will remain available on NYGB’s website.
Cultivating Opportunities Related to New State Programs & Initiatives
NYGB will continue to take leadership roles to establish financing approaches and solutions for demand that is developing, or is expected to be developed, as a result of new State policies, programs or initiatives, including the following:
(a) NY Prize: NYSERDA’s NY Prize56 is a first-in-the nation competition to help communities create microgrids (i.e., standalone energy systems that can operate independently in the event of a power outage). Community microgrids are at a nascent stage of development because they involve many users, and are much more complex than “within the fence” microgrids serving a single user. NY Prize offered support for microgrid feasibility studies (Stage 1) and audit-grade engineering design and
56 www.nyserda.ny.gov/All-Programs/Programs/NY-Prize.

34
NYGB_2017_Business_Plan_PSC_Filing_FINAL.docx
business planning (Stage 2), and now for project build-out and post-operational monitoring (Stage 3). Eighty-Three Stage 1 winners were announced in July 2015. Stage 2 proposals were due October 12, 2016 with winners announced on March 23, 2017, and Stage 3 proposals are anticipated to be due in April 2018.
As part of the selection of Stage 2 winners, NYGB announced that it is prepared to facilitate up to $50.0 million in financing assistance per project to Stage 3 winners57 subject to its investment criteria. NYGB will continue to work with NY Prize awardees as their projects mature to a level where they are potentially financeable.
(b) Renewable Heating & Cooling Technologies: In February 2017, Governor Cuomo announced a proposal to accelerate implementation of renewable heating and cooling technologies in New York, including a proposed two-year, $15.0 million program to provide rebates for the installation of ground-source heat pumps. The NYSERDA framework, the “Renewable Heating and Cooling Policy Framework: Options to Advance Industry Growth and Markets in New York,”58 sets out policy options and market-based solutions for the next few years, and identifies approaches for longer term action. NYGB views this proposal and related framework as an opportunity to advance clean energy technology deployment in NYS by coupling structured financial solutions with the rebate program and other activities that should drive demand.
(c) Energy Storage Projects: In April 2017, NYSERDA announced $15.5 million available for energy storage projects to support the electric grid, available through the CEF.59 Therein, it is noted that “while storage performs valuable system functions, it involves various stakeholders, programs and financial arrangements that can be difficult to navigate, making energy storage underutilized.” NYGB stands ready to engage with energy storage developers to achieve investments in projects meeting NYGB’s investment criteria.
(d) Valuing Distributed Energy Resources: In March 2017, the Commission issued an Order60 (the “VDER Order”) that outlines the first of two phases to move NYS from net energy metering (“NEM”) to a more precise approach to valuing distributed energy resources. The VDER Order represents an important policy initiative that will have a profound impact on the financing of renewable energy projects in NYS. As it is an innovative move for NYS, NYGB anticipates initial financing barriers may exist as more details emerge of the new market structure. To facilitate new distributed generation in the State, NYGB will work with the industry to find prudent and creative credit solutions that fit within the VDER framework. Additionally, NYGB will continue to organize round table discussions with developers and financial institutions in an effort to design financial products that are well-positioned to be embraced by private sector institutions.
(e) Biomass Projects: NYGB has identified that investment in CEF-compliant biomass projects is an area that suffers from a lack of dedicated financial sponsorship. Biomass projects (e.g., anaerobic digestion, biomass-to-energy, landfill-gas recovery, etc.) may present a market opportunity in terms of clean energy projects that are currently unsupported. NYGB will continue to explore pathways to identify pipeline opportunities in NYS and facilitate the activities required to attract third-party capital to develop this asset class.
(f) Municipal Energy-Efficient Street Lights: Street lighting consumes substantial portions of NYS municipal budgets that could be directed toward other municipal initiatives. As a result, it is a priority at NYS and municipal levels to reduce street lighting costs.
57 www.nyserda.ny.gov/About/Newsroom/2017-Announcements/2017-03-23-Governor-Cuomo-Announces-11-Million-Awarded-for-
Community-Microgrid-Development. 58 For more information regarding Governor Cuomo’s announcement and the NYSERDA framework, see:
www.nyserda.ny.gov/About/Newsroom/2017-Announcements/2017-02-07-Governor-Cuomo-Announces-Proposal-for-Rebate-Program-for-RHC.
59 For more information regarding NYSERDA’s announcement, see: www.nyserda.ny.gov/About/Newsroom/2017-Announcements/2017-04-19-NYSERDA-Announces-Millions-Available-for-Energy-Storage-Projects.
60 Cases 15-E-0751 et al., “Order on Net Energy Metering Transition, Phase One of Value of Distributed Energy Resources, and Related Matters”, issued and effective March 9, 2017.

35
NYGB_2017_Business_Plan_PSC_Filing_FINAL.docx
In the 2016 – 17 Plan Year, NYGB participated in various discussions about the financial barriers and potential solutions including a National Grid-hosted webinar focused on street light conversions from conventional to more energy-efficient street lights configured with “smart” control systems. NYGB offered the opportunity to structure a solution that would reduce or eliminate any upfront costs associated with such conversions. Since then, NYGB has been in conversations with multiple utilities and municipalities seeking to convert their street lights, and NYGB has developed several financing options that may be developed into a standardized offering in the 2017 – 18 Plan Year. NYGB expects to continue to proactively engage municipalities and utilities interested in such financial solutions.
(g) LMI Communities: NYGB will continue to seek opportunities to serve LMI communities that face financial barriers that can be addressed through structured solutions satisfying NYGB’s investment criteria. This includes working in conjunction with various NYS programs already active in addressing traditionally underserved LMI communities. In the 2016 – 17 Plan Year, NYGB closed a new transaction with NYCHA to finance energy efficiency retrofits in LMI housing developments which can be replicated with NYCHA and other public housing authorities (“PHAs”), as discussed in the transaction summary included in Schedule 1. In the 2017 – 18 Plan Year, NYGB will continue to proactively initiate efforts that assist foundations, CDFIs and others that work with LMI communities to devise solutions to financial barriers in this sector. In addition, NYGB intends to continue to use its convening power to catalyze as much as possible the creation of investment opportunities in this sector which are aligned with its mandate.
Growing Impact Benefits
NYGB considers the expected impact of its investments over the 10-year life of the CEF. This Section 3.2.7 and the following Section 3.2.8 describe the 10-year context, as well as discuss specific impact initiatives that will occur in the 2017 – 18 Plan Year. Figure 10 shows NYGB’s Investment Portfolio as of March 31, 2017 in the context of the 10-year CEF term and highlighting the capital already invested in clean energy projects and the corresponding range of estimated GHG emissions reductions expected to be achieved in NYS. This shows that NYGB is currently on track to meet key CEF goals.

36
NYGB_2017_Business_Plan_PSC_Filing_FINAL.docx
Figure 10: On Track to Meet Key CEF Goals as of March 31, 2017
As illustrated above – left to right – on March 31, 2017, the elapsed period of the CEF term was 12.5% of the total. NYGB expects to recycle its $1.0 billion authorized capital almost twice by 2025, resulting in NYGB putting to work $1.9 billion in overall investments and mobilizing $8.0 billion in Total Project Costs (Cumulative) in NYS. As shown in the center of Figure 10, Overall Investments to Date on March 31, 2017 equaled $346.1 million and was 18.2% of the way to the $1.9 billion target. NYGB’s Investment Portfolio was also on track in terms of meeting the GHG emissions reductions target, with estimated GHG emissions reductions expected to result from existing projects in the range of 14.7% to 22.0% of the 29.0 million metric tons goal.61
Baseline Evaluations of the Investment Portfolio
Pursuant to the CEF Order and CEF Information Supplement,62 NYGB’s portfolio is subject to baseline evaluations, and ongoing evaluations as the portfolio grows throughout the 10-year term of the CEF. From the development of the Metrics Plan, which involved extensive stakeholder, DPS and NYSERDA input, NYGB identified a set of financial and environmental impact metrics that are publicly reported on a quarterly basis. Consistent with the Metrics Plan, NYSERDA has engaged qualified and independent third-parties to evaluate NYGB’s portfolio to assess both the financial market transformation and energy and environmental impact of NYGB investments by focusing on product categories and other data reflected in NYGB public reporting. Each Transaction Profile describes both the impact that NYGB’s participation is expected to have in terms of incremental clean energy benefits in NYS and clean energy financial market transformation. Each Transaction Profile also outlines the planned market characterization baseline and market transformation potential, along with the proposed method of outcome evaluation and timeframe for each transaction. In early 2017, NYSERDA, working in collaboration with NYGB, commenced the process of reviewing the Investment Portfolio and creating a specific plan and framework for how to execute the baseline evaluation of the 61 For a complete list of NYGB’s estimated impact benefits as of March 31, 2017, see Metrics, Reporting & Evaluation, Quarterly Report No.
11 (Through March 31, 2017), available at www.greenbank.ny.gov/-/media/greenbanknew/files/2017-NYGB-Quarterly-Report-March.pdf. 62 Case 14-M-0094, submitted by NYSERDA on June 25, 2016.

37
NYGB_2017_Business_Plan_PSC_Filing_FINAL.docx
portfolio from both the financial market transformation and impact evaluation perspectives. The primary goals of evaluation are to:
(a) Assess and verify estimated and actual energy and environmental impacts; (b) Assess the overall progress of NYGB towards meeting its market transformation goals, including
addressing market barriers and financing gaps, increasing investor confidence and achieving scale in clean energy financing; and
(c) Provide important information and feedback to help NYGB further target and refine its product offerings to
maximize the uptake, deployment and effectiveness of its ongoing activities. Baseline evaluation activities are expected to be implemented in the 2017 – 18 Plan Year, and will include all transactions executed up to March 31, 2017.
Attracting & Retaining Required Staff
Securing and maintaining adequate staffing is a fundamental prerequisite to NYGB’s ability to fully and successfully execute on this Plan in 2017 – 18. As with other comparable investment organizations in both the public and private sectors, NYGB requires appropriate staffing levels to achieve its mission and goals by supporting all aspects of ongoing growth in the business. NYGB anticipates needing to fill positions in the near-term to deliver its anticipated 2017 – 18 growth. Attracting certain additional staff and developing and retaining staff in general are critical areas of focus for 2017 – 18. Recruiting efforts emphasize individuals who bring rich experience in their fields from having worked in other private, public and/or not-for-profit institutions focused on energy and/or financing. Each member of the NYGB team is highly motivated and dedicated to serving the public by advancing the REV strategy. Recruiting candidates away from other opportunities including in the private sector, and retaining staff, requires that NYGB maintain a stimulating environment where employees believe they can have impact and gain critical investment, portfolio management and clean energy commercial experience, while working in an environment and organization that operates in a manner broadly consistent with private sector norms.

38
NYGB_2017_Business_Plan_PSC_Filing_FINAL.docx
Glossary & Definitions
“2014 Plan” has the meaning given that term in Section 1.2. “2015 Plan” has the meaning given that term in Section 1.2. “2016 – 17 Plan Year” has the meaning given that term in Section 2.1. “2016 Plan” has the meaning given that term in Section 1.2. “2017 – 18 Plan Year” has the meaning given to that term in footnote 20. A “Active Pipeline” has the meaning given to that term in footnote 14. “Actuals” has the meaning given to that term in footnote 23. “Annual Financial Metrics Report” means each Metrics report required to be filed by NYGB with the Commission in respect of each fiscal year. “Audited Financials” means annual audited financial statements prepared in accordance with applicable accounting standards by a reputable, experienced and independent accounting firm, in consultation with NYGB and NYSERDA staff.
B “BofA Merrill” has the meaning given that term in Schedule 1. “BQ” has the meaning given that term in Schedule 1.
C “C&I” has the meaning given that term in Section 2.5. “CDFI” has the meaning given that term in Section 2.11. “CDG” has the meaning given that term in Section 2.5. “CDG Program” has the meaning given to that term in Section 3.2.1. “CEF” has the meaning given that term in Section 1.2. “CEF Information Supplement” has the meaning given to that term in Section 2.4. “CEF Order” has the meaning given that term in Section 1.2. “CES” has the meaning given to that term in Section 1.2. “CHP” has the meaning given that term in Section 2.5. “Commission” has the meaning given to that term in Section 1.2.

39
NYGB_2017_Business_Plan_PSC_Filing_FINAL.docx
“Commission Orders” means the Initial Capitalization Order and the “Order Approving Additional Capitalization with Modification for New York Green Bank” issued and effective July 17, 2015. Following this filing, NYGB received a further capital installment of $150.0 million. “Committed Funds” means, in any period, the aggregate funds to be provided by NYGB pursuant to executed investment and financing agreements which remain in force during that period, without such funds having been Deployed, expressed in dollars. “Committed” has a corresponding meaning. “CRM” has the meaning given that term in Section 2.2.
D “DASNY” has the meaning given that term in Schedule 1. “DealCloud” has the meaning given that term in Section 2.2. “Deployed Funds” means, in any period, the aggregate funds that have been advanced by NYGB pursuant to the terms of executed investment and financing agreements which remain in force during that period, expressed in dollars. “Deployed” has a corresponding meaning. “District” has the meaning given that term in Schedule 1. “DPS” has the meaning given that term in Section 2.15. “DSUN” has the meaning given that term in Schedule 1.
E “ESG” has the meaning given that term in Section 2.11. “Expense” means, in any period, the aggregate of: (a) all direct costs incurred by NYGB in day-to-day operations, including all business development, transaction, and general and administrative expenses, expressed in dollars; and (b) all costs allocated quarterly to NYGB by NYSERDA, generally based on the proportion which NYGB’s direct salary costs bear to the total salary costs of all NYSERDA program staff, expressed in dollars.
F “First-Year” has the meaning given to that term in Section 1.7.
G “GHG” has the meaning given to that term in Section 1.2. “Greenlight Committee” means the committee of that name in NYGB’s investment process.
H “HHAR” has the meaning given that term in Schedule 1. “HHAR Project” has the meaning given that term in Schedule 1. “HVAC” has the meaning given that term in Section 2.5.

40
NYGB_2017_Business_Plan_PSC_Filing_FINAL.docx
I “Impact Benefit Objectives” has the meaning given to that term in Section 1.7. “Impact Benefits” has the meaning given to that term in Section 1.7. Inception” has the meaning given to that term in footnote 5. “Initial Capitalization Order” has the meaning given to that term in footnote 5. “Investment Portfolio” means, at any time, collectively, the investment transactions that NYGB has executed with its counterparties that have not yet matured or otherwise expired in accordance with their respective terms. “Investment RFPs” has the meaning given to that term in Section 1.5.4. “IRC” has the meaning given to that term in footnote 14.
K “KPIs” has the meaning given to that term in Section 1.6.
L “LED” has the meaning given to that term in Section 2.5. “Lifetime” has the meaning given to that term in Section 1.7. “LMI” has the meaning given to that term in Section 2.11.
M “Metrics Plan” has the meaning given to that term in Section 1.6. “MMBtu” means millions of British Thermal Units. “Mobilization Ratio” represents the number of dollars of Total Project Costs (Cumulative) mobilized for each dollar committed to investments by NYGB and comprises the ratio of the quotient of Total Project Costs (Cumulative) divided by Overall Investments to Date, to one. “Mosaic” has the meaning given that term in Schedule 1. “MUSH” has the meaning given to that term in Section 2.5. “MW” means megawatts. “MWh” means megawatt hours.
N “NEM” has the meaning given to that term in Section 3.2.6.

41
NYGB_2017_Business_Plan_PSC_Filing_FINAL.docx
“Net Income” means, in any period, the excess of Revenues over Expenses. “Network” has the meaning given to that term in Section 2.17.1. “Northport Project” has the meaning given that term in Schedule 1. “NYGB” has the meaning given to that term in Section 1.0. “NYGB Credit Facility” has the meaning given to that term in Section 2.4. “NYCHA Project” has the meaning given that term in Schedule 1. “NYS” has the meaning given to that term in Section 1.0. “NYSERDA” has the meaning given to that term in Section 1.1.
O “Odyssey” has the meaning given that term in Schedule 1. “Overall Investments to Date” means, at any time, the aggregate of all Committed Funds since Inception (but excluding approved investments that have not been executed at the relevant time), expressed in dollars.
P “PHAs” has the meaning given that term in Section 3.2. “Plan Deliverables” has the meaning given to that term in Section 3.1. “Plug” has the meaning given that term in Schedule 1. “PPA” means Power Purchase Agreement. “Projects” has the meaning given to that term in Section 1.7. “Proposers” has the meaning given to that term in Section 2.9. “PV” has the meaning given to that term in Section 2.8.
Q “Quarterly Metrics Reports” means each Metrics report required to be filed by NYGB with the Commission in respect of each calendar quarter as set out in Section 2.1 of the Metrics Plan and addressing the matters identified in Section 2.2 of the Metrics Plan as applicable.
R “RCF” has the meaning given that term in Schedule 1. “REV” has the meaning given to that term in Section 1.2. “Revenue” means, in any period, NYGB revenue from all sources, including without limitation all fees, interest, penalties, dividends and other receivables related to Committed Funds and Deployed Funds (inclusive of such

42
NYGB_2017_Business_Plan_PSC_Filing_FINAL.docx
amounts as may be capitalized, accrued or paid-in-kind) due to NYGB during that period as remuneration for providing financial facilities in transactions and includes interest received on cash held by NYGB,63 all expressed in dollars. “Review and Plan” has the meaning given to that term in Section 1.0. “RFI” has the meaning given to that term in Section 2.1. “RFP” means request for proposal. “RFP 1” has the meaning given to that term in footnote 37. “RFP 4” has the meaning given to that term in Section 2.13. “RFP 5” has the meaning given to that term in Section 2.14. “RFP 7” has the meaning given to that term in Section 2.8. “RFP 8” has the meaning given to that term in Section 2.8. “RGGI” has the meaning given to that term in Section 1.7.2.
S “Scoring Committee” means the committee of that name in NYGB’s investment process. “SEP” has the meaning given to that term in Section 1.2. “SPFC” has the meaning given to that term in Schedule 1. “Spruce” has the meaning given that term in Schedule 1. “SRI” has the meaning given to that term in Section 2.11. “SS&C” has the meaning given to that term in Section 2.2. “State” has the meaning given to that term in Section 1.0.
T “TELP” has the meaning given that term in Schedule 1. “TLF” has the meaning given that term in Schedule 1. “Total Project Costs (Cumulative)” means, in any period, the aggregate of all amounts required to deploy clean energy project(s) comprising each (past and present) NYGB investment for the corresponding term of that investment. “Total Project Costs (Cumulative)” captures all capital for the relevant investment irrespective of source (including, without limitation, sponsor equity, tax equity, other equity interests, all categories and types of debt or hybrid interests and incentives), including any assumed rollover of revolving facilities. “Total Project Costs (Cumulative)” is measured since Inception and expressed in dollars. “Transaction Profile” has the meaning given to that term in Section 1.7.2.
63 It is NYGB’s practice to invest cash balances in low risk instruments.

43
NYGB_2017_Business_Plan_PSC_Filing_FINAL.docx
“True-Up” has the meaning given to that term in Figure 4.
U “Useful Life” means the number of years in which an asset or project (e.g., PV modules, wind turbine generators, efficiency measures etc.) can reliably produce benefits.
V “VDER” has the meaning given to that term in Section 2.11. “VDER Order” has the meaning given to that term in Section 3.2.6.

44
NYGB_2017_Business_Plan_PSC_Filing_FINAL.docx
SCHEDULE 1
2016 – 17 Investments Each of the transactions that NYGB closed in the 2016 – 17 Plan Year is described below. All descriptions are derived from information included in Transaction Profiles. BQ Energy (Pattersun) – Driving Standardization in the New York Solar Market Reduces up to 23,400 metric tons of GHG emissions over the life of the underlying project (for the first of
eight projects) Generates up to 44,400 MWh of renewable energy over the life of the underlying project (for the first of eight
projects) Increases renewable energy installed generation capacity by up to 1.37 MW (for the first of eight projects) NYGB made an initial commitment of $1.5 million to BQ Energy (“BQ”) to finance the installation of ground-mounted solar located at a landfill in Patterson, New York. NYGB’s commitment is the first in a series of anticipated commitments that will fund construction of a portfolio of up to eight distinct solar installations at a total project cost of up to $30.0 million. BQ is a Poughkeepsie-based renewable energy project developer that specializes in solar development on landfills, which are often unsuitable for other types of development. NYGB and BQ have established a standardized approach to construction and post-construction finance that will broaden the availability of solar energy to commercial and industrial businesses seeking to purchase solar energy via long term contracts that have had limited access to financing due to lack of scale and/or a lack of public credit ratings. This transaction and the methodologies employed are broadly applicable across the fragmented commercial and industrial solar market. Guggenheim, DZ Bank & Solar Mosaic – Scaling Residential Solar & A New Asset Class to Advance New York’s Clean Energy Goals Reduces up to 925,000 metric tons of GHG emissions over the life of the underlying projects64 Generates up to 1,760,000 MWh of renewable energy over the life of the underlying projects Increases renewable energy installed generation capacity by up to 60.0 MW Solar Mosaic (“Mosaic”) is a financial technology company that, utilizing a third-party contractor network, provides homeowners with loans to finance the installation of solar systems on their homes. At the request of Guggenheim Partners, a global investment and advisory financial services firm, and in partnership with Germany’s DZ Bank, NYGB participated in a $110.0 million senior secured credit facility in April 2016. Since the close of the original credit facility, Mosaic’s loan originations are occurring at a faster pace than previously anticipated and, simultaneously, Mosaic and its network of developers are increasingly focused on NYS. Following the success of Mosaic’s loan product and the strong performance of the loans within the credit facility, Mosaic sought greater credit availability to satisfy increased demand. Mosaic requested NYGB and private capital providers to participate in a second transaction involving a $130.0 million increase of the original facility, bringing the total size to $240.0 million, with an additional $40.0 million from NYGB and $90.0 million from BNP Paribas, a global bank and financial services company. NYGB’s entire $50.0 million contribution to the larger credit facility is intended to drive deployment of projects in NYS. Additionally, NYGB’s participation: (i) will provide increased financing scale and diversity that will result in larger term securitizations that should assist creation of greater market liquidity and drive down financing costs; (ii) increase deployment by Mosaic in NYS benefiting homeowners and the contractors serving them; and (iii) motivate new participants in the market given NYGB’s financial expertise in clean energy financings. With the capital available under the larger credit facility, Mosaic will provide homeowners with loans projected to
64 NYGB’s practice in calculating and reporting energy and environmental benefits expected from syndicate transactions is to report only those
benefits referable to developments within New York State.

45
NYGB_2017_Business_Plan_PSC_Filing_FINAL.docx
result in over 40,000 residential solar installations nationwide, building up an extensive portfolio of projects and resulting in considerable emissions reductions. NYGB participation in the larger credit facility is projected by Solar Mosaic to fund the financing of up to 9,000 new residential solar systems in NYS, contributing up to an additional 60.0 MW of clean power in New York. The transaction will also result in the aggregation of a bundled pool of loans used to finance rooftop systems that will then be refinanced on a long-term basis in the institutional securitization markets. To access the most efficiently priced sources of institutional capital requires substantial scale. Achieving portfolio scale requires large credit facilities such as this, providing aggregation capital. Given that the bank market for such credit facilities remains limited, NYGB’s participation enables larger aggregation facilities than would otherwise be available, resulting in securitized market refinancings at a scale greater than might otherwise be achieved. Greater scale means greater investor interest, which will ultimately result in more attractive debt pricing that will benefit New Yorkers via more attractively priced loan options for homeowners seeking to purchase and finance rooftop solar energy generation systems. Sealed – Providing Energy-Saving Home Improvements for New York State Residents Reduces up to 34,200 metric tons of GHG emissions over the life of the underlying projects Saves up to 4,360 MWh from efficiency measures (electric) Saves up to 479,000 MMBtu from efficiency measures (fuel) NYGB provided a $5.0 million credit facility to Sealed Inc. that will support financing for up to $7.5 million in energy efficiency upgrades for up to 400 homeowners in New York. Sealed, a New York City-based energy software and service company that provides home efficiency upgrades, offers a savings-based financing solution in funding residential upgrades such as new insulation, sealing air leaks, and new boilers and furnaces. The Sealed financing product gives an alternative to homeowners that prefer a savings-based approach rather than a conventional loan approach. NYGB’s credit facility will help establish a track record for Sealed’s financing approach and provide an opportunity to Sealed, and potential future investors, to determine the scalability of the market. Upon creation of an initial portfolio, private capital providers are expected to engage more readily in future financing discussions. The credit facility provided by NYGB is replicable for other participants in the clean energy market in New York State, specifically smaller developers with early marketplace success but limited scale to date. Sunrun – Increasing Opportunities for NY Residents to Go Solar, Expanding Market Liquidity Reduces up to 604,000 metric tons of GHG emissions over the life of the underlying projects Generates 1,150,000 MWh of renewable energy over the life of the underlying projects Increases renewable energy installed generation capacity by up to 39.0 MW NYGB committed $25.0 million as part of a $245.0 million construction loan facility65 that will be used to fund construction costs for residential rooftop systems. In addition, NYGB committed $25.0 million as a portion of a separate $340.0 million consortium which will scale up Sunrun’s nationwide deployment. Together these commitments will allow Sunrun to expand operations in NYS by installing PV systems at more than 5,000 homes in the State. Sunrun, the largest dedicated solar company in the United States, provides affordable clean energy for little to no upfront cost to homeowners by designing, installing, financing, insuring, monitoring and maintaining solar panels on their roofs in exchange for a predictable price specified in a long-term (i.e., 20 years or more) contract. The combination of these two transactions will result in the aggregation of bundled pools of solar systems that will then be refinanced on a long-term basis in the institutional securitization markets. To access the most efficiently priced sources of institutional capital requires substantial scale. Achieving portfolio scale requires large credit facilities such as this providing aggregation capital. Given that the bank market for such credit facilities remains
65 As of July 2016, this overall facility amount increased to $250.0 million, reflecting the increased commitment of another lender of the credit
facilities to Sunrun.

46
NYGB_2017_Business_Plan_PSC_Filing_FINAL.docx
limited, NYGB’s participation enables larger aggregation facilities than would otherwise be available, resulting in securitized market refinancings at a scale greater than might otherwise be achieved. Greater scale means greater investor interest, which will ultimately result in more attractive debt pricing that will benefit New Yorkers via more attractively priced contracts under which power is purchased. Bank of America Merrill Lynch & Northport-East Northport Union Free School District – Extending Loan Tenors for Deeper Energy Retrofits and Greater Savings Reduces up to 50,600 metric tons of GHG emissions over the ~24-year life of the underlying efficiency
measures Reduces electricity use by up to 49,700 MWh over the life of the underlying measures Achieves energy savings from fuel of up to 461,000 MMBtu over the life of the underlying measures On October 21, 2016, NYGB and a subsidiary of Signature Bank (“SPFC”) co-invested in a ~$13.0 million lease – including approximately $8.9 million from NYGB and approximately $4.2 million from SPFC – to finance energy improvements (the “Northport Project”) that will replace existing infrastructure in nine schools and an administrative building in the school district (the “District”).66 The Northport Project includes lighting retrofits, building envelope improvements, energy management systems, water conservation units, and ventilator refurbishments. The Northport Project is expected to save the District ~$1.1 million per year, with a portion of those savings used for lease payments and the remainder going directly to the District. Bank of America Merrill Lynch (“BofA Merrill”) arranged and structured the lease in what constitutes the first transaction under NYGB’s and BofA Merrill’s broader co-financing arrangement, whereby NYGB will support certain transaction types such as deeper energy efficiency retrofits requiring longer term leases. NYGB’s participation in this transaction and future leases with BofA Merrill and other arrangers enables the aggregation of portfolios that private capital providers can participate in at scale. NYGB’s role as an aggregator enables larger institutions to participate in small to mid-sized transactions that would otherwise not meet scale thresholds. Over the long term, the goal of the strategy is to bring greater private sector capital into the clean energy marketplace and ultimately increase liquidity and drive additional volume in the energy efficiency and renewable energy sectors, leading to broader and faster completion of similar transactions in New York. SolarCity & Bank of America Merrill Lynch – Providing New Yorkers with Greater Access to Solar Opportunities Reduces up to 920,000 metric tons of GHG emissions over the 25-year life of the underlying projects Generates up to 1,750,000 MWh of renewable energy over the life of the underlying projects Increases renewable energy installed generation capacity by up to 59.0 MW, while refinancing an existing
portfolio of up to 13.0 MW in NYS (~ 1,800 residential homes) In the 2016 – 17 Plan Year, NYGB closed two separate investments with SolarCity. On December 30, 2016, NYGB committed $20.0 million to SolarCity’s existing Revolving Credit Facility (the “RCF”). The RCF is used by SolarCity to build new solar projects, of which a significant portion are to be located in NYS. NYGB’s participation accelerates SolarCity’s ability to develop NYS projects and broadens the availability of construction financing for distributed energy projects across the State. SolarCity engaged BofA Merrill as Mandated Lead Arranger and Sole Bookrunner for a senior secured Term Loan Facility (the “TLF”) to finance a static pool of solar assets. The TLF originally closed in January 2016 with three lenders. Separately, on December 9, 2016, NYGB committed $30.0 million to upsize the TLF, as the facility was expanded to add new solar assets. NYGB’s participation in the TLF provides SolarCity additional financial flexibility, and helps to strengthen the medium-term lending market as an alternative to refinancing through the traditional asset-backed security market or private placement market. This transaction demonstrates NYGB’s continued success in enhancing liquidity, decreasing the cost of capital for solar developers and installers, and helping reduce the cost of solar power to customers.
66 The press release, entitled “NY Green Bank Announces Financing Deal to Reduce Annual Energy Costs by $1 Million for Long Island’s
Northport School District” is available on NYGB’s website at www.greenbank.ny.gov/News/In-The-News.

47
NYGB_2017_Business_Plan_PSC_Filing_FINAL.docx
SolarCity sought NYGB’s participation in the RCF and the TLF to provide additional capital to support SolarCity’s solar development efforts and lower its cost of financing for solar energy systems, including in NYS. The two transactions are both successful replications of NYGB’s participation in similar loan structures, consistent with a key NYGB goal to scale up market volume and improve private sector participation and confidence in clean energy investments. New York City Housing Authority – Financing for Building Retrofits in Low-to-Moderate Income Housing Developments Reduces up to 79,200 metric tons of GHG emissions over the 12-year life of the underlying efficiency
measures Reduces electricity use by up to 150,000 MWh over the life of the underlying measures On December 23, 2016, NYGB made a bridge loan commitment of $11.0 million to undertake energy improvements, primarily through the replacement of conventional lighting equipment with cleaner, more efficient LED lighting in 18 master-metered multifamily developments in New York City (the “NYCHA Project”). The NYCHA Project includes 30 different LED technologies, and is expected to generate savings of 10.0% – 15.0% of current annual energy expenses for the building owner. The NYGB financing is expected to be refinanced by July 31, 2017. NYGB financing will create a borrowing history for a relatively new structure that can be replicated with NYCHA and other NYS PHAs seeking to utilize private capital financing for similar types of building upgrades. Further, NYGB’s participation in this transaction and potential future short-term loans with PHAs demonstrates to private capital sources (such as commercial banks) that there is demand for such a loan product and provides borrowing history for NYCHA and similar PHAs which seek to replicate the transaction structure. Transactions of this nature can help drive growth in the market for financing of LMI building energy efficiency by demonstrating a structure through which PHAs can successfully and scalably finance improvements benefiting LMI tenants in PHA-owned buildings. Plug Power – Enabling Growth & Expanding Financing for Hydrogen Fuel Cell Projects Reduces up to 53,200 metric tons of GHG emissions over the 10-year life of the underlying projects Generates up to 89,200 MWh of renewable energy over the life of the underlying projects Increases renewable energy installed generation capacity by up to 2.86 MW over the life of the underlying
projects On December 23, 2016, NYGB provided a $25.0 million term loan facility to Plug Power (“Plug”) to finance the deployment of fuel cell systems powering forklifts in distribution centers across NYS.67 The facility allows Plug immediate access to needed capital that is currently held as cash collateral in restricted accounts, rather than waiting for it to be released over time as payments are made through sale-leaseback arrangements with tax equity providers. NYGB’s participation in this transaction is significant because it enables Plug to deploy more systems and convert more forklift fleets in a shorter amount of time than would otherwise be possible under their current financial arrangement. In particular, this transaction will enable Plug to expand deployments, adding up to 1,300 GenDrive units with commercial customers, replacing current infrastructure with cleaner, more efficient alternatives, while growing its NYS labor force by nearly 100 new employees. Plug is a designer and manufacturer of fuel cell systems and fueling infrastructure that specializes in deploying its fuel cell propulsion systems across entire fleets of forklifts and transportation vehicles within distribution centers throughout the U.S. Plug deploys these systems and then provides a suite of services to operate them – such as procuring the hydrogen fuel the systems run on, and providing ongoing operations and maintenance to keep the systems running at a guaranteed uptime level – all as a single turnkey offering provided to the owner of the
67 The press release, entitled “NY Green Bank Announces Its First Transaction to Expand Fuel Cell Use at Businesses Across New York
State, Creating Up to 100 Jobs” is available on NYGB’s website at www.greenbank.ny.gov/News/In-The-News.

48
NYGB_2017_Business_Plan_PSC_Filing_FINAL.docx
manufacturing site or distribution center. Many of Plug’s current customers are major corporations in the automotive manufacturing, retail distribution and consumer goods industry. This transaction constitutes NYGB’s first investment in the fuel cell industry, which is still relatively small nationally but growing at an above-market average rate. As a result, many firms in the industry experience high borrowing costs. NYGB participation in the transaction aims to address those high costs for Plug and other similar companies in the sector by making otherwise restricted capital available to Plug, so they can continue scaling their business, including to the levels where capital costs are expected to be significantly reduced. Bank of America Merrill Lynch & Hebrew Home for the Aged at Riverdale – Enabling Deeper Energy Retrofits & Expanding Financing Opportunities for Small & Mid-Size Efficiency Projects Reduces up to 1,880 metric tons of GHG emissions over the 20-year life of the underlying efficiency
measures Reduces electricity use by up to 8,640 MWh over the life of the underlying measures Increases CHP installed capacity by 1.6 MW On December 29, 2016, NYGB and BofA Merrill entered into a co-financing of the installation of a CHP system at the Hebrew Home for the Aged at Riverdale (“HHAR”), in New York City as part of a larger arrangement and aggregation strategy. This transaction will save HHAR an estimated $1.6 million annually by replacing current infrastructure with cleaner, more efficient alternatives. NYGB and BofA Merrill are co-investing in an approximately $14.0 million tax-exempt equipment lease issued under the Dormitory Authority of the State of New York’s (“DASNY”) tax-exempt leasing program (“TELP”). The lease will finance energy improvements (the “HHAR Project”), that will replace existing infrastructure at the Riverdale facility with cleaner, more efficient equipment, generating substantial savings for HHAR immediately and throughout the lifetime of the equipment. The lease enables tax-exempt financing for the HHAR Project and reduces borrowing costs to HHAR. NYGB’s participation in this transaction is significant because it extends the tenor of the lease beyond the number of years BofA Merrill would normally finance, enabling deeper energy retrofits and less expenditures for HHAR – resulting in savings of approximately $1.6 million per year. A portion of those savings will be used for lease payments and the remainder will go directly to HHAR. This constitutes the second transaction under NYGB’s and BofA Merrill’s broader co-financing arrangement, whereby NYGB supports transaction types such as deeper energy efficiency retrofits requiring longer term leases. This transaction will drive growth in the small to mid-sized energy efficiency leasing market by providing longer-term financing that enables immediate and ongoing savings for commercial and/or non-profit entities. Longer term financing broadens the scope of energy improvement projects that entities can undertake, ultimately leading to the deployment of deeper retrofits in commercial and non-profit buildings throughout New York. Odyssey Solar (Distributed Sun & Building Energy Holding US) – Long-Term Financing for Solar Projects Supplying Clean Energy to Cornell University Reduces up to 132,000 metric tons of GHG emissions over the 25-year life of the underlying solar projects Generates up to 251,000 MWh of renewable energy over the life of the underlying projects Increases renewable energy installed generation capacity in the State by up to 7.76 MW On February 23, 2017, NYGB entered into a 15-year, $10.5 million financing with Distributed Sun, LLC (“DSUN”), a national energy services provider, and Building Energy, a multinational company in the renewable energy industry, for four solar projects (“Odyssey”) located in and around Ithaca. These projects have a total installed capacity of 7.76 MW and provide Cornell University clean energy under separate 20-year PPAs. Odyssey is part of NYGB’s objective to bring scale and standardization to the MUSH and C&I solar sectors. This transaction aims to drive growth in the small to mid-sized solar sector by encouraging the standardization of contractors, contracts, and equipment thereby increasing underwriting efficiency and reducing overall transaction costs. Developing standardized projects within a portfolio makes the overall financing opportunity more attractive to a larger potential investor group, ultimately providing more funding options and influencing financing costs.

49
NYGB_2017_Business_Plan_PSC_Filing_FINAL.docx
Further, a standardized approach to project development enables developers to establish a track record within their portfolio as well as create scale to appeal more broadly to traditional private capital providers. This in turn will create additional familiarity with the asset class and greater scale, resulting in increasing refinancing options and liquidity. In providing long-term financing to four projects, this transaction signals to the market that such long-term financing is possible, in turn enhancing the confidence of power purchasers in entering long-term PPAs for clean energy. Distributed Sun – SUNEIGHT – Bridge Loan to Support the Deployment of Community Solar Projects Reduces up to 323,000 metric tons of GHG emissions over the life of the underlying projects Generates up to 613,000 MWh of renewable energy over the life of the underlying projects Increases renewable energy installed generation capacity in the State by up to 22.5 MW NYGB closed two separate investments with DSUN and SUNEIGHT. In January 2017, NYGB provided a 12-month senior secured $1.0 million bridge loan facility to DSUN and its affiliate SUNEIGHT. Upon DSUN’s request, NYGB increased the bridge loan size by $2.0 million in March 2017 to a total of $3.0 million. Bridge loan proceeds are being used to finance project interconnection advance payments to New York State Electric & Gas Corporation for CDG solar projects. These interconnection advance payments68 are due under the Commission’s Standardized Interconnection Requirements and Application Process. This transaction is intended to encourage a more efficient use of sponsor equity and support project development efforts in NYS by bridging the period in which project sponsors need to finalize financing arrangements for projects for which the CESIR process has been completed. NYGB’s role is expected to create an easier pathway forward for developers that will enable greater deployment of community and other distributed generation assets throughout the State. Projects supported as a result of this transaction will generate project and customer performance data to draw new investors and financial institutions into the marketplace by demonstrating that competitive risk-return profiles can be achieved by Community DG-enabled business models. By supporting the deployment of Community DG solar projects, this transaction provides those who are not otherwise able to install solar energy generation systems on their property with increased access to clean, low-cost energy, regardless of where their home or business is located. This first-of-its-kind transaction is expected to serve as a template for capital providers to assess and replicate in the future, as there has been a strong demand for Community DG solar throughout NYS, and capital providers are expected to recognize the value in providing financing to enable the deployment of these projects. Spruce Finance & Investec Bank – Providing New Yorkers with Greater Access to Solar Opportunities Reduces up to 91,000 metric tons of GHG emissions over the 25-year life of the underlying projects Generates up to 173,000 MWh of renewable energy over the life of the underlying projects Increases renewable energy installed generation capacity by up to 5.87 MW (~760 systems across the State) On March 10, 2017, NYGB committed $6.0 million to participate in a five-year term loan for Spruce Finance (“Spruce”), a national provider of residential solar and energy efficiency financing. Among its product offerings, Spruce makes residential solar energy systems available to homeowners pursuant to 20 to 25-year PPAs and lease agreements. Spruce engaged Investec to structure, arrange, and syndicate a $99.4 million senior, secured term loan to refinance an existing aggregation credit facility. The credit facility will refinance 86.0 MW of generating capacity across 12,711 homes in 11 states. Over 6.2% of Spruce’s current portfolio is located in NYS and Spruce has placed an emphasis on growing its business in the State.
68 Under the revised NYS Standardized Interconnection Requirements, within 60 business days of receiving the Coordinated Electric System
Interconnection Review (“CESIR”) results, interconnection applicants must pay the applicable utility 25.0% of the interconnection upgrade estimates.

50
NYGB_2017_Business_Plan_PSC_Filing_FINAL.docx
By participating with other banks in the credit facility, NYGB capital will help to establish a new medium-term lending market, finance existing residential solar systems in NYS, and provide liquidity for Spruce to develop additional projects in the State. The up to 5.87 MW of new projects financed through this transaction represent approximately 760 NYS residential solar installations. In addition, NYGB’s investment helps to establish a medium-term lending market as an alternative to refinancing through securitization. NYGB’s participation in this transaction is expected to help demonstrate that competitive risk-return profiles can be achieved for scalable residential solar investments. As a result, the transaction is expected to draw new investors and financial institutions into the marketplace, enhancing liquidity. Such liquidity is expected to drive lower capital costs for developers, reducing the lease or PPA costs to NYS homeowners beyond those currently offered. BQ Energy (Esopus) – Driving Standardization in the New York Solar Market Reduces up to 14,800 metric tons of GHG emissions over the life of the underlying project Generates up to 28,100 MWh of renewable energy over the life of the underlying project Increases renewable energy installed generation capacity in the State by up to 0.87 MW BQ is a renewable energy project developer specializing in landfill and brownfield site redevelopment. As the second of a larger portfolio of projects to be financed in collaboration with NYGB, BQ has received a $1.1 million construction loan and term loan facility to complete a 0.87 MW solar project being constructed on a remediated landfill located in Esopus, Ulster County. Solar power from this project will be sold to the Town of Esopus and will generate a significant percentage of its total power needs. This transaction aims to drive growth in the small to mid-sized solar sector by encouraging the standardization of contractors, contracts, and equipment thereby increasing underwriting efficiency and reducing overall transaction costs. Developing standardized projects within a portfolio makes the overall financing opportunity more attractive to a larger potential investor group, ultimately providing more funding options and influencing financing costs. Institutional investors and other private sector capital providers have shown limited interest in financing small to mid-sized solar project developers which may have more limited operating histories. NYGB’s participation in this transaction will help this NYS-based developer further consolidate its track record and achieve the scale needed for broader appeal to traditional capital providers. In turn, this can be expected to enable more refinancing options which will provide the market with greater levels of familiarity with this asset class –a prerequisite to increasing liquidity. By bridging certain financing gaps in the marketplace, NYGB is enabling a larger group of solar developers to participate in New York’s clean energy marketplace. This gives end-users more choice in terms of how they pay for their systems and who they select as their provider/installer. Greater choice and competition in the market will promote reduced costs, ultimately facilitating a greater number of New Yorkers and New York businesses in going solar. Vivint Solar – Providing New Yorkers with Greater Access to Residential Solar Opportunities Reduces up to 978,000 metric tons of GHG emissions over the 25-year life of the underlying projects Generates up to 1,860,000 MWh of renewable energy over the life of the underlying projects Increases renewable energy installed generation capacity by up to 63.0 MW (at least 6,700 residential solar
systems across the State) On March 31, 2017, NYGB committed $20.0 million to participate in a $375.0 million revolving back leverage aggregation facility arranged by BofA Merrill for Vivint Solar, a national residential solar installer. This represents an expansion of NYGB’s support for Vivint Solar’s development efforts in NYS after NYGB provided $37.5 million in a term loan to Vivint Solar arranged by Investec in August 2016. As a participant with other banks in the aggregation facility, NYGB’s capital will help to provide incremental liquidity for Vivint Solar to develop additional projects in NYS. Up to 25.0 MW of new projects are expected to be financed as a result of the aggregation facility and represent approximately 2,100 residential solar systems in the State. When added to the systems supported by the existing term loan, the total impact to NYS is expected to be at least 52.0 MW and 6,700 residential systems. NYGB’s role as a specialty clean energy lender in both Vivint Solar transactions provides other financing parties with greater confidence, making it both a key component to drawing in other private sector financiers and critical

51
NYGB_2017_Business_Plan_PSC_Filing_FINAL.docx
in supporting both Investec’s and BofA Merrill’s respective syndication efforts. NYGB’s participation in the term loan helps to establish a medium-term lending market as an alternative to refinancing through the securitization market. NYGB’s participation in the aggregation facility provides incremental liquidity to a developer active in NYS to increase transaction size. Both Vivint Solar transactions are expected to draw new investors and financial institutions into the marketplace, resulting in enhanced liquidity. Enhanced liquidity will drive lower capital costs for developers, reducing the lease or PPA costs to NYS homeowners beyond those currently offered.

52
NYGB_2017_Business_Plan_PSC_Filing_FINAL.docx
SCHEDULE 2
Risk Management & Oversight Framework 1. Introduction Risk-taking is an intrinsic part of all investment businesses, including NYGB. At NYGB, risk management is not only important in minimizing and controlling loss, it also plays a role in strategic planning, portfolio construction, investment management processes and operations. Effective management of NYGB risk is a cornerstone of NYGB’s ability to be self-sustaining, to meet its mission of generating returns in excess of expenses and other uses of cash, and to be a responsible steward of the public funds with which it is entrusted. While realizing NYGB’s market-responsive mission requires it to retain flexibility in its decision-making, investments and operations, NYGB is acutely aware that such flexibility must be subject to rigorous processes and accountabilities. Risk management is the process for identifying, assessing and controlling both enterprise and portfolio risks to minimize unanticipated losses and uncompensated risks and optimize the reward/risk ratio. At NYGB, risk management principles are applied at the enterprise and Investment Portfolio levels and are both quantitative and qualitative in nature. This means that risk management is viewed not just as the duty of one individual or department but as the responsibility of all NYGB personnel as a fundamental part of organizational culture. This Schedule 2 outlines the key risks in NYGB’s business, risk management policies, mitigants and risk management oversight. 2. Risk Framework & Identification At NYGB, all risks arising in the business are classified as either investment risks or enterprise risks. Investment risks are those involved in investment selection and asset management; enterprise risks reflect the balance of largely operational risks related to NYGB’s business. Investment risks are further segmented into those related to investment selection and those related to portfolio management, reflecting that the nature of risks that arise in connection with the commitment and deployment of funds differs depending on whether NYGB is making a particular investment or managing its overall portfolio. Table 7 sets out the key business risks to be managed by NYGB.

53
NYGB_2017_Business_Plan_PSC_Filing_FINAL.docx
Table 7: Key Business Risks
Investment Risks Enterprise Risks
Investment Selection Capitalization Risk
Risk that NYGB does not receive the funds allocated to it on the expected schedule, which could negatively impact NYGB’s concentration risk and result in a portfolio that is overweight in individual investment types versus plan
Technology Risk
The risk that the technology employed in a potential investment will not function as and when intended, including to expected and necessary performance levels
Operating Risk
Operational risks related to potential investments, including construction, fuel/renewable resource, input prices, servicing, maintenance and billing/collections arrangements, management, performance of other debt, equity and project participants
Liquidity/ Balance Sheet Risk
Risk that counterparties are unable to refinance NYGB’s position when expected and/or NYGB is unable to sell-down assets (at times and/or on terms acceptable to NYGB), tying up capital and slowing the capital recycle rate
Legal & Capital Structure Risk
Risks of inadequate contractual terms and documentation to properly structure the relevant project and protect NYGB’s interests; risks inherent in proposed capital structure and contractual risk allocations between capital providers
Capital Deployment Risk
Risk that capital is not deployed at a sufficient rate to generate the revenues necessary for self-sufficiency, or the benefits expected to the clean energy sector in New York and to the leveraging of public funds
Counterparty & Credit Risk
Risk of default by a project and/or direct NYGB counterparty in a proposed investment
Execution Risk
Risk of not having the right skills, in the needed amounts available to execute on NYGB business as intended (applies to internal capabilities and external collaborations)
Refinancing Risk
Risk of market development and conditions such that investment either cannot be refinanced where applicable, except in part or at a loss to NYGB, or on terms which might reasonably result in default
Operational Risk
Risks affecting NYGB’s “license to operate” potentially arising in these areas: Legal Legislative and regulatory Environmental Intra-Agency integration (e.g., NYSERDA) Inter-Agency integration (e.g., DPS) State Comptroller/NYSERDA audit deficiency Inadequate systems, processes or controls
Market/Price Risk Risk that energy prices do not sustain the investment/project as modeled and proposed over its expected life
Political Risk
Risks relating to NYGB, as a State-sponsored specialty finance entity, being perceived as a target to provide special treatment to particular constituencies or suffering from changed political priorities with respect to clean energy within New York
Portfolio Management
Reputation Risk
Risks that can arise in every aspect of NYGB’s business and operations that an event occurs relating to a transaction, counterparty or business practice which detrimentally impacts NYGB and therefore the regard in which it is held in the marketplace and among all stakeholders. Diminished reputation can materially undercut NYGB’s ability to operate and achieve success
Non-Performance
Risk that during the course of an investment it begins to under-perform and/or becomes non-performing
Concentration Exposures
Risks posed by lack of sufficient diversification among portfolio investments, such that non-performance in a particular investment type has a substantial impact on overall portfolio performance
Investment Servicing & Administration
Risk of investment servicing and administration (including all related monitoring and reporting) lacking in scope, accuracy, or timeliness, impacting the ability to optimally manage NYGB investments and portfolio

54
NYGB_2017_Business_Plan_PSC_Filing_FINAL.docx
3. Risk Mitigation Principles Addressing the risks that arise across NYGB’s business occurs through the application of key risk management principles in combination with a system of specific risk mitigation measures. NYGB’s investment risks are identified, managed and monitored through application of the practices outlined in the balance of this Schedule 2 in the context of investment analysis and review, portfolio construction, ongoing portfolio monitoring and management, and organizational risk culture. NYGB’s risk management reflects the principles set out below. 3.1 Investment Analysis & Review
(a) Structured and comprehensive due diligence for all potential investments, addressing all identified
investment risk categories consistent with usual and customary commercial approaches; (b) Conducting “know your customer” background checks on potential counterparties, with a process in place
that can be tailored to address the spectrum of smaller private ventures through larger companies; (c) Creating the most appropriate investment structure, including financial terms (e.g., covenants, ratios,
leverage, reporting requirements, etc.) for the particular asset class; (d) Implementing a comprehensive set of contractual risk mitigants (e.g., representations, warranties and
covenants, indemnities, defaults, penalties, etc.); (e) Adhering to internal procedures for investment decision-making, including Scoring Committee, Greenlight
Committee and IRC reviews, input and respective approval processes; and (f) Leveraging internal and external expertise as required by a particular opportunity, including technical and
legal. 3.2 Portfolio Construction
(a) Apply prudent diversification principles to the extent possible taking into account NYGB’s market-responsive approach, including with respect to:
i. Each investment and how it fits within NYGB’s portfolio; ii. Particular clean energy sub-sectors (e.g., solar, wind, storage, efficiency, etc.); iii. Types of projects (e.g., by technology etc.); iv. Target segment representation (including end-use type – commercial and industrial, residential,
agricultural, etc.); v. Particular clients and counterparties; vi. Types of product offerings; and vii. Geographic distribution;
(b) Identify and monitor concentration risk and exposures (e.g., companies, technologies, asset classes,
products etc.), also taking into account NYGB’s market-responsive approach;
(c) In the context of NYGB’s demand-driven approach, evaluate and revise as needed minimum and maximum indicative single investment amounts;
(d) Use recognized commercial benchmarks for comparable asset classes to assess NYGB relative performance once the portfolio has reached sufficient size; and
(e) Manage returns from individual investments as well as across the entire portfolio, ensuring such returns generally exceed minimum hurdle rates.

55
NYGB_2017_Business_Plan_PSC_Filing_FINAL.docx
3.3 Ongoing Portfolio Monitoring & Management
(a) Regular and periodic evaluation of each investment against its investment case;
(b) Identify early signs of potential/actual under-performance and/or non-performance;
(c) Proactive management of recoveries and maximization of recovery in line with sound commercial principles; and
(d) Regular reporting to the IRC. 3.4 Organizational Risk Culture
(a) NYGB has adopted and strives to maintain an organizational culture in which understanding and managing risk is everyone’s responsibility. Risk mitigation and management is not just about policing and enforcing limits. NYGB personnel at all levels must be cognizant of risks and willing to do their part to make sure that those risks within their sphere of responsibility are managed in a manner consistent with NYGB’s policies and disclosures to clients, counterparties and broader stakeholders. Implementation and compliance with NYGB risk parameters, principles, policies and procedures forms part of personnel performance assessments;
(b) Ongoing NYGB emphasis on communications, transparency and consistent updates in connection with existing investments, investment opportunities, clients, counterparties and key stakeholders;
(c) Organizational checks and balances are being established and maintained, including appropriate segregation of front/mid-back office functions. Risk function is housed in an independent control group with a single point of responsibility (i.e., the Managing Director, Risk & Compliance) and having access to NYGB’s President and the IRC;
(d) NYGB organizational structure in which risk management roles and responsibilities are clearly defined, including written policies and other procedures identifying the specific people within the organization who are authorized to approve various actions, etc.;
(e) Senior management and the IRC are responsible to fully understand NYGB risks, define risk tolerances and set the risk management and ethical tone throughout the organization. This is critical to NYGB achieving its mission and protecting its reputation in the marketplace;
(f) NYGB acquires and maintains technology to support risk functions, including appropriate software platforms and other tools for portfolio management, performance analysis and monitoring;
(g) NYGB has implemented and seeks to maintain effective record keeping and management of all documents and records pursuant to commercial and appropriate protocols;
(h) NYGB works with information technology personnel at NYSERDA to ensure: i. Adequate backup and disaster recovery support; and ii. The existence of an effective system of security to protect the interests of NYGB employees, clients
and counterparties;
(i) Financial statements are prepared quarterly (unaudited) and annually (audited) in accordance with all applicable accounting standards;
(j) An experienced and credible accounting firm is retained to audit NYGB financial statements annually; and
(k) NYGB, as a division of NYSERDA, remains subject to NYSERDA internal controls, policies and procedures and internal audits, as applicable.
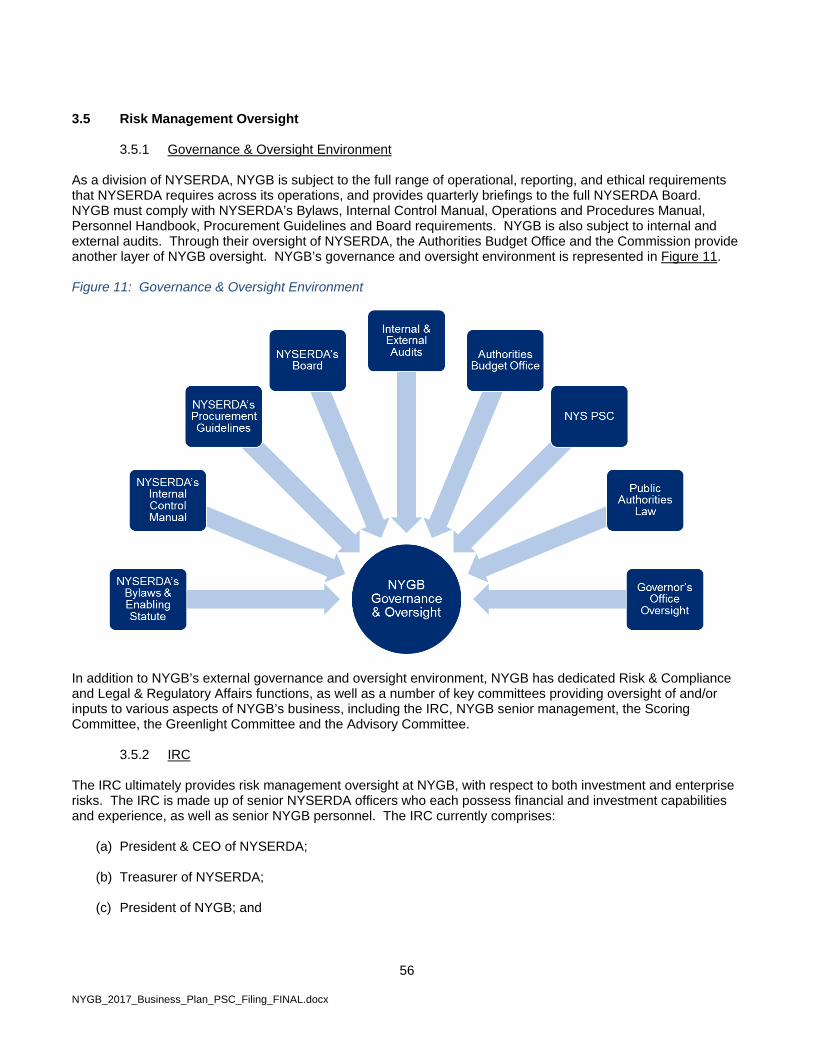
56
NYGB_2017_Business_Plan_PSC_Filing_FINAL.docx
3.5 Risk Management Oversight
3.5.1 Governance & Oversight Environment As a division of NYSERDA, NYGB is subject to the full range of operational, reporting, and ethical requirements that NYSERDA requires across its operations, and provides quarterly briefings to the full NYSERDA Board. NYGB must comply with NYSERDA’s Bylaws, Internal Control Manual, Operations and Procedures Manual, Personnel Handbook, Procurement Guidelines and Board requirements. NYGB is also subject to internal and external audits. Through their oversight of NYSERDA, the Authorities Budget Office and the Commission provide another layer of NYGB oversight. NYGB’s governance and oversight environment is represented in Figure 11. Figure 11: Governance & Oversight Environment
In addition to NYGB’s external governance and oversight environment, NYGB has dedicated Risk & Compliance and Legal & Regulatory Affairs functions, as well as a number of key committees providing oversight of and/or inputs to various aspects of NYGB’s business, including the IRC, NYGB senior management, the Scoring Committee, the Greenlight Committee and the Advisory Committee.
3.5.2 IRC The IRC ultimately provides risk management oversight at NYGB, with respect to both investment and enterprise risks. The IRC is made up of senior NYSERDA officers who each possess financial and investment capabilities and experience, as well as senior NYGB personnel. The IRC currently comprises:
(a) President & CEO of NYSERDA;
(b) Treasurer of NYSERDA;
(c) President of NYGB; and

57
NYGB_2017_Business_Plan_PSC_Filing_FINAL.docx
(d) NYGB Managing Directors.69 The IRC meets regularly to consider, review, and provide recommendations for consideration by NYSERDA’s President & CEO in connection with the following items as needed, taking into account NYGB’s mission, operations, asset allocation, exposures and all NYGB risk parameters and policies:
(a) NYGB strategy and business plans;
(b) Overall capital deployment plans and strategies;
(c) Risk management practices and framework;
(d) Financial and economic performance metrics and reporting;
(e) Key NYGB procedures;
(f) The Metrics Plan;
(g) Any other material documents required to be filed with the Commission or other State agency (including periodic reporting);
(h) Transaction Approval Memoranda;
(i) Quarterly investment reports;
(j) Proposed material waivers, amendments, restructurings and/or dispositions of existing NYGB investments; and
(k) Quarterly management reports. In addition to reviewing/overseeing all financing and investment agreements, the IRC meets regularly to review NYGB’s overall business, positions, portfolio construction and performance, including flagging any actual or potential issues with NYGB investment assets or portfolio. No commitment of NYGB capital is made without vetting by the IRC. The President & CEO of NYSERDA, upon consideration of the input of IRC members, is the final decision-maker with respect to matters before the IRC.
3.5.2 Senior Management Portfolio Review Senior management portfolio review is dedicated to ongoing risk assessment and comprises senior NYGB personnel who meet monthly to review the risk of each transaction within the Investment Portfolio and potential new transactions within the Pipeline. This process is designed to consistently review the entirety of NYGB risk exposure, and to filter transactions and distill issues for subsequent review by the IRC.
3.5.3 Scoring Committee The Scoring Committee reviews all proposals received in response to RFP 1, RFP 7 and RFP 8 or any other similar RFP that may exist from time to time. The Scoring Committee consists of NYGB employees, all designated by NYGB’s President. The purpose of the Scoring Committee is to review and evaluate all competitive proposals received by NYGB for completeness and against evaluation and selection criteria described in the relevant RFP. This process is designed to ensure efficiency and standardization in NYGB’s
69 Provided that no Managing Director who is responsible for the execution of a transaction being considered by the IRC will participate as a
member of the IRC with respect to that transaction. In addition, any actual or potential conflicts of interest that exist or may arise for any IRC member will be reviewed by legal counsel and such member may be recused from participation if, and to the extent, warranted.

58
NYGB_2017_Business_Plan_PSC_Filing_FINAL.docx
approach to evaluating, and responding to, investment opportunities.
3.5.4 Greenlight Committee The Greenlight Committee vets all potential investment opportunities before NYGB proceeds to full-scale diligence and negotiation of terms. All IRC members are eligible to participate in the Greenlight Committee, which is made up of at least three IRC members, including both NYSERDA and NYGB personnel (but excluding NYGB personnel directly involved in execution of the subject transaction). This committee reviews and makes recommendations (including the requirement of certain contingencies or conditions) to NYSERDA’s President & CEO with respect to a proposed transaction. All issues raised by the Greenlight Committee must be addressed before a potential transaction is submitted to the IRC for review. The “greenlighting” requirement adds another check and balance on potential investments in NYGB’s pipeline to ensure that individual transactions meet credit quality standards and all other applicable investment criteria, are consistent with NYGB’s mission and are appropriate from a risk perspective.
3.5.5 Advisory Committee The Advisory Committee is a group of senior professionals, prominent in their fields, which delivers guidance on an ongoing basis to the NYGB President and management team regarding matters pertinent to NYGB’s business. Advisory Committee members are appointed on the recommendation of NYGB’s President, with the approval of NYSERDA’s President & CEO. These members represent a range of backgrounds that may include energy and environmental issues (preferably focused on the clean energy sector), project development and finance, banking, capital/financial markets, portfolio management, new venture management/business development, utility and related infrastructure, engineering/technology and real estate. Advisory Committee member expertise includes deep knowledge of project financing structures; portfolio management, renewable energy investment, regulatory and operational expertise; and active investor experience in clean energy. The Advisory Committee meets at least twice a year. Details regarding its members, purpose, objectives and terms of engagement are available at www.greenbank.ny.gov/About/Advisory-Committee.

59
NYGB_2017_Business_Plan_PSC_Filing_FINAL.docx
SCHEDULE 3
Investment Process Since inception, NYGB actively and consistently works on a large volume of potential transactions within a clear investment framework. As the steward of significant public funds, NYGB has established and adheres to certain investment and business practices – consistent with prudent practice in comparable industries and institutions. These practices are reflected in all aspects of NYGB’s business including originating, reviewing, evaluating, diligencing, credit underwriting, risk and mitigant assessments, structuring, negotiating, documenting and closing transactions, as well as ongoing risk and compliance and portfolio management principles. NYGB employs various review committees in the origination, evaluation and response to investment opportunities. In addition to NYGB bringing to bear the experience of its staff and management, input and review are required at prescribed points in the investment cycle from internal committees that evaluate and “greenlight” proposals, as well as from the IRC. The principal steps involved in the advancement of any investment proposal received by NYGB are represented in Figure 12. Each transaction goes through a number of critical steps – each in turn involving detailed review, input and other work of the NYGB transaction team, its advisors, committees and clients and counterparties (including their respective advisors) in an iterative and ongoing process until milestones are reached, culminating in the execution of transaction documentation. Figure 12: Transaction Process