NVPerfKit User Guide - NVIDIA Developer 4.5.1 1 December 2015 Introduction NVIDIA PerfKit SDK allows...
24
U U s s e e r r G G u u i i d d e e NVIDIA PerfKit NVIDIA Performance Toolkit 4.5.1
Transcript of NVPerfKit User Guide - NVIDIA Developer 4.5.1 1 December 2015 Introduction NVIDIA PerfKit SDK allows...
UUsseerr GGuuiiddee
NNVVIIDDIIAA PPeerrffKKiitt
NNVVIIDDIIAA PPeerrffoorrmmaannccee TToooollkkiitt
44..55..11
NVPerfKit 4.5.1 ii December 2015
Table of Contents
Introduction ..................................................................................................... 1
System Requirements.................................................................................................................. 1
PerfKit Getting Started .................................................................................... 2
Installing PerfKit .......................................................................................................................... 2
Using NvPmApi ............................................................................................................................ 2
Initialize NvPmApi .................................................................................................................... 2
Create a Perf Context .............................................................................................................. 4
Collecting Counters ................................................................................................................. 4
Real-time Mode ....................................................................................................................... 4
Experiment Mode .................................................................................................................... 5
Simplified Experiments ............................................................................................................ 6
Appendix A. Frequently Asked Questions ........................................................ 7
Appendix B. Counters Reference ..................................................................... 8
List Counters ................................................................................................................................ 9
Direct3D Counters ....................................................................................................................... 9
OpenGL Counters ...................................................................................................................... 10
GPU Counter Definitions ........................................................................................................... 11
NvPmApiQuery .......................................................................................................................... 11
Context Queries ..................................................................................................................... 11
Chip Queries .......................................................................................................................... 12
Query Attributes .................................................................................................................... 13
Simplified Experiments (SimExp) ............................................................................................... 14
Appendix C. NvPmApi Specification ............................................................... 15
Enumerating Available Counters ............................................................................................... 15
Querying Counter Attributes ..................................................................................................... 16
Enable a Counter for Sampling .................................................................................................. 16
Disable a Counter ...................................................................................................................... 17
Running an Experiment ............................................................................................................. 17
PerfKit
NVPerfKit 4.5.1 iii December 2015
Defining an Experiment Pass ..................................................................................................... 18
Defining an Experiment Object ................................................................................................. 18
Collecting Counter Results in Experiment Mode ...................................................................... 19
Miscellaneous Functions ........................................................................................................... 20
NVPerfKit 4.5.1 1 December 2015
Introduction
NVIDIA PerfKit SDK allows graphics developers access to low-level NVIDIA GPU performance counters and NVIDIA driver counters. The SDK consists of the NvPmApi library and several tools.
NVIDIA PerfKit SDK
Supports Microsoft Windows and Tegra mobile and embedded operating systems.
On Windows PerfKit SDK supports
DirectX 9, DirectX 10, and DirectX 11
OpenGL 4.x core profile
On Tegra mobile and embedded operating systems PerfKit SDK supports
OpenGL 4.x core profile
OpenGL ES 2.x and 3.x
CPU usage and frequency
Provides access to raw GPU counters, aggregate GPU counters, and Simplified Experiments.
NVIDIA PerfKit SDK contains the following components:
NvPmApi library and include files
Sample code
NvPmApiQuery application for enumerating counters.
Tool or scripts for enabling driver instrumentation. This is platform dependent.
System Requirements
For Microsoft Windows
NVIDIA Display Driver
PerfKit signals are available on all NVIDIA GPUs listed below:
GeForce 7XX and 8xx and 9xx Series (Maxwell Family)
GeForce 6XX and 7XX Series (Kepler Family)
GeForce 4XX and 5XX Series (Fermi Family)
The full list of supported NVIDIA GPUs can be found at https://developer.nvidia.com/nsight-visual-studio-edition-supported-gpus-full-list.
For NVIDIA Tegra mobile and embedded operating systems
Supported Tegra device.
Supported Tegra image.
For mobile and embedded operating systems see the file PerfKit_<platform>.txt.
PerfKit counters may or may not be available on other NVIDIA GPUs.
PerfKit
NVPerfKit 4.5.1 2 December 2015
PerfKit Getting Started
Installing PerfKit
PerfKit SDK is delivered as a single zip file.
1. Follow the instructions below to install PerfKit SDK. PerfKit is distributed as a single zip file. Unzip the PerfKit, preserving the directory structure, to somewhere on your hard drive or other storage system.
2. Enable Driver Instrumentation.
On Microsoft Windows start the Driver Instrumentation Tray application (called NVInstEnabler.exe) which is contained in the root directory of the PerfKit SDK. Right-click the tray icon in your system tray and make sure that the Driver Instrumentation menu item is checked. Since this will add some CPU overhead to the Driver, only leave this enabled when you are using PerfKit.
On Tegra Mobile OS see the file PerfKit_<platform>.txt for information on how to enable driver instrumentation.
Using NvPmApi
NvPmApi, NVIDIA Performance Monitor API, is the primary library included in the PerfKit SDK. The library consists of a DLL/shared object, and header files.
NvPmApi implements two modes for collecting counters. In Real-time mode the developer inserts calls to enable counters and query the counters a specific times in the application. In Experiment mode the developer instruments a frame of work that can be replayed multiple times. Counters can be collected for each workload in the frame.
Both modes use the same steps to setup and initialize NvPmApi. The samples included in the Sample directories demonstrate the code listed below.
Initialize NvPmApi
NvPmApi library is provided as a DLL on Microsoft Windows and a shared object on Linux based operating systems.
The header file NvPmApi.Manager.h provides an OS abstraction for dynamically loading NvPmApi and providing access to the functions.
At the top of one of the applications C++ files add:
PerfKit
NVPerfKit 4.5.1 3 December 2015
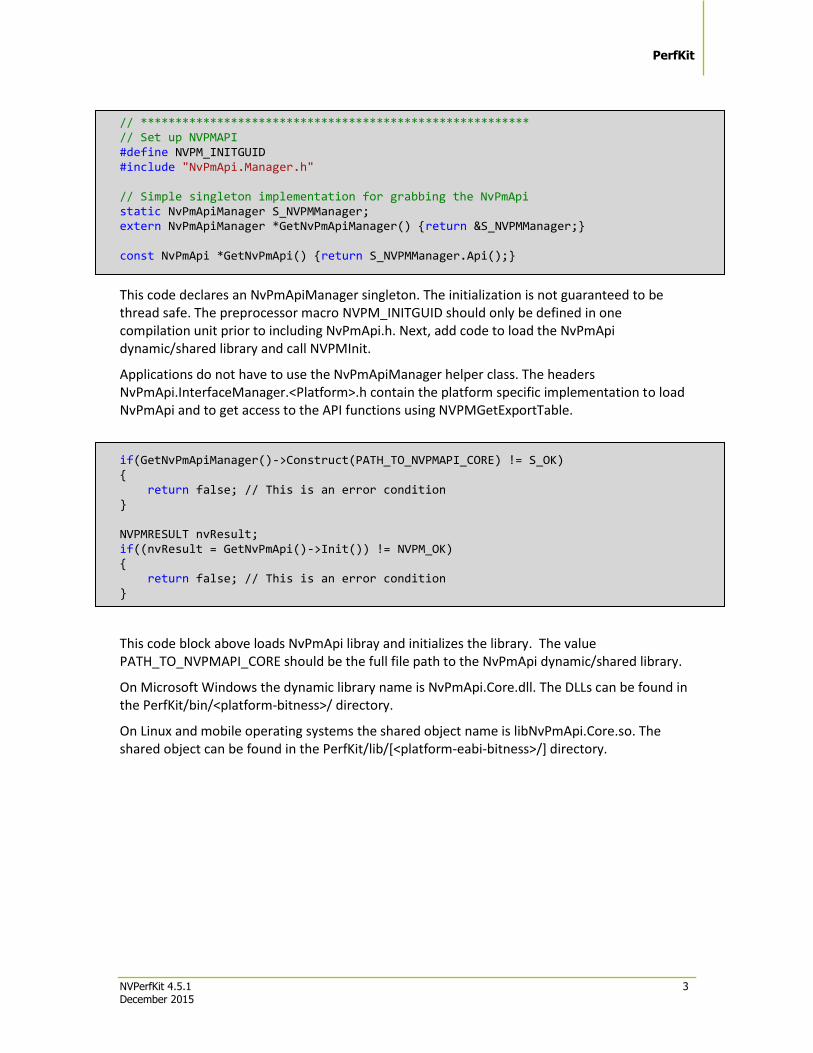
// ******************************************************** // Set up NVPMAPI #define NVPM_INITGUID #include "NvPmApi.Manager.h" // Simple singleton implementation for grabbing the NvPmApi static NvPmApiManager S_NVPMManager; extern NvPmApiManager *GetNvPmApiManager() {return &S_NVPMManager;} const NvPmApi *GetNvPmApi() {return S_NVPMManager.Api();}
This code declares an NvPmApiManager singleton. The initialization is not guaranteed to be thread safe. The preprocessor macro NVPM_INITGUID should only be defined in one compilation unit prior to including NvPmApi.h. Next, add code to load the NvPmApi dynamic/shared library and call NVPMInit.
Applications do not have to use the NvPmApiManager helper class. The headers NvPmApi.InterfaceManager.<Platform>.h contain the platform specific implementation to load NvPmApi and to get access to the API functions using NVPMGetExportTable.
if(GetNvPmApiManager()->Construct(PATH_TO_NVPMAPI_CORE) != S_OK) { return false; // This is an error condition } NVPMRESULT nvResult; if((nvResult = GetNvPmApi()->Init()) != NVPM_OK) { return false; // This is an error condition }
This code block above loads NvPmApi libray and initializes the library. The value PATH_TO_NVPMAPI_CORE should be the full file path to the NvPmApi dynamic/shared library.
On Microsoft Windows the dynamic library name is NvPmApi.Core.dll. The DLLs can be found in the PerfKit/bin/<platform-bitness>/ directory.
On Linux and mobile operating systems the shared object name is libNvPmApi.Core.so. The shared object can be found in the PerfKit/lib/[<platform-eabi-bitness>/] directory.
PerfKit
NVPerfKit 4.5.1 4 December 2015
Create a Perf Context
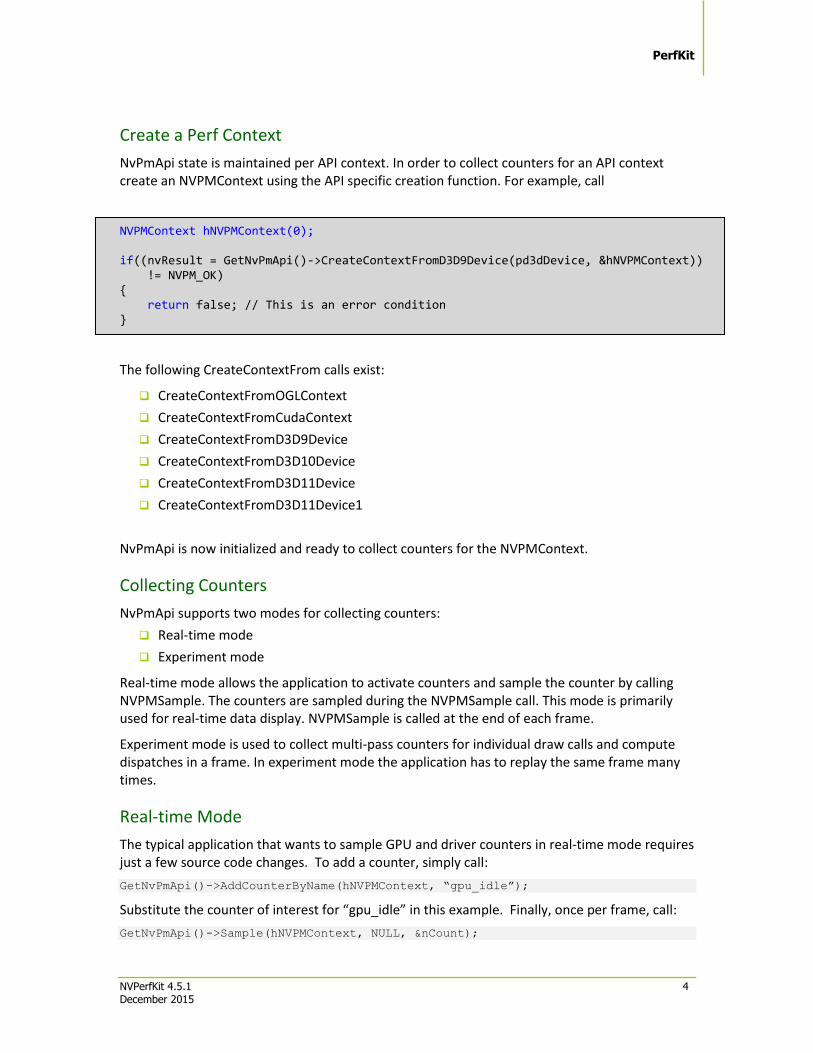
NvPmApi state is maintained per API context. In order to collect counters for an API context create an NVPMContext using the API specific creation function. For example, call
NVPMContext hNVPMContext(0); if((nvResult = GetNvPmApi()->CreateContextFromD3D9Device(pd3dDevice, &hNVPMContext)) != NVPM_OK) { return false; // This is an error condition }
The following CreateContextFrom calls exist:
CreateContextFromOGLContext
CreateContextFromCudaContext
CreateContextFromD3D9Device
CreateContextFromD3D10Device
CreateContextFromD3D11Device
CreateContextFromD3D11Device1
NvPmApi is now initialized and ready to collect counters for the NVPMContext.
Collecting Counters
NvPmApi supports two modes for collecting counters:
Real-time mode
Experiment mode
Real-time mode allows the application to activate counters and sample the counter by calling NVPMSample. The counters are sampled during the NVPMSample call. This mode is primarily used for real-time data display. NVPMSample is called at the end of each frame.
Experiment mode is used to collect multi-pass counters for individual draw calls and compute dispatches in a frame. In experiment mode the application has to replay the same frame many times.
Real-time Mode
The typical application that wants to sample GPU and driver counters in real-time mode requires just a few source code changes. To add a counter, simply call:
GetNvPmApi()->AddCounterByName(hNVPMContext, “gpu_idle”);
Substitute the counter of interest for “gpu_idle” in this example. Finally, once per frame, call:
GetNvPmApi()->Sample(hNVPMContext, NULL, &nCount);
PerfKit
NVPerfKit 4.5.1 5 December 2015
to sample the currently active counter(s) and
GetNvPmApi()->GetCounterValueByName(hNVPMContext, “gpu_idle”, 0, &value,
&cycle);
to retrieve the resulting counter value.
Any number of driver counters can be enabled concurrently and will be updated at the end of every frame. GPU counters, however, are a more limited resource, and can only sample a certain number of counters per frame. The counter values can always be queried, but they will be refreshed in a round robin fashion as they are sampled.
The counters are queried when NVPMSample is called. If the goal is to collect GPU counters for the full frame then the application should force a CPU/GPU synchronization prior to calling NVPMSample.
Experiment Mode
Experiment mode is used for multi-pass collection at a draw call or compute dispatch granularity. This mode requires additional instrumentation at the beginning and end of each frame add before and after each draw call and compute dispatch that is profiled.
Experiment mode allows the collection of raw counters, aggregate counters, and simplified experiments. It can take many frames to collect complex aggregate counters and all of the simplified experiments. This requires that each frame replay renders the same scene data in the same order (as if the game and all animations were paused).
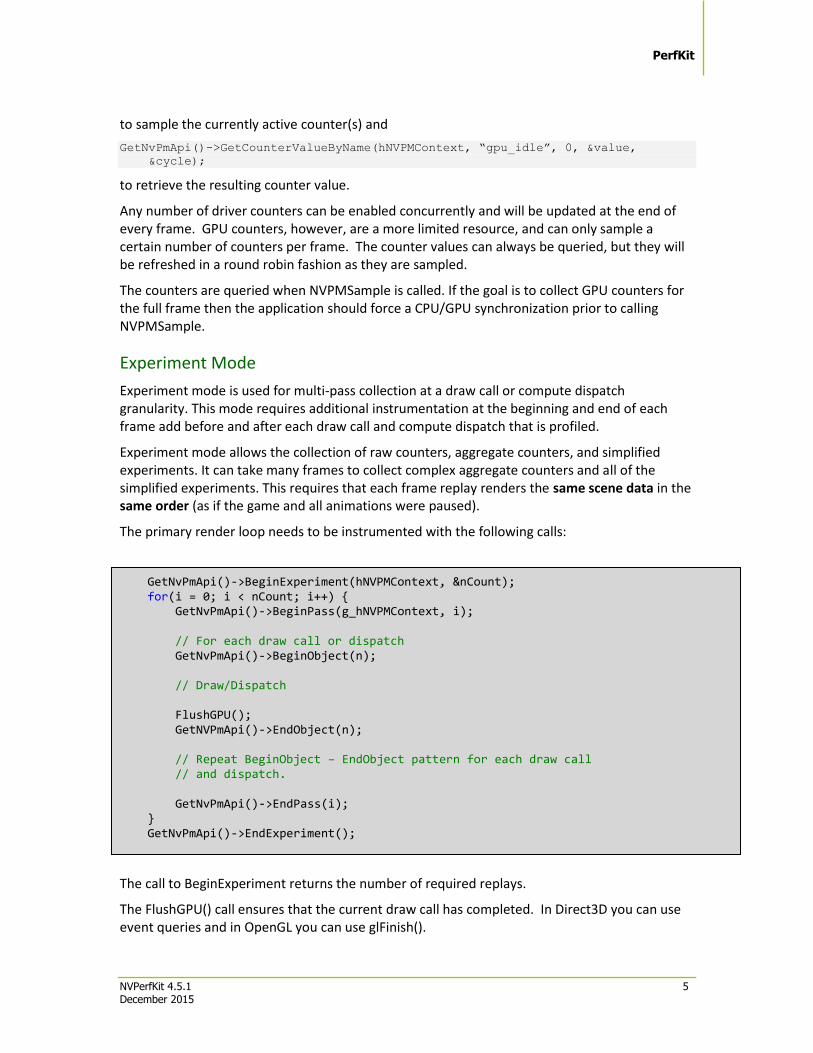
The primary render loop needs to be instrumented with the following calls:
GetNvPmApi()->BeginExperiment(hNVPMContext, &nCount); for(i = 0; i < nCount; i++) { GetNvPmApi()->BeginPass(g_hNVPMContext, i); // For each draw call or dispatch GetNvPmApi()->BeginObject(n); // Draw/Dispatch FlushGPU(); GetNVPmApi()->EndObject(n); // Repeat BeginObject – EndObject pattern for each draw call // and dispatch. GetNvPmApi()->EndPass(i); } GetNvPmApi()->EndExperiment();
The call to BeginExperiment returns the number of required replays.
The FlushGPU() call ensures that the current draw call has completed. In Direct3D you can use event queries and in OpenGL you can use glFinish().
PerfKit
NVPerfKit 4.5.1 6 December 2015
After calling EndExperiment() the value for each counter for each object can be retrieved by calling GetCounterValue().
Simplified Experiments
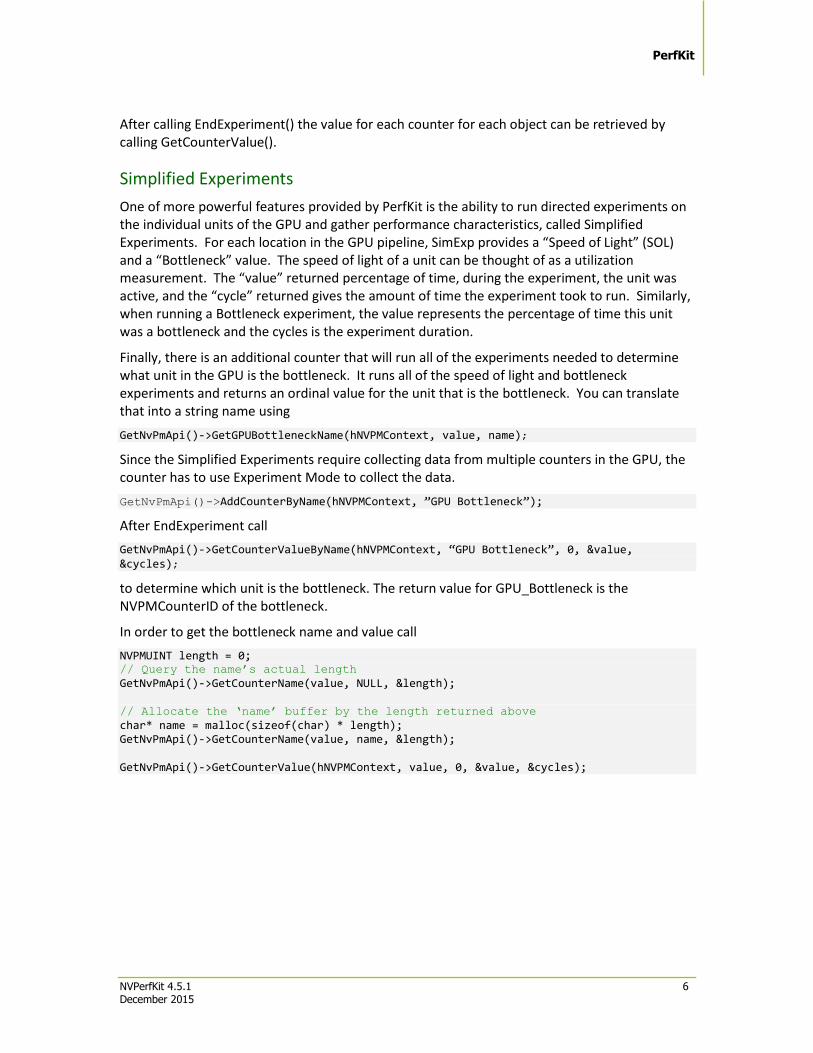
One of more powerful features provided by PerfKit is the ability to run directed experiments on the individual units of the GPU and gather performance characteristics, called Simplified Experiments. For each location in the GPU pipeline, SimExp provides a “Speed of Light” (SOL) and a “Bottleneck” value. The speed of light of a unit can be thought of as a utilization measurement. The “value” returned percentage of time, during the experiment, the unit was active, and the “cycle” returned gives the amount of time the experiment took to run. Similarly, when running a Bottleneck experiment, the value represents the percentage of time this unit was a bottleneck and the cycles is the experiment duration.
Finally, there is an additional counter that will run all of the experiments needed to determine what unit in the GPU is the bottleneck. It runs all of the speed of light and bottleneck experiments and returns an ordinal value for the unit that is the bottleneck. You can translate that into a string name using
GetNvPmApi()->GetGPUBottleneckName(hNVPMContext, value, name);
Since the Simplified Experiments require collecting data from multiple counters in the GPU, the counter has to use Experiment Mode to collect the data.
GetNvPmApi()->AddCounterByName(hNVPMContext, ”GPU Bottleneck”);
After EndExperiment call
GetNvPmApi()->GetCounterValueByName(hNVPMContext, “GPU Bottleneck”, 0, &value, &cycles);
to determine which unit is the bottleneck. The return value for GPU_Bottleneck is the NVPMCounterID of the bottleneck.
In order to get the bottleneck name and value call
NVPMUINT length = 0; // Query the name’s actual length GetNvPmApi()->GetCounterName(value, NULL, &length);
// Allocate the ‘name’ buffer by the length returned above
char* name = malloc(sizeof(char) * length); GetNvPmApi()->GetCounterName(value, name, &length); GetNvPmApi()->GetCounterValue(hNVPMContext, value, 0, &value, &cycles);
PerfKit
NVPerfKit 4.5.1 7 December 2015
Appendix A. Frequently Asked Questions
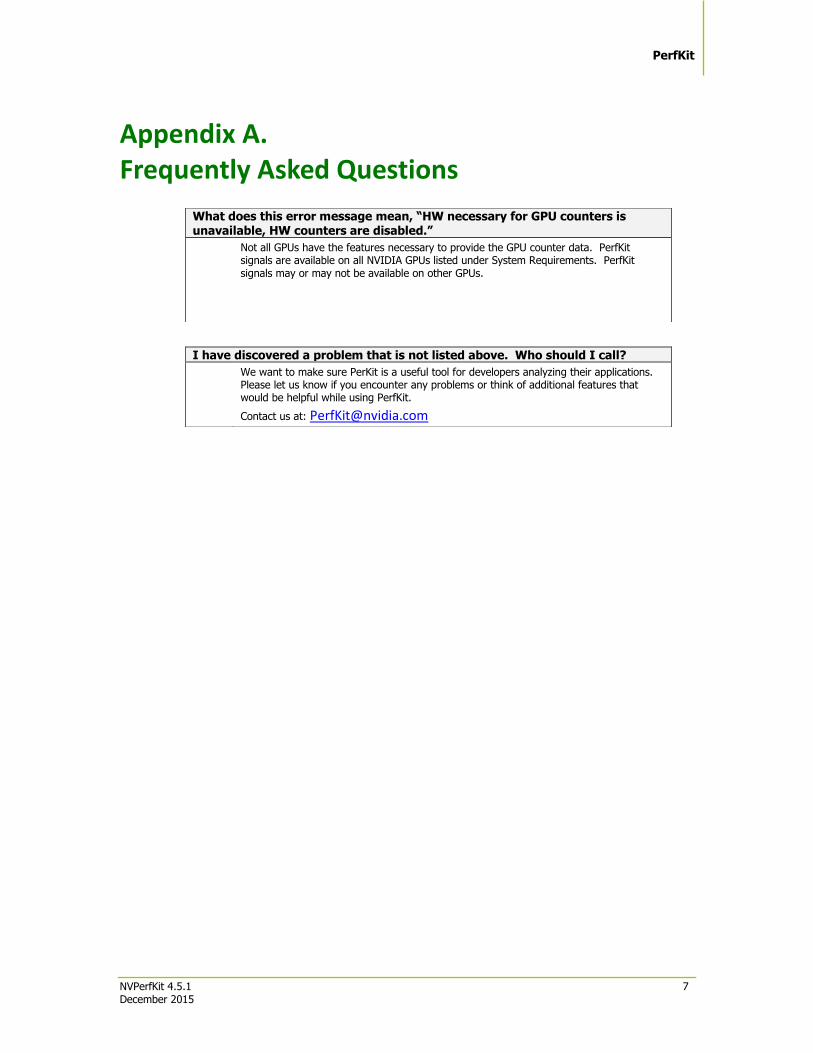
What does this error message mean, “HW necessary for GPU counters is unavailable, HW counters are disabled.”
Not all GPUs have the features necessary to provide the GPU counter data. PerfKit signals are available on all NVIDIA GPUs listed under System Requirements. PerfKit signals may or may not be available on other GPUs.
I have discovered a problem that is not listed above. Who should I call?
We want to make sure PerKit is a useful tool for developers analyzing their applications. Please let us know if you encounter any problems or think of additional features that would be helpful while using PerfKit.
Contact us at: [email protected]
NVPerfKit 4.5.1 8 December 2015
Appendix B. Counters Reference
There are three types of counters available through PerfKit. Hardware counters provide data directly from various points inside the GPU. Software counters, both OpenGL and Direct3D, give insight into the state and performance of the driver. Simplified Experiments are multi-pass experiments that give detailed information about the state of the GPU.
The GPU counters give results accumulated from the previous time the GPU was sampled. For instance, the counter shaded_pixel_count gives the number of pixels sent to the shading units since the last sample was taken. Once you integrate the counters into your own application, you can sample on a per frame basis and correlate the data to a given frame.
All of the software/driver counters represent a per frame accounting. These counters are accumulated and updated in the driver per frame, so even if you sample at a sub-frame rate frequency, the software counters will hold the same data (from the previous frame) until the end of the current frame.
Counter data is provided as either raw values or as a percentage. Raw counters count events (triangles, pixels, milliseconds, etc.) since the last call. Percentage counters are event counts based on the clock rate where the event count is divided by the number of cycles. For example, gpu_idle counts the number of clock ticks that the GPU was idle since the last call. This value is automatically divided by the total number of clock ticks to give the percentage of time that the GPU was idle.
In contrast, sampling the GPU counters with the NvPmApi always returns raw numbers for the value and cycle counts. Counting experiments (shaded_pixel_count, setup_primitive_count, etc.) return the same number for value and cycles, representing the number of items encountered during the experiment (pixels, primitives, etc.). Other experiments, like gpu_idle, rop_busy, etc. return the number of clock cycles the GPU was signaling that state as the value, and the number of cycles the experiment ran in cycles. You can query the attribute NVPMA_COUNTER_DISPLAY_HINT to programmatically determine if a counter should be displayed as a raw value (like triangle_count for instance), or as a percentage (like gpu_idle). To display a percentage, simply divide the value by the cycle count to calculate the appropriate percentage.
The Simplified Experiments report the results in a hybrid fashion. The event is the integer percentage of the counter (XXX SOL, XXX Bottleneck) representing percentage utilization and percent of the time the unit was a bottleneck, respectively. The cycle count is the number of cycles that the experiment was run. NVIDIA GPUs have multiple clock domains. Counters collected in different clock domains may have significantly different cycle count values. Finally, the result of GPU Bottleneck is an integer in the event count that is the unit that is determined to be the system bottleneck.
Table 1 shows a description of the available software and hardware counters. A # next a counter denotes a raw counter and % denotes a percentage counter.
PerfKit
NVPerfKit 4.5.1 9 December 2015
List Counters
The command line tool NvPmApiQuery.exe in the PerfKit\bin\[win7_x86\] directory can be used to enumerate the counters by API (D3D9/10/11, OpenGL) and by chip (GF100, GK104, GK110, …). NvPmApiQuery requires NvPmApi.Core.dll/libNvPmApi.Core.so to be in the library search path.
The sections below will provide some additional information on the software and hardware counters. NvPmApiQuery.exe should be used to get the full list of counters.
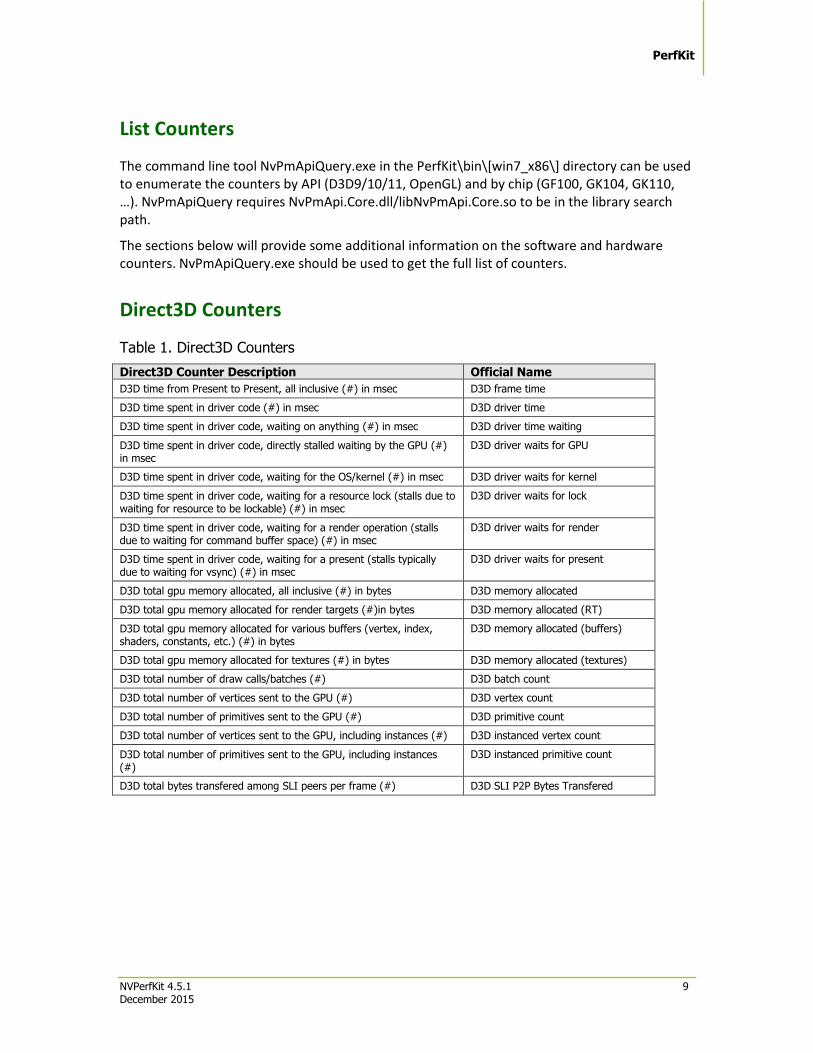
Direct3D Counters
Table 1. Direct3D Counters
Direct3D Counter Description Official Name
D3D time from Present to Present, all inclusive (#) in msec D3D frame time
D3D time spent in driver code (#) in msec D3D driver time
D3D time spent in driver code, waiting on anything (#) in msec D3D driver time waiting
D3D time spent in driver code, directly stalled waiting by the GPU (#) in msec
D3D driver waits for GPU
D3D time spent in driver code, waiting for the OS/kernel (#) in msec D3D driver waits for kernel
D3D time spent in driver code, waiting for a resource lock (stalls due to waiting for resource to be lockable) (#) in msec
D3D driver waits for lock
D3D time spent in driver code, waiting for a render operation (stalls due to waiting for command buffer space) (#) in msec
D3D driver waits for render
D3D time spent in driver code, waiting for a present (stalls typically due to waiting for vsync) (#) in msec
D3D driver waits for present
D3D total gpu memory allocated, all inclusive (#) in bytes D3D memory allocated
D3D total gpu memory allocated for render targets (#)in bytes D3D memory allocated (RT)
D3D total gpu memory allocated for various buffers (vertex, index, shaders, constants, etc.) (#) in bytes
D3D memory allocated (buffers)
D3D total gpu memory allocated for textures (#) in bytes D3D memory allocated (textures)
D3D total number of draw calls/batches (#) D3D batch count
D3D total number of vertices sent to the GPU (#) D3D vertex count
D3D total number of primitives sent to the GPU (#) D3D primitive count
D3D total number of vertices sent to the GPU, including instances (#) D3D instanced vertex count
D3D total number of primitives sent to the GPU, including instances (#)
D3D instanced primitive count
D3D total bytes transfered among SLI peers per frame (#) D3D SLI P2P Bytes Transfered
PerfKit
NVPerfKit 4.5.1 10 December 2015
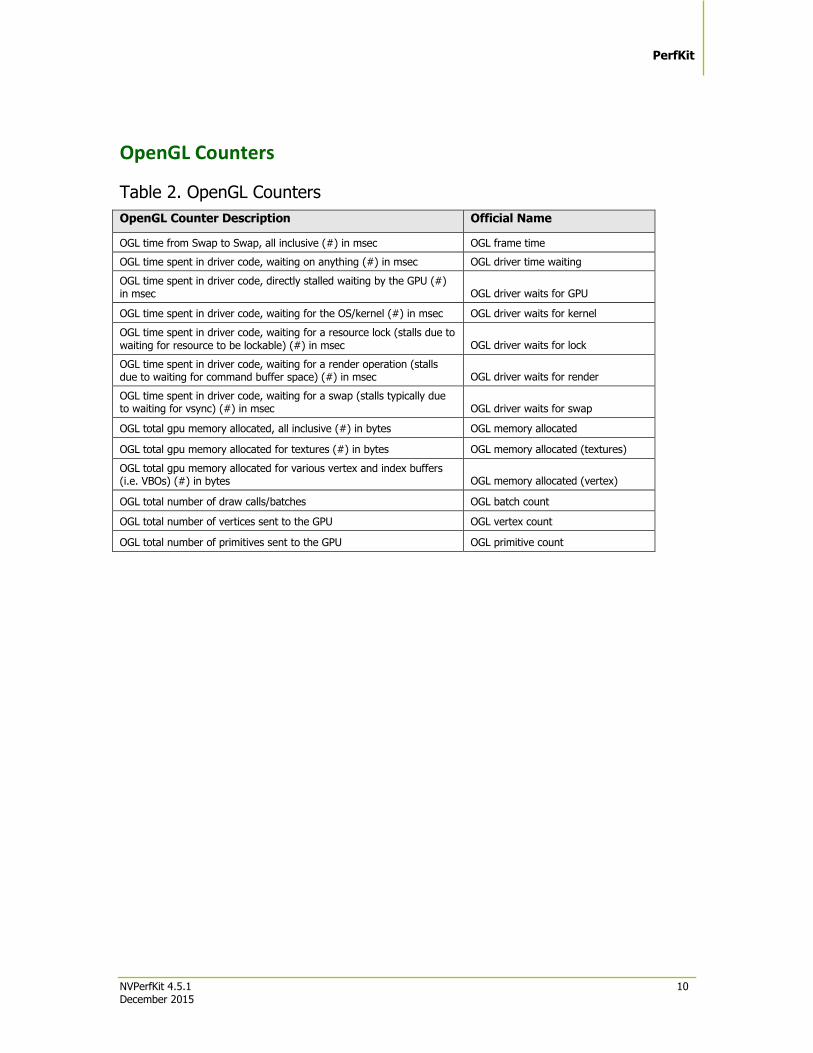
OpenGL Counters
Table 2. OpenGL Counters
OpenGL Counter Description Official Name
OGL time from Swap to Swap, all inclusive (#) in msec OGL frame time
OGL time spent in driver code, waiting on anything (#) in msec OGL driver time waiting
OGL time spent in driver code, directly stalled waiting by the GPU (#) in msec OGL driver waits for GPU
OGL time spent in driver code, waiting for the OS/kernel (#) in msec OGL driver waits for kernel
OGL time spent in driver code, waiting for a resource lock (stalls due to waiting for resource to be lockable) (#) in msec OGL driver waits for lock
OGL time spent in driver code, waiting for a render operation (stalls due to waiting for command buffer space) (#) in msec OGL driver waits for render
OGL time spent in driver code, waiting for a swap (stalls typically due to waiting for vsync) (#) in msec OGL driver waits for swap
OGL total gpu memory allocated, all inclusive (#) in bytes OGL memory allocated
OGL total gpu memory allocated for textures (#) in bytes OGL memory allocated (textures)
OGL total gpu memory allocated for various vertex and index buffers (i.e. VBOs) (#) in bytes OGL memory allocated (vertex)
OGL total number of draw calls/batches OGL batch count
OGL total number of vertices sent to the GPU OGL vertex count
OGL total number of primitives sent to the GPU OGL primitive count
PerfKit
NVPerfKit 4.5.1 11 December 2015
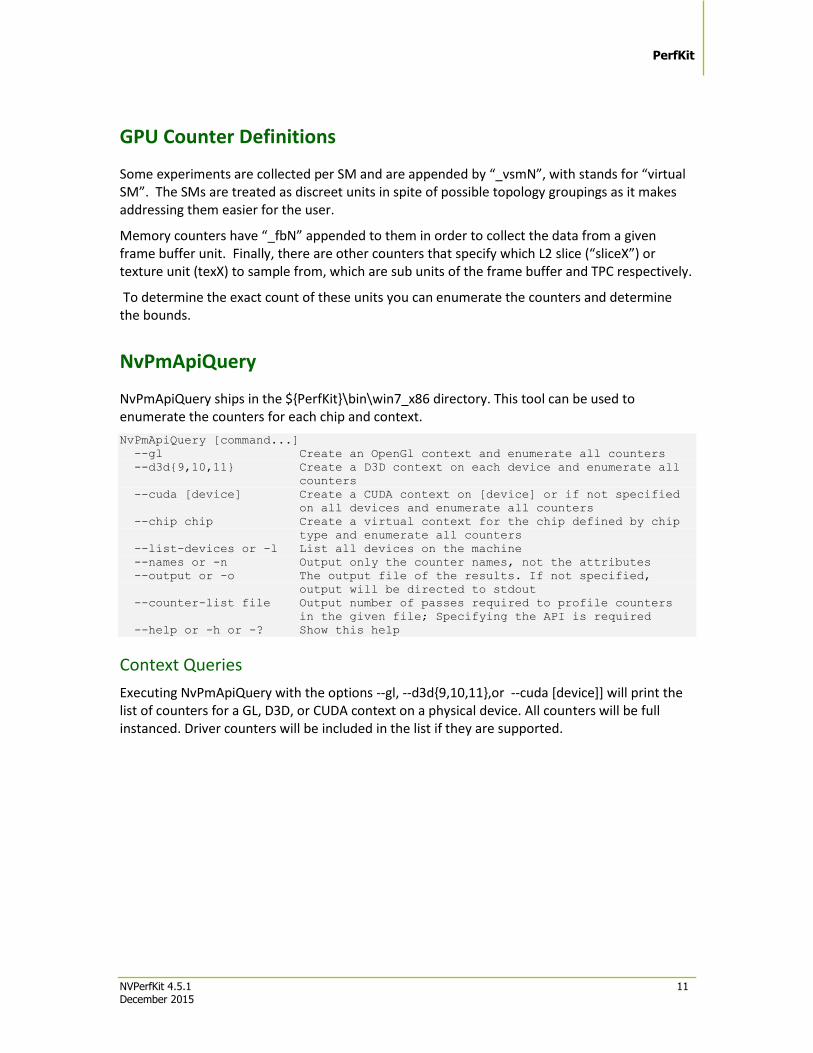
GPU Counter Definitions
Some experiments are collected per SM and are appended by “_vsmN”, with stands for “virtual SM”. The SMs are treated as discreet units in spite of possible topology groupings as it makes addressing them easier for the user.
Memory counters have “_fbN” appended to them in order to collect the data from a given frame buffer unit. Finally, there are other counters that specify which L2 slice (“sliceX”) or texture unit (texX) to sample from, which are sub units of the frame buffer and TPC respectively.
To determine the exact count of these units you can enumerate the counters and determine the bounds.
NvPmApiQuery
NvPmApiQuery ships in the ${PerfKit}\bin\win7_x86 directory. This tool can be used to enumerate the counters for each chip and context.
NvPmApiQuery [command...]
--gl Create an OpenGl context and enumerate all counters
--d3d{9,10,11} Create a D3D context on each device and enumerate all
counters
--cuda [device] Create a CUDA context on [device] or if not specified
on all devices and enumerate all counters
--chip chip Create a virtual context for the chip defined by chip
type and enumerate all counters
--list-devices or -l List all devices on the machine
--names or -n Output only the counter names, not the attributes
--output or -o The output file of the results. If not specified,
output will be directed to stdout
--counter-list file Output number of passes required to profile counters
in the given file; Specifying the API is required
--help or -h or -? Show this help
Context Queries
Executing NvPmApiQuery with the options --gl, --d3d{9,10,11},or --cuda [device]] will print the list of counters for a GL, D3D, or CUDA context on a physical device. All counters will be full instanced. Driver counters will be included in the list if they are supported.
PerfKit
NVPerfKit 4.5.1 12 December 2015
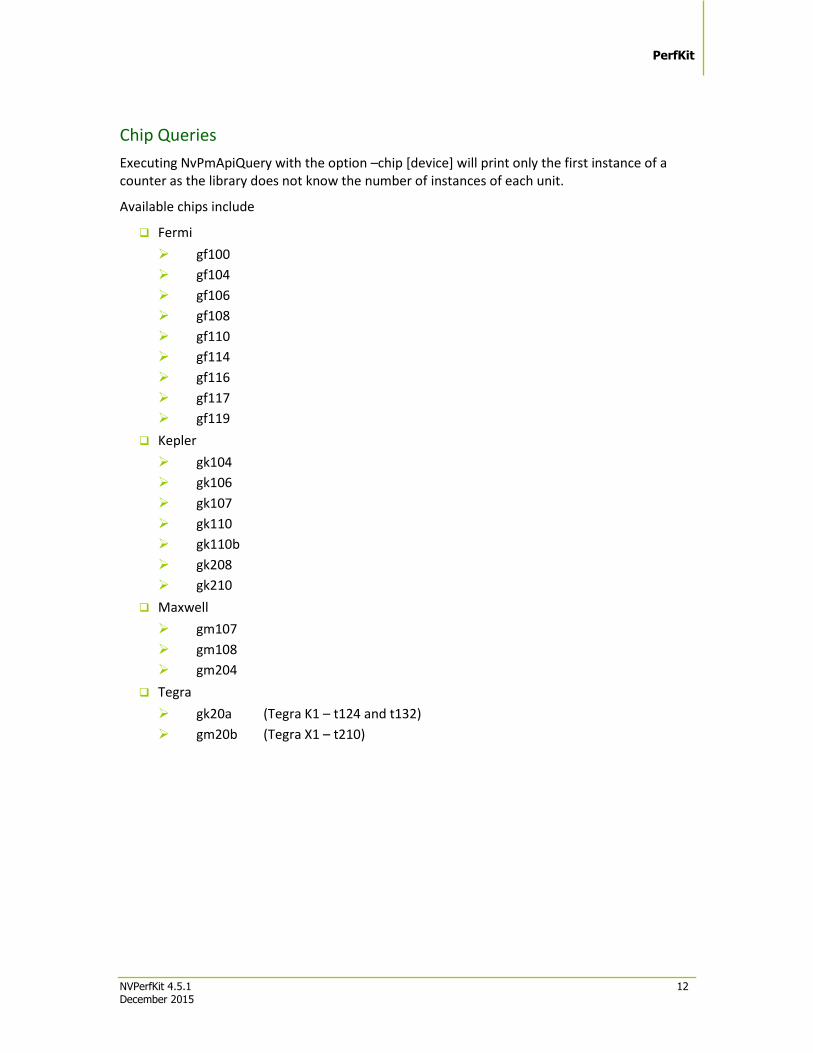
Chip Queries
Executing NvPmApiQuery with the option –chip [device] will print only the first instance of a counter as the library does not know the number of instances of each unit.
Available chips include
Fermi
gf100
gf104
gf106
gf108
gf110
gf114
gf116
gf117
gf119
Kepler
gk104
gk106
gk107
gk110
gk110b
gk208
gk210
Maxwell
gm107
gm108
gm204
Tegra
gk20a (Tegra K1 – t124 and t132)
gm20b (Tegra X1 – t210)
NVPerfKit 4.5.1 13 December 2015
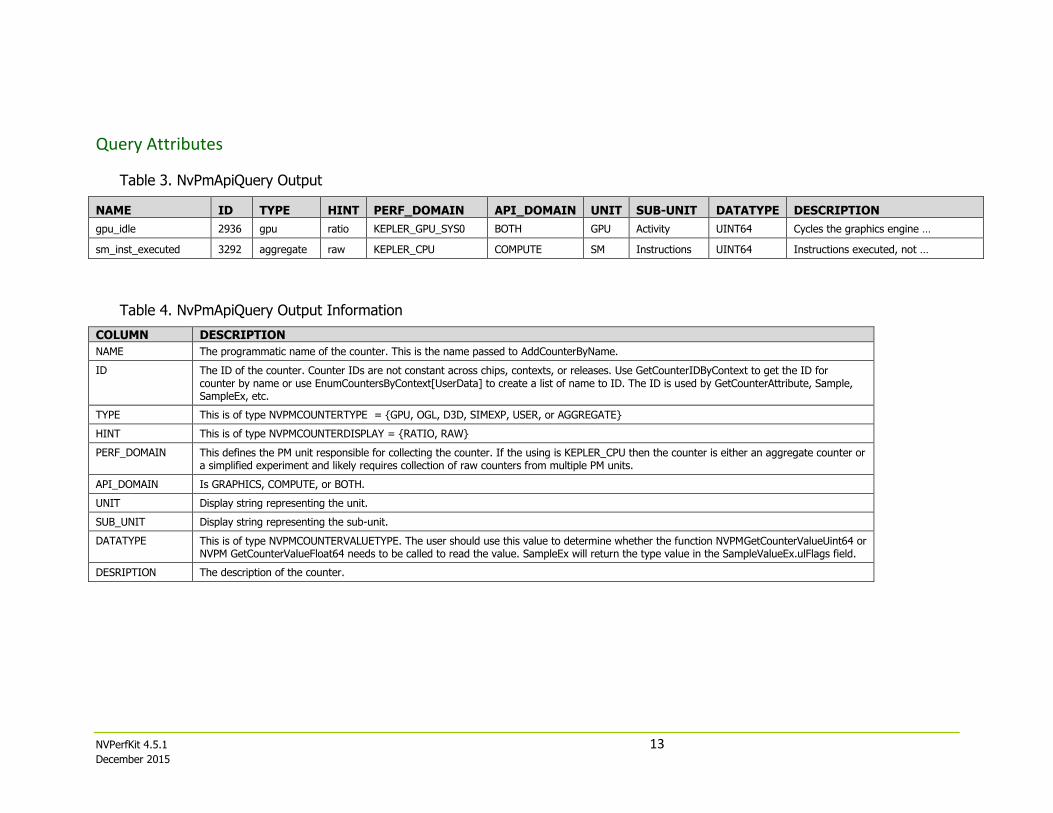
Query Attributes
Table 3. NvPmApiQuery Output
NAME ID TYPE HINT PERF_DOMAIN API_DOMAIN UNIT SUB-UNIT DATATYPE DESCRIPTION
gpu_idle 2936 gpu ratio KEPLER_GPU_SYS0 BOTH GPU Activity UINT64 Cycles the graphics engine …
sm_inst_executed 3292 aggregate raw KEPLER_CPU COMPUTE SM Instructions UINT64 Instructions executed, not …
Table 4. NvPmApiQuery Output Information
COLUMN DESCRIPTION
NAME The programmatic name of the counter. This is the name passed to AddCounterByName.
ID The ID of the counter. Counter IDs are not constant across chips, contexts, or releases. Use GetCounterIDByContext to get the ID for counter by name or use EnumCountersByContext[UserData] to create a list of name to ID. The ID is used by GetCounterAttribute, Sample, SampleEx, etc.
TYPE This is of type NVPMCOUNTERTYPE = {GPU, OGL, D3D, SIMEXP, USER, or AGGREGATE}
HINT This is of type NVPMCOUNTERDISPLAY = {RATIO, RAW}
PERF_DOMAIN This defines the PM unit responsible for collecting the counter. If the using is KEPLER_CPU then the counter is either an aggregate counter or a simplified experiment and likely requires collection of raw counters from multiple PM units.
API_DOMAIN Is GRAPHICS, COMPUTE, or BOTH.
UNIT Display string representing the unit.
SUB_UNIT Display string representing the sub-unit.
DATATYPE This is of type NVPMCOUNTERVALUETYPE. The user should use this value to determine whether the function NVPMGetCounterValueUint64 or NVPM GetCounterValueFloat64 needs to be called to read the value. SampleEx will return the type value in the SampleValueEx.ulFlags field.
DESRIPTION The description of the counter.
NVPerfKit 4.5.1 14 December 2015
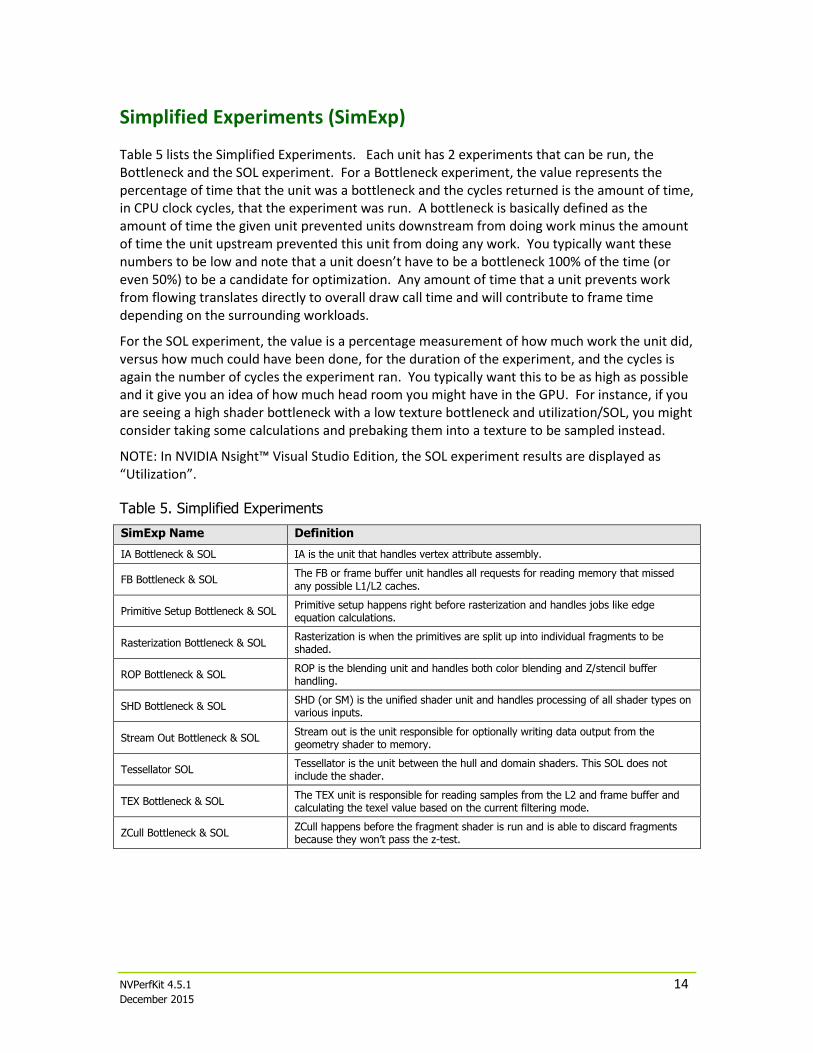
Simplified Experiments (SimExp)
Table 5 lists the Simplified Experiments. Each unit has 2 experiments that can be run, the Bottleneck and the SOL experiment. For a Bottleneck experiment, the value represents the percentage of time that the unit was a bottleneck and the cycles returned is the amount of time, in CPU clock cycles, that the experiment was run. A bottleneck is basically defined as the amount of time the given unit prevented units downstream from doing work minus the amount of time the unit upstream prevented this unit from doing any work. You typically want these numbers to be low and note that a unit doesn’t have to be a bottleneck 100% of the time (or even 50%) to be a candidate for optimization. Any amount of time that a unit prevents work from flowing translates directly to overall draw call time and will contribute to frame time depending on the surrounding workloads.
For the SOL experiment, the value is a percentage measurement of how much work the unit did, versus how much could have been done, for the duration of the experiment, and the cycles is again the number of cycles the experiment ran. You typically want this to be as high as possible and it give you an idea of how much head room you might have in the GPU. For instance, if you are seeing a high shader bottleneck with a low texture bottleneck and utilization/SOL, you might consider taking some calculations and prebaking them into a texture to be sampled instead.
NOTE: In NVIDIA Nsight™ Visual Studio Edition, the SOL experiment results are displayed as “Utilization”.
Table 5. Simplified Experiments
SimExp Name Definition
IA Bottleneck & SOL IA is the unit that handles vertex attribute assembly.
FB Bottleneck & SOL The FB or frame buffer unit handles all requests for reading memory that missed any possible L1/L2 caches.
Primitive Setup Bottleneck & SOL Primitive setup happens right before rasterization and handles jobs like edge equation calculations.
Rasterization Bottleneck & SOL Rasterization is when the primitives are split up into individual fragments to be shaded.
ROP Bottleneck & SOL ROP is the blending unit and handles both color blending and Z/stencil buffer handling.
SHD Bottleneck & SOL SHD (or SM) is the unified shader unit and handles processing of all shader types on various inputs.
Stream Out Bottleneck & SOL Stream out is the unit responsible for optionally writing data output from the geometry shader to memory.
Tessellator SOL Tessellator is the unit between the hull and domain shaders. This SOL does not include the shader.
TEX Bottleneck & SOL The TEX unit is responsible for reading samples from the L2 and frame buffer and calculating the texel value based on the current filtering mode.
ZCull Bottleneck & SOL ZCull happens before the fragment shader is run and is able to discard fragments because they won’t pass the z-test.
NVPerfKit 4.5.1 15 December 2015
Appendix C. NvPmApi Specification
All functions return NVPM_OK if no error was encountered. Functions can also return NVPM_ERROR_INTERNAL for internal errors. If this happens, please send email to [email protected] with details about the API usage. Please note that all of the NVPM_WARNING_* messages have not been implemented yet, and will be supported in a future release.
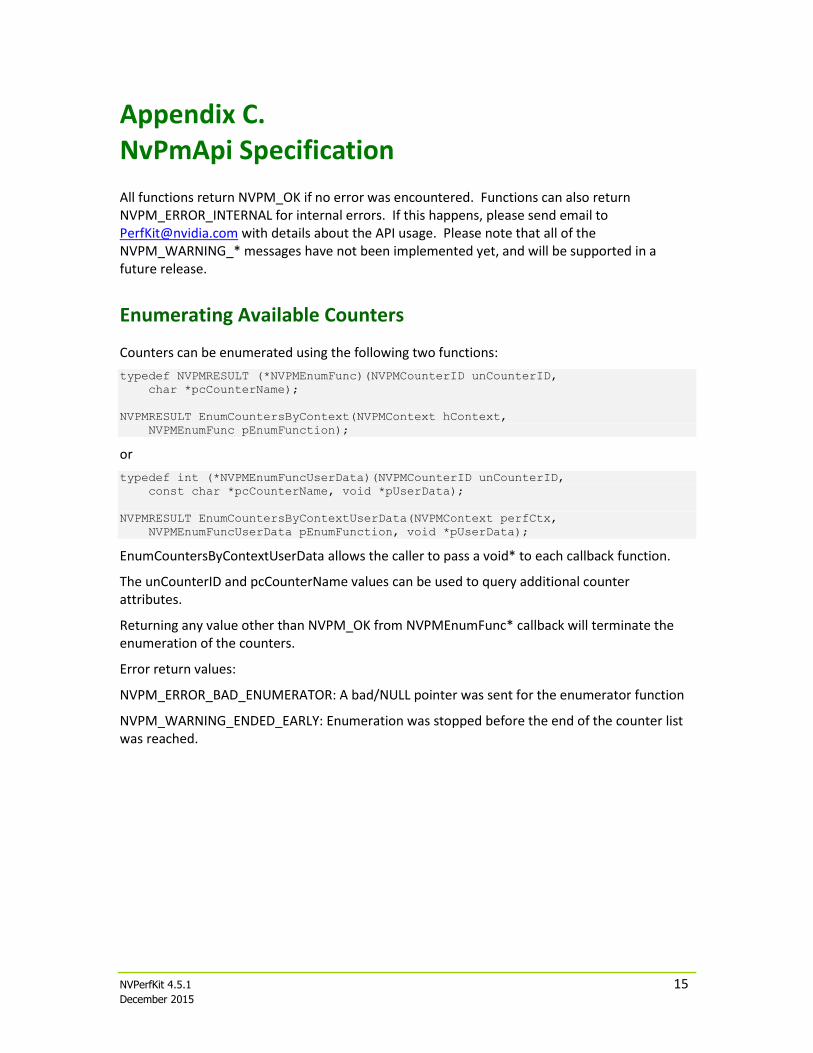
Enumerating Available Counters
Counters can be enumerated using the following two functions:
typedef NVPMRESULT (*NVPMEnumFunc)(NVPMCounterID unCounterID,
char *pcCounterName);
NVPMRESULT EnumCountersByContext(NVPMContext hContext,
NVPMEnumFunc pEnumFunction);
or
typedef int (*NVPMEnumFuncUserData)(NVPMCounterID unCounterID,
const char *pcCounterName, void *pUserData);
NVPMRESULT EnumCountersByContextUserData(NVPMContext perfCtx,
NVPMEnumFuncUserData pEnumFunction, void *pUserData);
EnumCountersByContextUserData allows the caller to pass a void* to each callback function.
The unCounterID and pcCounterName values can be used to query additional counter attributes.
Returning any value other than NVPM_OK from NVPMEnumFunc* callback will terminate the enumeration of the counters.
Error return values:
NVPM_ERROR_BAD_ENUMERATOR: A bad/NULL pointer was sent for the enumerator function
NVPM_WARNING_ENDED_EARLY: Enumeration was stopped before the end of the counter list was reached.
PerfKit
NVPerfKit 4.5.1 16 December 2015
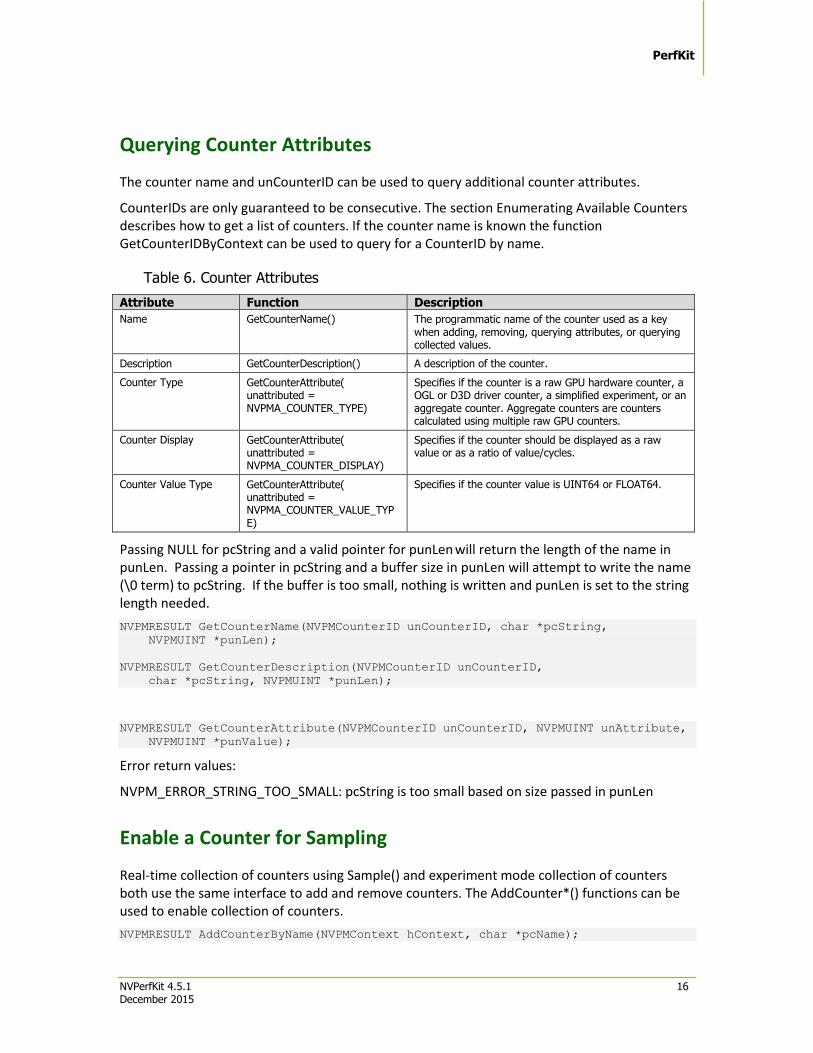
Querying Counter Attributes
The counter name and unCounterID can be used to query additional counter attributes.
CounterIDs are only guaranteed to be consecutive. The section Enumerating Available Counters describes how to get a list of counters. If the counter name is known the function GetCounterIDByContext can be used to query for a CounterID by name.
Table 6. Counter Attributes
Attribute Function Description
Name GetCounterName() The programmatic name of the counter used as a key when adding, removing, querying attributes, or querying collected values.
Description GetCounterDescription() A description of the counter.
Counter Type GetCounterAttribute( unattributed = NVPMA_COUNTER_TYPE)
Specifies if the counter is a raw GPU hardware counter, a OGL or D3D driver counter, a simplified experiment, or an aggregate counter. Aggregate counters are counters calculated using multiple raw GPU counters.
Counter Display GetCounterAttribute( unattributed = NVPMA_COUNTER_DISPLAY)
Specifies if the counter should be displayed as a raw value or as a ratio of value/cycles.
Counter Value Type GetCounterAttribute( unattributed = NVPMA_COUNTER_VALUE_TYPE)
Specifies if the counter value is UINT64 or FLOAT64.
Passing NULL for pcString and a valid pointer for punLen will return the length of the name in punLen. Passing a pointer in pcString and a buffer size in punLen will attempt to write the name (\0 term) to pcString. If the buffer is too small, nothing is written and punLen is set to the string length needed.
NVPMRESULT GetCounterName(NVPMCounterID unCounterID, char *pcString,
NVPMUINT *punLen);
NVPMRESULT GetCounterDescription(NVPMCounterID unCounterID,
char *pcString, NVPMUINT *punLen);
NVPMRESULT GetCounterAttribute(NVPMCounterID unCounterID, NVPMUINT unAttribute,
NVPMUINT *punValue);
Error return values:
NVPM_ERROR_STRING_TOO_SMALL: pcString is too small based on size passed in punLen
Enable a Counter for Sampling
Real-time collection of counters using Sample() and experiment mode collection of counters both use the same interface to add and remove counters. The AddCounter*() functions can be used to enable collection of counters.
NVPMRESULT AddCounterByName(NVPMContext hContext, char *pcName);
PerfKit
NVPerfKit 4.5.1 17 December 2015
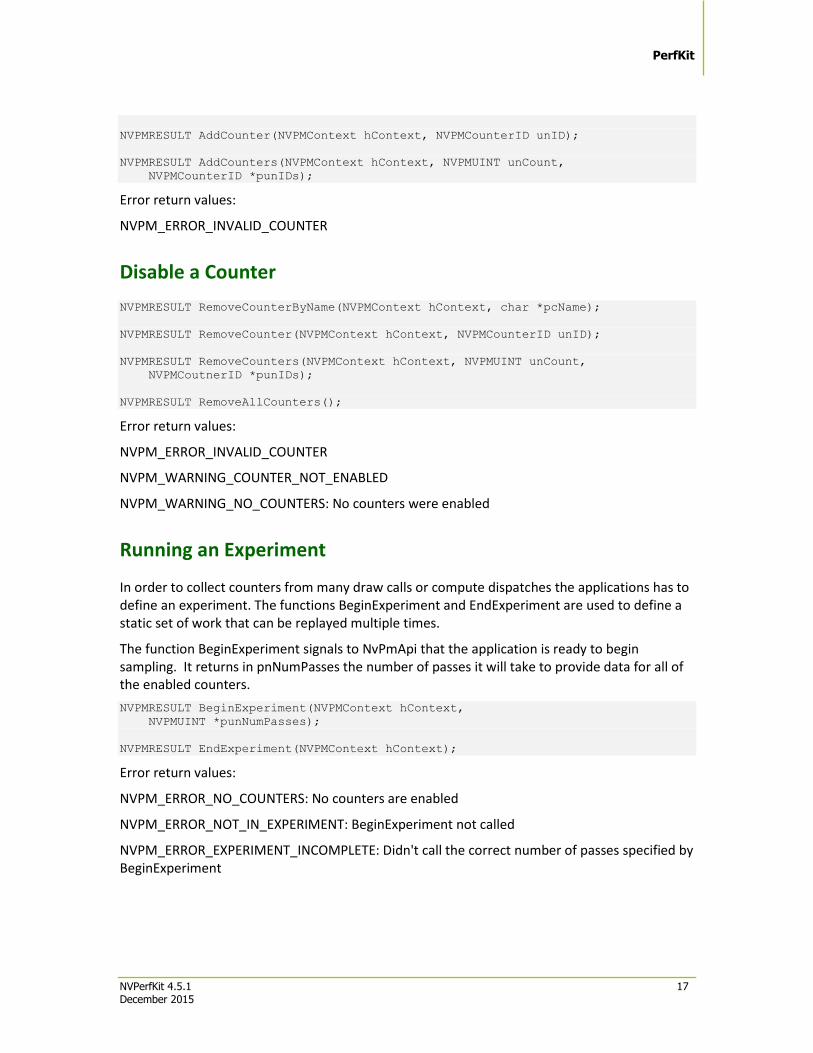
NVPMRESULT AddCounter(NVPMContext hContext, NVPMCounterID unID);
NVPMRESULT AddCounters(NVPMContext hContext, NVPMUINT unCount,
NVPMCounterID *punIDs);
Error return values:
NVPM_ERROR_INVALID_COUNTER
Disable a Counter
NVPMRESULT RemoveCounterByName(NVPMContext hContext, char *pcName);
NVPMRESULT RemoveCounter(NVPMContext hContext, NVPMCounterID unID);
NVPMRESULT RemoveCounters(NVPMContext hContext, NVPMUINT unCount,
NVPMCoutnerID *punIDs);
NVPMRESULT RemoveAllCounters();
Error return values:
NVPM_ERROR_INVALID_COUNTER
NVPM_WARNING_COUNTER_NOT_ENABLED
NVPM_WARNING_NO_COUNTERS: No counters were enabled
Running an Experiment
In order to collect counters from many draw calls or compute dispatches the applications has to define an experiment. The functions BeginExperiment and EndExperiment are used to define a static set of work that can be replayed multiple times.
The function BeginExperiment signals to NvPmApi that the application is ready to begin sampling. It returns in pnNumPasses the number of passes it will take to provide data for all of the enabled counters.
NVPMRESULT BeginExperiment(NVPMContext hContext,
NVPMUINT *punNumPasses);
NVPMRESULT EndExperiment(NVPMContext hContext);
Error return values:
NVPM_ERROR_NO_COUNTERS: No counters are enabled
NVPM_ERROR_NOT_IN_EXPERIMENT: BeginExperiment not called
NVPM_ERROR_EXPERIMENT_INCOMPLETE: Didn't call the correct number of passes specified by BeginExperiment
PerfKit
NVPerfKit 4.5.1 18 December 2015
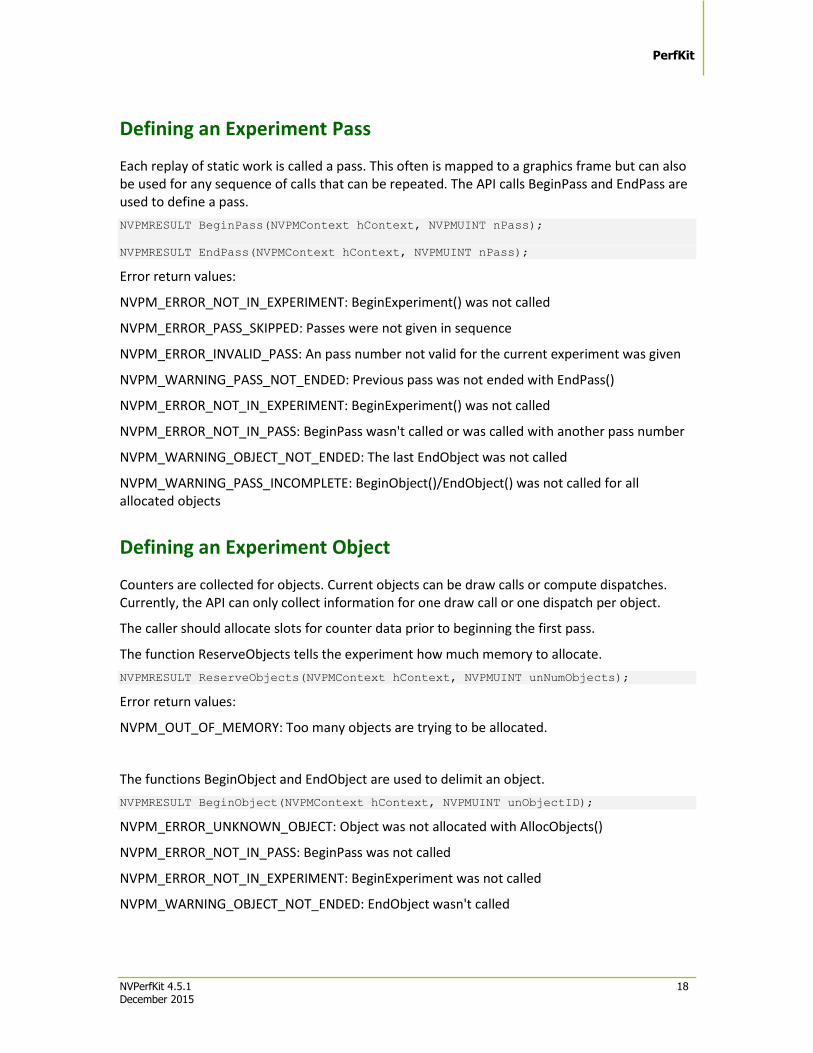
Defining an Experiment Pass
Each replay of static work is called a pass. This often is mapped to a graphics frame but can also be used for any sequence of calls that can be repeated. The API calls BeginPass and EndPass are used to define a pass.
NVPMRESULT BeginPass(NVPMContext hContext, NVPMUINT nPass);
NVPMRESULT EndPass(NVPMContext hContext, NVPMUINT nPass);
Error return values:
NVPM_ERROR_NOT_IN_EXPERIMENT: BeginExperiment() was not called
NVPM_ERROR_PASS_SKIPPED: Passes were not given in sequence
NVPM_ERROR_INVALID_PASS: An pass number not valid for the current experiment was given
NVPM_WARNING_PASS_NOT_ENDED: Previous pass was not ended with EndPass()
NVPM_ERROR_NOT_IN_EXPERIMENT: BeginExperiment() was not called
NVPM_ERROR_NOT_IN_PASS: BeginPass wasn't called or was called with another pass number
NVPM_WARNING_OBJECT_NOT_ENDED: The last EndObject was not called
NVPM_WARNING_PASS_INCOMPLETE: BeginObject()/EndObject() was not called for all allocated objects
Defining an Experiment Object
Counters are collected for objects. Current objects can be draw calls or compute dispatches. Currently, the API can only collect information for one draw call or one dispatch per object.
The caller should allocate slots for counter data prior to beginning the first pass.
The function ReserveObjects tells the experiment how much memory to allocate.
NVPMRESULT ReserveObjects(NVPMContext hContext, NVPMUINT unNumObjects);
Error return values:
NVPM_OUT_OF_MEMORY: Too many objects are trying to be allocated.
The functions BeginObject and EndObject are used to delimit an object.
NVPMRESULT BeginObject(NVPMContext hContext, NVPMUINT unObjectID);
NVPM_ERROR_UNKNOWN_OBJECT: Object was not allocated with AllocObjects()
NVPM_ERROR_NOT_IN_PASS: BeginPass was not called
NVPM_ERROR_NOT_IN_EXPERIMENT: BeginExperiment was not called
NVPM_WARNING_OBJECT_NOT_ENDED: EndObject wasn't called
PerfKit
NVPerfKit 4.5.1 19 December 2015
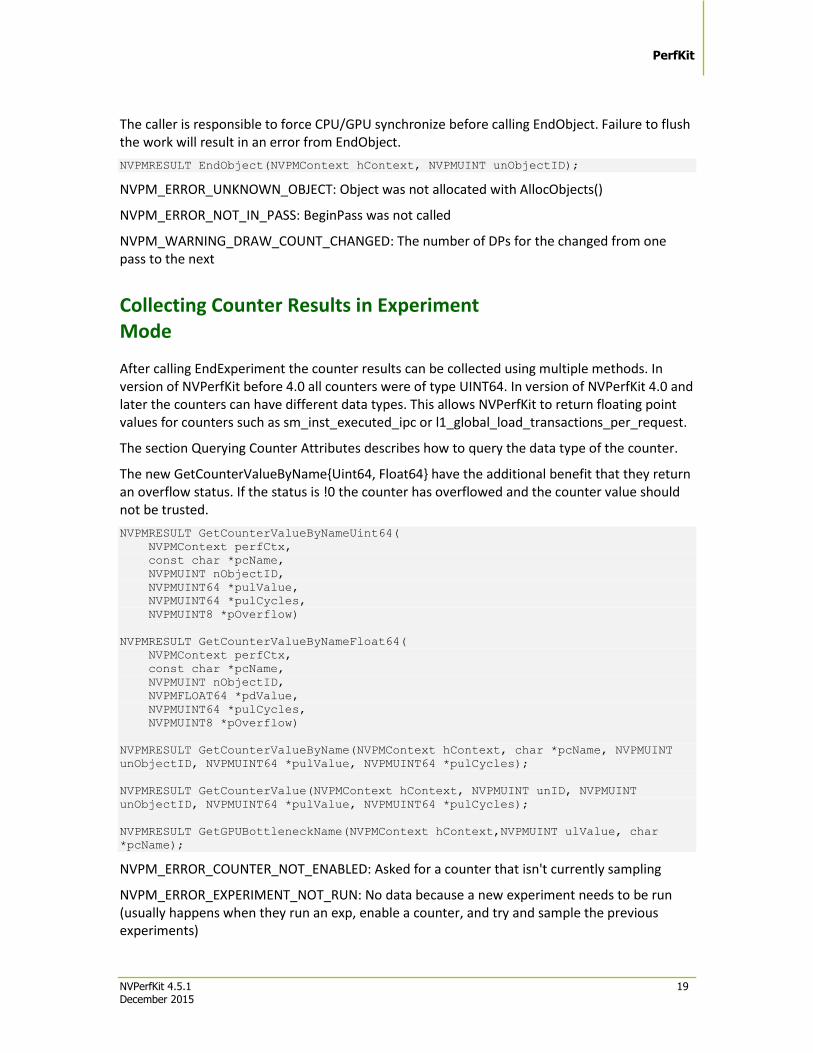
The caller is responsible to force CPU/GPU synchronize before calling EndObject. Failure to flush the work will result in an error from EndObject.
NVPMRESULT EndObject(NVPMContext hContext, NVPMUINT unObjectID);
NVPM_ERROR_UNKNOWN_OBJECT: Object was not allocated with AllocObjects()
NVPM_ERROR_NOT_IN_PASS: BeginPass was not called
NVPM_WARNING_DRAW_COUNT_CHANGED: The number of DPs for the changed from one pass to the next
Collecting Counter Results in Experiment Mode
After calling EndExperiment the counter results can be collected using multiple methods. In version of NVPerfKit before 4.0 all counters were of type UINT64. In version of NVPerfKit 4.0 and later the counters can have different data types. This allows NVPerfKit to return floating point values for counters such as sm_inst_executed_ipc or l1_global_load_transactions_per_request.
The section Querying Counter Attributes describes how to query the data type of the counter.
The new GetCounterValueByName{Uint64, Float64} have the additional benefit that they return an overflow status. If the status is !0 the counter has overflowed and the counter value should not be trusted.
NVPMRESULT GetCounterValueByNameUint64(
NVPMContext perfCtx,
const char *pcName,
NVPMUINT nObjectID,
NVPMUINT64 *pulValue,
NVPMUINT64 *pulCycles,
NVPMUINT8 *pOverflow)
NVPMRESULT GetCounterValueByNameFloat64(
NVPMContext perfCtx,
const char *pcName,
NVPMUINT nObjectID,
NVPMFLOAT64 *pdValue,
NVPMUINT64 *pulCycles,
NVPMUINT8 *pOverflow)
NVPMRESULT GetCounterValueByName(NVPMContext hContext, char *pcName, NVPMUINT
unObjectID, NVPMUINT64 *pulValue, NVPMUINT64 *pulCycles);
NVPMRESULT GetCounterValue(NVPMContext hContext, NVPMUINT unID, NVPMUINT
unObjectID, NVPMUINT64 *pulValue, NVPMUINT64 *pulCycles);
NVPMRESULT GetGPUBottleneckName(NVPMContext hContext,NVPMUINT ulValue, char
*pcName);
NVPM_ERROR_COUNTER_NOT_ENABLED: Asked for a counter that isn't currently sampling
NVPM_ERROR_EXPERIMENT_NOT_RUN: No data because a new experiment needs to be run (usually happens when they run an exp, enable a counter, and try and sample the previous experiments)
PerfKit
NVPerfKit 4.5.1 20 December 2015
NVPM_ERROR_EXPERIMENT_RUNNING: Cannot sample while the experiment is running
Miscellaneous Functions
UINT GetExtendedError()
NVIDIA Corporation 2701 San Tomas Expressway
Santa Clara, CA 95050 www.nvidia.com
Notice
ALL NVIDIA DESIGN SPECIFICATIONS, REFERENCE BOARDS, FILES, DRAWINGS, DIAGNOSTICS, LISTS, AND OTHER DOCUMENTS (TOGETHER AND SEPARATELY, “MATERIALS”) ARE BEING PROVIDED “AS IS." NVIDIA MAKES NO WARRANTIES, EXPRESSED, IMPLIED, STATUTORY, OR OTHERWISE WITH RESPECT TO THE MATERIALS, AND EXPRESSLY DISCLAIMS ALL IMPLIED WARRANTIES OF NONINFRINGEMENT, MERCHANTABILITY, AND FITNESS FOR A PARTICULAR PURPOSE.
Information furnished is believed to be accurate and reliable. However, NVIDIA Corporation assumes no responsibility for the consequences of use of such information or for any infringement of patents or other rights of third parties that may result from its use. No license is granted by implication or otherwise under any patent or patent rights of NVIDIA Corporation. Specifications mentioned in this publication are subject to change without notice. This publication supersedes and replaces all information previously supplied. NVIDIA Corporation products are not authorized for use as critical components in life support devices or systems without express written approval of NVIDIA Corporation.
Trademarks
NVIDIA and the NVIDIA logo are trademarks or registered trademarks of NVIDIA Corporation in
the United States and other countries. Other company and product names may be trademarks of the respective companies with which they are associated.
Copyright
© 2012-2014 NVIDIA Corporation. All rights reserved.