
NVPerfKit User Guide
37
U U s s e e r r G G u u i i d d e e NVIDIA PerfKit NVIDIA Performance Toolkit
Transcript of NVPerfKit User Guide

UUsseerr GGuuiiddee
NNVVIIDDIIAA PPeerrffKKiitt
NNVVIIDDIIAA PPeerrffoorrmmaannccee TToooollkkiitt

DA-01800-001_v04 i April 2013
Table of Contents
Introduction ..................................................................................................... 2
System Requirements.................................................................................................................. 3
PerfKit Getting Started .................................................................................... 4
Installing PerfKit .......................................................................................................................... 4
Using PerfAPI ............................................................................................................................... 4
Simplified Experiments (SimExp) ............................................................................................. 6
Appendix A. Frequently Asked Questions ........................................................ 9
Appendix B. Counters Reference ................................................................... 10
Direct3D Counters ..................................................................................................................... 11
OpenGL Counters ...................................................................................................................... 12
GPU Counters ............................................................................................................................ 13
Simplified Experiments (SimExp) ............................................................................................... 23
Appendix C. PerfAPI Specification ................................................................. 31

DA-01800-001_v04 2 June 2012
Introduction
Please read this entire document before you get started with PerfKit. Several important issues are covered in this document that will help get things running smoothly.
PerfKit gives every graphics application developer access to low-level performance counters inside the driver and hardware counters inside the GPU itself. NVIDIA® Nsight™ Visual Studio Edition is written on top of the same technology, so the same real-time and profiling capabilities available in Nsight are available for any application.
The performance counters are available using the PerfAPI. The counters can be used to determine exactly how your application is using the GPU, identify performance issues, and confirm that performance problems have been resolved.
PerfKit consists of the following components:
NVIDIA PerfAPI libraries and include files
Sample code
Driver Instrumentation Tray Application, which you can use to enable and disable driver instrumentation.

PerfKit
DA-01800-001_v04 3 April 2013
The diagram below shows how the various components of PerfKit fit together.
System Requirements
NVIDIA Display Driver
PerfKit signals are available on all NVIDIA GPUs listed below:
GeForce 6XX (Kepler Family)
GeForce 4XX and 5XX Series (Fermi Family)
GeForce 2XX, 9, and 8 Series
PerfKit signals may or may not be available on other NVIDIA GPUs.
PerfKit
DA-01800-001_v04 4 April 2013
PerfKit Getting Started
Installing PerfKit
Follow the instructions below to install the instrumented driver and get started using PerfKit.
1. The PerfKit is distributed as a single zip file. Unzip the PerfKit , preserving the directory structure, to somewhere on your hard drive or other storage system.
2. Start the Driver Instrumentation Tray application (called NVInstEnabler.exe) which is contained in the root directory of the PerfKit
3. Right-click the tray icon in your system tray and make sure that the Driver Instrumentation menu item is checked. Since this will add some CPU overhead to the Driver, only leave this enabled when you are using the PerfKit.
Using PerfAPI
The PerfAPI implementation is provided via the NvPmApi.h and NvPmApi.Manager.h files included in the PerfKit distribution. This API provides the developer with greater access to the capabilities of the GPU and driver counters, as well as providing an interface to Simplified Experiments (SimExp), which give even more detailed yet easy to use information about GPU performance.
Setting up the PerfAPI is demonstrated by the sample code in the Samples\Direct3DSample and Samples\OpenGLSample directories. Start by placing the following code somewhere near the top of one of your cpp files:

PerfKit
DA-01800-001_v04 5 April 2013
// ******************************************************** // Set up NVPMAPI #define NVPM_INITGUID #include "NvPmApi.Manager.h" // Simple singleton implementation for grabbing the NvPmApi static NvPmApiManager S_NVPMManager; extern NvPmApiManager *GetNvPmApiManager() {return &S_NVPMManager;} const NvPmApi *GetNvPmApi() {return S_NVPMManager.Api();}
This code sets up the PerfAPI manager which, once initialized, gives you access to the functions provided in the API. Next, you need to add the following code to a place in your application that will be called one time (since you want the PerfAPI only initialized once):
if(GetNvPmApiManager()->Construct(PATH_TO_NVPMAPI_CORE) != S_OK) { return false; // This is an error condition } NVPMRESULT nvResult; if((nvResult = GetNvPmApi()->Init()) != NVPM_OK) { return false; // This is an error condition }
This block will initialize the PerfAPI. The value PATH_TO_NVPMAPI_CORE should be set to the location where NvPmApi.Core.dll is located on your system. The PerfKit dlls are in the bin subdirectory where you unzipped the PerfKit files. Make sure to use the path appropriate for your application (win7_x86 for 32 bit, win7_x64 for 64 bit).
The next step is to tell the PerfAPI about your device or context. To do this, you simply call:
PerfKit
DA-01800-001_v04 6 April 2013
NVPMContext hNVPMContext(0); if((nvResult = GetNvPmApi()->CreateContextFromD3D9Device(pd3dDevice, &hNVPMContext)) != NVPM_OK) { return false; // This is an error condition }
This will create an NVPMContext from the device you are using. There are similar calls for CreateContextFromD3D10Device, CreateContextFromD3D11Device and CreateContextFromOGLContext
The typical application that wants to sample GPU and driver counters requires just a few source code changes. To add a counter, simply call:
GetNvPmApi()->AddCounterByName(hNVPMContext, “gpu_idle”);
Substitute the counter of interest for “gpu_idle” in this example. Finally, once per frame, call:
GetNvPmApi()->Sample(hNVPMContext, NULL, &nCount);
to sample the currently active counter(s) and
GetNvPmApi()->GetCounterValueByName(hNVPMContext, “gpu_idle”, 0, &value, &cycle);
to retrieve the resulting counter value. Any number of driver counters can be enabled concurrently and will be updated every frame. GPU counters, however, are a more limited resource, and can only sample a certain number of counters per frame. The counter values can always be queried, but they will be refreshed in a round robin fashion as they are sampled.
Simplified Experiments (SimExp)
One of more powerful features provided by PerfKit is the ability to run directed experiments on the individual units of the GPU and gather performance characteristics, called Simplified Experiments. For 8 locations in the GPU pipeline, SimExp provides a “Speed of Light” (SOL) and a “Bottleneck” value. The speed of light of a unit can be thought of as a utilization measurement. The “value” returned percentage of time, during the experiment, the unit was active, and the “cycle” returned gives the amount of time the experiment took to run. Similarly, when running a Bottleneck experiment, the value represents the percentage of time this unit was a bottleneck and the cycles is the experiment duration.
Finally, there is an additional counter that will run all of the experiments needed to determine what unit in the GPU is the bottleneck. It runs all of the speed of
PerfKit
DA-01800-001_v04 7 April 2013
light and bottleneck experiments, passes the results through an expert system, and returns an ordinal value for the unit that is the bottleneck. You can translate that into a string name using
GetNvPmApi()->GetGPUBottleneckName(hNVPMContext, value, name).
Since the Simplified Experiments require collecting data from multiple counters in the GPU, they require multiple passes across the same scene data (as if the game and all animations were paused) to complete the experiment. From a paused frame in the application, this is accomplished using the BeginExperiment(…)/EndExperiment(…) mechanism, detailed below. As always, you still setup PerfAPI and enable the counter of interest using
GetNvPmApi()->AddCounterByName(hNVPMContext, ”GPU Bottleneck”)

PerfKit
DA-01800-001_v04 8 April 2013
Then, inside of your drawing loop, you would do the following:
GetNvPmApi()->BeginExperiment(hNVPMContext, &nCount); for(i = 0; i < nCount; i++) { GetNvPmApi()->BeginPass(g_hNVPMContext, i); // For each draw call GetNvPmApi()->BeginObject(n); // Draw FlushGPU(); GetNVPmApi()->EndObject(n); // … all of the draw calls and Present/Swap GetNvPmApi()->EndPass(i); } GetNvPmApi()->EndExperiment();
The FlushGPU() call is a call to make sure that the current draw call has completed. In Direct3D you can use event queries and in OpenGL you can use glFinish().
Once this is completed, you can query
GetNvPmApi()->GetCounterValueByName(hNVPMContext, “GPU Bottleneck”, 0, &value, &cycles)
to determine which unit is the bottleneck. Because all of the underlying speed of light experiments and bottleneck experiments are run in order to determine this value, you can also query those values when the experiment is over. You can determine the names of those individual counters by enumerating them using this call:
GetNvPmApi()->EnumCountersByContext(hContext, EnumFunc)
PerfKit
DA-01800-001_v04 9 April 2013
Appendix A. Frequently Asked Questions
What does this error message mean, “HW necessary for GPU counters is unavailable, HW counters are disabled.”
Not all GPUs have the features necessary to provide the GPU counter data. PerfKit signals are available on all NVIDIA GPUs listed under System Requirements. PerfKit signals may or may not be available on other GPUs.
I don’t seem to be getting good data from the PerfKit when running my OpenGL application with more than 1 NVIDIA GPU installed
This is a known issue with this release. Currently the OpenGL implementation only supports a single GPU system. This will be fixed in a future release.
I have discovered a problem that is not listed above. Who should I call?
We want to make sure PerKit is a useful tool for developers analyzing their applications. Please let us know if you encounter any problems or think of additional features that would be helpful while using PerfKit.
Contact us at: [email protected]
DA-01800-001_v04 10 June 2012
Appendix B. Counters Reference
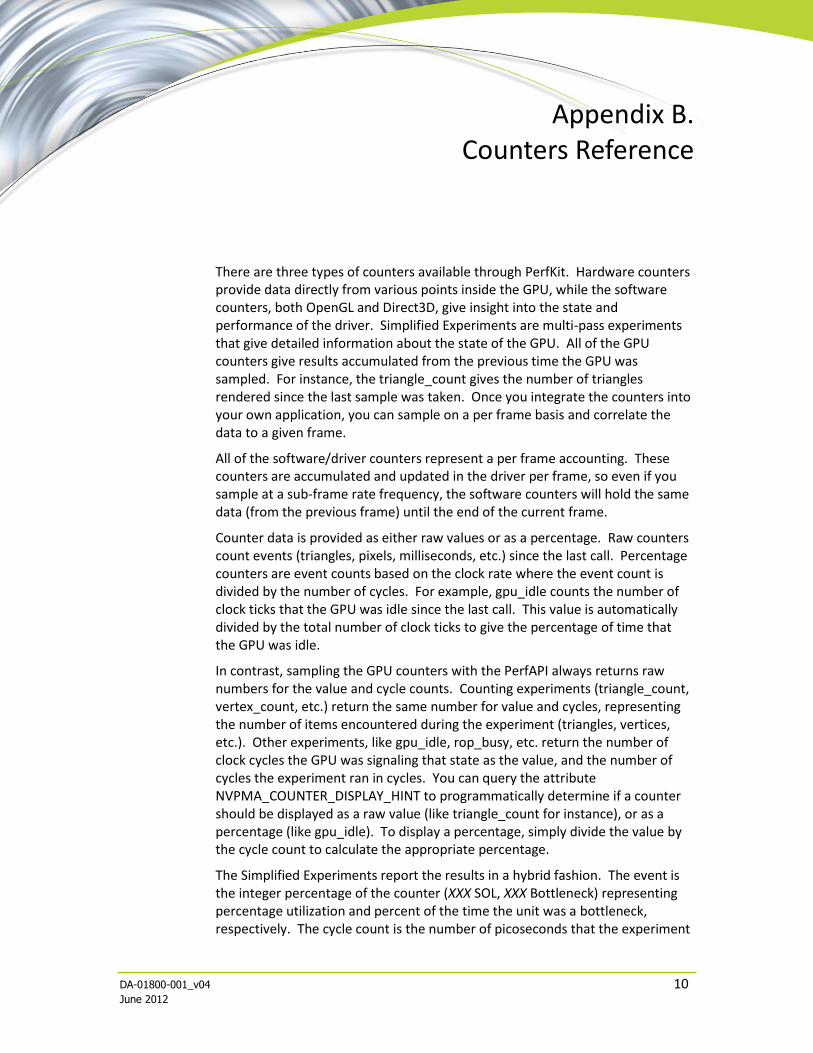
There are three types of counters available through PerfKit. Hardware counters provide data directly from various points inside the GPU, while the software counters, both OpenGL and Direct3D, give insight into the state and performance of the driver. Simplified Experiments are multi-pass experiments that give detailed information about the state of the GPU. All of the GPU counters give results accumulated from the previous time the GPU was sampled. For instance, the triangle_count gives the number of triangles rendered since the last sample was taken. Once you integrate the counters into your own application, you can sample on a per frame basis and correlate the data to a given frame.
All of the software/driver counters represent a per frame accounting. These counters are accumulated and updated in the driver per frame, so even if you sample at a sub-frame rate frequency, the software counters will hold the same data (from the previous frame) until the end of the current frame.
Counter data is provided as either raw values or as a percentage. Raw counters count events (triangles, pixels, milliseconds, etc.) since the last call. Percentage counters are event counts based on the clock rate where the event count is divided by the number of cycles. For example, gpu_idle counts the number of clock ticks that the GPU was idle since the last call. This value is automatically divided by the total number of clock ticks to give the percentage of time that the GPU was idle.
In contrast, sampling the GPU counters with the PerfAPI always returns raw numbers for the value and cycle counts. Counting experiments (triangle_count, vertex_count, etc.) return the same number for value and cycles, representing the number of items encountered during the experiment (triangles, vertices, etc.). Other experiments, like gpu_idle, rop_busy, etc. return the number of clock cycles the GPU was signaling that state as the value, and the number of cycles the experiment ran in cycles. You can query the attribute NVPMA_COUNTER_DISPLAY_HINT to programmatically determine if a counter should be displayed as a raw value (like triangle_count for instance), or as a percentage (like gpu_idle). To display a percentage, simply divide the value by the cycle count to calculate the appropriate percentage.
The Simplified Experiments report the results in a hybrid fashion. The event is the integer percentage of the counter (XXX SOL, XXX Bottleneck) representing percentage utilization and percent of the time the unit was a bottleneck, respectively. The cycle count is the number of picoseconds that the experiment
PerfKit
DA-01800-001_v04 11 April 2013
was run. Finally, the result of GPU Bottleneck is an integer in the event count that is the unit that is determined to be the system bottleneck.
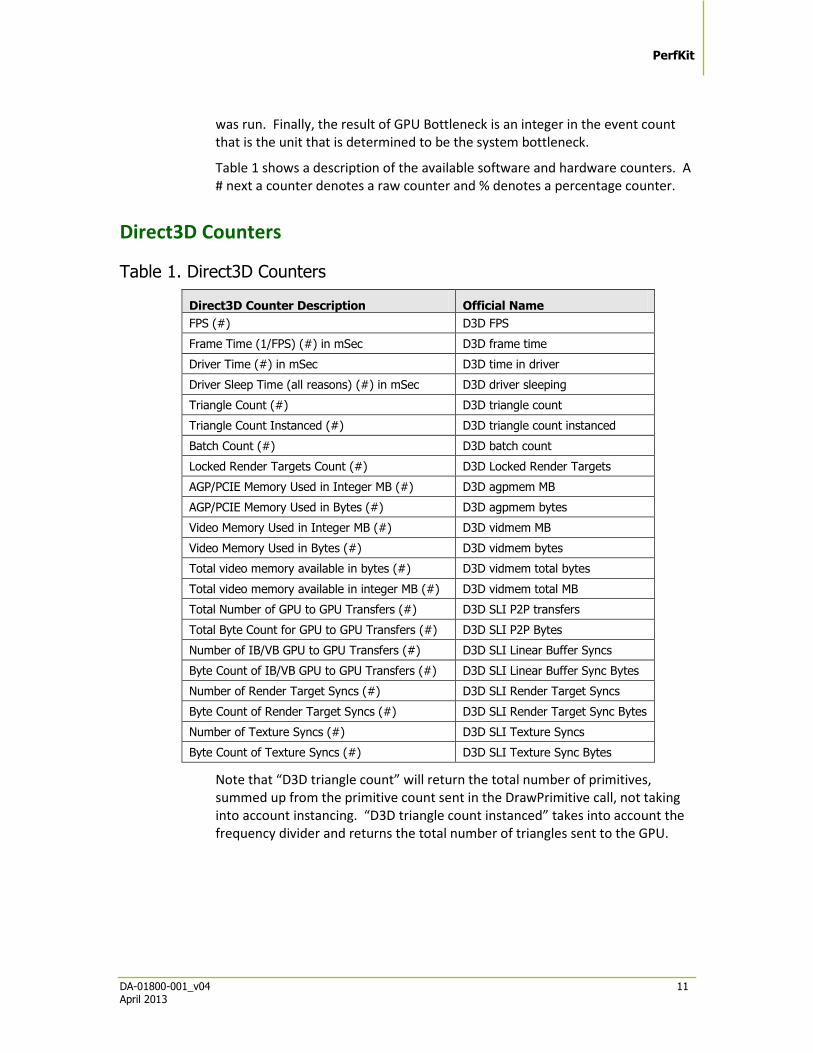
Table 1 shows a description of the available software and hardware counters. A # next a counter denotes a raw counter and % denotes a percentage counter.
Direct3D Counters
Table 1. Direct3D Counters
Direct3D Counter Description Official Name
FPS (#) D3D FPS
Frame Time (1/FPS) (#) in mSec D3D frame time
Driver Time (#) in mSec D3D time in driver
Driver Sleep Time (all reasons) (#) in mSec D3D driver sleeping
Triangle Count (#) D3D triangle count
Triangle Count Instanced (#) D3D triangle count instanced
Batch Count (#) D3D batch count
Locked Render Targets Count (#) D3D Locked Render Targets
AGP/PCIE Memory Used in Integer MB (#) D3D agpmem MB
AGP/PCIE Memory Used in Bytes (#) D3D agpmem bytes
Video Memory Used in Integer MB (#) D3D vidmem MB
Video Memory Used in Bytes (#) D3D vidmem bytes
Total video memory available in bytes (#) D3D vidmem total bytes
Total video memory available in integer MB (#) D3D vidmem total MB
Total Number of GPU to GPU Transfers (#) D3D SLI P2P transfers
Total Byte Count for GPU to GPU Transfers (#) D3D SLI P2P Bytes
Number of IB/VB GPU to GPU Transfers (#) D3D SLI Linear Buffer Syncs
Byte Count of IB/VB GPU to GPU Transfers (#) D3D SLI Linear Buffer Sync Bytes
Number of Render Target Syncs (#) D3D SLI Render Target Syncs
Byte Count of Render Target Syncs (#) D3D SLI Render Target Sync Bytes
Number of Texture Syncs (#) D3D SLI Texture Syncs
Byte Count of Texture Syncs (#) D3D SLI Texture Sync Bytes
Note that “D3D triangle count” will return the total number of primitives, summed up from the primitive count sent in the DrawPrimitive call, not taking into account instancing. “D3D triangle count instanced” takes into account the frequency divider and returns the total number of triangles sent to the GPU.

PerfKit
DA-01800-001_v04 12 April 2013
OpenGL Counters
Table 2. OpenGL Counters
OpenGL Counter Description Official Name
FPS (#) OGL FPS
Frame Time (1/FPS) (#) in mSec OGL frame time
Driver Sleep Time (waits for GPU) (#) in mSec OGL driver sleeping
% of the Frame Time driver is waiting (%) OGL % driver waiting
AGP/PCIE Memory Used in Integer MB (#) OGL AGP/PCI-E usage (MB)
AGP/PCIE Memory Used in bytes (#) OGL AGP/PCI-E usage (bytes)
Video Memory Used in Integer MB (#) OGL vidmem usage (MB)
Video Memory Used in bytes (#) OGL vidmem usage (bytes)
Total amount of video memory in bytes OGL vidmem total bytes
Total amount of video memory in integer MB OGL vidmem total MB
Number of batches in the frame OGL Frame Batch Count
Number of vertices in the frame OGL Frame Vertex Count
Number of primitives in the frame OGL Frame Primitive Count

PerfKit
DA-01800-001_v04 13 April 2013
GPU Counters – GeForce 8, 9, and 2XX
The following diagram shows the various parts of the GeForce 8, 9, and 2XX series GPUs and what signals correspond to each hardware unit.
PerfKit
DA-01800-001_v04 14 April 2013
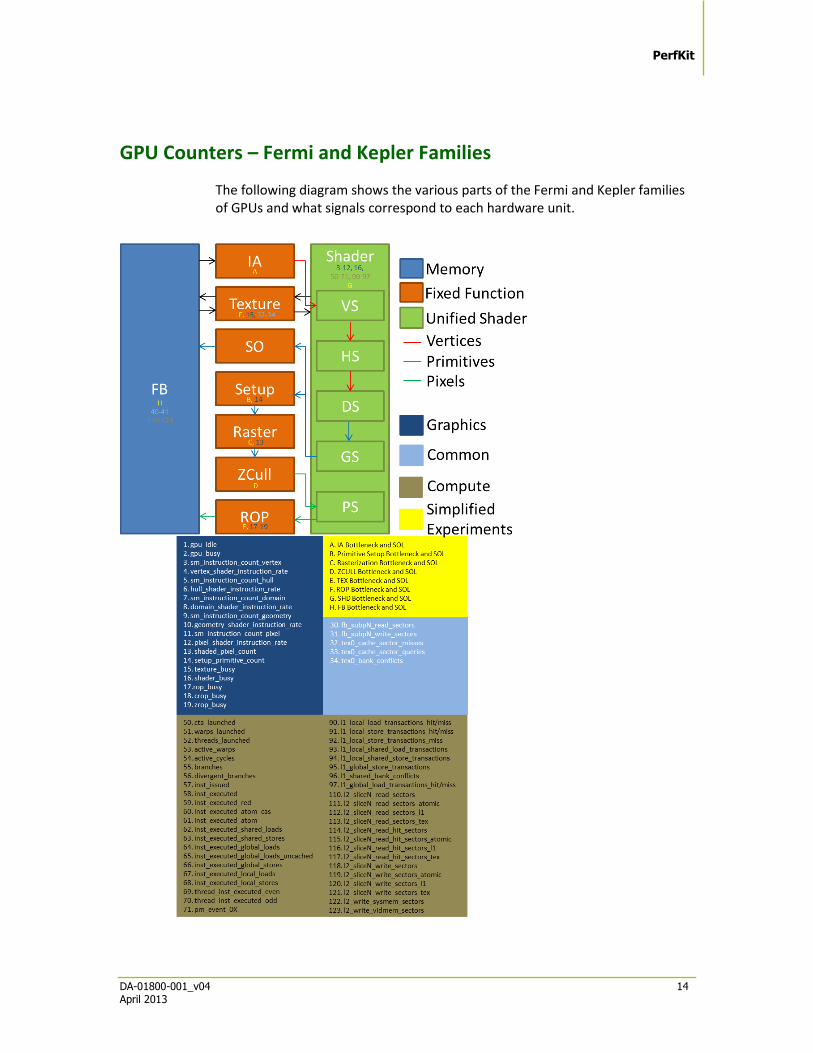
GPU Counters – Fermi and Kepler Families
The following diagram shows the various parts of the Fermi and Kepler families of GPUs and what signals correspond to each hardware unit.

PerfKit
DA-01800-001_v04 15 April 2013
GPU Graphics Counter Definitions
Many of these experiments are collected per SM and are appended by “_vsmN”, with stands for “virtual SM”. The SMs are treated as discreet units in spite of possible topology groupings as it makes addressing them easier for the user. Also note that the Kepler SM counters also have a “_qM” field which allows selection of which quadrant of the SM to collect the data from. Some of the memory counters have “_fbN” appended to them in order to collect the data from a given frame buffer unit. Finally, there are other counters that specify which frame buffer slice (“sliceX”) or texture unit (texX) to sample from, which are sub units of the frame buffer and TPC respectively. To determine the exact count of these units you can enumerate the counters and determine the bounds.
Table 3. Graphics Counters
Signal Name Definition GeForce 8/9/2XX
Fermi Kepler
gpu_idle / gpu_busy The % of time the GPU is idle/busy since the last call. Having the GPU idle at all is a waste of valuable resources. You want to balance the GPU and CPU workloads so that no one processor is starved for work. Time management or using multithreading in your application can help balance CPU based tasks (world management, etc.) with the rendering pipeline.
Y Y Y
input_assembler_busy The % of time the input assembler unit is busy. This is mainly impacted by both the number of vertices processed as well as the size of the attributes on those vertices. You can optimize this by reducing vertex size as much as possible and using indexed primitives to take advantage of the vertex cache.
Y N N
input_assembler_waits_for_fb This is the amount of time the input assembler unit was waiting for data from the frame buffer unit.
Y N N

PerfKit
DA-01800-001_v04 16 April 2013
vertex_attribute_count The number of vertex attributes that are fetched and passed to the geometry unit is returned in this counter. A large the number of attributes (or unaligned vertices) can hurt vertex cache performance and reduce the overall vertex processing capabilities of the pipeline.
Y N N
geom_busy This measures the traffic from the unit that distributes vertex and geometry work to the shader units for transforming the vertices. Draw calls with large numbers of primitives (or many draw calls with small numbers of primitives) can potentially cause this unit to become a bottleneck.
Y N N
geom_waits_for_shader The amount of time the geom unit spent waiting for the shader unit to be ready to accept work.
Y N N
geom_vertex_in_count The number of vertices input to the geom unit
Y N N
geom_primitive_in_count The number of primitives input to the geom unit
Y N N
vertex_shader_busy This is the % of time that shader unit 0 was busy scaled by the ratio of vertex shader instructions to all shader type instructions (or vertex_shader_instruction_rate). If this value is high but, for instance, pixel_shader_busy is low, it is an indication that you may be vertex/geometry bound. This can be from geometry that is too detailed or even from vertex programs that are overly complex and need to be simplified. In addition, taking advantage of the post T&L cache (by reducing vertex size and using indexed primitives)
Y N N

PerfKit
DA-01800-001_v04 17 April 2013
can prevent processing the same vertices multiple times.
vertex_shader_instruction_rate The % of all shader instructions seen on the first SM unit that were executing vertex shaders
Y Y Y
sm_instruction_count_vertex_vsmN The number of vertex shader instructions executed on the given SM
N Y Y
hull_shader_instruction_rate The % of all shader instructions seen on the first SM unit that were executing hull shaders
N Y Y
sm_instruction_count_hull_vsmN The number of hull shader instructions executed on the given SM
N Y Y
domain_shader_instruction_rate The % of all shader instructions seen on the first SM unit that were executing domain shaders
N Y Y
sm_instruction_count_domain_vsmN The number of domain shader instructions executed on the given SM
N Y Y
geometry_shader_busy This is the % of time that shader unit 0 was busy scaled by the ratio of geometry shader instructions to all shader type instructions (or geometry_shader_instruction_rate).
Y N N
geometry_shader_instruction_rate The % of all shader instructions seen on the first SM unit that were executing geometry shaders
Y Y Y
sm_instruction_count_geometry_vsmN The number of geometry shader instructions executed on the given SM
N Y Y
geom_vertex_out_count The number of vertices coming out of the geom unit after any geometry shader expansion
Y N N
geom_primitive_out_count The number of primitives coming out of the geom unit after any
Y N N
PerfKit
DA-01800-001_v04 18 April 2013
geometry shader expansion
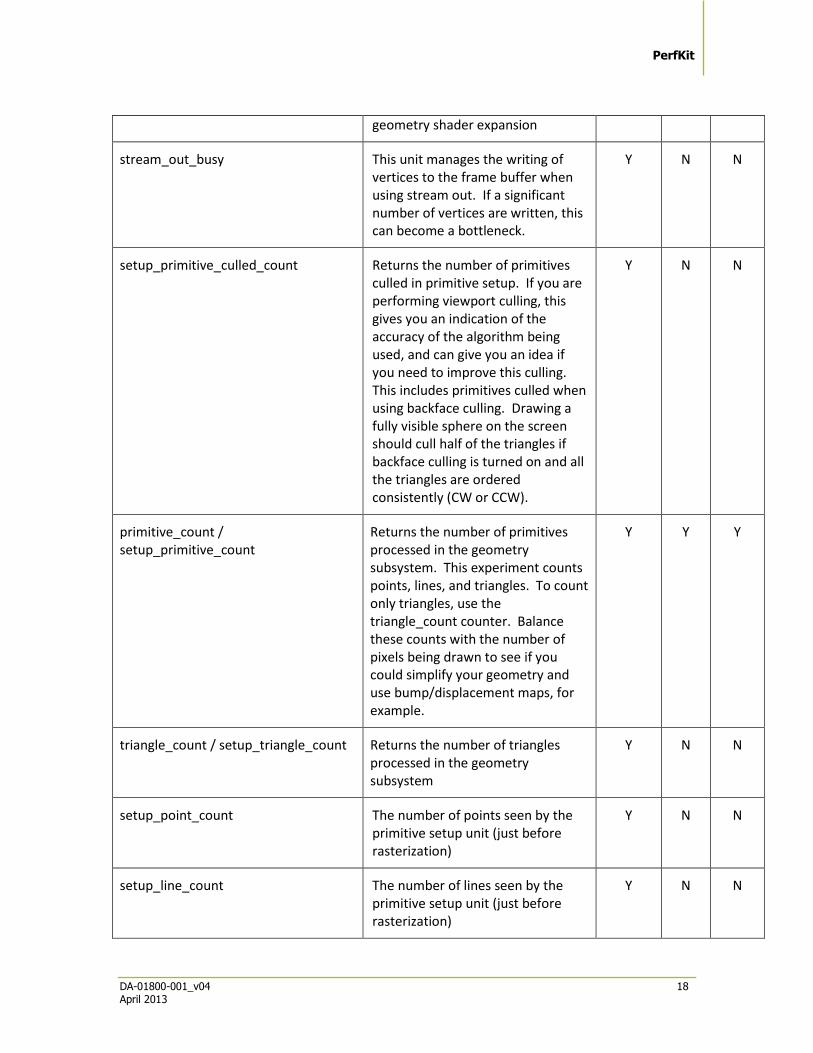
stream_out_busy This unit manages the writing of vertices to the frame buffer when using stream out. If a significant number of vertices are written, this can become a bottleneck.
Y N N
setup_primitive_culled_count Returns the number of primitives culled in primitive setup. If you are performing viewport culling, this gives you an indication of the accuracy of the algorithm being used, and can give you an idea if you need to improve this culling. This includes primitives culled when using backface culling. Drawing a fully visible sphere on the screen should cull half of the triangles if backface culling is turned on and all the triangles are ordered consistently (CW or CCW).
Y N N
primitive_count / setup_primitive_count
Returns the number of primitives processed in the geometry subsystem. This experiment counts points, lines, and triangles. To count only triangles, use the triangle_count counter. Balance these counts with the number of pixels being drawn to see if you could simplify your geometry and use bump/displacement maps, for example.
Y Y Y
triangle_count / setup_triangle_count Returns the number of triangles processed in the geometry subsystem
Y N N
setup_point_count The number of points seen by the primitive setup unit (just before rasterization)
Y N N
setup_line_count The number of lines seen by the primitive setup unit (just before rasterization)
Y N N

PerfKit
DA-01800-001_v04 19 April 2013
shaded_pixel_count Counts the number of pixels generated by the rasterizer and sent to the pixel shader units.
Y Y Y
rasterizer_pixels_killed_zcull_count The number of pixels killed by the zcull unit in the rasterizer
Y N N
pixel_shader_busy This is the % of time that shader unit 0 was busy scaled by the ratio of pixel shader instructions to all shader type instructions (or pixel_shader_instruction_rate). This can give you an indication of if you are pixel bound, which can happen in high resolution settings or when pixel programs are very complex.
Y N N
pixel_shader_instruction_rate The % of all shader instructions seen on the first SM unit that were executing pixel shaders
Y Y Y
sm_instruction_count_pixel_vsmN The number of pixel shader instructions executed on the given SM
N Y Y
shader_busy This measures the how active the unified shader unit is running any type of shader. If you couple this information with the various shader_instruction_rate values you can get an idea for the workload the shader unit has and which shader types to tune if the shader unit becomes a bottleneck.
Y Y Y
shader_waits_for_texture This is the amount of time that the pixel shader unit was stalled waiting for a texture fetch. Texture stalls usually happen if textures don’t have mipmaps, if a high level of anisotropic filtering is used, or if there is poor coherency in accessing textures.
Y N N

PerfKit
DA-01800-001_v04 20 April 2013
shader_waits_for_geom This is the amount of time the shader unit spent waiting for the geom unit to send work.
Y N N
shader_waits_for_rop This is the % of time that the pixel shader is stalled by the raster operations unit (ROP), waiting to blend a pixel and write it to the frame buffer. If the application is performing a lot of alpha blending, or even if the application has a lot of overdraw (the same pixel being written multiple times, unblended) this can be a performance bottleneck.
Y N N
texture_busy This is a measurement of how busy the texture unit is. This covers both time spent sampling values from the frame buffer (through the texture cache) and the time spent computing any filtering that is enabled (like bilinear or anisotropic). Reducing both the number of taps and the filtering level will help to reduce any bottleneck in the texture unit.
Y Y Y
texture_waits_for_fb This is the amount of time the texture unit spent waiting on samples to return from the frame buffer unit. It is a potential indication of poor texture cache utilization.
Y N N
texture_waits_for_shader This is the amount of time the texture unit spent waiting to send results to the shader unit. If the queue between those units gets too full (because the shader unit isn’t ready to receive those values), this can become a bottleneck.
Y N N
texture_sample_base_level_rate The percentage of texture samples which read from the base texture level. This can be useful to
Y N N

PerfKit
DA-01800-001_v04 21 April 2013
determine if your base texture level is too large and can be reduced to the next mipmap level.
texture_sample_average_level The average LOD sourced across all texture reads.
Y N N
rop_busy % of time that the ROP unit is actively doing work. This can be high if alpha blending is turned on, of overdraw is high, etc.
Y Y Y
rop_waits_for_fb The amount of time the blending unit spent waiting for data from the frame buffer unit. If blending is enabled and there is a lot of traffic here (since this is a read/modify/write operation) this can become a bottleneck.
Y N N
rop_waits_for_shader This is a measurement of how often the blending unit was waiting on new work (fragments to be placed into the render target). If the pixel shaders are particularly expensive, the ROP unit could be starved waiting for results.
Y N N
rop_pixels_killed_earlyz_count This returns the number of pixels that were killed in the earlyZ hardware. This signal will give you an idea of, for instance, a Z only pass was successful in setting up the depth buffer.
Y N N
rop_pixels_killed_latez_count This returns the number of pixels that were killed after the pixel shader ran. This can happen if the early Z is unable cull the pixel because of an API setup issue like changing the Z direction or modifying Z in the pixel shader.
Y N N
fb_subpN_read_sectors_fbN The number of sectors read from the given sub partition on the specified frame buffer unit
N Y Y

PerfKit
DA-01800-001_v04 22 April 2013
fb_subpN_write_sectors_fbN The number of sectors written to the given sub partition on the specified frame buffer unit
N Y Y
tex0_cache_sector_misses_fbN The number of texture cache misses from unit X for the specified GPC and TPC
N Y Y
tex0_cache_sector_queries_fbN The number of texture cache queries from unit X for the specified GPC and TPC
N Y Y
tex0_bank_conflicts_fbN The number of texture cache conflicts from unit X for the specified GPC and TPC
N Y Y

PerfKit
DA-01800-001_v04 23 April 2013
GPU Compute Counter Definitions
This is the table of counters available for compute programs (DirectCompute). These are only available on the Fermi and Kepler families of chips. See the note on the graphics counters for information on the unit specifiers.
Table 4. Compute Counters
Signal Name Definition Fermi Kepler
fb_subpM_read_sectors_fbN The number of 32 byte sectors read from the given sub partition on the specified frame buffer unit
Y Y
fb_subpM_write_sectors_fbN The number of 32 byte sectors written to the given sub partition on the specified frame buffer unit
Y Y
texX_cache_sector_misses_gpcN_tpcM The number of texture 32 byte cache misses from unit X for the specified GPC and TPC
Y Y
texX_cache_sector_queries_gpcN_tpcM The number of texture 32 byte cache queries from unit X for the specified GPC and TPC
Y Y
texX_bank_conflicts_gpcN_tpcM The number of texture cache conflicts from unit X for the specified GPC and TPC
Y Y
cta_launched_vsmN The number of CTAs launched by this SM
Y Y
warps_launched_vsmN / warps_launched_qM_vsmN
The number of warps launched on this SM (or the quadrant of the SM on Kepler).
Y Y
threads_launched_vsmN / threads_launched_qM_vsmN
The number of threads launched on this SM (or the quadrant of the SM on Kepler).
Y Y
active_warps_vsmN / active_warps_qM_vsmN This counter increments by 0-48 each cycle for the number of warps that are currently active on the SM (or by increments of 0-16
Y Y

PerfKit
DA-01800-001_v04 24 April 2013
for a quadrant of an SM on Kepler).
active_cycles_vsmN / active_cycles_qM_vsmN The number of cycles the SM (or the quadrant of the SM on Kepler) had at least one active warp.
Y Y
branches_vsmN / branches_qM_vsmN The number of branches instructions executed by threads running on this SM (or the quadrant of the SM on Kepler)
Y Y
divergent_branches_vsmN / divergent_branches_qM_vsmN
The number of divergent branches (conditional evaluated differently across the warp) taken by threads running on this SM (or the quadrant of the SM on Kepler)
Y Y
inst_issued_vsmN / inst_issued_qM_vsmN The number of instructions issued, including replays, on this SM (or this quadrant of the SM on Kepler).
Y Y
inst_executed_vsmN / inst_executed_qM_vsmN
The number of instructions executed, not including replays, on this SM (or this quadrant of the SM on Kepler)
Y Y
inst_executed_red_vsmN The number of reduction instructions (RED) executed by this SM
Y N
inst_executed_atom_cas_vsmN / inst_executed_atom_cas_qM_vsmN
The number of atomic compare-and-swap insreuctions (CAS) executed on this SM (or this quadrant of the SM on Kepler)
Y Y
inst_executed_atom_vsmN /
inst_executed_atom_qM_vsmN
The number of atomic instructions, including compare-and-swap instructions (CAS) executed on this SM (or this quadrant of the SM on Kepler)
Y Y
inst_executed_shared_loads_vsmN The number of load instructions from shared memory executed on this SM
Y Y

PerfKit
DA-01800-001_v04 25 April 2013
inst_executed_shared_stores_vsmN The number of store instructions to shared memory executed on this SM
Y Y
inst_executed_global_loads_vsmN The number of load instructions from global memory executed on this SM
Y N
inst_executed_global_loads_uncached_vsmN The number of uncached load instructions from global memory executed on this SM
Y N
inst_executed_global_stores_vsmN The number of store instructions to global memory executed on this SM
Y N
inst_executed_local_loads_vsmN The number of load instructions from local memory executed on this SM
Y N
inst_executed_local_stores_vsmN The number of store instructions to local memory executed on this SM
Y N
inst_executed_generic_loads_vsmN The number of generic load instructions to global, local, or shared memory executed on this SM.
N Y
inst_executed_generic_loads_uncached_vsmN The number of uncached generic load instructions to global, local, or shared memory executed on this SM
N Y
inst_executed_generic_stores_vsmN The number of generic store instructions to global, local, or shared memory executed on this SM
N Y
thread_inst_executed_even_vsmN The number of instructions executed on this pipeline of the SM. Incremented by the number of active threads executing the instruction.
Y N
thread_inst_executed_odd_vsmN The number of instructions executed on this pipeline of the
Y N
PerfKit
DA-01800-001_v04 26 April 2013
SM. Incremented by the number of active threads executing the instruction.
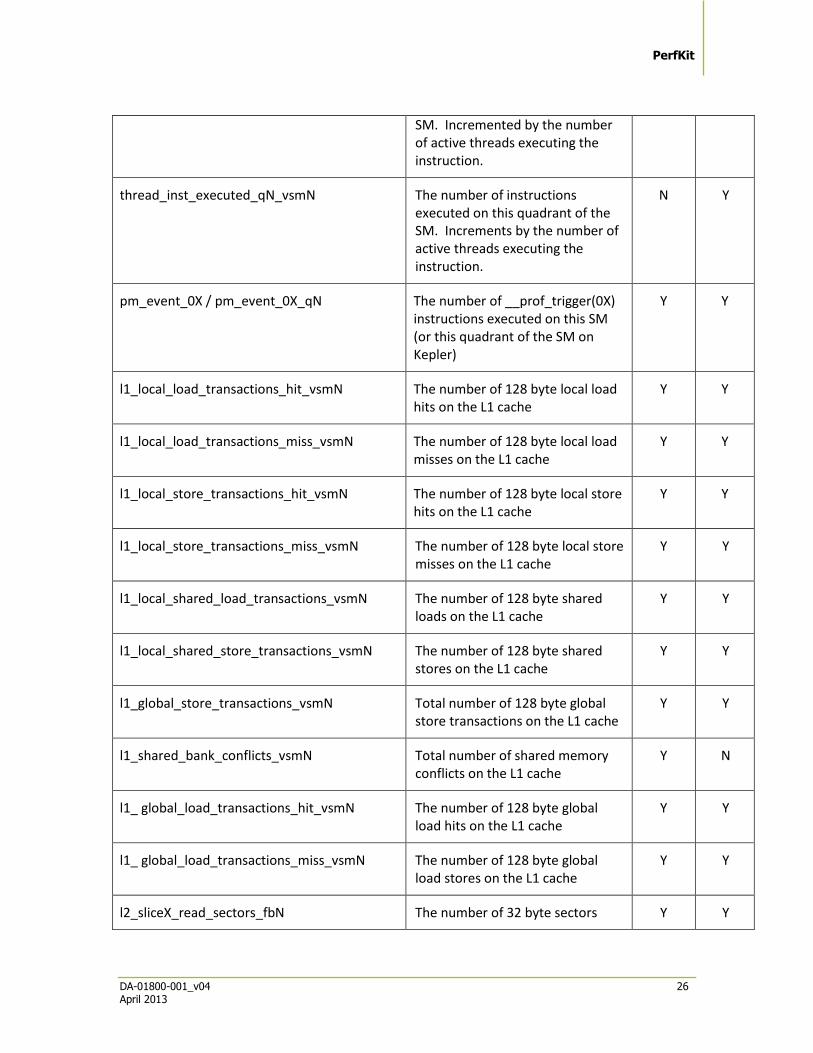
thread_inst_executed_qN_vsmN The number of instructions executed on this quadrant of the SM. Increments by the number of active threads executing the instruction.
N Y
pm_event_0X / pm_event_0X_qN The number of __prof_trigger(0X) instructions executed on this SM (or this quadrant of the SM on Kepler)
Y Y
l1_local_load_transactions_hit_vsmN The number of 128 byte local load hits on the L1 cache
Y Y
l1_local_load_transactions_miss_vsmN The number of 128 byte local load misses on the L1 cache
Y Y
l1_local_store_transactions_hit_vsmN The number of 128 byte local store hits on the L1 cache
Y Y
l1_local_store_transactions_miss_vsmN The number of 128 byte local store misses on the L1 cache
Y Y
l1_local_shared_load_transactions_vsmN The number of 128 byte shared loads on the L1 cache
Y Y
l1_local_shared_store_transactions_vsmN The number of 128 byte shared stores on the L1 cache
Y Y
l1_global_store_transactions_vsmN Total number of 128 byte global store transactions on the L1 cache
Y Y
l1_shared_bank_conflicts_vsmN Total number of shared memory conflicts on the L1 cache
Y N
l1_ global_load_transactions_hit_vsmN The number of 128 byte global load hits on the L1 cache
Y Y
l1_ global_load_transactions_miss_vsmN The number of 128 byte global load stores on the L1 cache
Y Y
l2_sliceX_read_sectors_fbN The number of 32 byte sectors Y Y

PerfKit
DA-01800-001_v04 27 April 2013
read from the given L2 cache
l2_sliceX_read_sectors_atomic_fbN The number of 32 byte sectors read for atomic operations from the given L2 cache
Y Y
l2_sliceX_read_sectors_l1_fbN The number of 32 byte sectors read by an L1 cache from the given L2 cache
Y Y
l2_sliceX_read_sectors_tex_fbN The number of 32 byte sectors read by a texture unit from the given L2 cache
Y Y
l2_sliceX_read_ sysmem_sectors_fbN The number of 32 byte sectors read when accessing system memory from the given L2 cache
Y Y
l2_sliceX_read_ vidmem_sectors_fbN The number of 32 byte sectors read when accessing video memory from the given L2 cache
Y Y
l2_sliceX_read_hit_sectors_fbN The number of 32 byte sector reads that hit from the given L2 cache
Y Y
l2_sliceX_read_hit_sectors_atomic_fbN The number of 32 byte sector reads that hit for atomic operations from the given L2 cache
Y Y
l2_sliceX_read_hit_sectors_l1_fbN The number of 32 byte sector reads that hit by an L1 cache from the given L2 cache
Y Y
l2_sliceX_read_hit_sectors_tex_fbN The number of 32 byte sector reads that hit by a texture unit from the given L2 cache
Y Y
l2_sliceX_read_hit_sysmem_sectors_fbN The number of 32 byte sector reads that hit when accessing system memory from the given L2 cache
Y Y
l2_sliceX_read_hit_vidmem_sectors_fbN The number of 32 byte sectors read when accessing video memory from the given L2 cache
Y Y
PerfKit
DA-01800-001_v04 28 April 2013
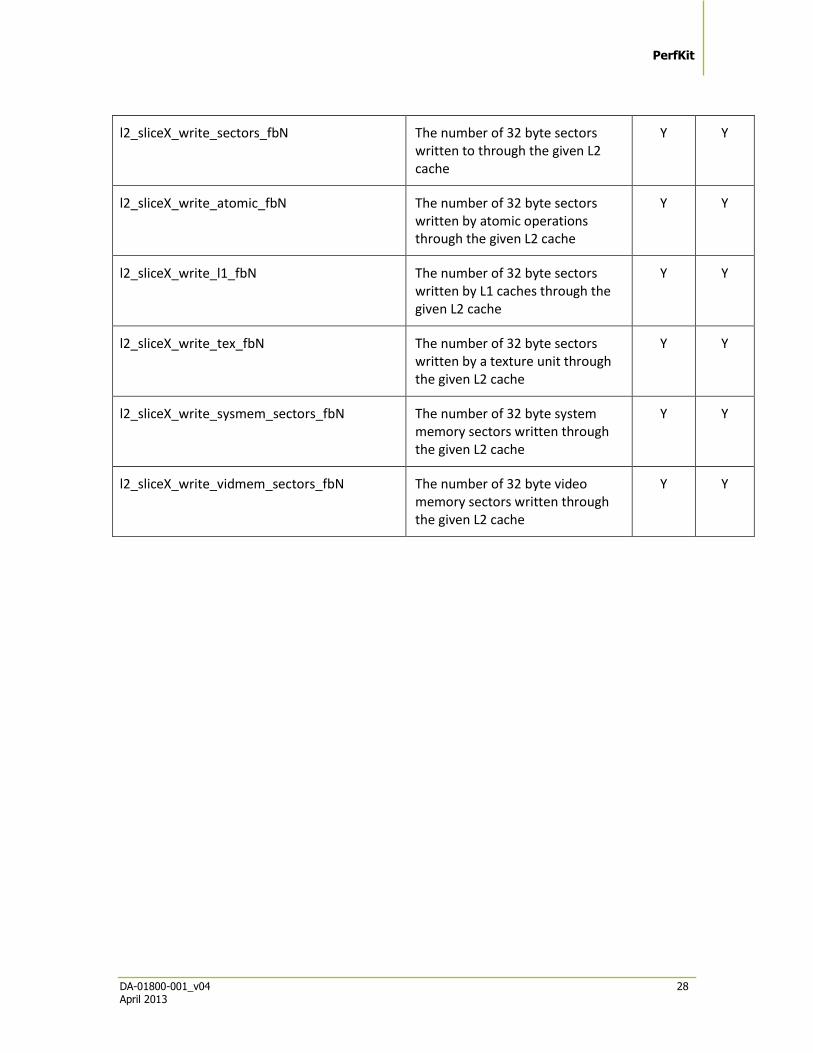
l2_sliceX_write_sectors_fbN The number of 32 byte sectors written to through the given L2 cache
Y Y
l2_sliceX_write_atomic_fbN The number of 32 byte sectors written by atomic operations through the given L2 cache
Y Y
l2_sliceX_write_l1_fbN The number of 32 byte sectors written by L1 caches through the given L2 cache
Y Y
l2_sliceX_write_tex_fbN The number of 32 byte sectors written by a texture unit through the given L2 cache
Y Y
l2_sliceX_write_sysmem_sectors_fbN The number of 32 byte system memory sectors written through the given L2 cache
Y Y
l2_sliceX_write_vidmem_sectors_fbN The number of 32 byte video memory sectors written through the given L2 cache
Y Y

PerfKit
DA-01800-001_v04 29 April 2013
Simplified Experiments (SimExp)
Table 5 lists the Simplified Experiments. Each unit has 2 experiments that can be run, the Bottleneck and the SOL experiment. For a Bottleneck experiment, the value represents the percentage of time that the unit was a bottleneck and the cycles returned is the amount of time, in CPU clock cycles, that the experiment was run. A bottleneck is basically defined as the amount of time the given unit prevented units downstream from doing work minus the amount of time the unit upstream prevented this unit from doing any work. You typically want these numbers to be low and note that a unit doesn’t have to be a bottleneck 100% of the time (or even 50%) to be a candidate for optimization. Any amount of time that a unit prevents work from flowing translates directly to overall draw call time and will contribute to frame time depending on the surrounding workloads.
For the SOL experiment, the value is a percentage measurement of how much work the unit did, versus how much could have been done, for the duration of the experiment, and the cycles is again the number of cycles the experiment ran. You typically want this to be as high as possible and it give you an idea of how much head room you might have in the GPU. For instance, if you are seeing a high shader bottleneck with a low texture bottleneck and utilization/SOL, you might consider taking some calculations and prebaking them into a texture to be sampled instead.
Note that the NVIDIA Nsight™ Visual Studio Edition, the SOL experiment results are displayed as “Utilization”.
Table 5. Simplified Experiments
SimExp Name Definition GeForce 8/9/2XX
Fermi Kepler
IDX Bottleneck & SOL
IDX is the unit on early GPUs that handles vertex attribute assembly.
Y N N
IA Bottleneck & SOL IA is the unit on Fermi and Kepler GPUs that handles vertex attribute assembly.
N Y Y
GEOM Bottleneck & SOL
GEOM is the unit on early GPUs that handles scheduling vertex and geometry work to the shader units.
Y N N
Primitive Setup Bottleneck & SOL
Primitive setup happens right before rasterization and handles jobs like edge equation
Y Y Y

PerfKit
DA-01800-001_v04 30 April 2013
calculations.
SHD Bottleneck & SOL
SHD is the unified shader unit and handles processing of all shader types on various inputs.
Y Y Y
ZCULL Bottleneck & SOL
ZCull happens before the fragment shader is run and is able to discard fragments because they won’t pass the z-test.
N Y Y
TEX Bottleneck & SOL
The TEX unit is responsible for reading samples from the frame buffer and calculating the texel value based on the current filtering mode.
Y Y Y
ROP Bottleneck & SOL
ROP is the blending unit and handles both color blending and Z/stencil buffer handling.
Y Y Y
Rasterization Bottleneck & SOL
Rasterization is when the primitives are split up into individual fragments to be shaded.
Y Y Y
FB Bottleneck & SOL The FB or frame buffer unit handles all request for reading memory that missed any possible L1/L2 caches.
Y Y Y

DA-01800-001_v04 31 June 2012
Appendix C. PerfAPI Specification
All functions return NVPM_OK if everything worked out just fine. They can also return NVPM_ERROR_INTERNAL for internal errors. If this happens, please send email to [email protected] with details about the API usage. Please note that all of the NVPM_WARNING_* messages have not been implemented yet, and will be supported in a future release.
Enumerate available counters:
The callback function will continue to be called until all of the counters are enumerated or until anything but NVPM_OK is returned.
typedef NVPMRESULT (*NVPMEnumFunc)(NVPMCounterID unCounterID, char *pcCounterName);
NVPMRESULT EnumCountersByContext(NVPMContext
hContext, NVPMEnumFunc pEnumFunction);
Error return values:
NVPM_ERROR_BAD_ENUMERATOR: A bad/NULL pointer was sent for the enumerator function
NVPM_WARNING_ENDED_EARLY: Enumeration was stopped before the end of the counter list was reached
Get various counter information:
Passing NULL for pcString and a valid pointer for punLen will return the length of the name in punLen. Passing a pointer in pcString and a buffer size in punLen will attempt to write the name (\0 term) to pcString. If the buffer is too small, nothing is written and punLen is set to the string length needed.
NVPMRESULT GetCounterName(NVPMCounterID unCounterID,
char *pcString, NVPMUINT *punLen);
NVPMRESULT GetCounterDescription(NVPMCounterID
unCounterID, char *pcString, NVPMUINT *punLen);

PerfKit
DA-01800-001_v04 32 April 2013
NVPMRESULT GetCounterAttribute(NVPMCounterID
unCounterID, NVPMUINT unAttribute, NVPMUINT
*punValue);
Error return values:
NVPM_ERROR_STRING_TOO_SMALL: pcString is too small based on size passed in punLen
Enable a counter for sampling:
NVPMRESULT AddCounterByName(NVPMContext hContext,
char *pcName);
NVPMRESULT AddCounter(NVPMContext hContext,
NVPMCounterID unID);
NVPMRESULT AddCounters(NVPMContext hContext,
NVPMUINT unCount, NVPMCounterID *punIDs);
Error return values:
NVPM_ERROR_INVALID_COUNTER
Disable a counter(s):
NVPMRESULT RemoveCounterByName(NVPMContext hContext,
char *pcName);
NVPMRESULT RemoveCounter(NVPMContext hContext,
NVPMCounterID unID);
NVPMRESULT RemoveCounters(NVPMContext hContext,
NVPMUINT unCount, NVPMCoutnerID *punIDs);
NVPMRESULT RemoveAllCounters();
Error return values:
NVPM_ERROR_INVALID_COUNTER
NVPM_WARNING_COUNTER_NOT_ENABLED
NVPM_WARNING_NO_COUNTERS: No counters were enabled
Experiment interface:
Signals to NVPerfAPI that the user is ready to begin sampling. It returns in pnNumPasses the number of passes it will take to provide data for all of the enabled counters.

PerfKit
DA-01800-001_v04 33 April 2013
NVPMRESULT BeginExperiment(NVPMContext hContext,
NVPMUINT *punNumPasses);
NVPMRESULT EndExperiment(NVPMContext hContext);
Error return values:
NVPM_ERROR_NO_COUNTERS: No counters are enabled
NVPM_ERROR_NOT_IN_EXPERIMENT: BeginExperiment not called
NVPM_ERROR_EXPERIMENT_INCOMPLETE: Didn't call the correct number of passes specified by BeginExperiment
Pass interface:
NVPMRESULT BeginPass(NVPMContext hContext, NVPMUINT
nPass);
NVPMRESULT EndPass(NVPMContext hContext, NVPMUINT
nPass);
Error return values:
NVPM_ERROR_NOT_IN_EXPERIMENT: BeginExperiment() was not called
NVPM_ERROR_PASS_SKIPPED: Passes were not given in sequence
NVPM_ERROR_INVALID_PASS: An pass number not valid for the current experiment was given
NVPM_WARNING_PASS_NOT_ENDED: Previous pass was not ended with EndPass()
NVPM_ERROR_NOT_IN_EXPERIMENT: BeginExperiment() was not called
NVPM_ERROR_NOT_IN_PASS: BeginPass wasn't called or was called with another pass number
NVPM_WARNING_OBJECT_NOT_ENDED: The last EndObject was not called
NVPM_WARNING_PASS_INCOMPLETE: BeginObject()/EndObject() was not called for all allocated objects
Object interface:
Allocate slots for counter data to be put into. If this isn't done, all data is put in "slot 0". Up to NVPM_MAX_OBJECTS (currently 1024) objects are currently supported.
PerfKit
DA-01800-001_v04 34 April 2013
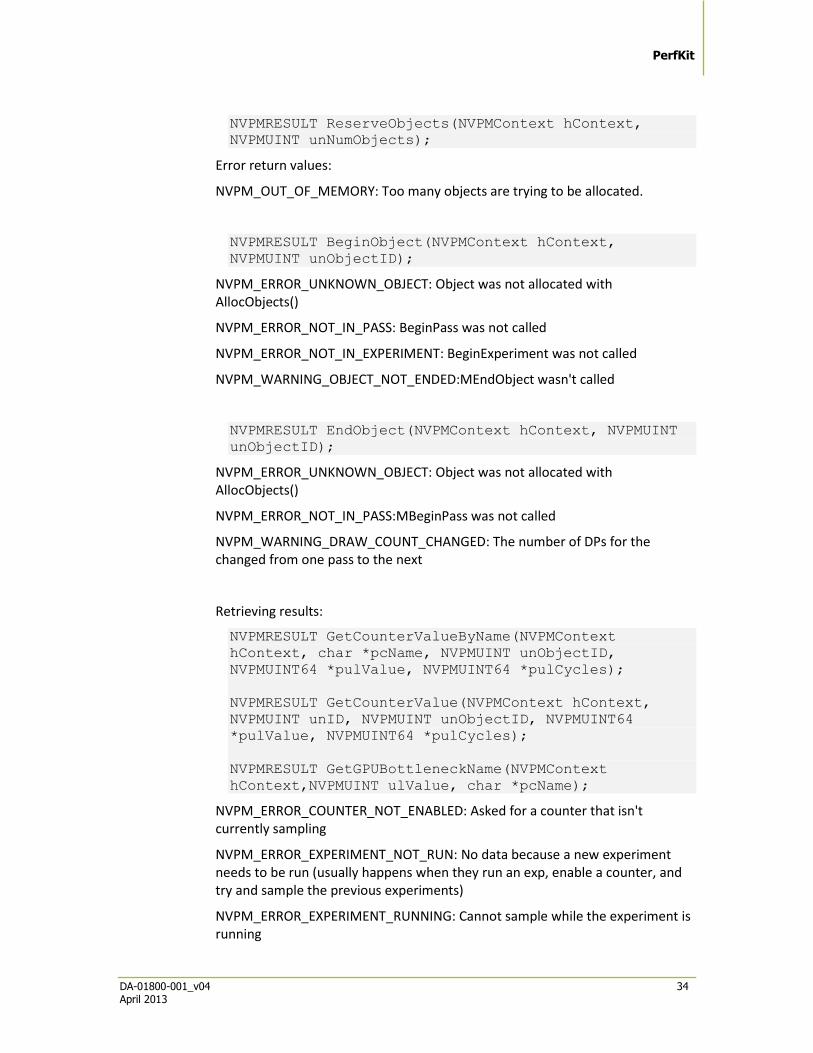
NVPMRESULT ReserveObjects(NVPMContext hContext,
NVPMUINT unNumObjects);
Error return values:
NVPM_OUT_OF_MEMORY: Too many objects are trying to be allocated.
NVPMRESULT BeginObject(NVPMContext hContext,
NVPMUINT unObjectID);
NVPM_ERROR_UNKNOWN_OBJECT: Object was not allocated with AllocObjects()
NVPM_ERROR_NOT_IN_PASS: BeginPass was not called
NVPM_ERROR_NOT_IN_EXPERIMENT: BeginExperiment was not called
NVPM_WARNING_OBJECT_NOT_ENDED:MEndObject wasn't called
NVPMRESULT EndObject(NVPMContext hContext, NVPMUINT
unObjectID);
NVPM_ERROR_UNKNOWN_OBJECT: Object was not allocated with AllocObjects()
NVPM_ERROR_NOT_IN_PASS:MBeginPass was not called
NVPM_WARNING_DRAW_COUNT_CHANGED: The number of DPs for the changed from one pass to the next
Retrieving results:
NVPMRESULT GetCounterValueByName(NVPMContext
hContext, char *pcName, NVPMUINT unObjectID,
NVPMUINT64 *pulValue, NVPMUINT64 *pulCycles);
NVPMRESULT GetCounterValue(NVPMContext hContext,
NVPMUINT unID, NVPMUINT unObjectID, NVPMUINT64
*pulValue, NVPMUINT64 *pulCycles);
NVPMRESULT GetGPUBottleneckName(NVPMContext
hContext,NVPMUINT ulValue, char *pcName);
NVPM_ERROR_COUNTER_NOT_ENABLED: Asked for a counter that isn't currently sampling
NVPM_ERROR_EXPERIMENT_NOT_RUN: No data because a new experiment needs to be run (usually happens when they run an exp, enable a counter, and try and sample the previous experiments)
NVPM_ERROR_EXPERIMENT_RUNNING: Cannot sample while the experiment is running

PerfKit
DA-01800-001_v04 35 April 2013
Misc functions:
UINT GetExtendedError()
NVIDIA Corporation 2701 San Tomas Expressway
Santa Clara, CA 95050 www.nvidia.com
Notice
ALL NVIDIA DESIGN SPECIFICATIONS, REFERENCE BOARDS, FILES, DRAWINGS, DIAGNOSTICS, LISTS, AND OTHER DOCUMENTS (TOGETHER AND SEPARATELY, “MATERIALS”) ARE BEING PROVIDED “AS IS." NVIDIA MAKES NO WARRANTIES, EXPRESSED, IMPLIED, STATUTORY, OR OTHERWISE WITH RESPECT TO THE MATERIALS, AND EXPRESSLY DISCLAIMS ALL IMPLIED WARRANTIES OF NONINFRINGEMENT, MERCHANTABILITY, AND FITNESS FOR A PARTICULAR PURPOSE.
Information furnished is believed to be accurate and reliable. However, NVIDIA Corporation assumes no responsibility for the consequences of use of such information or for any infringement of patents or other rights of third parties that may result from its use. No license is granted by implication or otherwise under any patent or patent rights of NVIDIA Corporation. Specifications mentioned in this publication are subject to change without notice. This publication supersedes and replaces all information previously supplied. NVIDIA Corporation products are not authorized for use as critical components in life support devices or systems without express written approval of NVIDIA Corporation.
Trademarks
NVIDIA and the NVIDIA logo are trademarks or registered trademarks of NVIDIA Corporation in the United States and other countries. Other company and product names may be trademarks of the respective companies with which they are associated.
Copyright
© 2012-2013 NVIDIA Corporation. All rights reserved.


![User Guide...User. {{]}]} {}]}](https://static.fdocuments.net/doc/165x107/60918ca14327954d24291644/-user-guide-user-.jpg)