Nutritional Assessment - University of Cape Town · Nutritional Assessment, Definition • A...
66
Nutritional Assessment Cape Town Sept-Oct 2015 GOES
Transcript of Nutritional Assessment - University of Cape Town · Nutritional Assessment, Definition • A...
Nutritional Assessment
Cape Town Sept-Oct 2015
GOES
Nutritional Screening and Assessment
• Nutritional assessment
– Detailed examination of metabolic, nutritional or functional variables by an expert dietician
• Nutritional screening
– Rapid and simple process conducted by admitting staff or community health care teams-defining patients who are at risk or not at risk of malnutrition
Nutritional Assessment, Definition
•A detailed examination of metabolic, nutritional or functional variables by an expert clinician, dietitian or nutrition nurse”
• Kondrup J, et al. ESPEN Guidelines for nutrition screening. Clin Nutr 2003;22:415-21
• Nutrition assessment must be an integral part of the medical evaluation of hospitalized children
• Nutritional status should be monitored regularly in children
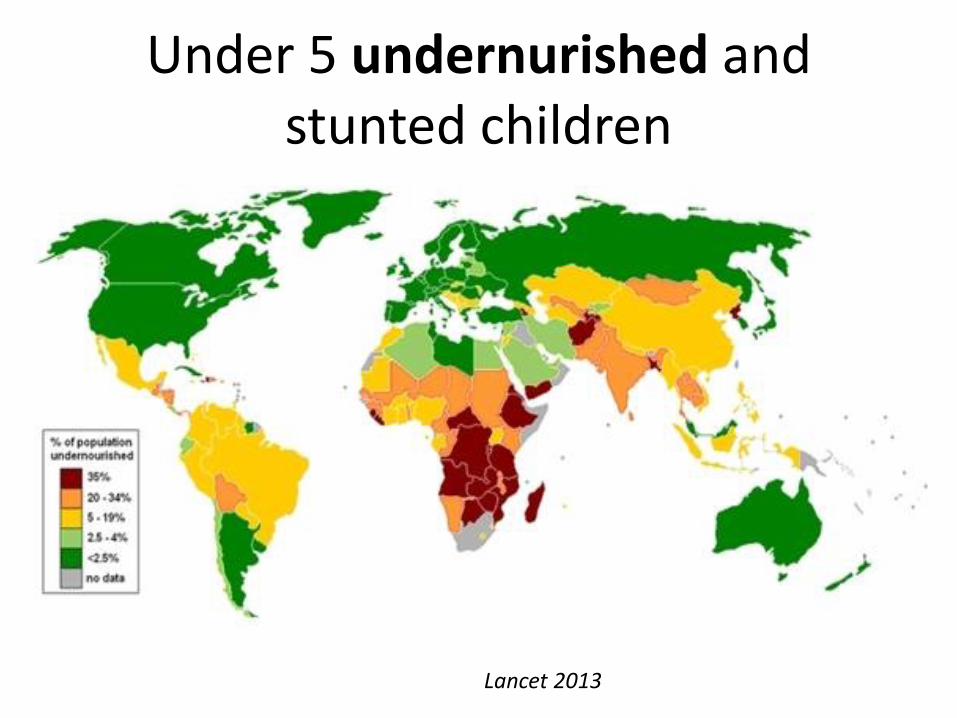
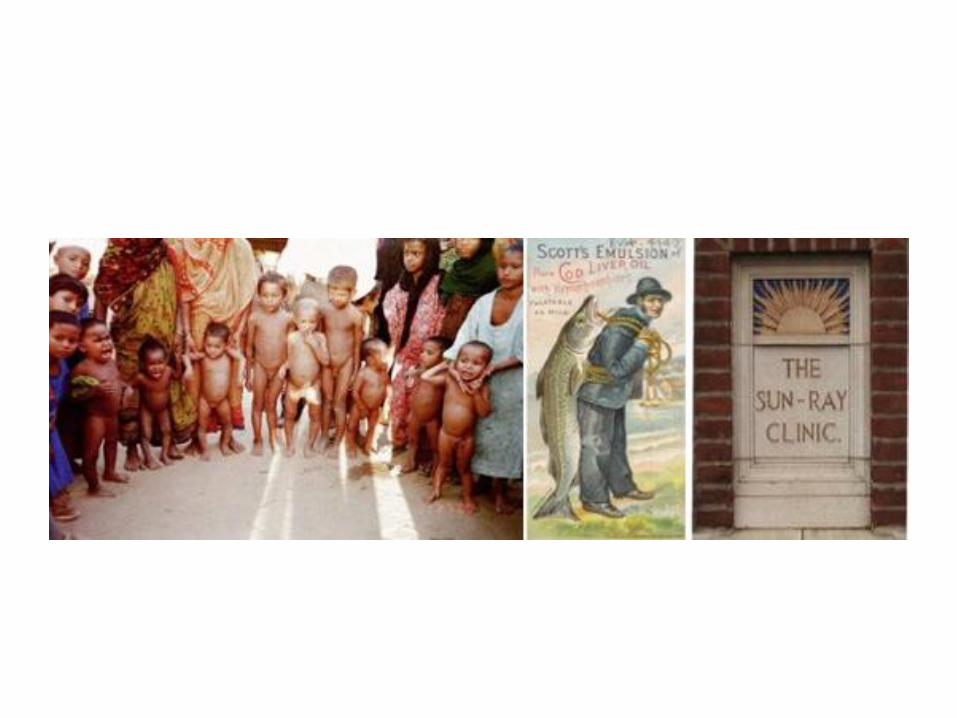
Under 5 undernurished and stunted children
Lancet 2013
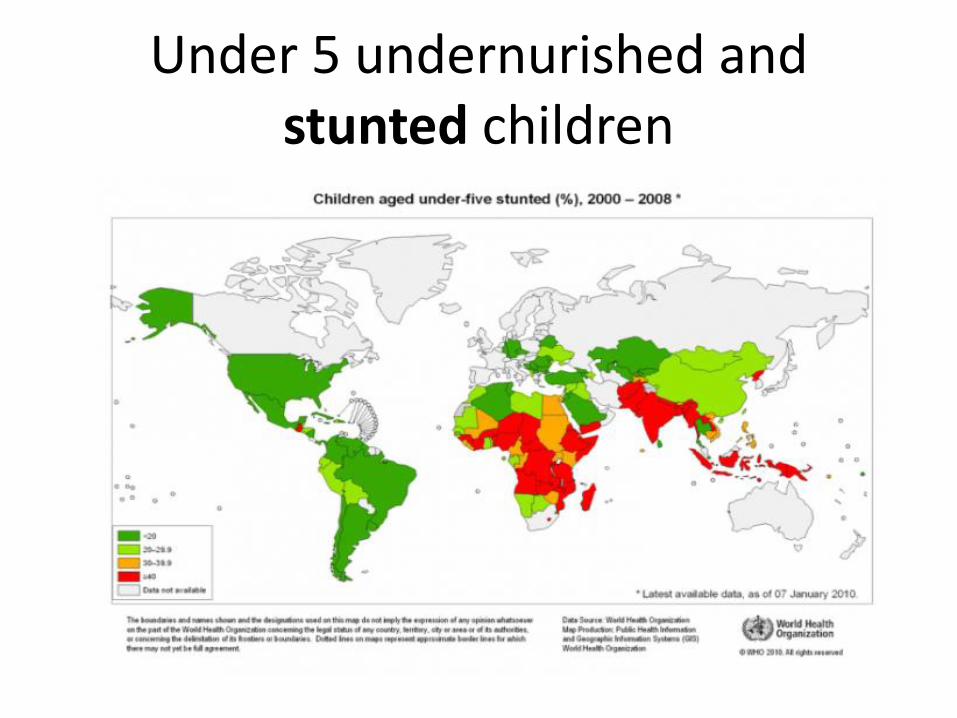
Under 5 undernurished and stunted children
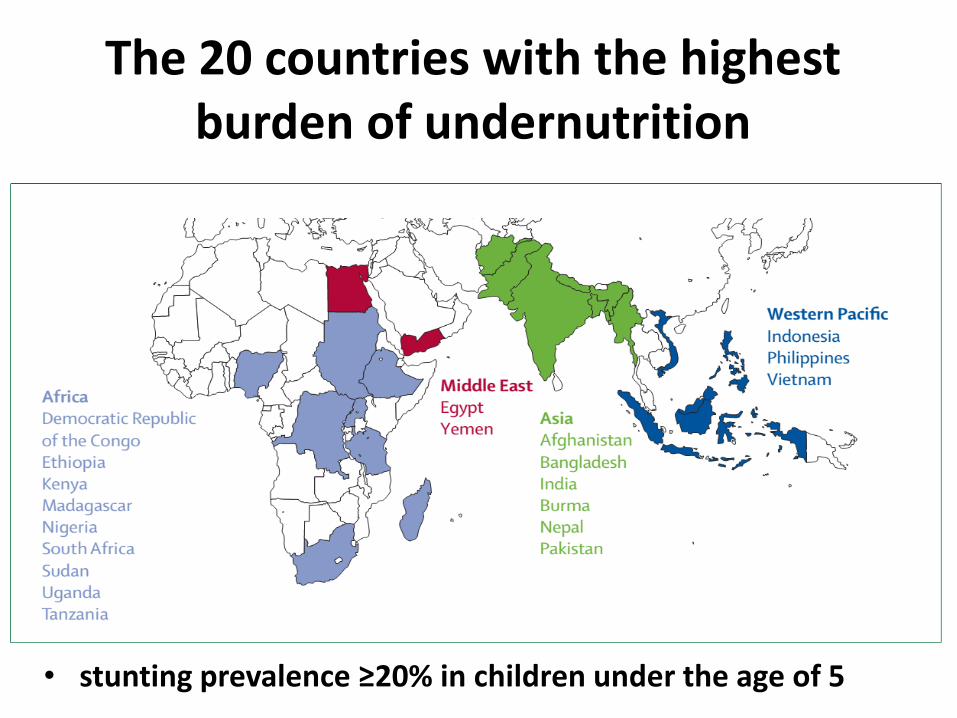
The 20 countries with the highest burden of undernutrition
• stunting prevalence ≥20% in children under the age of 5
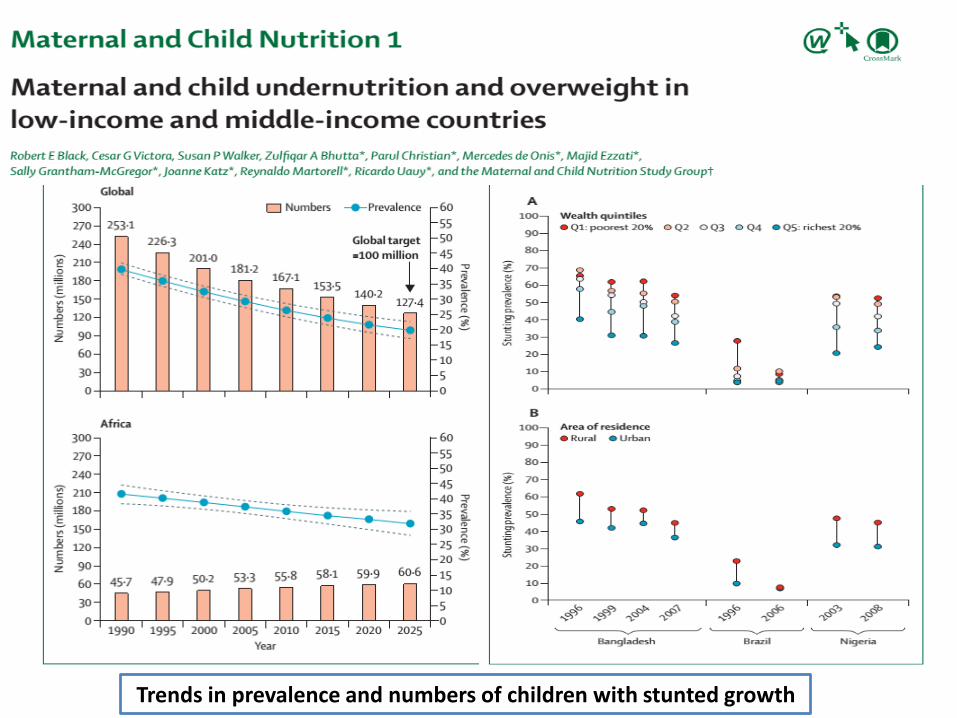
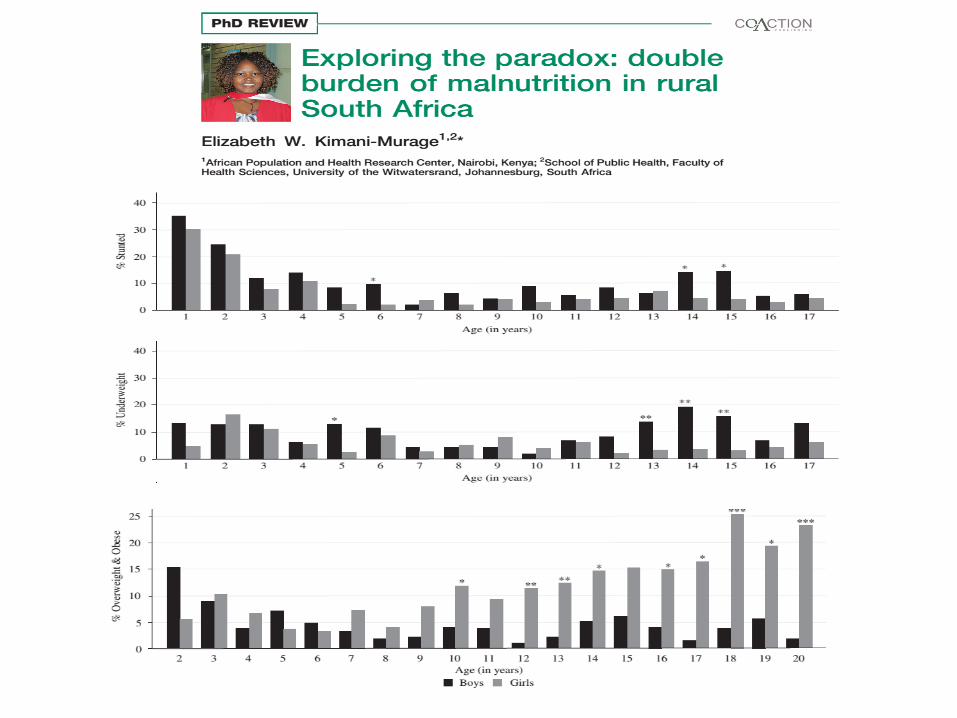
Trends in prevalence and numbers of children with stunted growth
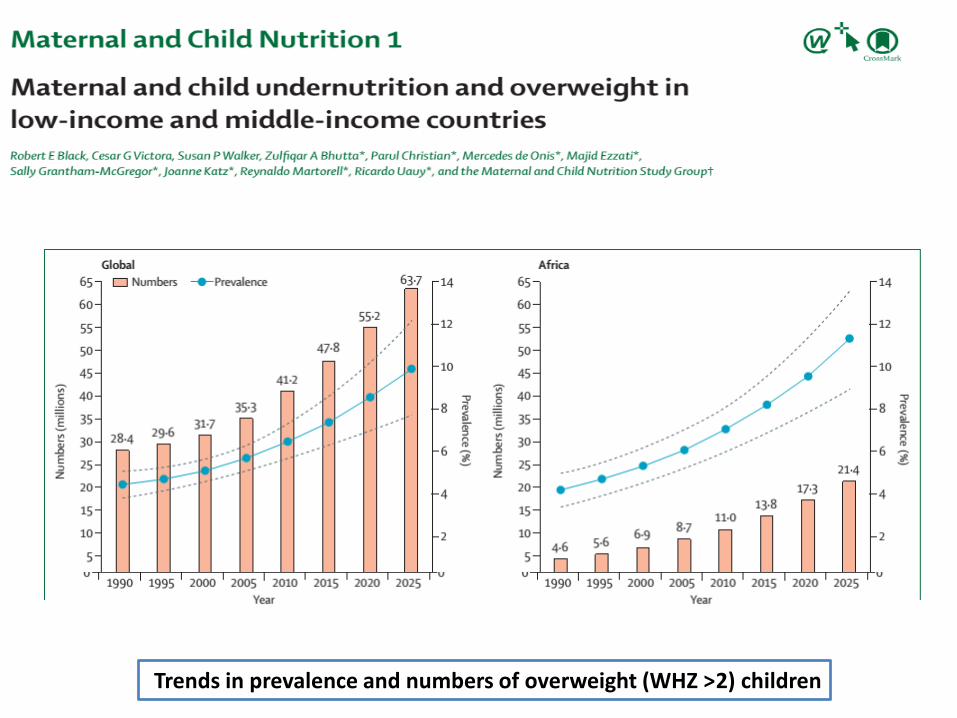
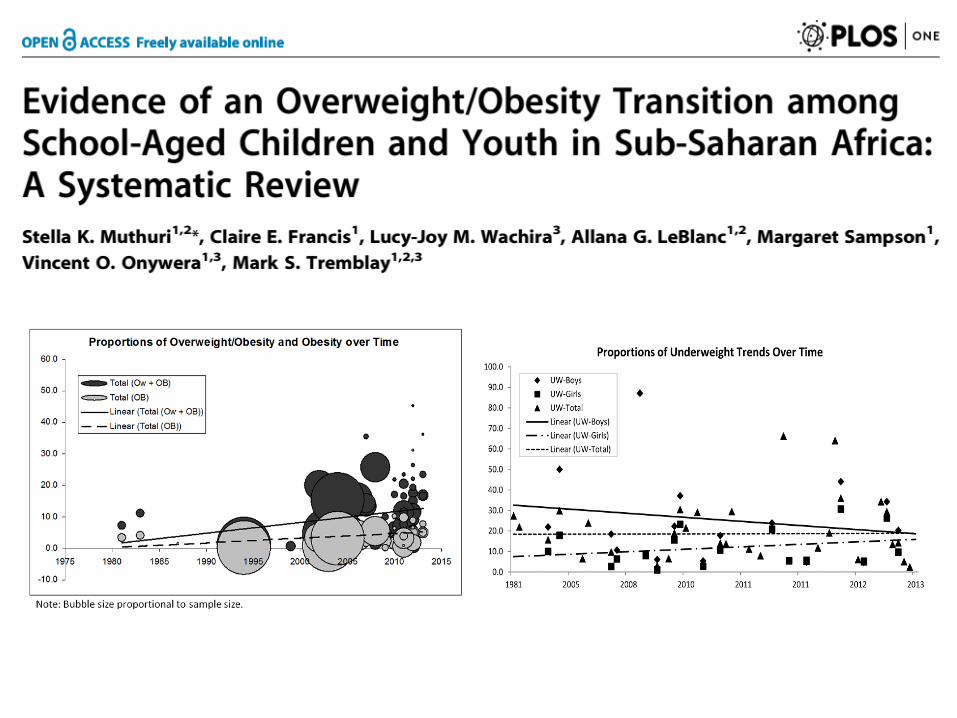
Trends in prevalence and numbers of overweight (WHZ >2) children

Previous one as a detailed graph
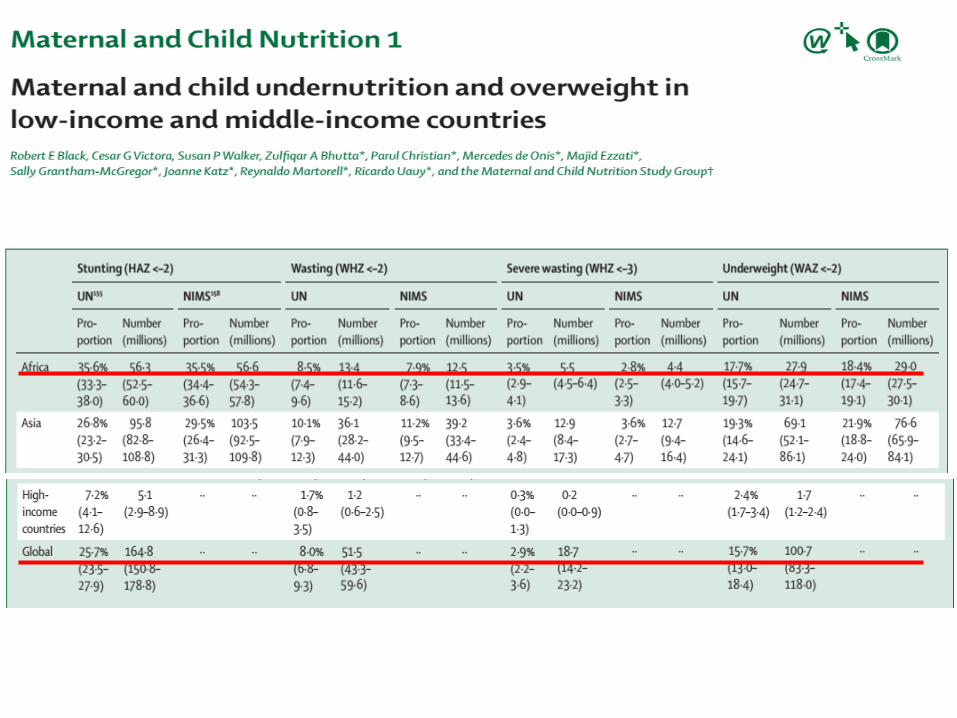
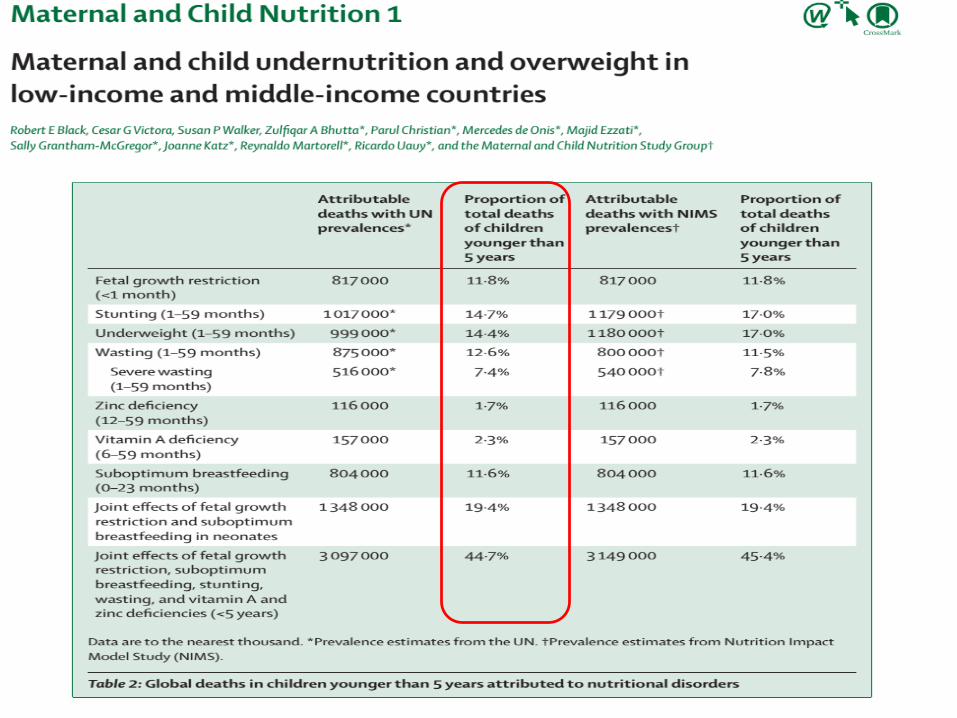
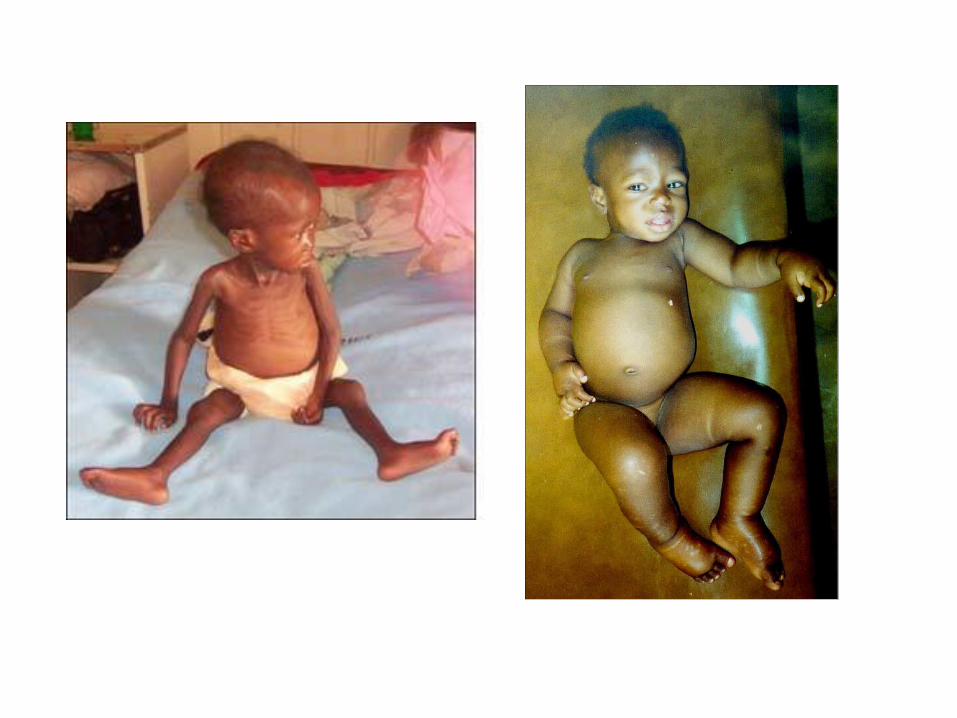
Maternal & child malnutrition
Short term-consequences
Growth impairmentMortalitiyMorbidity Disability
Black RE, et al. Lancet 2008

Previous one as a detailed graph
Long term-consequences
Adult sizeIQ
Economic productivityMetabolic and CVD
Black RE, et al. Lancet 2008
Maternal & child malnutrition
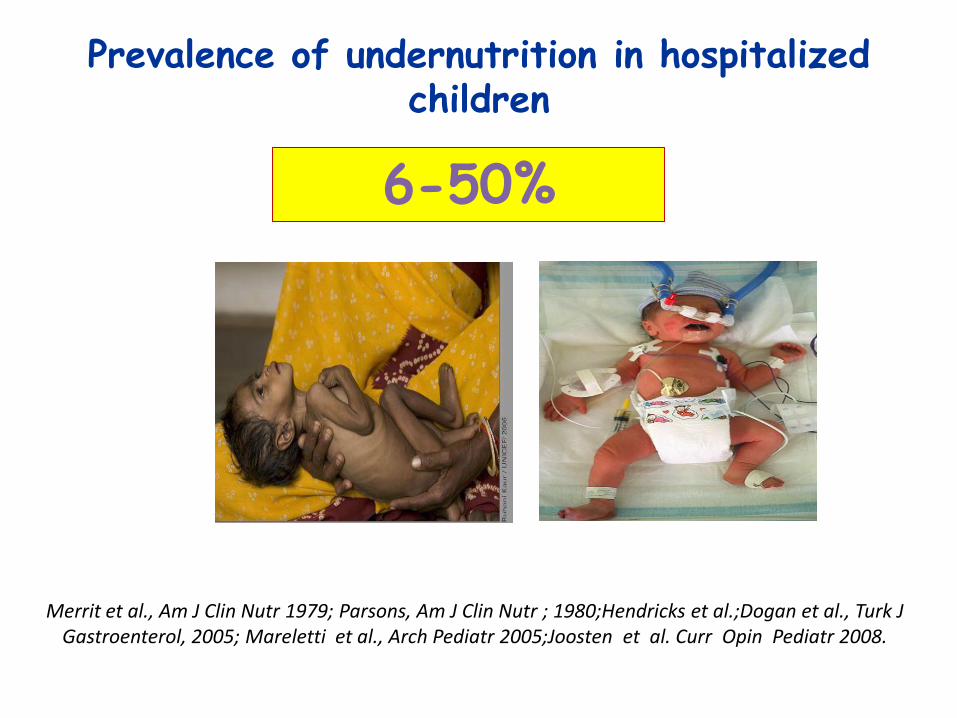
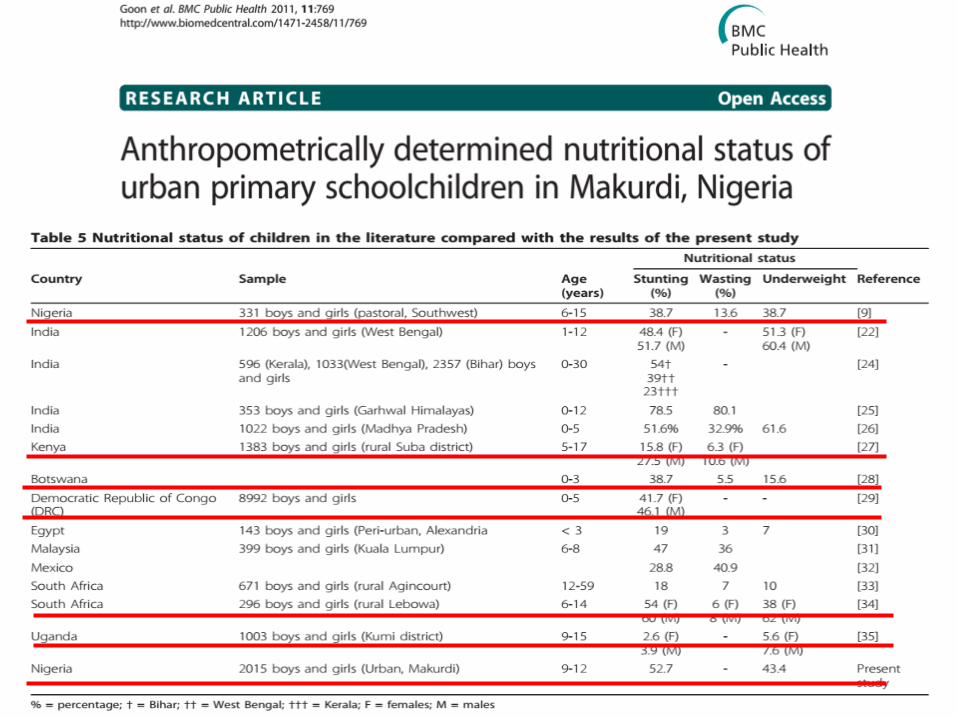
Prevalence of undernutrition in hospitalized children
Merrit et al., Am J Clin Nutr 1979; Parsons, Am J Clin Nutr ; 1980;Hendricks et al.;Dogan et al., Turk J Gastroenterol, 2005; Mareletti et al., Arch Pediatr 2005;Joosten et al. Curr Opin Pediatr 2008.
6-50%
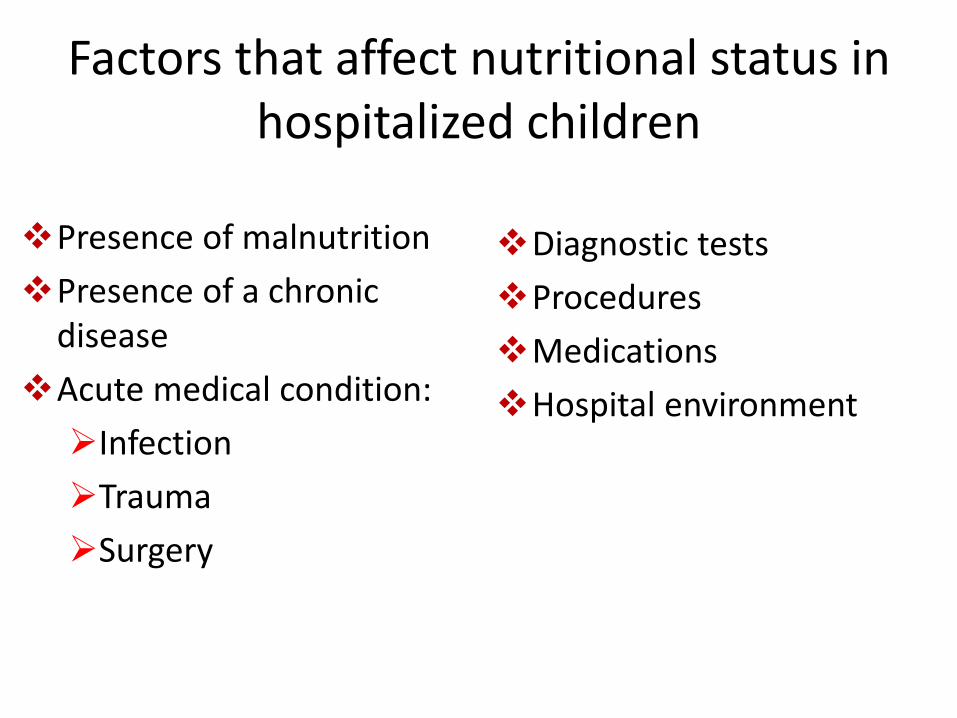
Factors that affect nutritional status in hospitalized children
Presence of malnutrition
Presence of a chronic disease
Acute medical condition:
Infection
Trauma
Surgery
Diagnostic tests
Procedures
Medications
Hospital environment
Adverse effects of undernutrition -hospitalized patients
Increased infectious complications
Delayed recovery
Increased length of stay (Increased costs)
Increased readmision
Increased mortality
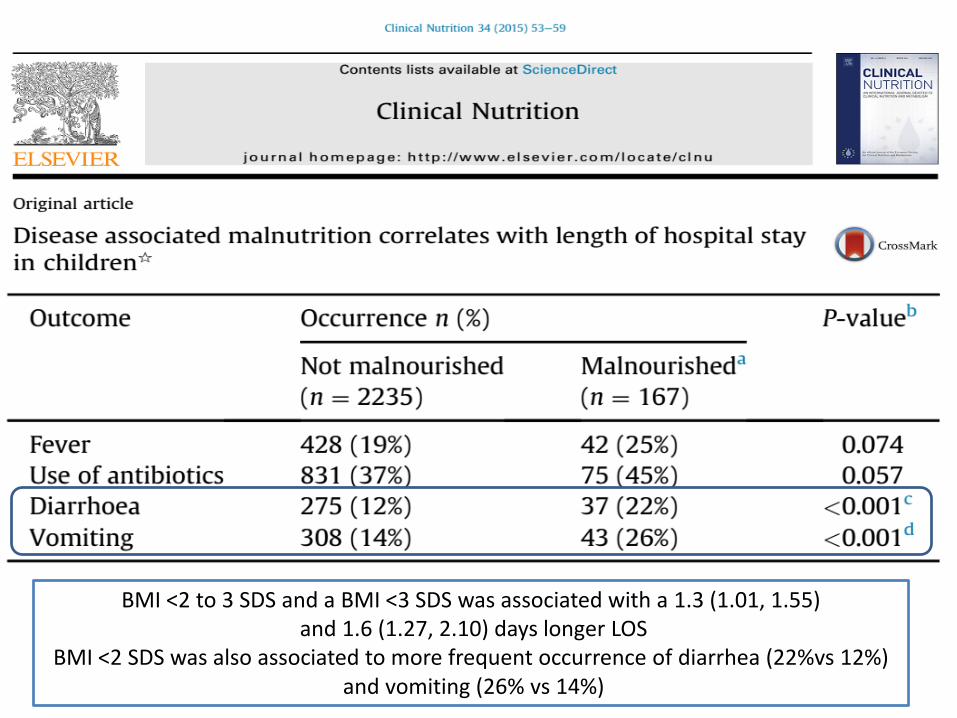
BMI <2 to 3 SDS and a BMI <3 SDS was associated with a 1.3 (1.01, 1.55)and 1.6 (1.27, 2.10) days longer LOS
BMI <2 SDS was also associated to more frequent occurrence of diarrhea (22%vs 12%)and vomiting (26% vs 14%)

Can’t we just look and diagnose?
Measured the ability of 3 experienced childcare professionals to grade the nutritional status of patients of varying ages and nutritional status.
All subjects (n=44) were in hospital for at least 3 days to enable complete assessment, and were unknown to the panel of assessors.
Cross JH, et al. Arch Dis Child 1995; 72: 60-1
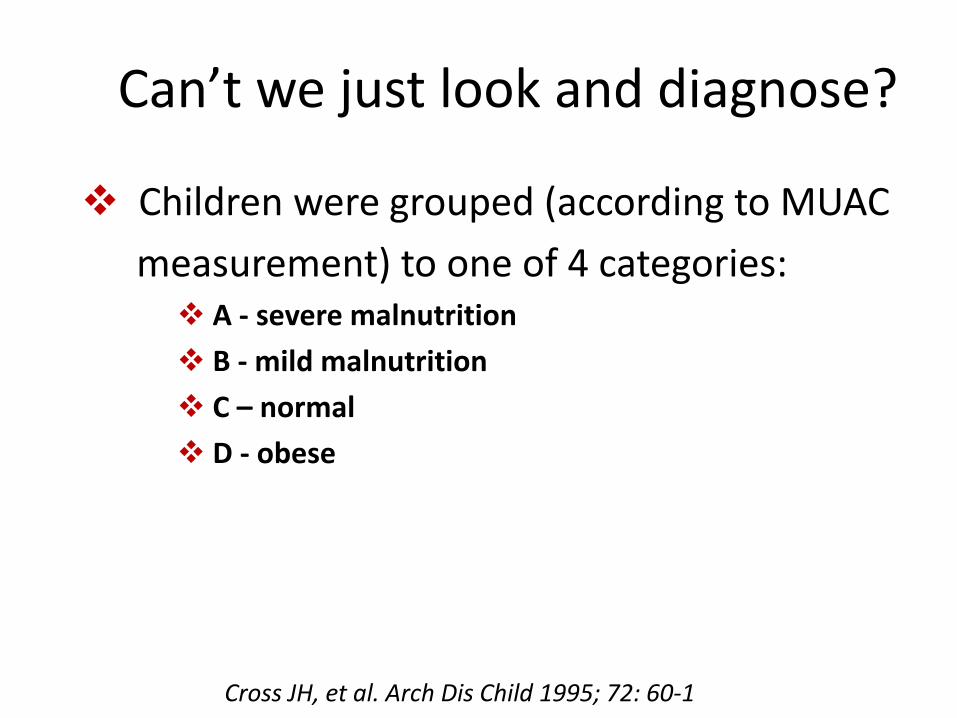
Children were grouped (according to MUAC
measurement) to one of 4 categories: A - severe malnutrition
B - mild malnutrition
C – normal
D - obese
Cross JH, et al. Arch Dis Child 1995; 72: 60-1
Can’t we just look and diagnose?
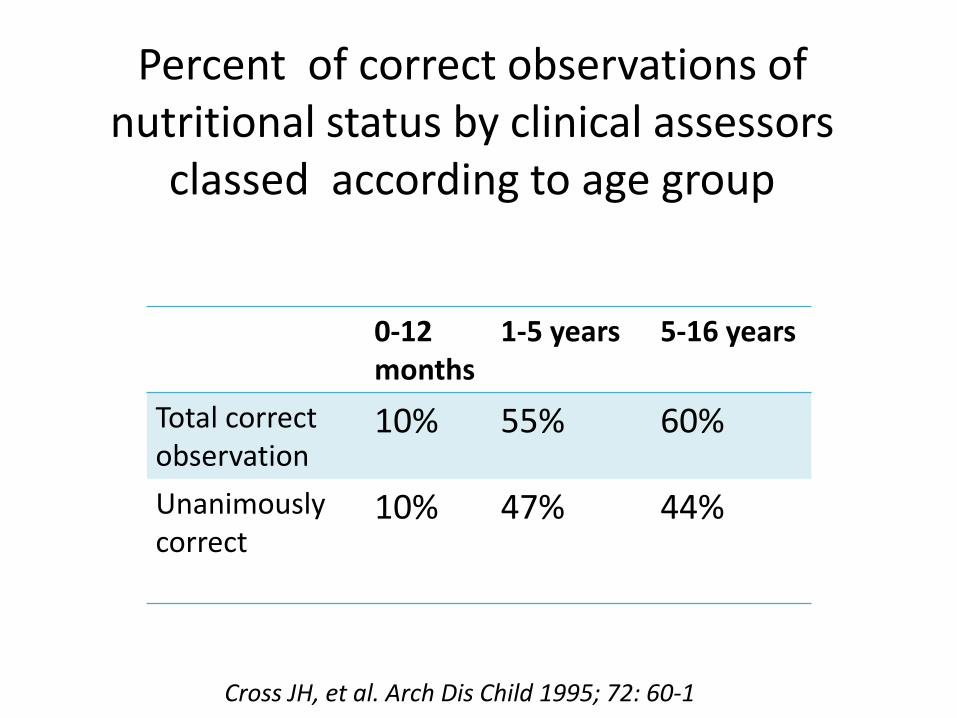
Percent of correct observations of nutritional status by clinical assessors
classed according to age group
0-12 months
1-5 years 5-16 years
Total correct observation
10% 55% 60%
Unanimously correct
10% 47% 44%
Cross JH, et al. Arch Dis Child 1995; 72: 60-1
Nutritional assessment goals
• Confirm normal growth and development
• Establish nutritional status
• Evaluate the risk of under nutrition/ overweight
• Provide guidelines for nutrition therapy
• Monitor the impact of nutrition therapy
Components of Nutritional Assessment
• Medical history
• Physical examination
• Anthropometric measurements
• Dietary intake and energy requirements
• Body composition
• Biological parameters
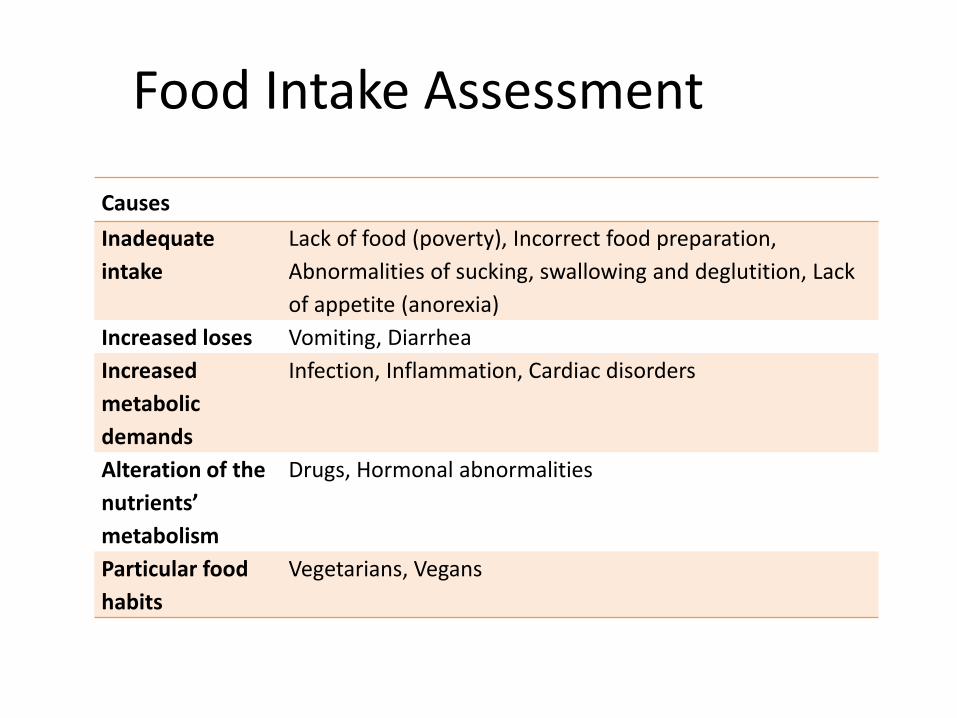
Food Intake Assessment
Causes
Inadequate
intake
Lack of food (poverty), Incorrect food preparation,
Abnormalities of sucking, swallowing and deglutition, Lack
of appetite (anorexia)
Increased loses Vomiting, Diarrhea
Increased
metabolic
demands
Infection, Inflammation, Cardiac disorders
Alteration of the
nutrients’
metabolism
Drugs, Hormonal abnormalities
Particular food
habits
Vegetarians, Vegans
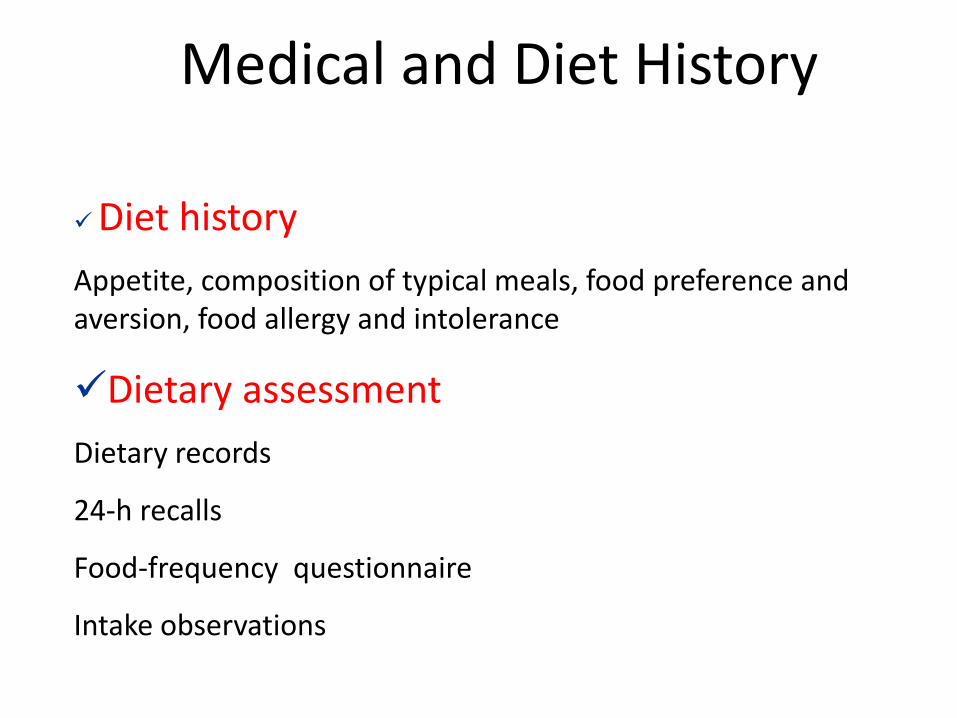
Medical and Diet History
Diet history
Appetite, composition of typical meals, food preference and aversion, food allergy and intolerance
Dietary assessment
Dietary records
24-h recalls
Food-frequency questionnaire
Intake observations
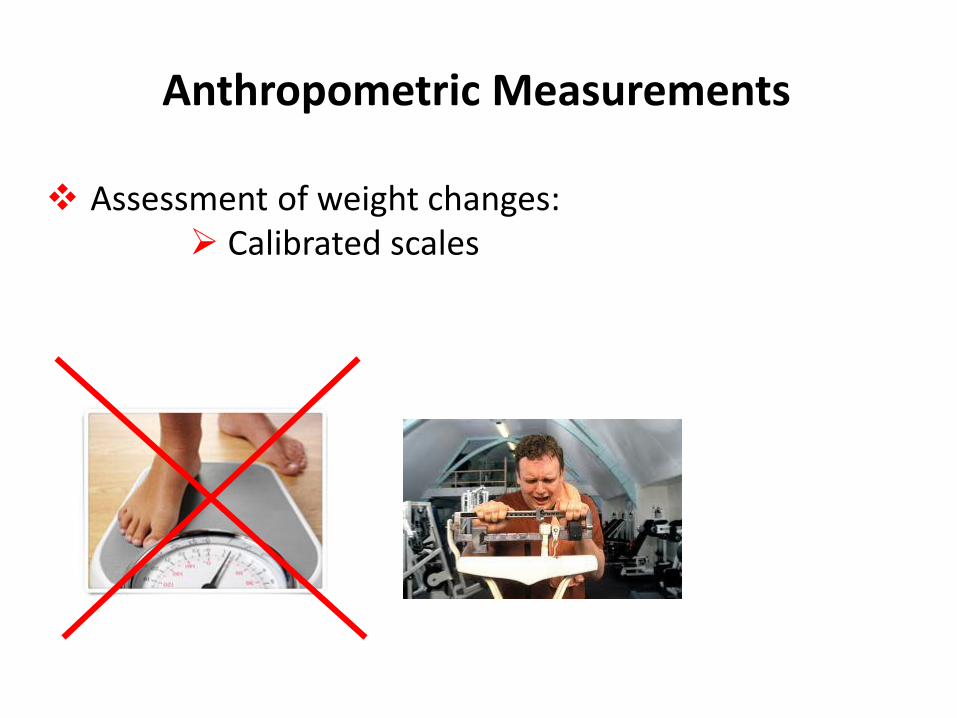
Anthropometric Measurements
Assessment of weight changes: Calibrated scales
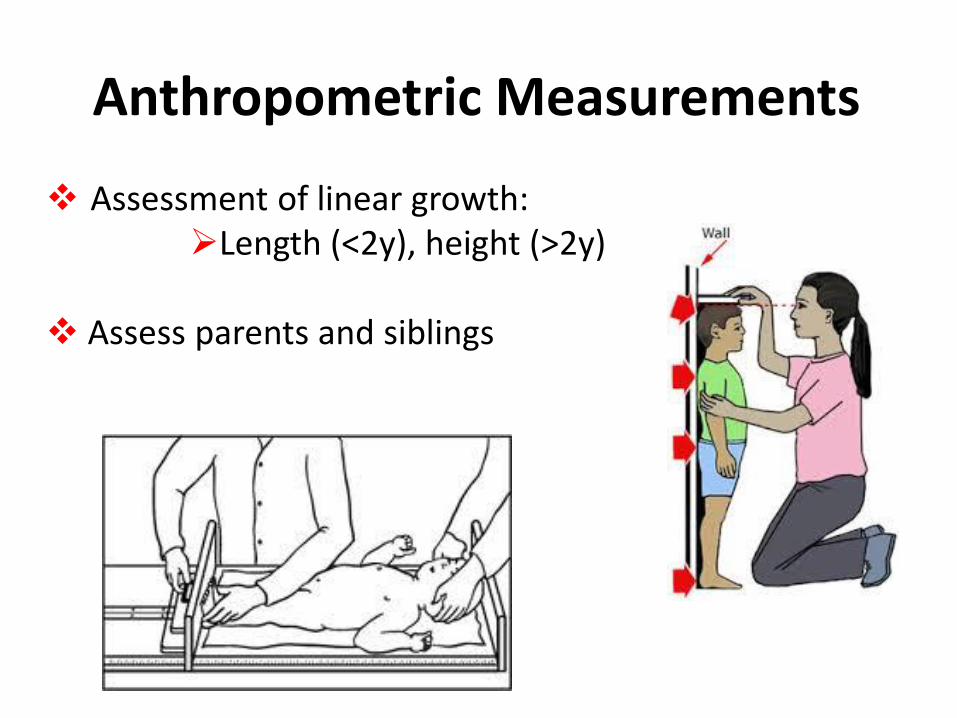
Assessment of linear growth:Length (<2y), height (>2y)
Assess parents and siblings
Anthropometric Measurements
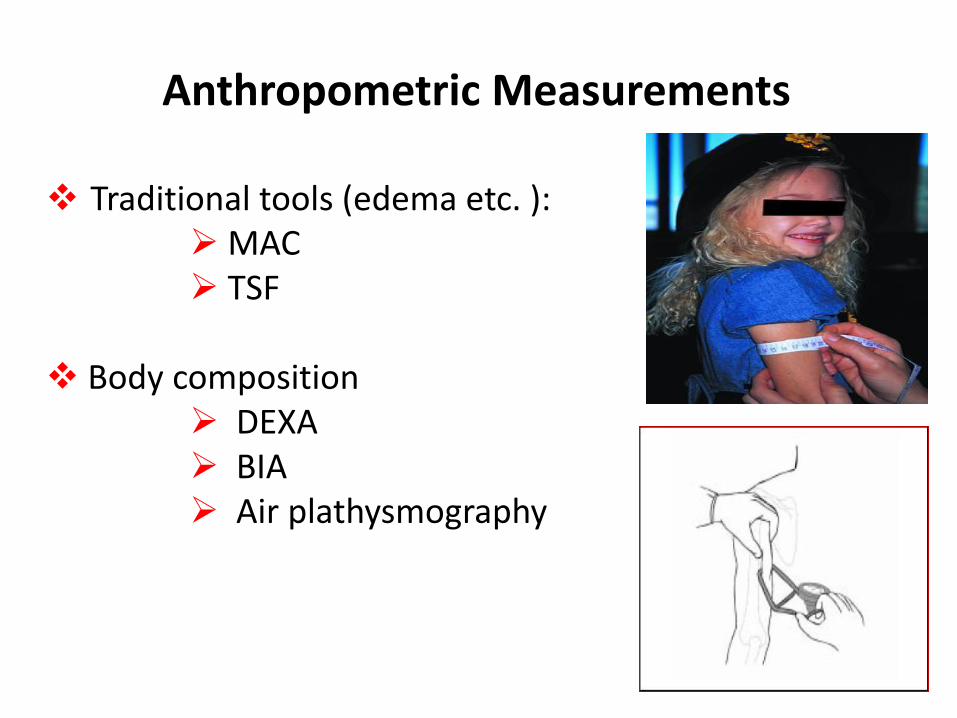
Traditional tools (edema etc. ):MAC TSF
Body composition DEXA BIA Air plathysmography
Anthropometric Measurements
• At four sites –• Triceps skinfold
• Biceps skin fold
• Subscapular skinfold
• Supra-iliacal skin fold
• Measured by caliper usually 3 times
• On left side
• The skin fold thickness is an index of body fat
Skinfold thickness
Anthropometric measurements
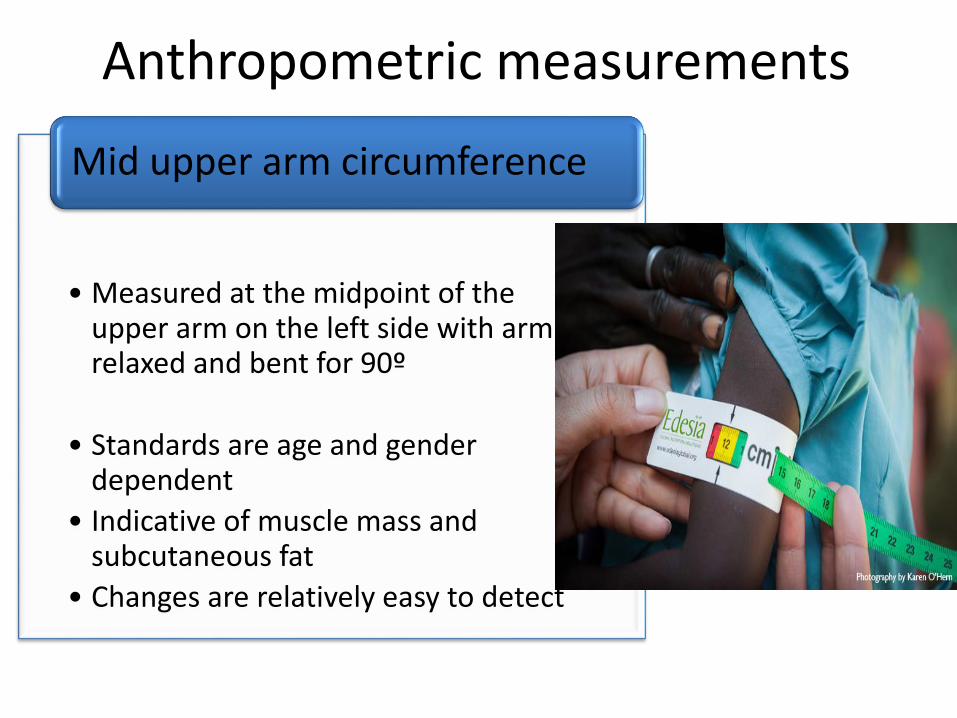
• Measured at the midpoint of the upper arm on the left side with arm relaxed and bent for 90º
• Standards are age and gender dependent
• Indicative of muscle mass and subcutaneous fat
• Changes are relatively easy to detect
Mid upper arm circumference
Anthropometric measurements
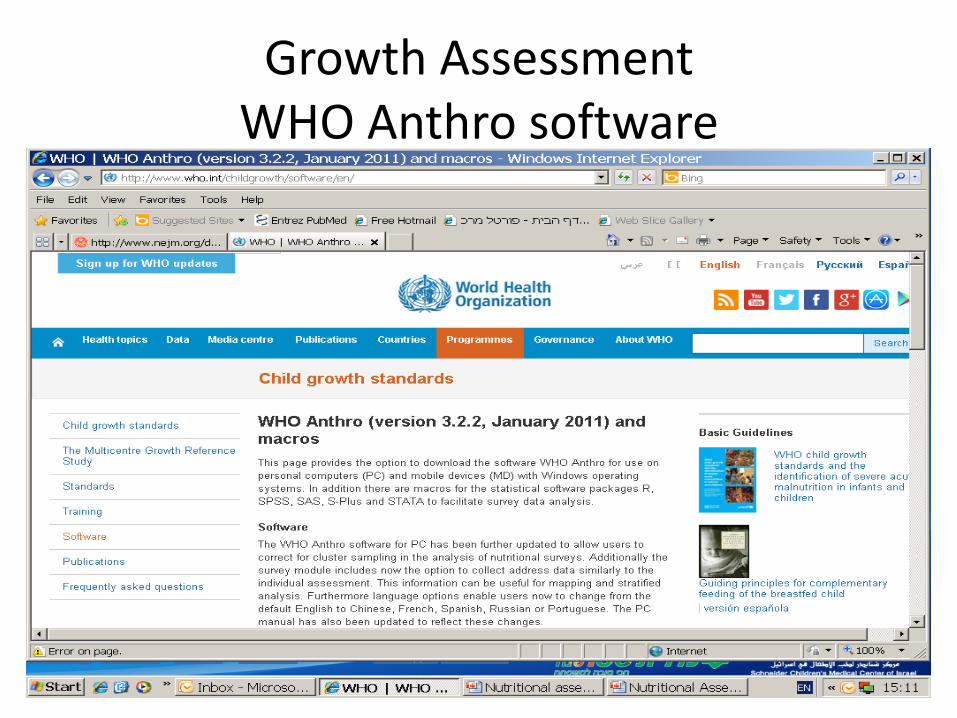
Growth AssessmentWHO Anthro software

1 year 2 years 3 years 4 years 5 years
WHO Growth Standards2006
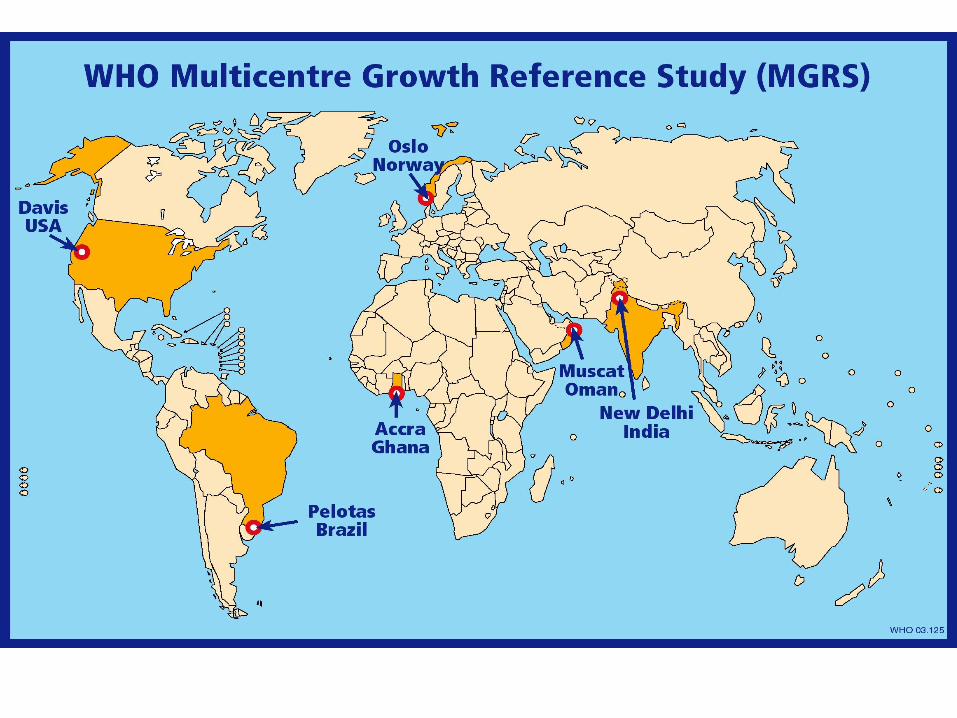
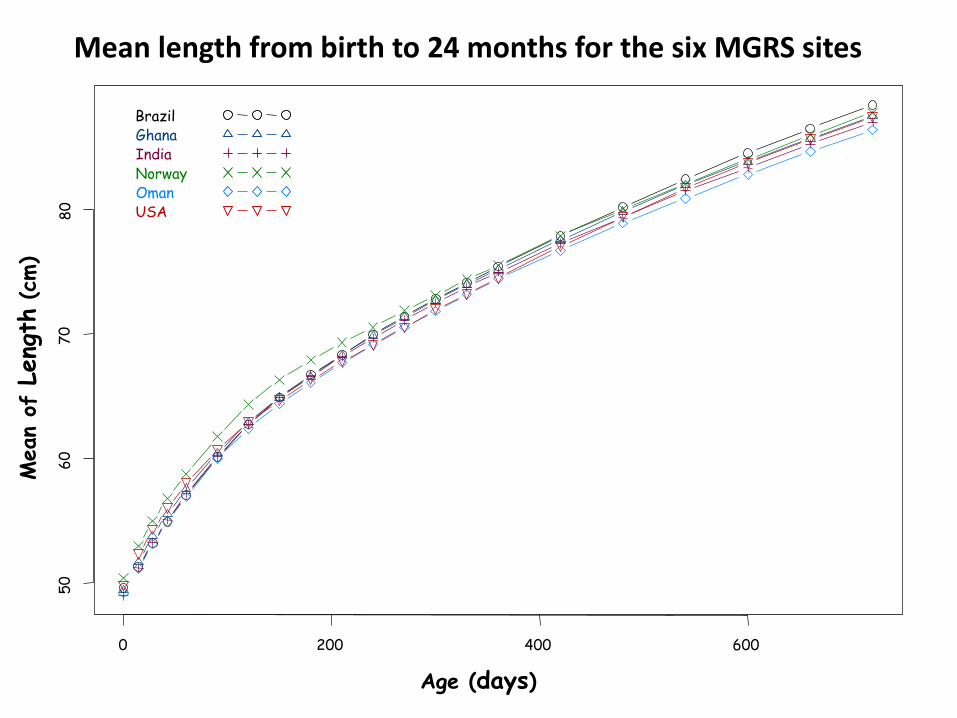
Mean length from birth to 24 months for the six MGRS sites
Age (days)
Mean
of L
eng
th(c
m)
0 200 400 600
50
60
70
80
BrazilGhanaIndiaNorwayOmanUSA
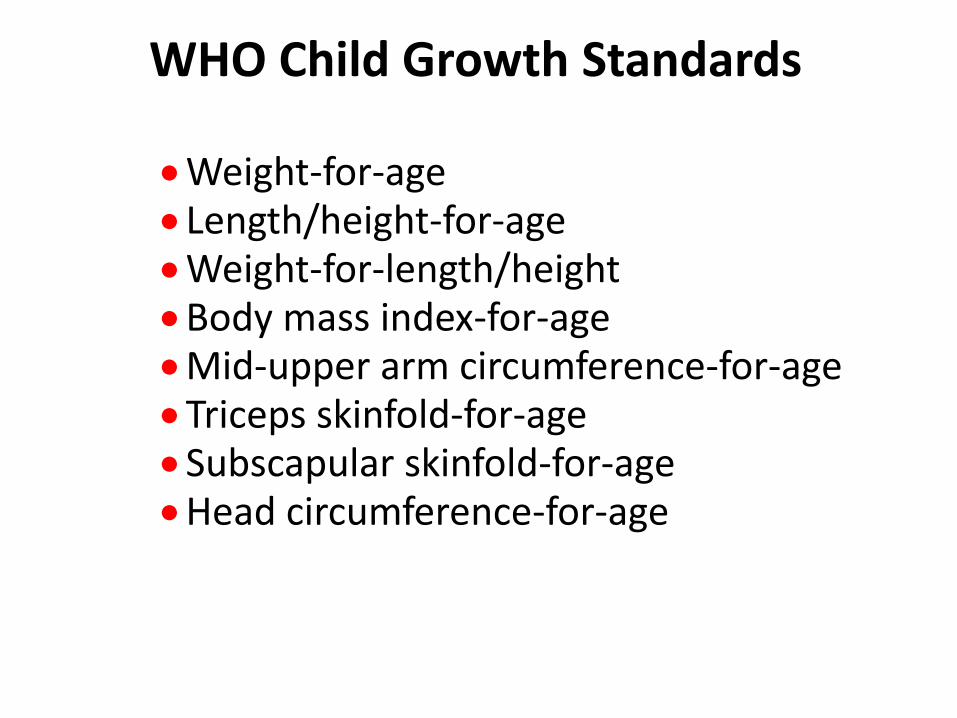
WHO Child Growth Standards
Weight-for-ageLength/height-for-ageWeight-for-length/heightBody mass index-for-ageMid-upper arm circumference-for-ageTriceps skinfold-for-ageSubscapular skinfold-for-ageHead circumference-for-age
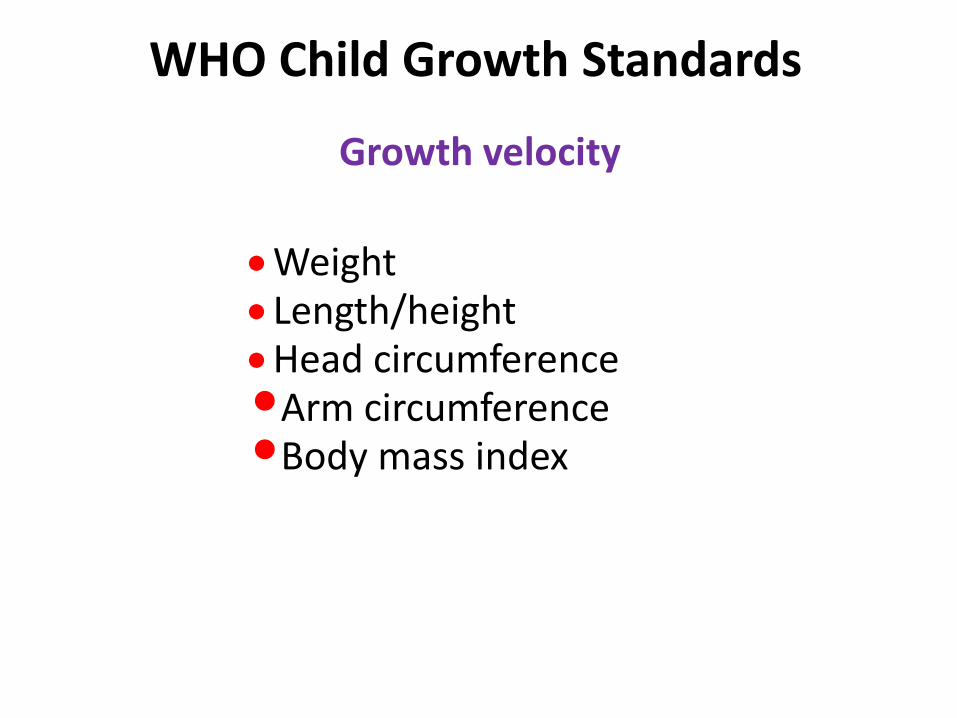
Growth velocity
WeightLength/heightHead circumference•Arm circumference•Body mass index
WHO Child Growth Standards
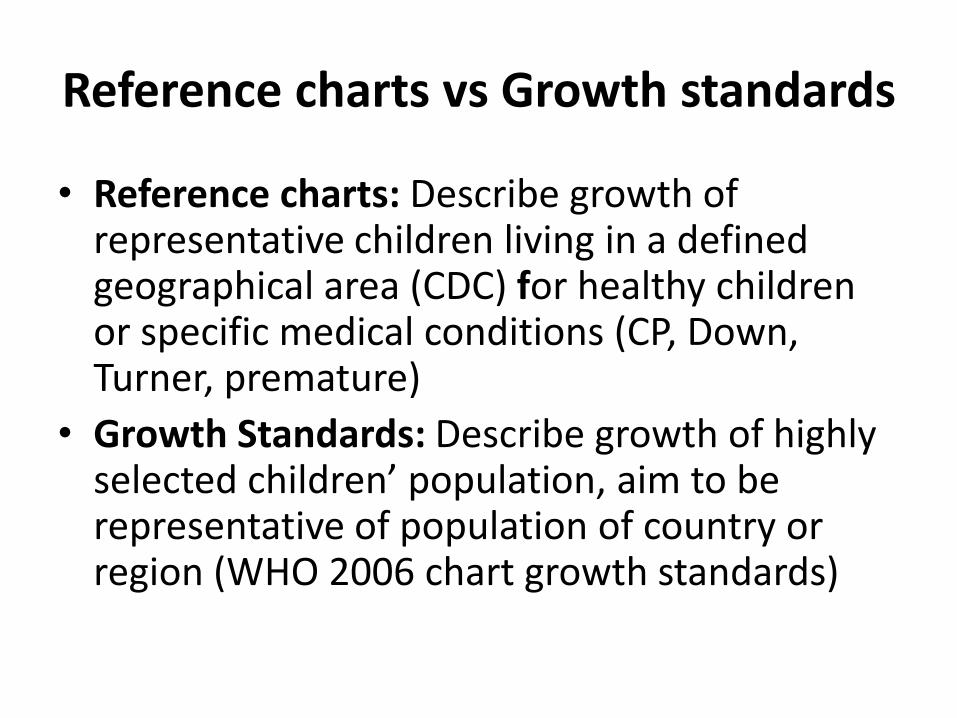
Reference charts vs Growth standards
• Reference charts: Describe growth of representative children living in a defined geographical area (CDC) for healthy children or specific medical conditions (CP, Down, Turner, premature)
• Growth Standards: Describe growth of highly selected children’ population, aim to be representative of population of country or region (WHO 2006 chart growth standards)
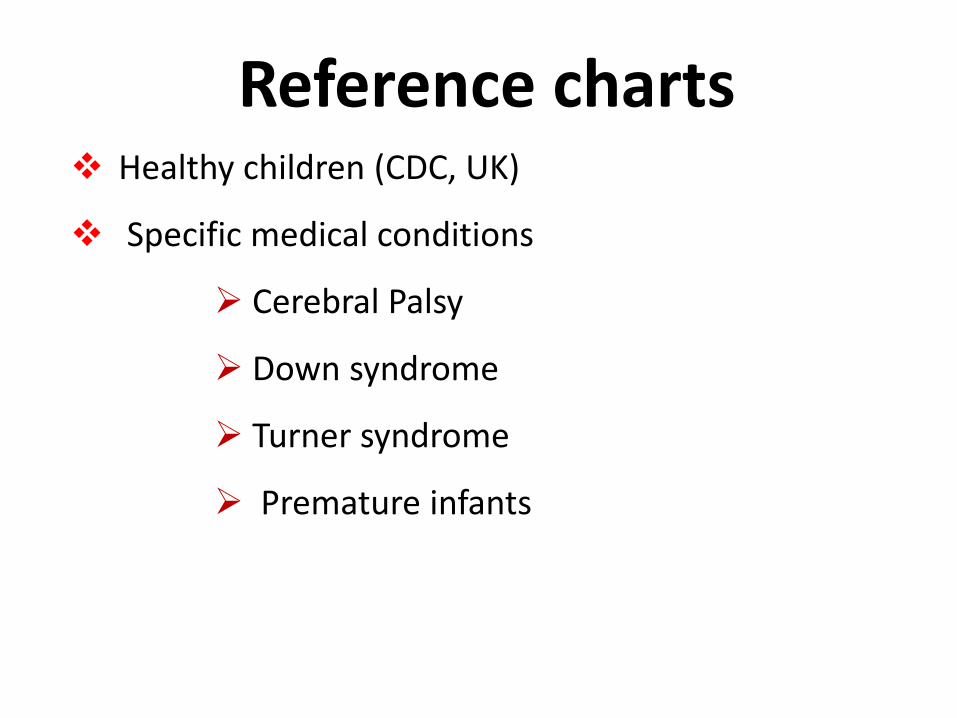
Reference charts Healthy children (CDC, UK)
Specific medical conditions
Cerebral Palsy
Down syndrome
Turner syndrome
Premature infants
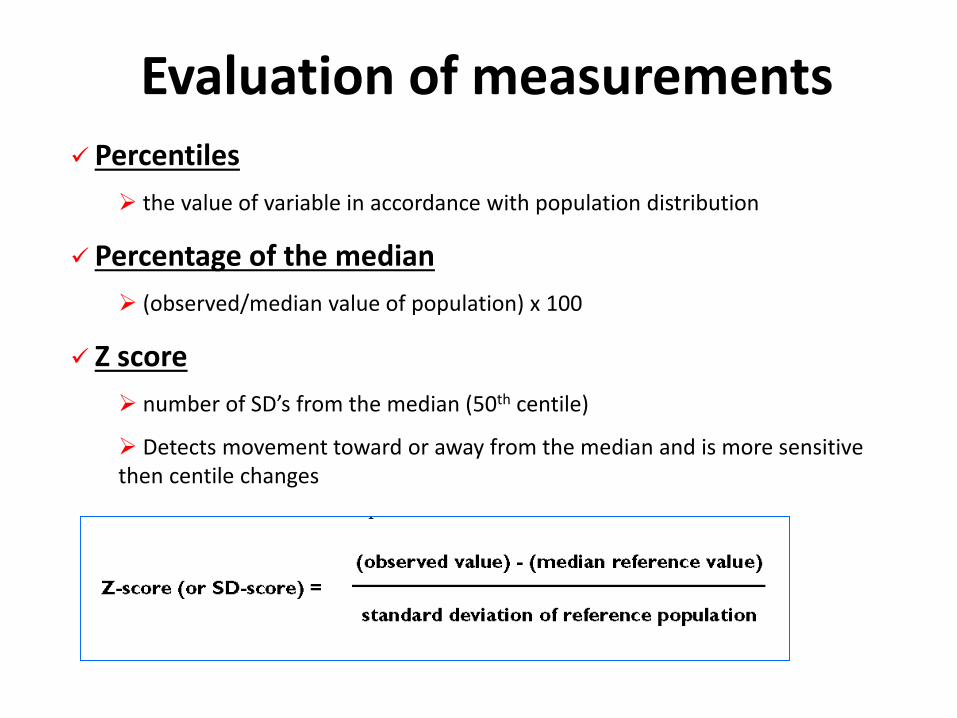
Evaluation of measurements Percentiles
the value of variable in accordance with population distribution
Percentage of the median
(observed/median value of population) x 100
Z score
number of SD’s from the median (50th centile)
Detects movement toward or away from the median and is more sensitive then centile changes
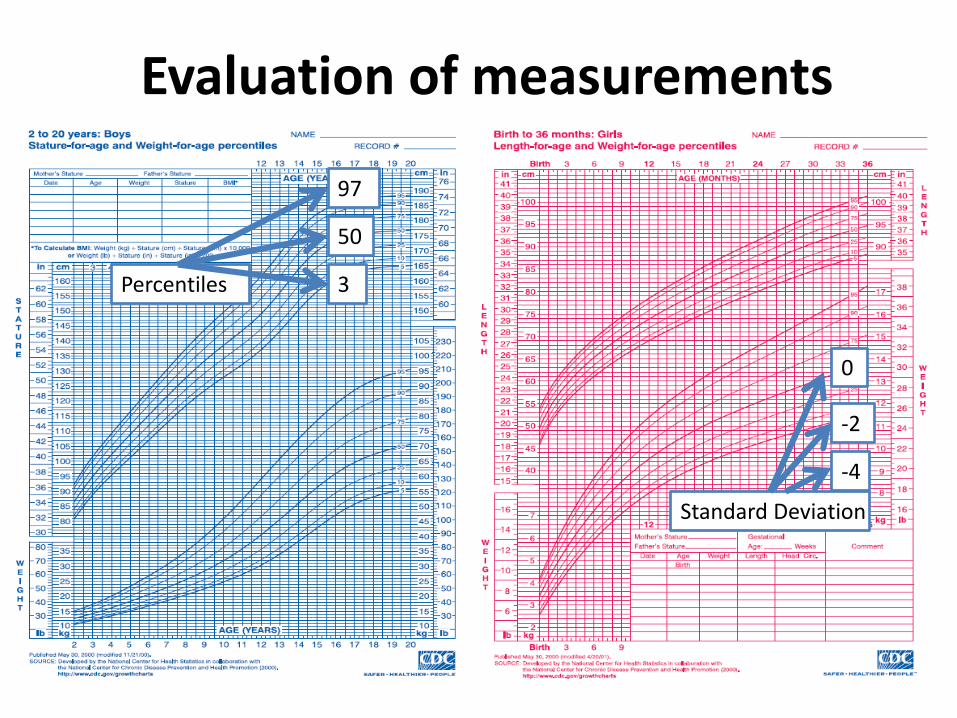
Percentiles 3
50
97
Standard Deviation
-4
-2
0
Evaluation of measurements

Definitions and Criteria
MildMalnutrition
Moderate Malnutrition Severe Malnutrition
Gomez 75-90%Standard WT
60-74% standard WT <60% standard WT
Tanner <5th percentile WT for HT
Waterlow 80-90% weight for height
70-80% WT for HT <70% WT for HT
WHO <-2 to -3 SDS WT for HT <-3 SDS WT for HT
Olsen BMI, Weight and length for age <5th percentile. Wt deceleration crossing more than 2 major % lines
Physical Examination
• Loss of fatty tissue and muscle strength
• Signs of malnutrition or micronutrient deficiency
• Thorough exam of skin, hair, nails, oral cavity, teeth and skelet
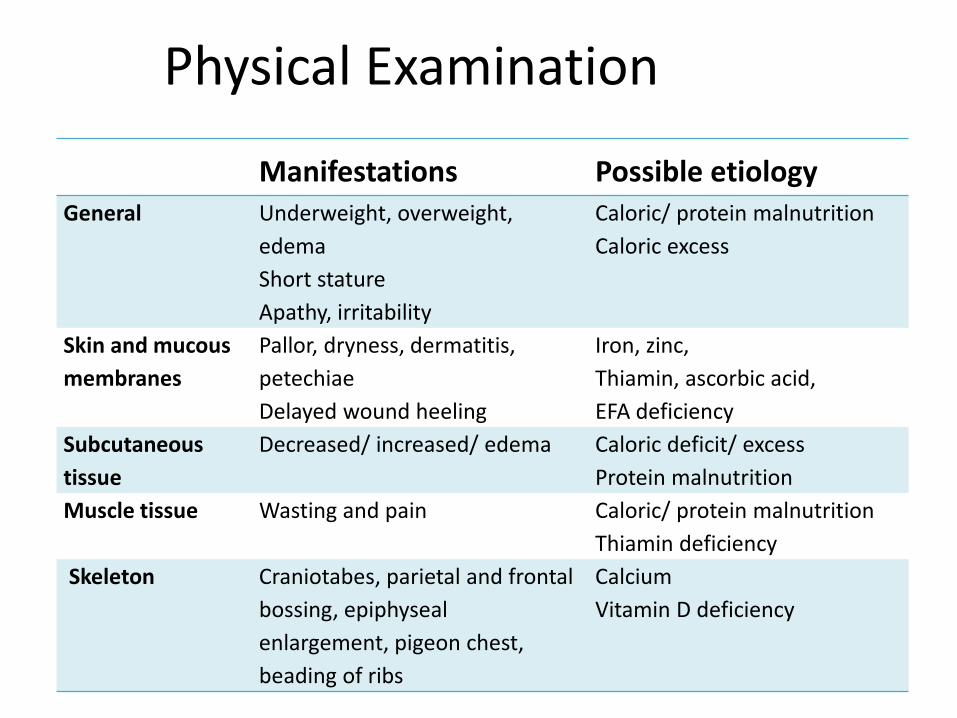
Physical Examination
Manifestations Possible etiologyGeneral Underweight, overweight,
edema
Short stature
Apathy, irritability
Caloric/ protein malnutrition
Caloric excess
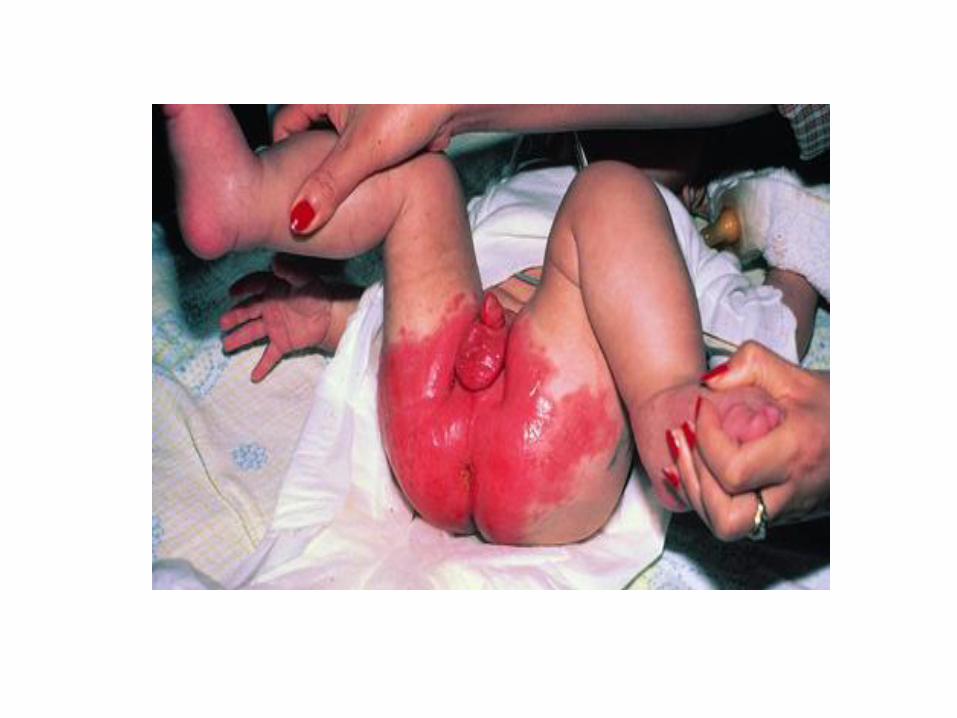
Skin and mucous
membranes
Pallor, dryness, dermatitis,
petechiae
Delayed wound heeling
Iron, zinc,
Thiamin, ascorbic acid,
EFA deficiency
Subcutaneous
tissue
Decreased/ increased/ edema Caloric deficit/ excess
Protein malnutrition
Muscle tissue Wasting and pain Caloric/ protein malnutrition
Thiamin deficiency
Skeleton Craniotabes, parietal and frontal
bossing, epiphyseal
enlargement, pigeon chest,
beading of ribs
Calcium
Vitamin D deficiency
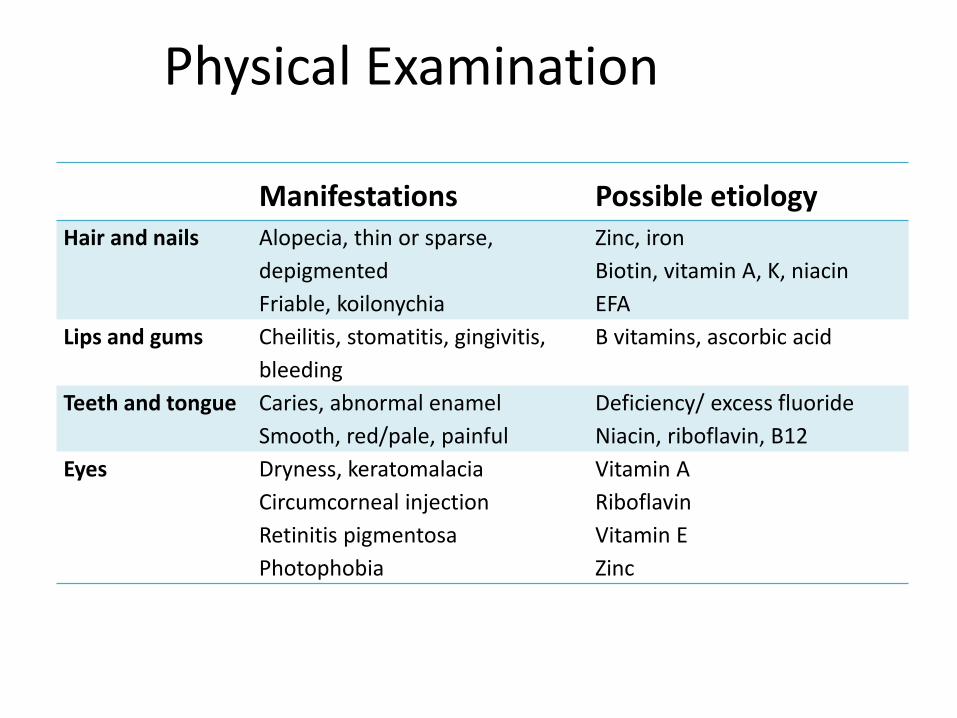
Physical Examination
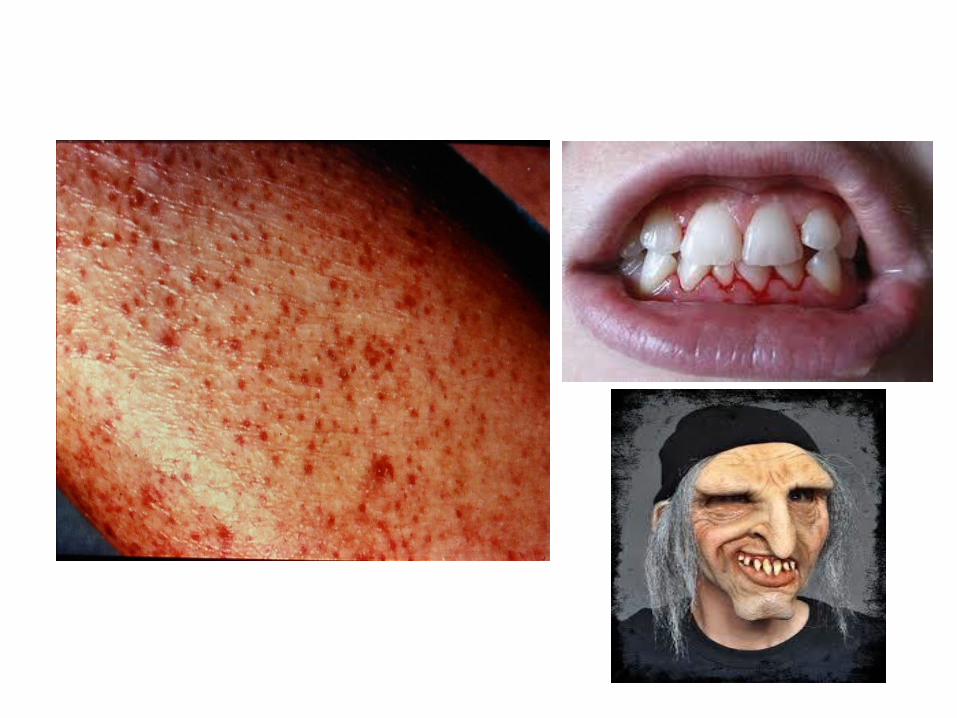
Manifestations Possible etiologyHair and nails Alopecia, thin or sparse,
depigmented
Friable, koilonychia
Zinc, iron
Biotin, vitamin A, K, niacin
EFA
Lips and gums Cheilitis, stomatitis, gingivitis,
bleeding
B vitamins, ascorbic acid
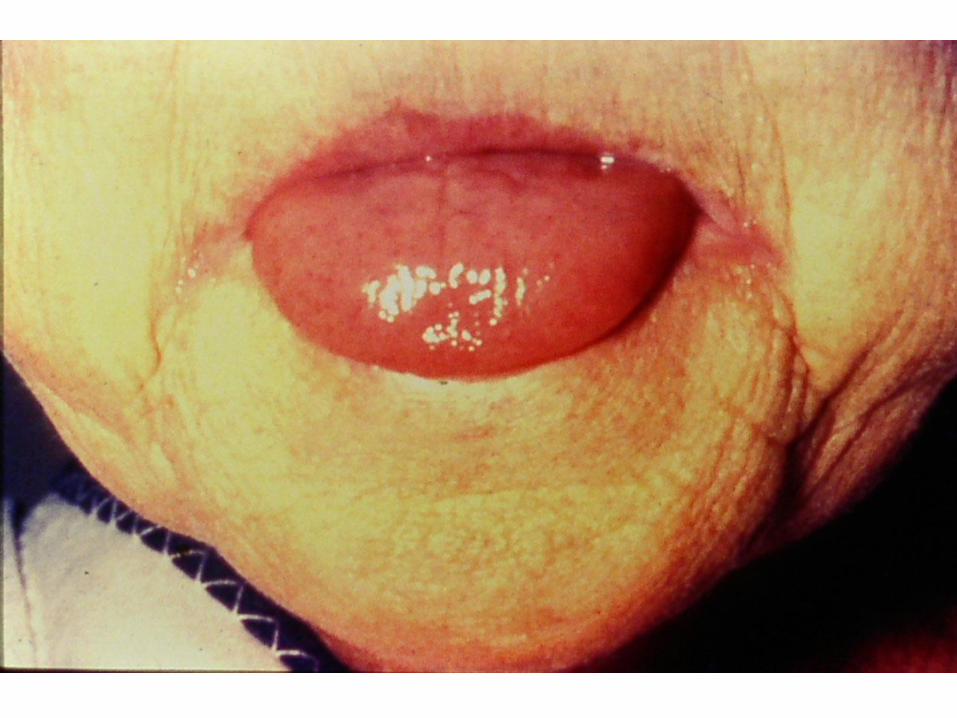
Teeth and tongue Caries, abnormal enamel
Smooth, red/pale, painful
Deficiency/ excess fluoride
Niacin, riboflavin, B12
Eyes Dryness, keratomalacia
Circumcorneal injection
Retinitis pigmentosa
Photophobia
Vitamin A
Riboflavin
Vitamin E
Zinc

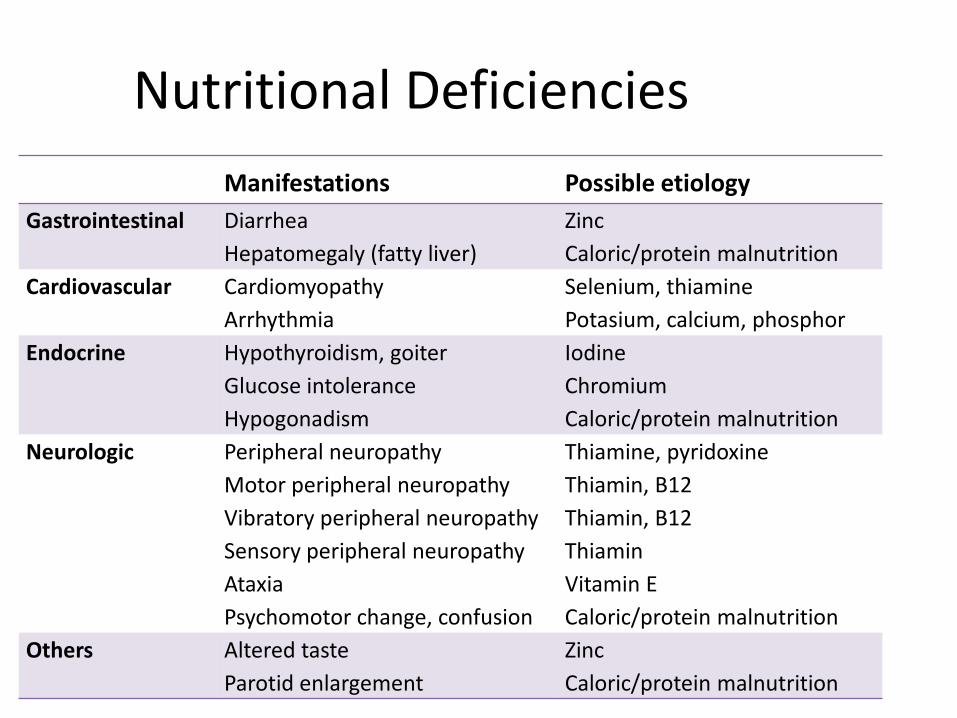
Nutritional Deficiencies
Manifestations Possible etiology
Gastrointestinal Diarrhea
Hepatomegaly (fatty liver)
Zinc
Caloric/protein malnutrition
Cardiovascular Cardiomyopathy
Arrhythmia
Selenium, thiamine
Potasium, calcium, phosphor
Endocrine Hypothyroidism, goiter
Glucose intolerance
Hypogonadism
Iodine
Chromium
Caloric/protein malnutrition
Neurologic Peripheral neuropathy
Motor peripheral neuropathy
Vibratory peripheral neuropathy
Sensory peripheral neuropathy
Ataxia
Psychomotor change, confusion
Thiamine, pyridoxine
Thiamin, B12
Thiamin, B12
Thiamin
Vitamin E
Caloric/protein malnutrition
Others Altered taste
Parotid enlargement
Zinc
Caloric/protein malnutrition
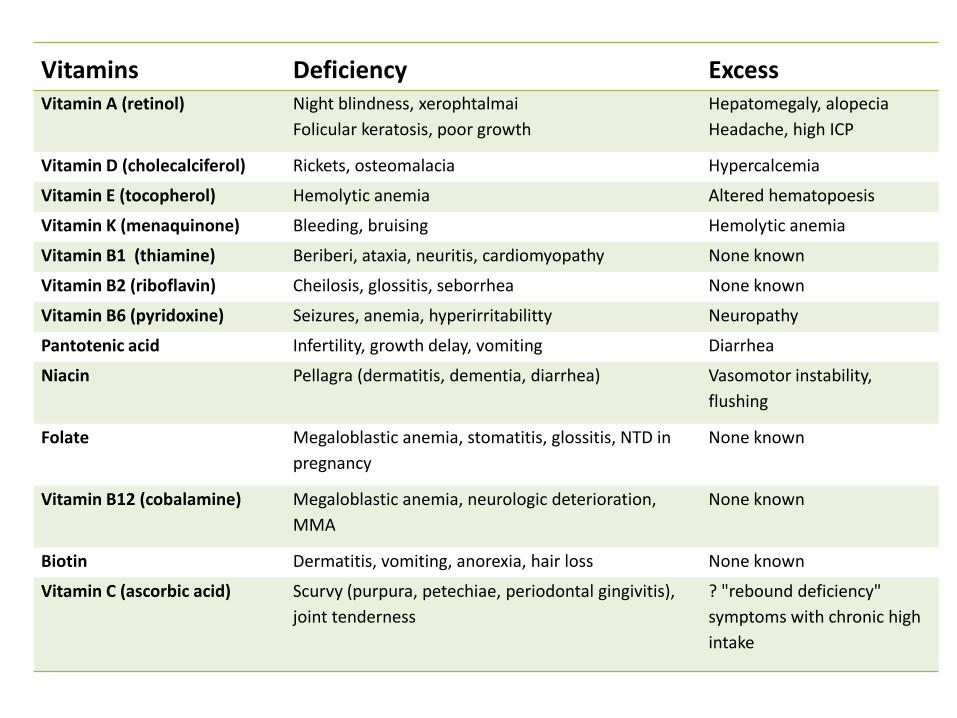
Vitamins Deficiency ExcessVitamin A (retinol) Night blindness, xerophtalmai
Folicular keratosis, poor growth
Hepatomegaly, alopecia
Headache, high ICP
Vitamin D (cholecalciferol) Rickets, osteomalacia Hypercalcemia
Vitamin E (tocopherol) Hemolytic anemia Altered hematopoesis
Vitamin K (menaquinone) Bleeding, bruising Hemolytic anemia
Vitamin B1 (thiamine) Beriberi, ataxia, neuritis, cardiomyopathy None known
Vitamin B2 (riboflavin) Cheilosis, glossitis, seborrhea None known
Vitamin B6 (pyridoxine) Seizures, anemia, hyperirritabilitty Neuropathy
Pantotenic acid Infertility, growth delay, vomiting Diarrhea
Niacin Pellagra (dermatitis, dementia, diarrhea) Vasomotor instability,
flushing
Folate Megaloblastic anemia, stomatitis, glossitis, NTD in
pregnancy
None known
Vitamin B12 (cobalamine) Megaloblastic anemia, neurologic deterioration,
MMA
None known
Biotin Dermatitis, vomiting, anorexia, hair loss None known
Vitamin C (ascorbic acid) Scurvy (purpura, petechiae, periodontal gingivitis),
joint tenderness
? "rebound deficiency"
symptoms with chronic high
intake

erum proteins
Plasma protein
Pool size and half-life
Plasma level Factors of variation
Albumin Large pool sizeHalf life: 15-20 days
36-45 g/l Protein-energy malnutritionLiver failureProtein-losing enteropathyProtracted infectious state
Thyroxin-binding pre-albumin
Small pool sizeHalf life: 2-3 days
0,32-0,35 g/l Protein-energy malnutritionLiver diseaseHyperthyroidismInflammatory disease
Goulet. Baillieres Clin Gastroenterol.1998.
Biochemical parameters
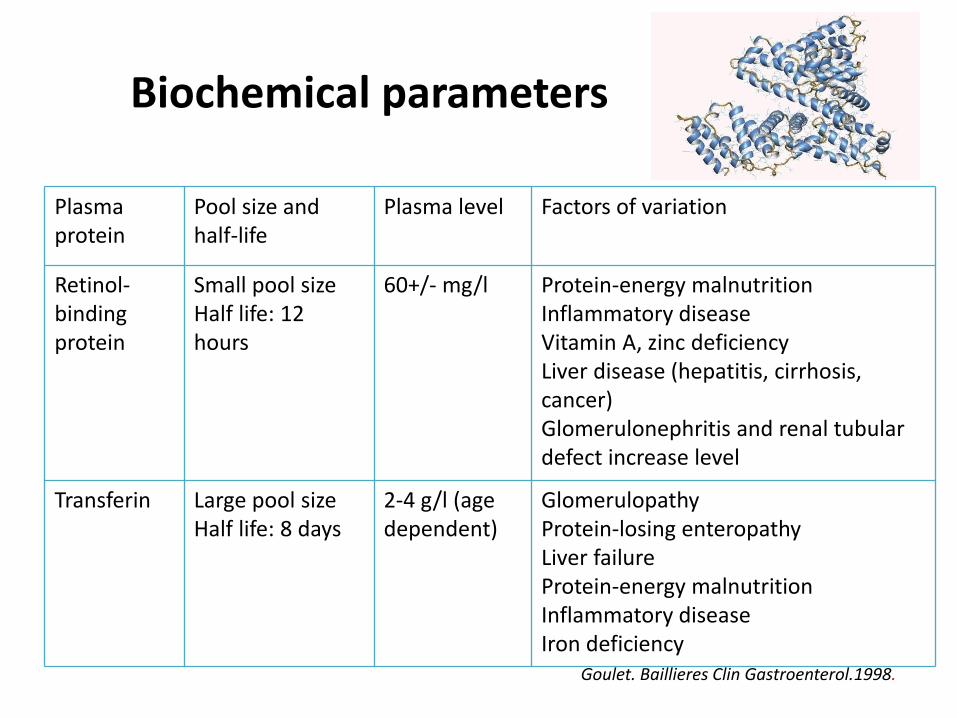
erum proteinsPlasma protein
Pool size and half-life
Plasma level Factors of variation
Retinol-binding protein
Small pool sizeHalf life: 12 hours
60+/- mg/l Protein-energy malnutritionInflammatory diseaseVitamin A, zinc deficiencyLiver disease (hepatitis, cirrhosis, cancer)Glomerulonephritis and renal tubular defect increase level
Transferin Large pool sizeHalf life: 8 days
2-4 g/l (age dependent)
GlomerulopathyProtein-losing enteropathyLiver failureProtein-energy malnutritionInflammatory diseaseIron deficiency
Biochemical parameters
Goulet. Baillieres Clin Gastroenterol.1998.
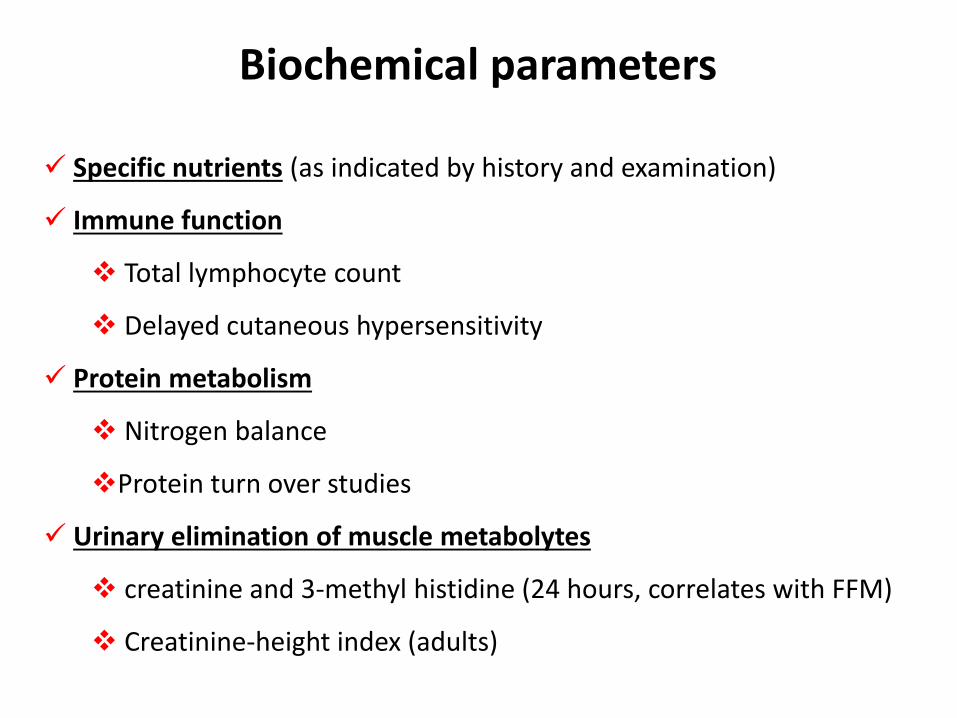
Specific nutrients (as indicated by history and examination)
Immune function
Total lymphocyte count
Delayed cutaneous hypersensitivity
Protein metabolism
Nitrogen balance
Protein turn over studies
Urinary elimination of muscle metabolytes
creatinine and 3-methyl histidine (24 hours, correlates with FFM)
Creatinine-height index (adults)
Biochemical parameters
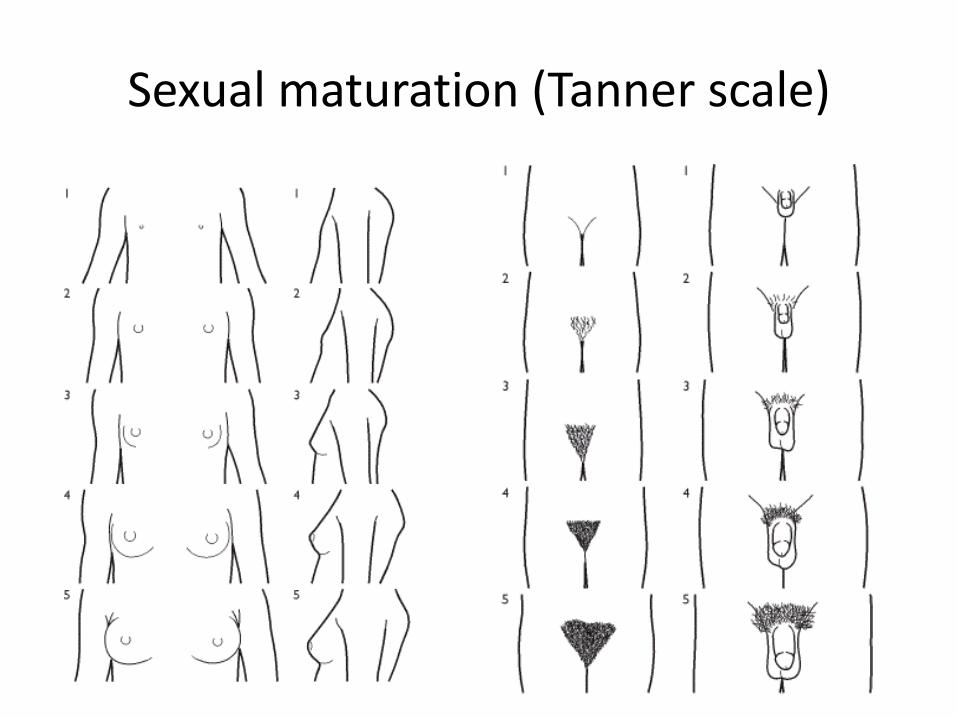
Sexual maturation (Tanner scale)
Measured in:
Stunted growth
Pubertal delay
Pubertal advance
X-ray of left wrist
Skeletal maturation
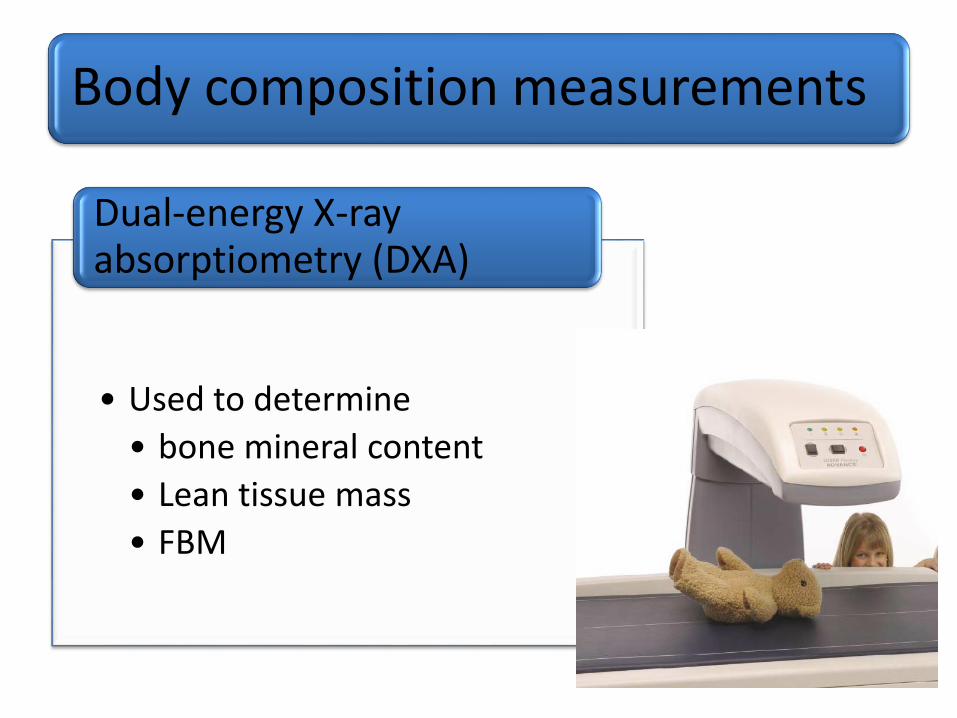
Body composition measurements
• Used to determine
• bone mineral content
• Lean tissue mass
• FBM
Dual-energy X-ray absorptiometry (DXA)
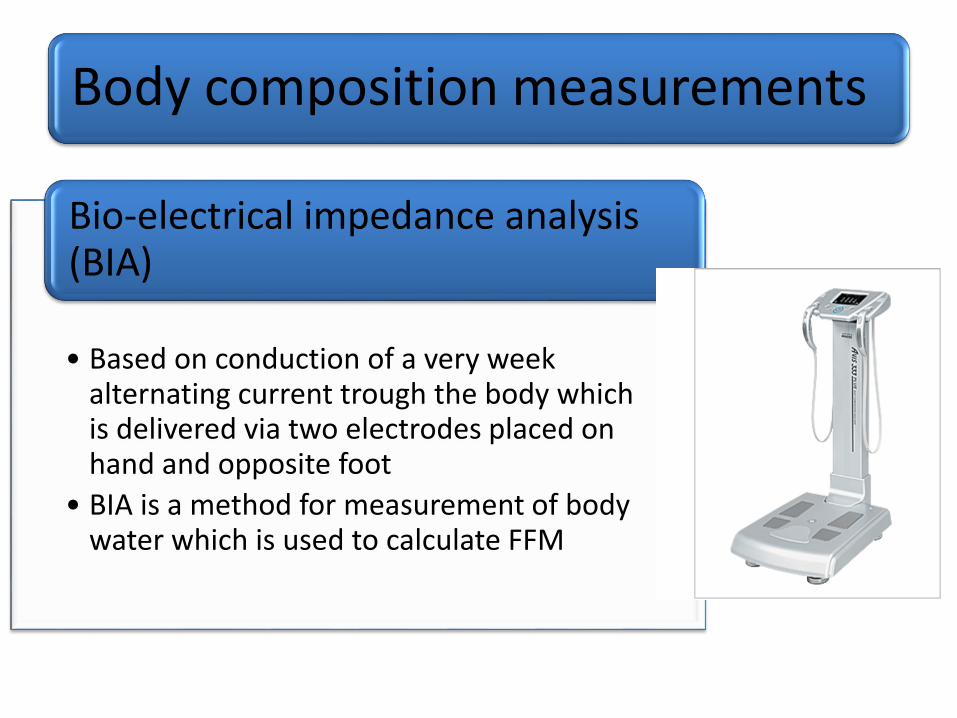
Body composition measurements
• Based on conduction of a very week alternating current trough the body which is delivered via two electrodes placed on hand and opposite foot
• BIA is a method for measurement of body water which is used to calculate FFM
Bio-electrical impedance analysis (BIA)
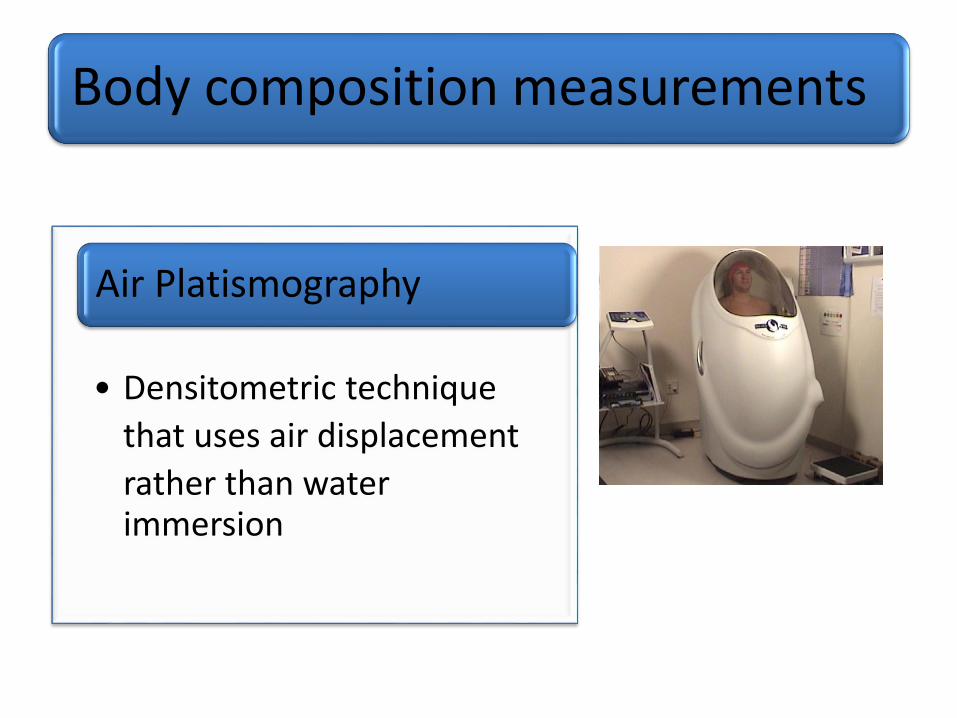
Body composition measurements
• Densitometric technique
that uses air displacement
rather than water immersion
Air Platismography
Nutritional screening
• Rapid and simple process conducted by admitting staff or community health care teams-defining patients who are at risk or not at risk of malnutrition
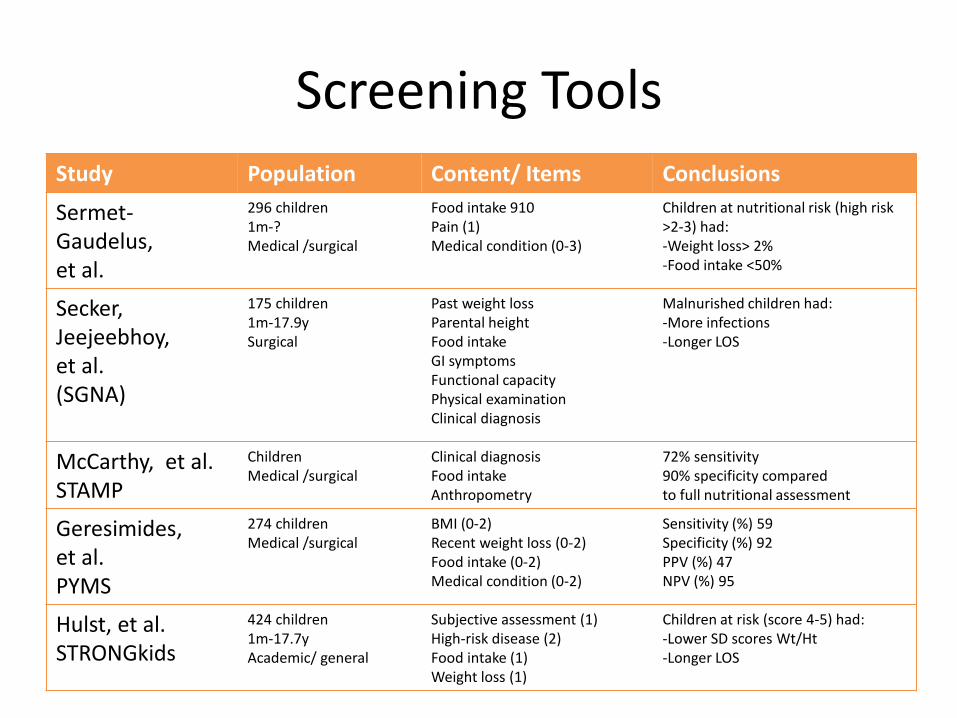
Screening ToolsStudy Population Content/ Items Conclusions
Sermet-Gaudelus,et al.
296 children1m-?Medical /surgical
Food intake 910Pain (1)Medical condition (0-3)
Children at nutritional risk (high risk >2-3) had:-Weight loss> 2%-Food intake <50%
Secker, Jeejeebhoy, et al.(SGNA)
175 children1m-17.9ySurgical
Past weight lossParental heightFood intakeGI symptomsFunctional capacityPhysical examinationClinical diagnosis
Malnurished children had:-More infections-Longer LOS
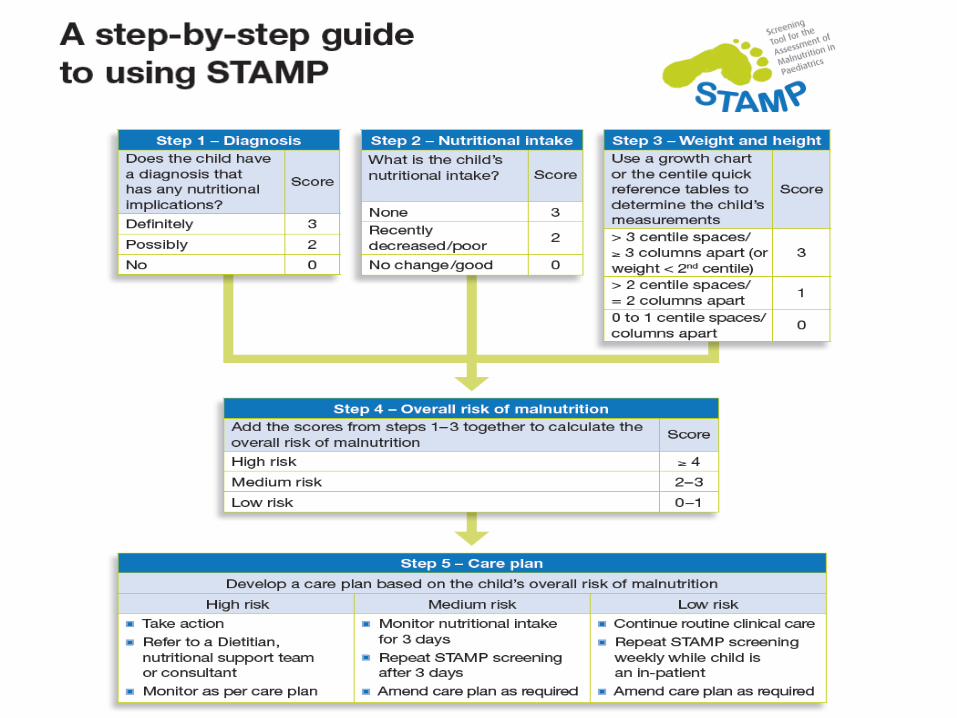
McCarthy, et al.STAMP
ChildrenMedical /surgical
Clinical diagnosis Food intakeAnthropometry
72% sensitivity90% specificity comparedto full nutritional assessment
Geresimides, et al.PYMS
274 childrenMedical /surgical
BMI (0-2)Recent weight loss (0-2)Food intake (0-2)Medical condition (0-2)
Sensitivity (%) 59Specificity (%) 92PPV (%) 47NPV (%) 95
Hulst, et al.STRONGkids
424 children1m-17.7yAcademic/ general
Subjective assessment (1)High-risk disease (2)Food intake (1)Weight loss (1)
Children at risk (score 4-5) had:-Lower SD scores Wt/Ht-Longer LOS