
Nutrition in Workplace -...
47
Nutrition in Workplace AHMAD SYAFIQ, PHD & DR. SANDRA FIKAWATI, MPH CENTER FOR NUTRITION AND HEALTH STUDIES UNIVERSITAS INDONESIA 02 NOVEMBER 2017
Transcript of Nutrition in Workplace -...

Nutrition in Workplace
AHMAD SYAFIQ, PHD & DR. SANDRA FIKAWATI, MPH
CENTER FOR NUTRITION AND HEALTH STUDIES
UNIVERSITAS INDONESIA
02 NOVEMBER 2017

Background
Workplace is a promising place for health promotion.
It has been estimated that over 80% of the companies
with 50 or more employees and almost all large
employers offer some kind of health improvement
programme.
The workplace offers structure to reach large groups and
social network that can be used.

Background
Is it effective? Not necessarily, because:
(1) a low, selective participation,
(2) lack of adherence to the programme, and
(3) an intervention period too short for sustainable
behaviour change.

Existing Systematic Review
Shain and Kramer, 2004
Hutchinson and Wilson, 2011
Blake et al., 2013
Montano et al., 2014
Coffeng et al., 2014
SchrÖer, Haupt, and Pieper, 2014

Main findings (Shain and Kramer, 2004)
Health promotion programmes will only be effective in
enhancing the health status of the workforce when the
interventions attend to both individual and environmental
influences.
Focusing on personal health practices through programmes
targeted exclusively at individual behaviour is likely to yield
minimal benefits compared with interventions that also target
the organization and design of work as key influences on health.
A comprehensive approach to health promotion in the
workplace is therefore one in which both individual and
organisational influences on health are targeted simultaneously.

Main findings (Hutchinson and Wilson , 2011)
The current meta-analysis found most support for workplace
interventions that used motivation enhancement such as
motivational interviewing or the use of rewards. Therefore, future
interventions targeting the diet or physical activity of employees
should incorporate this approach in their programmes.
Interventions that were associated with one main area of change
(e.g. diet OR physical activity OR health) were associated with larger
mean effect sizes.
In terms of study design, randomized controlled trials were
associated with larger effects. Long-term maintenance of changes
should also be evaluated in order to determine the extent to which
workplace interventions can make sustainable changes to
individuals’ health.

Main findings (Blake et al., 2013)
This work demonstrates that workplace interventions are
achievable in NHS workplace settings, and confer positive
outcomes in those organisations where employers
demonstrate a commitment to health and wellness that is fully
integrated with their mission, values and long-term vision.
However, to generate significant behaviour change in a
range of target health behaviours, such schemes need to be
flexible and continually responsive to its consumers; as such it
should be recognised that wellness programmes require
continual adjustment to alter the targeting of activities in
response to user need.

Main findings (Montano et al., 2014)
The meta-analysis of 36 randomized controlled worksite intervention
studies revealed small, but significant effects on four relevant health
outcomes: weight reduction, healthy nutrition, reduced musculo-
skeletal symptoms, and lower levels of perceived stress.
As only few studies were conducted among employees with lower
socioeconomic standing, the challenge of reducing work-related
health inequalities by targeting health-promoting activities at
occupational groups with high needs remains largely unmet.
Due to lack of statistical power, our study could not confirm a
moderation of intervention effects by occupational class. Nonetheless,
future research should aim at bridging worksite intervention research
with scientific inquiry into social determinants of health

Main findings (Coffeng et al., 2014)
This study aimed to evaluate the effectiveness of combined worksite social and physical environmental intervention on several work-related outcomes, as well of both interventions separately. In comparison with the control group, statistically significant, but small, changes in contextual performance, dedication, task performance and absorption were found.
The interventions did not demonstrate a significant effect on presenteeism and absenteeism, but all of them were in the expected direction.
Some recommendations: engage mid level management (i.e. mid level managers/supervisors should integrate the health program into daily operations and communicate with employees to optimiseparticipation; link health promotion objectives to business objectives and consider incentives and rewards.

Main findings (SchrÖer, Haupt, and Pieper, 2014)
Workplace health promotion interventions may improve physical
activity, dietary behaviour and healthy weight. There is no evidence of
increased efficacy associated with specific intervention types.
Workplace health promotion should focus on either physical activity or
weight or nutrition behaviour to maximize effectiveness. Best evidence
is available for multi-component interventions.
Our review found that employees’ dietary behaviour could be
influenced by workplace interventions based on nutritional education
solely or combined with environmental modifications.
Physical activity was increased by multi-component interventions
including step counting, active commuting & organizational changes.
Multi-component programmes were most effective in promoting a
healthy weight among employees.

INDOFOOD NUTRITION
FOR WORKFORCE PROGRAM
CENTER FOR NUTRITION AND HEALTH STUDIES UNIVERSITAS INDONESIA

Introduction (1)
Nutrition and health status of worker is key to industrial
productivity. Good nutritional status relates to both
physical and mental performances and directly
related to morbidity and absenteeism.
Good nutrition also influence work safety. Lack of
focus and concentration, less agility and less dexterity
could be caused by malnutrition and could affect
work-related injury.
12

Introduction (2)
Nutrition program in workplace has not been paid
sufficient attention so far in Indonesia. Workplace
provide ample opportunity for effective nutrition
intervention.
Indofood committed to improve life quality of its
workers through improvement of healthy lifestyle
and creating workplace environment that enable
workers to apply healthy lifestyle.
13

Introduction (3)
It is very important to have initial nutrition assessment:
Baseline situation of nutrition perception
Nutrition situation mapping
Guide for program priorities
Baseline to measure achievement
Includes:
Health and nutrition status,
Food consumption situation,
Built environment situation, and
Nutrition knowledge, attitude and practice
14

Objectives
To compile, to analyze, and to describe nutrition
and health situation in selected factories.
To increase nutrition and health knowledge,
attitude, and practice of workers
To develop program monitoring and evaluation
based on evidences and reliable, valid
measurements
To develop Lessons Learn Model as a sustainable
knowledge management action
15

Activities
4 activities :
1. Nutrition Assessment (Baseline and Endline Survey);
2. Main Intervention: Nutrition education for workers;
3. Modification of nutrition built environment; and
4. Development of mon-ev system and lessons learn
model.
16

Nutrition Assessment
(Baseline & Endline Survey) (1)
Food consumption study
2X24 hr recall
Lab examination
Hb level
Anthropometric
Weight
Height
Body fat

Nutrition Assessment
(Baseline & Endline Survey) (2)
Medical history
MCU record
Nutrition KAP Survey
Questionnaire
Physical activity and fitness measurement
Daily activity
Fitness level

Main Intervention:
Nutrition Eduction for Workers (1)
1. Nutrition Seminars
Awareness raising seminar (1x @factory).
2. Educator Training
Nutrition educator are graduates from nutrition higher education D3-S1 level

Main Intervention:
Nutrition Eduction for Workers (2)
3. Peer Educator Trainings
25 peer educators in each factory (2x @factory).
4. Peer Educator Refreshing Trainings
Recharging for peer educator and mon-ev data collection (4x@factory).

Modification of Nutrition Built Environment(1)
1. Assessment of Food Consumption EnvironmentCanteen, cafeteria, and other sources of workers’ food
consumption
2. Assessment of Healthy Lifestyle EnvironmentAssessing healthy lifestyle supporting environment such
as hand washing facilities, latrines, waste bins, etc
3. Assessment of Lactation SupportAssessing lactation situation among female workers and
the supporting environment in workplace

Modification of Nutrition Built Environment(2)
4. Assessment of Fitness Facility
Assessing fitness facilities and fitness activities
provided in factory
5. Evaluation of Assessment Results
To be concluded and followed up by management

Development of Monev System and
Lessons Learn Model (1)
1. Monev system is developed for each activity using
input, process, and output indicators
2. Final evaluation would assess objectives
achievement including outcome indicators
3. Lessons Learn Model is developed by compiling
success stories and failure stories as to make tacit
knowledge and experiences to be more explicit
and documented for future development
23

24
Pemaparan materi antropometri oleh Bapak Wahyu Enumerator sedang memperhatikan materi pelatihan
Enumerator praktik pengukuran tinggi badan Enumerator melakukan praktek penggunaan BIA
Antropometry assesment training Training for enumerators

25
Kegiatan Pengumpulan Data di Pabrik Indolakto – Jakarta
Wawancara dan Pengisian Kuesioner
Pengukuran Hemoglobin
Data collection’s activities in Factory 1
Interview and fill in questionnaires
Haemoglobin assesment

26
Kegiatan Seminar Gizi Karyawan di Pabrik Noodle – Bandung
Pembukaan oleh Ibu Dwi dari Indofood Jakarta Sambutan Pak Satrio Pabrik Noodle
Karyawan sedang mengisi pre-test Seminar Gizi Pemaparan materi seminar gizi oleh Ibu Trini
Karyawan “ICE BREAKING COCONUT” Sesi tanya jawab karyawan
Nutrition seminars’ activities in Factory 2
Opening ceremony by Ibu Dwi Opening ceremony by Factory 2’s representative
Ice breaking “Coconut’Discussion

27
MEDIA SEMINAR GIZI
Modul Seminar Gizi Modul Peer Educator
Kalender
Nutrition Media
28
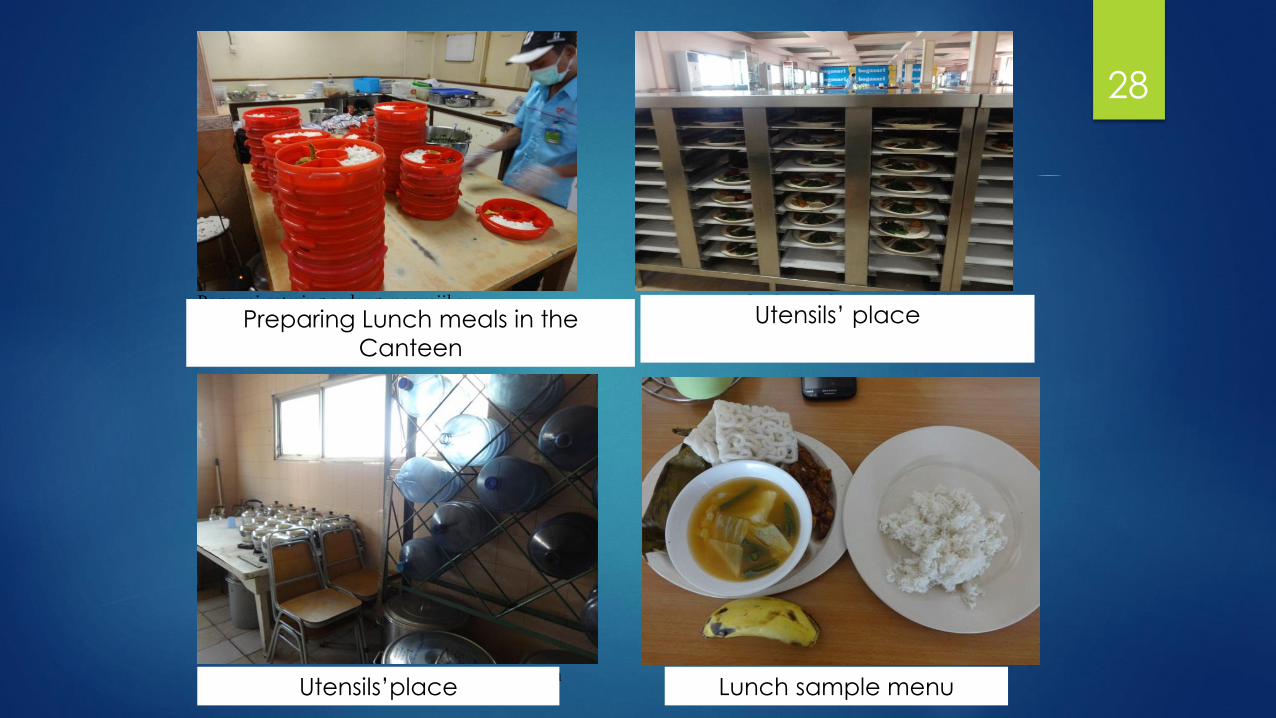
Pegawai catering sedang menyajikan Tempat peletakan makanan yang telah
porsi makan untuk pegawai yang tidak dapat disajikan sementara
meninggalkan lokasi seperti satpam
Tempat penyimpanan alat masak dan alat makan Menu makanan
Preparing Lunch meals in the
Canteen
Utensils’ place
Utensils’place Lunch sample menu

29
Meeting with Japan Ministry for Workforce & Industry and PT Indofood
17 November 2016

Results

Nutrition KAP

1. Increased Knowledge
Factory 1 Factory 2 Factory 3 Factory 4 Total
n 185 248 114 157 704
Mean
Pretest 56.65 54.32 54.78 57.33 55.67
Posttest 60.30 58.57 61.49 66.21 61.20
Gap 3.65 4.25 6.71 8.88 5.53
p-value pre-post 0.001* 0.001* 0.001* 0.001* 0.001*
Note:
Minimum-Maximum score: 0-100
Number of question: 20
*) p-value < α (5%)
• In total, there was significant increase in
knowledge score from 55.67 to 61.20

2. Slightly better attitude
Factory 1 Factory 2 Factory 3 Factory 4 Total
n 185 248 114 157 704
Mean
Pretest 3.80 3.77 3.81 3.75 3.78
Posttest 3.86 3.78 3.86 3.78 3.82
Gap (mean) 0.06 0.01 0.05 0.03 0.04
p-value pre-post 0.022* 0.647 0.154 0.320 0.014*
Note:
Minimum-Maximum Score: 1-5
Number of question: 10
The highest the score, the better the attitude
*) p-value < α (5%)

3. Increased nutrition
practices
Factory 1 Factory 2 Factory 3 Factory 4 Total
n 185 248 114 157 704
Mean
Pretest 44.23 45.56 49.42 52.02 47.28
Posttest 53.87 48.99 56.87 58.28 53.62
Gap 9.64 3.43 7.45 6.26 6.34
p-value pre-post 0.001* 0.017* 0.001* 0.001* 0.001*
Note:
Minimum-Maximum score: 0-100
Number of question: 6
*) p-value < α (5%)
• In total, there was significant increase on
nutrition practice score from 47.28 to 53.62

Healthy Lifestyle

Increased Score of Healthy Lifestyle
Note:
Minimum-Maximum Score: 0-100
Number of question: 8
The highest the score, the better the
attitude
*) p-value < α (5%)
Blue Collar
(porter)
Blue Coll
Operator
White
CollarTotal
n 137 355 212 704
Mean
Pretest 22,35 22,64 28,13 24,24
Posttest 22,54 27,32 30,25 27,27
Gap 0,19 4,68 2,12 3,03
p-value
pre-post0,919 0,000* 0,131 0,000*
Based on Factory Based on Employee Type
Factory 1 Factory 2 Factory 3 Factory 4 Total
n 185 248 114 157 704
Mean
Pretest 30,27 19,96 20,61 26,51 24,24
Posttest 27,77 26,06 23,14 31,61 27,27
Gap -2,5 6,1 2,53 5,1 3,03
p-value
pre-post0,122 0,000* 0,144 0,001* 0,000*
• In total, there was significant increase on score of
healthy lifestyle. However, the score is considered low.

Slight decrease in smoking habit
63.8
48.456.1
48.453.7
59.5
44.4
56.149.7 51.4
0.0
20.0
40.0
60.0
80.0
100.0
Indolakto Noodle NSF Bogasari Total
75.9
51.3
43.4
53.7
73.7
48.741.5
51.4
0.0
20.0
40.0
60.0
80.0
100.0
Buruh angkut Operator Karyawan Total
Pre test Post test
Based on factory Based on employee type
Blue collar/porter White collarFactory1 Factory2 Factory3 Factory4

Body Mass Index

Body Mass Index Categories Based on
Employee Type
4.4
51.145.5
4.5
49.645.9
3.8
44.351.9
4.3
48.3 47.4
3.6
4650.4
3.4
46.8 49.9
4.3
44.351.4
3.7
45.950.4
0
20
40
60
80
100
Kurus Normal Gemuk Kurus Normal Gemuk Kurus Normal Gemuk Kurus Normal Gemuk
Buruh Pabrik (angkut) Operator Karyawan Total
Pre test Post test
The intervention was successful in decreasing IMT among White Collar employees but not
among Blue Collar employees yet.
underweight overweight underweight underweight underweightoverweight overweight overweight
Blue collar/porter White collar

Haemoglobin

Haemoglobin
21.3
78.7
0
23.9
75.5
0.6
27.8
71.7
0.5
24.6
75
0.4
10.3
89
0.7
18.6
80.6
0.8
23.1
76.4
0.5
18.3
80.9
0.70
20
40
60
80
100
Kurang Normal Lebih Kurang Normal Lebih Kurang Normal Lebih Kurang Normal Lebih
Buruh Pabrik (angkut) Operator Karyawan Total
Pre test Post test
< >
<
<< > > ><
All employees, regardless of type, experienced increasing number of normal haemoglobin level.
Blue collar/porter White collar

Physical fitness

Respondents with good fitness level
Based on Factory
71.3 73.264.3
69.9
89.183.6 85.4 85.4
0.0
20.0
40.0
60.0
80.0
100.0
Buruh Pabrik
(angkut)*
Operator* Karyawan* Total*
Pre test Post test
81.286.1
48.352.3
69.9
83.3 88.393.3
77.685.4
0.0
20.0
40.0
60.0
80.0
100.0
Indolakto Noodle NSF* Bogasari* Total*
Based on Employee Type
*) significant at =0.05
There was significant increase on physical fitness level
Blue collar/porter*
White collar*Factory1 Factory2 Factory3* Factory4*

Conclusion Nutrition for Workforce Programme, in form of mass education and group
education through peer educator, in three months, was successfully increase:
Knowledge on balanced nutrition,
Attitude towards nutrition,
Nutrition practices,
Normal haemoglobin level, and
Physical fitness.
However, for BMI, the reduction was found among white collar employees but not among blue collar employees.
Monitoring system provided early evidence on the process and effectiveness
of the implementation. These, in turn, provided inputs for process and
implementation improvement.
Lessons Learn Model has been developed and revealed knowledge based
on experience (from tacit to explicit).

Conclusion Need to be maintained:
Pre-post test
Standardization of education material
Peer educator approach
Incentive/reward/recognition of peer educator
Integration to factory management
Evaluation for each factory
Characteristics of NfW: Education, measurement and
monitoring of nutritional status, employee empowerment

Conclusion Need to be changed:
Time constraints for peer education.
Regeneration and new recruitment of peer educator
Creative activities of peer educator

Thank You