
Nutrition Across the Lifespan for Healthy Aging: …/media/Files/Activity...2016/09/13 · Professor...
46
© Tufts University, Jean Mayer United States Department of Agriculture Human Nutrition Research Center on Aging Roger A. Fielding, PhD Director and Senior Scientist Professor of Nutrition and Medicine Nutrition, Exercise Physiology, and Sarcopenia Laboratory Nutrition Across the Lifespan for Healthy Aging: muscular systems. Food Forum Workshop September 13, 2016
Transcript of Nutrition Across the Lifespan for Healthy Aging: …/media/Files/Activity...2016/09/13 · Professor...

© Tufts University, Jean Mayer United States Department of Agriculture Human Nutrition Research Center on Aging
Roger A. Fielding, PhDDirector and Senior Scientist
Professor of Nutrition and MedicineNutrition, Exercise Physiology, and Sarcopenia Laboratory
Nutrition Across the Lifespan for
Healthy Aging: muscular systems.
Food Forum Workshop
September 13, 2016

Skeletal Muscle Matters!
• Makes up 45-50% of body mass
• Fundamental role in locomotion, O2 consumption, whole-body energy metabolism, and substrate turnover and storage
• Secretory organ (“myokines”)
• Robust skeletal muscle is a central factor in whole-body health and essential for maintaining energy homeostasis
Rivas & Fielding. Muscle. Encyclopedia of Human Nutrition (3rd Ed.) 2012
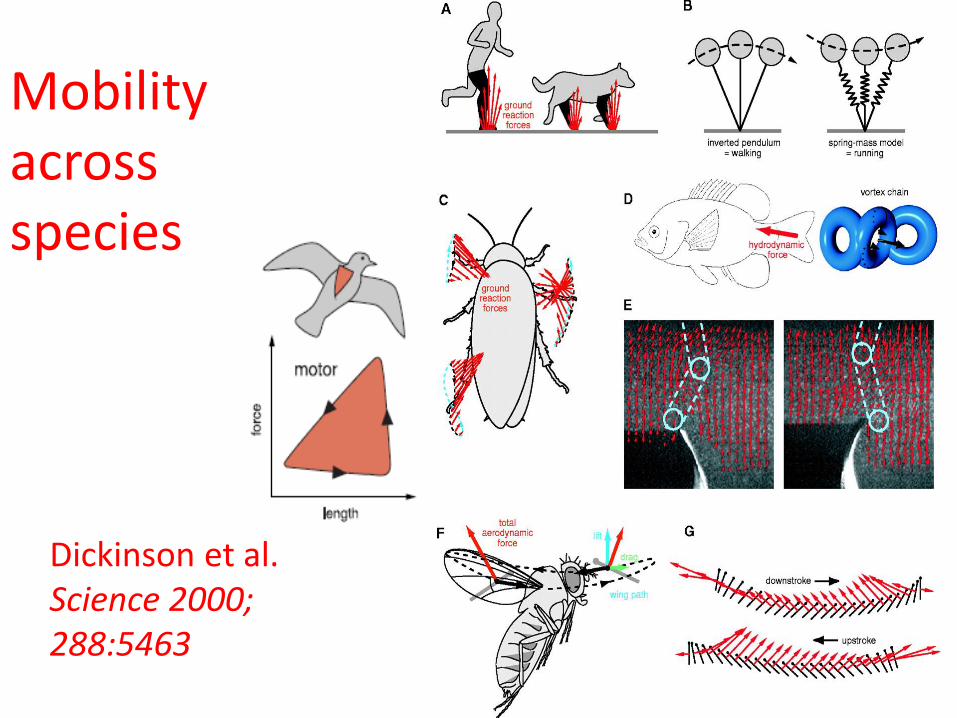
Mobility across species
Dickinson et al. Science 2000;288:5463

Aging drosophila and performance
Miller et al. Biophys J 2008;95:2391

Medicare Current Beneficiary SurveyAbility to walk ¼ mile, health care cost and
hospitalization rates
Hardy et al. J Gen Intern Med Online; 2010:Oct 23

Sarcopenia: Age-associated loss in muscle mass and function
Female 70 yrs.BMI = 23.3
Female 85 yrs.BMI = 24.6

STRENGTH-MASS CONVERGENCE:Correlation of Quadriceps Total
Muscle Area vs. Muscle Strength
t6lp1rm
2500200015001000500
To
tal M
uscle
Are
a
200.00
180.00
160.00
140.00
120.00
100.00
80.00
60.00
R Sq Linear = 0.676
R2 = 0.676

From Lauretani et al. 2003
Age-related loss in muscle performance
25% loss

Despite high prevalence & major implications
• Sarcopenia still has no:
– Broadly accepted clinical definition
– Consensus diagnostic criteria
– Treatment guidelines
• Since 2005 – renewed efforts to define sarcopenia:
– Several organizations from Europe and US
• October 2016 establishement of ICD 10 code for sarcopenia

Agreement Among SarcopeniaConsensus Definitions:
• All have included objective measure of muscle/lean mass.
• All have incorporated muscle weakness or reduced physical functioning into the definition.
• Encouraging evidence-based data from FNIH project.

11Partners for Innovation, Discovery, Health l www.fnih.org
Weakness and lean mass cut points:

What is the prevalence of sarcopenia among older adults?
• Range varies depend on operational definition employed
• Gender differences
• Increases with advancing age
• Depends on the population (health status, dietary patterns, comorbidities)
• Varies anywhere from 0.5 to 13% (FNIH data)

Prevalence of sarcopenia by definition:
Dam et al. J Gerontol; 2014 FNIH

Multifactorial origins of sarcopenia
Morley JE et al. J Clin Lab Med 2001
Decreased physical activity
Decreased number and increased irregularity of motor unit firing
Decreased anabolic hormones• Testosterone• DHEA• Growth hormone• Insulin Growth factor-I
Increased cytokine activity• Interleukin-1• Tumor Necrosis Factor-α• Interleukin-6-I
Anorexia of Aging
Increased homocysteine
Increased Atherosclerosis
Young muscle

Nutrition/physical activityinterventions*:
Dietary Interventions:– Protein nutrition/adequacy– Vitamin D intake/sufficiency– Other micronutrients (anti-inflammatory diet patterns, anti-oxidants,
B-vitamins)
Physical activity/Exercise interventions:– Resistance exercise– Aerobic exercise– Combined
Multi-modality interventions*Potentially important targets for therapy but may also be modifiers of response in Pharma trials.

Protein metabolism and sarcopenia
• Balance of protein synthesis and degradation
• Adequacy of dietary intake of protein in older adults
• Evidence of relationship between protein intake and change in muscle mass with aging

Metabolic Control of Muscle Mass
Biolo et al Am J Physiol, 1995
Synthesis – Breakdown = Net Balance
FREE AMINO ACID POOL
CONTRACTILE PROTEINS
BreakdownSynthesis
BloodAMINO ACIDS

Dietary protein intake and change in lean mass
Houston et al. J Gerontol 2008
Protein intake ranged from 0.7 to 1.1 g/kg/day
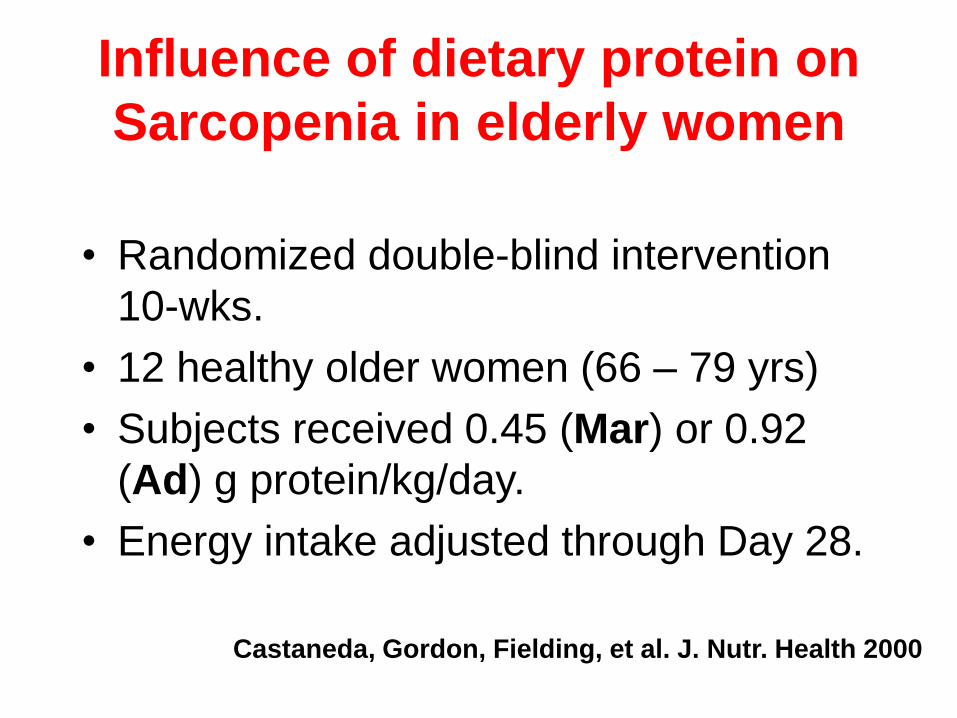
Influence of dietary protein on
Sarcopenia in elderly women
• Randomized double-blind intervention
10-wks.
• 12 healthy older women (66 – 79 yrs)
• Subjects received 0.45 (Mar) or 0.92
(Ad) g protein/kg/day.
• Energy intake adjusted through Day 28.
Castaneda, Gordon, Fielding, et al. J. Nutr. Health 2000
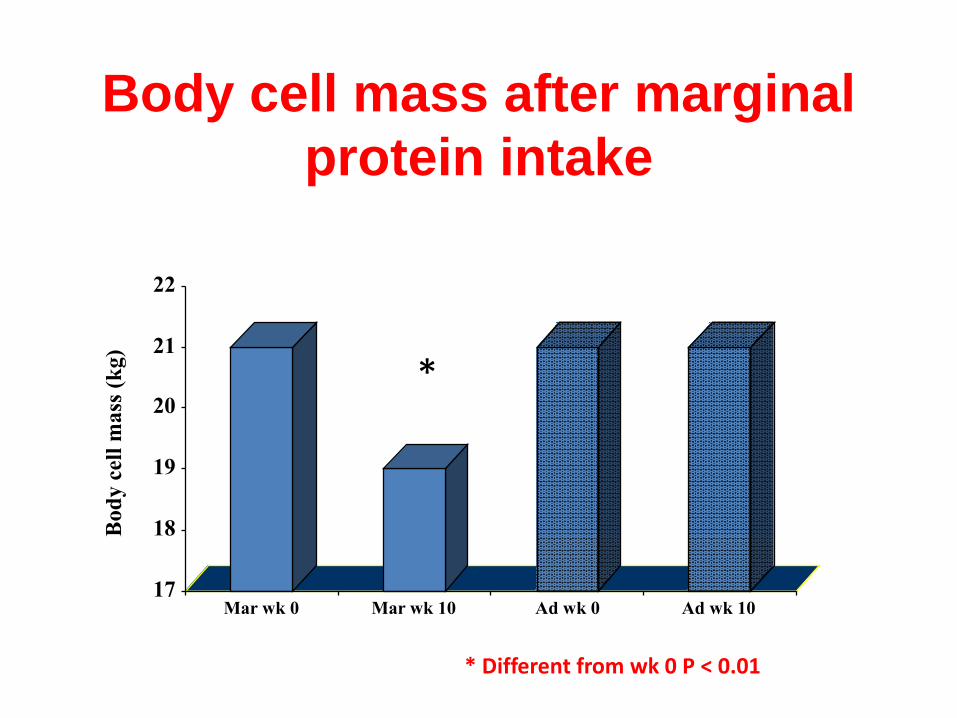
Body cell mass after marginal
protein intake
17
18
19
20
21
22
Bod
y c
ell
mass
(k
g)
Mar wk 0 Mar wk 10 Ad wk 0 Ad wk 10
*
* Different from wk 0 P < 0.01

Meta-analysis of protein supplementation/exercise and gains in lean
mass
Cermak, Van Loon 2012 Am J Clin Nutr
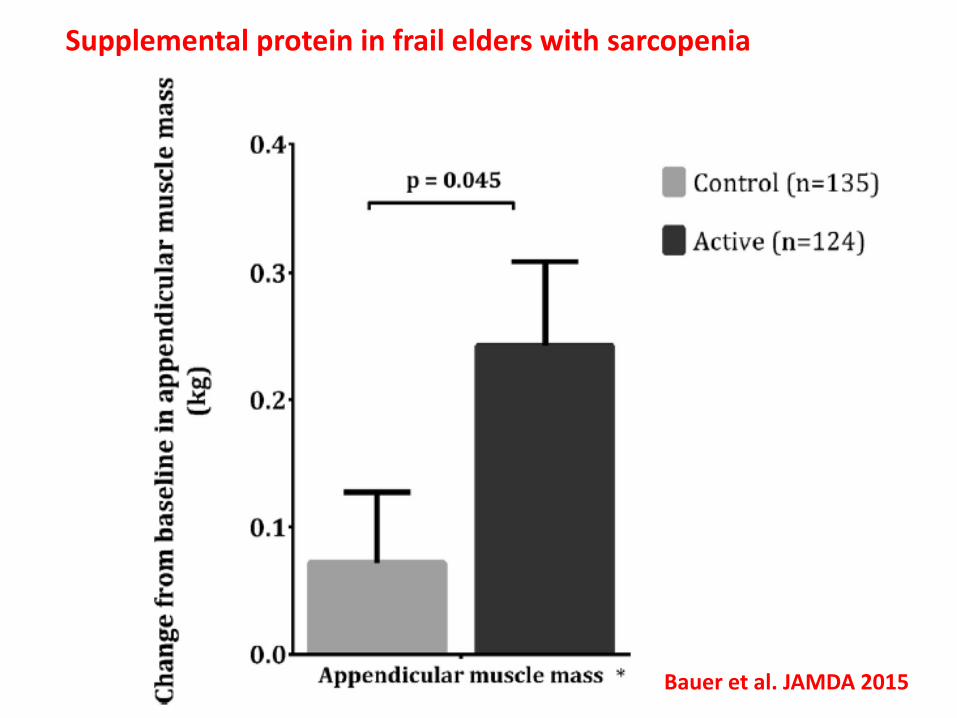
Bauer et al. JAMDA 2015
Supplemental protein in frail elders with sarcopenia

NHANES III – Serum 25(OH)D and Performance in Men and Women Age 60 and Older
Walk time Sit-to-stand
Bischoff-Ferrari HA. Am J Clin Nutr 2004;80:752-8.
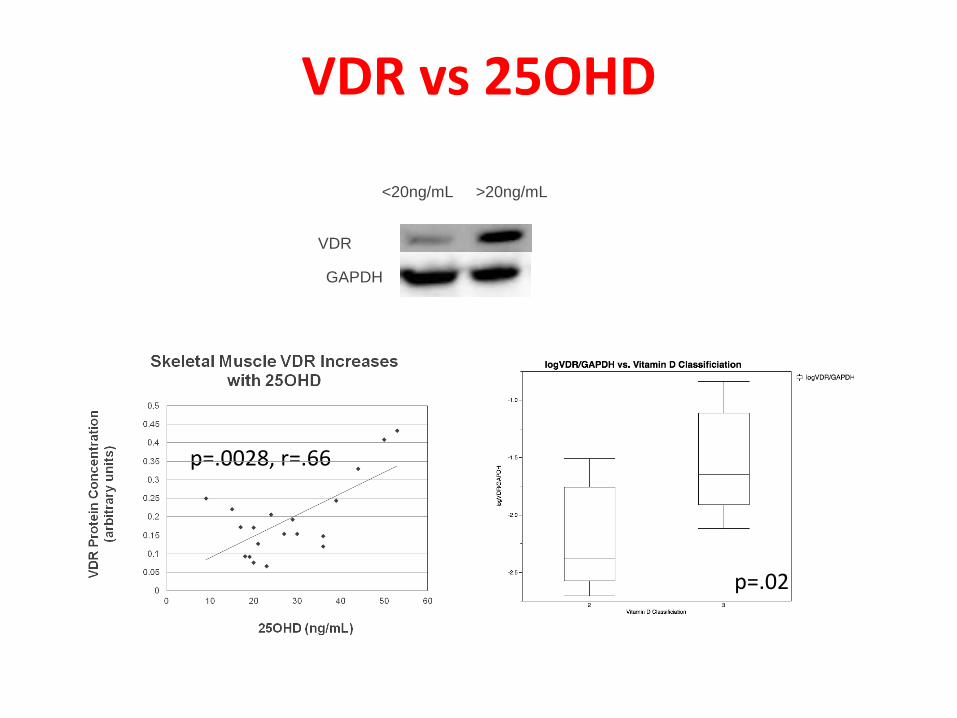
VDR vs 25OHD
p=.0028, r=.66
p=.02
<20ng/mL >20ng/mL
VDR
GAPDH

29% Increase in Nuclear VDR with D Supplementation
***
Niramitmahapanya et al,
2012 (unpublished)

Change in muscle size with Vitamin D
Ceglia et al. JCEM 2013

Objective definition linked to “hard” end points (mortality, falls, fractures).
Agreement on appropriate outcomes for efficacy and registration trials.
Establishment of treatment guidelines and billing codes (ICD 10 stablished).
Treatments are emerging but indications are lagging.
Awareness and Acceptance of Sarcopenia as a Clinical Syndrome/Disease has lagged: limited effective therapies currently available

Summary:• Sarcopenia is the age-
related loss in muscle mass and function.
• Nutritional factors related to protein intake and specific micronutrients affect sarcopenia progression.
• Nutritional interventions may play a role in the prevention and treatment of sarcopenia.


Bedrest and Aging
• 10 days complete bedrest
• 12 subjects, 67 ± 5 years
• Eucaloric diet, 0.8g protein/kg/d
• Body composition (DEXA)
• Fractional Synthetic Rate of muscle protein
– 24-h infusion of 13C6-phenylalanine, vastuslateralis biopsy pre-post infusion
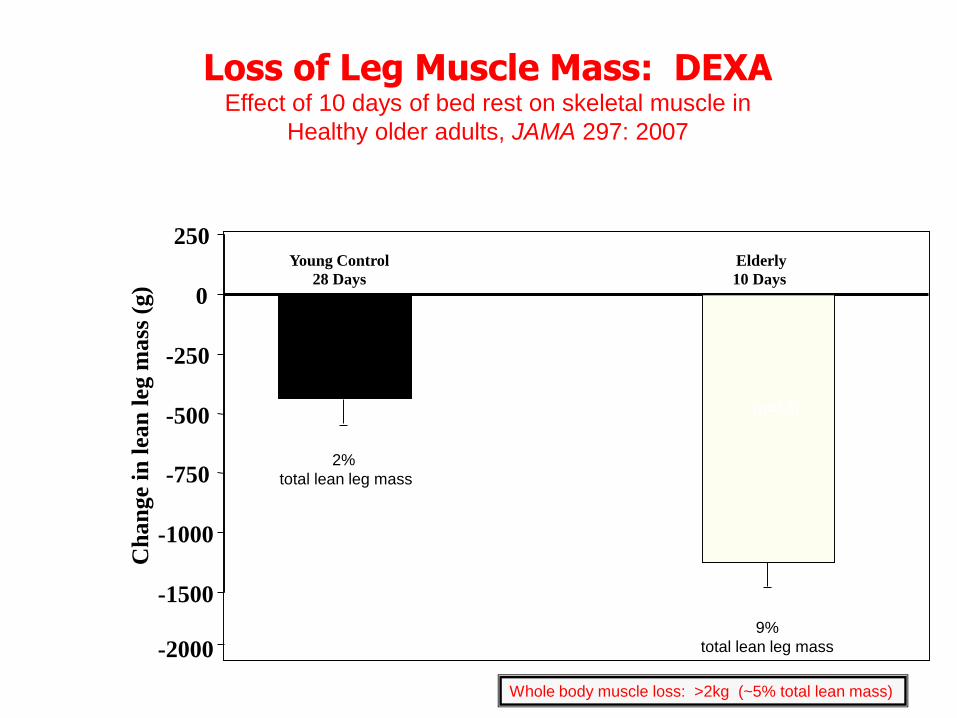
-1500
-1000
-750
-500
-250
0
250
Ch
an
ge
in l
ean
leg m
ass
(g)
-2000
Young Control
28 Days
2%
total lean leg mass
(n=12)
Elderly
10 Days
9%
total lean leg mass
Whole body muscle loss: >2kg (~5% total lean mass)
Loss of Leg Muscle Mass: DEXAEffect of 10 days of bed rest on skeletal muscle in
Healthy older adults, JAMA 297: 2007
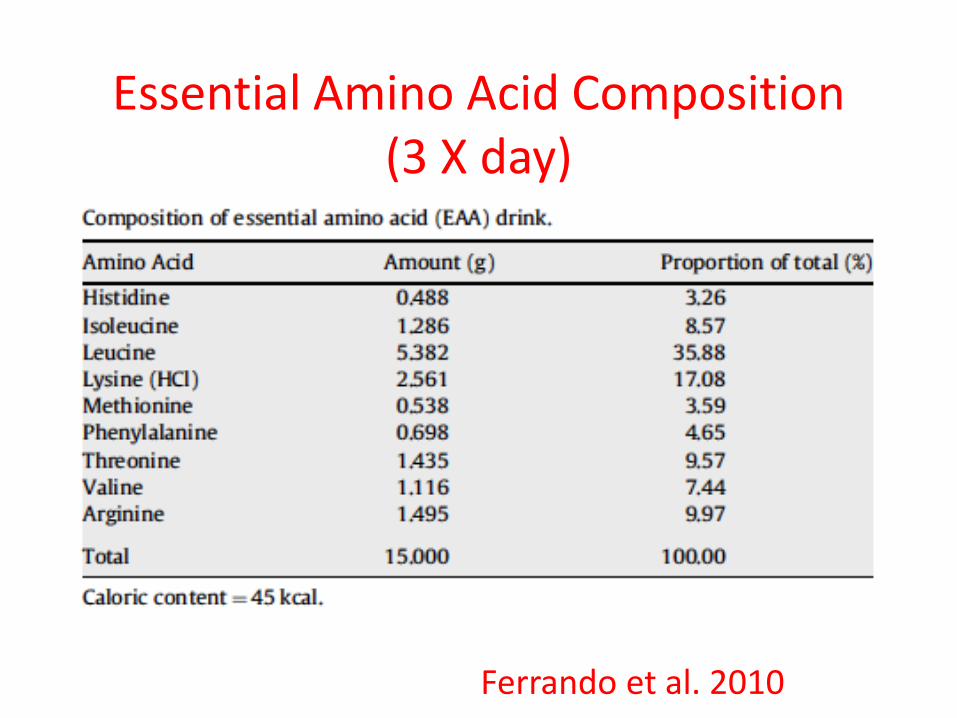
Essential Amino Acid Composition (3 X day)
Ferrando et al. 2010

10 days of bedrest
with EAA supplementation
%*
Ferrando et al. 2010

10 days of bedrest
with HMB intervention

10 days of bedrest
with HMB intervention

HMB and mortality in
hospitalized patients
Deutz et al. Clin Nutr 2016


Nutritional intervention:Whey Protein/Placebo(2 packets/day*)• Supplement packets were given to subjects weekly.• Adherence was assessed by empty packet return/logs and urinary PABA
recovery (200 mg per packet).• Subjects were instructed to consume supplements after regular meals.
*On exercise training days supplements were consumed immediately after exercise (on site).
Whey Placebo
20 g protein (whey concentrate) NA
25 g maltodextrin 45 g maltodextrin
1 g fat 1 g fat
189 kcal (791 kJ) 189 kcal (791 kJ)

Intervention adherence
Whey
N=42
N (%)
Placebo
N=38
N (%)
Study withdrawals 3 2
Exercise attendance 79.9 + 20.8 80.2 + 21.7
Supplement adherence
(packets returned)
72.1 + 29.3 82.3 + 21.9
Completed both > 70% of exercise
& < 2 consecutive neg. urine PABA
28 31

Leucine Content is an Important Determinant of the
Muscle Anabolic Response to Feeding in Aging
0
0.025
0.05
0.075
0.1
Mix
ed M
uscl
e F
SR
(% /
hou
r)
OldYoung OldYoung
**
*
7 g Essential Amino Acids
26% Leucine 41% Leucine
Katsanos et al, AJP, 2006
Basal
Meal (young)Meal (old)

Double Leg Press Strength (1 RM)
Force(newtons)
0
200
400
600
800
1000
1200
1400
1600
1800
2000
Whey Placebo
Baseline
Month 6
**
Time/supplement interaction P=0.43; * time effect P < 0.0001
*
Chale’ et al. J Gerontol 2012

Change in Mid-thigh muscle cross sectional area (C-T)
Time/supplement interaction P=0.18; * time effect P < 0.008
Total Muscle Normal Density Low Density
Chale’ et al. J Gerontol 2012

Physical Function measures
Physical Function measure Baseline 6 months P value
interaction
P value
time
Stair climb time (s) 0.64 0.03
Whey 7.6 + 4.1 7.1 + 3.9
Placebo 8.6 + 4.7 7.0 + 3.2
Chair rise time (s; 10X) 0.25 0.0001
Whey 32.1 + 9.6 25.2 + 6.9
Placebo 33.9 + 16.1 29.8 + 16.0
SPPB score 0.49 0.0001
Whey 8.5 + 1.1 10.3 + 1.5
Placebo 8.4 + 1.7 10.0 + 1.8
400 m walk (gait speed; m.s-1) 0.11 0.13
Whey 1.07 + 0.19 1.12 + 0.22
Placebo 1,03 + 0.18 1.04 + 0.25

Dietary Protein Intake
Protein Intake Baseline 6 months
Point
Estimates
(95% C.I.)
P value
time
Dietary Protein -6
(-14,1)
0.015
Whey 71 + 17 64 + 15
Placebo 72 + 19 68 + 18
Total Protein
(including supplement)
18
(8,29)
0.0001
Whey 71 + 17 89 + 22
Placebo 72 + 19 69 + 19


![THE SARCOPENIA POSITION STATEMENTS [DATE] Definition and Outcomes... · THE SARCOPENIA POSITION STATEMENTS [DATE] Page 2 12, Faculty of Science, Nutrition and Health Aging and Later](https://static.fdocuments.net/doc/165x107/5e75a01512fe8151cb7f28e9/the-sarcopenia-position-statements-date-definition-and-outcomes-the-sarcopenia.jpg)


