Numerical Modeling of Salt Tectonics on Passive...
37
Numerical Modeling of Salt Tectonics on Passive Continental Margins: Preliminary Assessment of the Effects of Sediment Loading, Buoyancy, Margin Tilt, and Isostasy Ings, Steven Department of Earth Sciences Dalhousie University B3H 3J5 Halifax Canada email: [email protected] Beaumont, Christopher Gemmer, Lykke * Department of Oceanography Dalhousie University B3H 4J1 Halifax Canada * Current address: School of Earth Sciences The University of Leeds LS2 9JT Leeds United Kingdom Abstract Salt tectonics in passive continental margin settings is investigated using a 2D vertical cross- sectional finite element numerical model of frictional-plastic sedimentary overburden overlying a linear viscous salt layer. We present preliminary results concerning the effects of sediment progradation over salt, buoyancy driven flow owing to density contrast between the sediment and salt, regional tilt of the
Transcript of Numerical Modeling of Salt Tectonics on Passive...

Numerical Modeling of Salt Tectonics on Passive Continental Margins: Preliminary Assessment of the Effects of Sediment Loading,
Buoyancy, Margin Tilt, and Isostasy
Ings, Steven
Department of Earth Sciences
Dalhousie University
B3H 3J5 Halifax
Canada
email: [email protected]
Beaumont, Christopher
Gemmer, Lykke*
Department of Oceanography
Dalhousie University
B3H 4J1 Halifax
Canada
*Current address:
School of Earth Sciences
The University of Leeds
LS2 9JT Leeds
United Kingdom
Abstract
Salt tectonics in passive continental margin settings is investigated using a 2D vertical cross-
sectional finite element numerical model of frictional-plastic sedimentary overburden overlying a linear
viscous salt layer. We present preliminary results concerning the effects of sediment progradation over
salt, buoyancy driven flow owing to density contrast between the sediment and salt, regional tilt of the
salt layer, and local isostatic adjustment of the system. Sediment progradation causes a differential load
on the underlying salt, which can cause the system to become unstable, leading to landward extension
accommodated by seaward distal contraction. Slow progradation (Vsp = 0.5 cm/yr) of slightly aggrading
sediments gives a diachronous evolution comprising four main phases: 1) initiation of salt channel flow
and the formation of mini-basins and associated diapirs; 2) onset of listric normal growth faulting and
extension of the sedimentary overburden; 3) large-scale evacuation of the salt, formation of pre-rafts and
rafts, and inversion of the mini-basins; 4) formation of a contractional allochthonous salt nappe that
overthrusts the depositional limit of the salt.
Buoyancy effects are investigated using models with density contrasts between overburden and
sediment of 0, 100 and 400 kg/m3. Although the lateral flow driven by differential loading dominates in
all cases, the form of the mini-basins, the overall salt evacuation, and style of diapirism are sensitive to
buoyancy forces, with the large density contrast producing the most developed diapiric and mini-basin
structures.
A regional seaward tilt of 0.2° (of the type that may be produced by thermal contraction of the
rifted margin) enhances and accelerates the overall seaward flow of the unstable slope leading to much
earlier overthrusting of the distal depositional limit of the salt. The added downslope gravitational
component also modifies the style of the mini-basins by enhancing the horizontal channel flow by
comparison with the vertical buoyancy driven flow. This reduces the apparent efficiency of diapirism.
Local isostatic adjustment, owing to overburden and water loading, introduces a landward tilt of
the system, thereby requiring salt to flow updip against gravity during evacuation. Isostasy also changes
the overburden geometry and, therefore, modifies the stability and flow velocity of the extending
overburden through the increased strength of the isostatically thickened proximal overburden, and
through the modified differential pressure acting on the salt under these circumstances. The seaward flow
of the unstable slope region is slower for the same overburden progradation velocity, more salt remains
beneath the shelf as rollers and pillows during evacuation, counter-regional faults are more pronounced,

and the allochthonous salt nappe progressively climbs above the isostatically adjusting sediments as it
overthrusts.
Introduction
Evaporite rocks loosely termed ‘salt’ are much weaker than most other sediments, and this allows
salt to become mobile and deform into the complex structures observed in many sedimentary basins. Salt
tectonics occurs in many passive continental margin settings (e.g., the Gulf of Mexico, numerous West
African marginal basins, the margin offshore Brazil, and the margin offshore Nova Scotia), which have
been studied through geological and geophysical observations (e.g., Wu et al., 1990; Demercian et al.,
1993; Ge et al., 1997; Marton et al., 2000; Rowan et al., 2000; Cobbold et al., 2001; Tari et al., 2002;
Shimeld, 2004) primarily owing to their potential for hydrocarbon exploration. They typically contain a
seaward thinning sediment wedge, resulting from landward sediment influx. Moreover, they are
characterized by a region of landward extension and a region of seaward contraction; which may be
attributed to failure of the sedimentary overburden that accompanies the flow of the underlying salt under
certain circumstances (e.g., Worrall and Snelson, 1989; Koyi, 1996; Ge et al., 1997; Rowan et al., 2000;
Vendeville, sub.).
Previous studies have discussed the mechanisms that drive salt tectonics, focusing on the
buoyancy effects of the relatively low-density salt buried beneath denser sediments (e.g., Talbot, 1992;
Podladchikov et al., 1993; Van Keken, 1993; Kaus and Podladchikov, 2001) as well as on differential
loading of frictional sediments on top of the viscous salt (e.g., Last, 1988; Vendeville and Jackson, 1992;
Poliakov et al., 1993; Jackson and Vendeville, 1994; Ge et al., 1997; Gemmer et al., 2004). For the latter
case, two end-member styles of deformation may occur (Fig. 1). The differential load caused by the
varying overburden thickness creates a pressure gradient in the viscous salt and causes a channel
Poiseuille flow to form (Fig. 1A) (Turcotte and Schubert, 1982). With this end-member flow pattern, the
overburden is stable and does not move horizontally. For larger differential overburden thicknesses, and

hence large pressure gradients, the overburden may become unstable and fail, initiating a Couette channel
flow in the viscous layer. For the very unstable end-member (Fig. 1C), the system is dominated by the
Couette flow, whereas for marginally unstable systems, the velocities may be characterized by a
combination of Couette and Poiseuille flow (Fig. 1B).
Analog models have been used to investigate the mechanisms controlling salt mobilization
beneath a brittle overburden (e.g., Vendeville and Jackson, 1992; Koyi, 1996; Ge et al., 1997; Cotton and
Koyi, 2000; Vendeville, sub.). These studies successfully predicted complicated deformation structures
similar to those observed in nature. In addition, recent studies show that analog models can simulate
deformation during sediment progradation and aggradation over a viscous substratum (e.g., Ge et al.,
1997; Cotton and Koyi, 2000; Vendeville, sub.), and therefore approximate equivalent depositional
systems observed on many passive continental margins.
A comparatively smaller number of numerical model studies of passive margin salt tectonics have
been published (e.g., Last, 1988; Cohen and Hardy, 1996; Gemmer et al., 2004). Last (1988) calculated
the flow regime in a finite difference model of a sloping elasto-plastic layer overlying a viscous
substratum. The numerical results for the end member where only the salt is mobile (like Fig. 1A) were in
close agreement with the equivalent simplified analytical theory (Lehner, 1977) based on lubrication
theory. The numerical model also demonstrated the Couette flow of the overburden (like Fig. 1C) leading
to the prediction of deep extensional upslope basins and thrusting near the toe of the system. Cohen and
Hardy (1996) used a numerical model to investigate salt withdrawal during differential loading by
prograding continental margin sediments. The model was used to predict the large-scale stratigraphy for
the end-member case where the sedimentary overburden only adjusts vertically during salt withdrawal
(like Fig. 1A).
In our earlier research (Gemmer et al., 2004) we expand on the results obtained by Last (1988)
and Cohen and Hardy (1996). We use vertical section, plane-strain finite element models to study the
stability of a uniform thickness linear viscous salt layer overlain by frictional-plastic sedimentary
overburden that decreases in thickness from the proximal to distal limits of the salt, as shown in Figure 1.

The results from Gemmer et al. (2004) provide the basis for the work reported here; we therefore restate
them briefly. The limiting stability of the overburden (i.e., the force balance at the transition to unstable
overburden, the transition from Fig. 1A to 1B as a function of proximal and distal overburden thickness,
the internal angle of friction of the overburden, and thickness of the salt layer were shown to be in good
agreement with a modified form of Lehner's (2000) analytical theory for overburden failure caused by
substratal creep. In addition, the initial velocity of the unstable overburden predicted by these numerical
models is also in reasonable agreement with simplified analytical calculations based on thin-sheet
approximations. Given the acceptable agreement between the numerical models and the analytical theory
for the initial instability and the associated velocity distribution, Gemmer et al. (2004) also investigated
the finite deformation and formation of salt-tectonic structures in a series of finite element experiments.
The main focus was to investigate the sensitivity to the width of the salt layer and the role of the
sedimentary overburden. The simplest model considered the non-physical case where the overburden has
an initial thickness variation as described above, and shown in Figure 1. Such a model is non-physical
because in a natural setting the overburden would become unstable during the sedimentation that is
necessary to create this initial geometry, that is, before this configuration could be achieved. Other models
considered the more natural progressive development of an unstable system as sediment progrades, with a
specified finite velocity, across the model from the proximal (or landward) side of the system, forming a
kinematically specified sedimentary prism that resembles a deltaic progradational wedge.
In this paper, we investigate the large deformation salt-tectonic structures that develop in similar
plane-strain finite element model experiments. The results illustrate the potential of numerical models.
The focus is on a partial assessment of the various processes that drive salt tectonics and the differences in
the styles of deformation they produce. In particular, we examine the effect of sediment progradation, the
roles of regional seaward tilt of the salt layer, and isostatic adjustment under the prograding sediment
load. In these experiments we also use a kinematically specified model of sediment progradation.
However, here we adopt a less aggressive, more aggradational than progradational sedimentation model,
in which the rate of advance of the sedimentary profile is lower than those in Gemmer et al. (2004). This

approach allows the development of a richer range of salt tectonic structures. We also show results of a
preliminary investigation into the role of the other important driving mechanism in salt tectonics, the
buoyancy force that occurs because the salt has a lower density than that of the average overburden. This
effect is shown in combination with the pressure driven instability for three cases; a normal density
contrast, no density contrast, and a large density contrast between salt and overburden in which the salt is
much less dense than the overburden. The results allow a partial assessment of the relative contributions
of differential horizontal pressure and vertical buoyancy forces on the styles of salt tectonics within
passive margin sedimentary prisms.
Numerical Model and Initial Conditions
Finite Element Model Formulation
The numerical model is a velocity-based plane-strain viscous-plastic finite element model
(Fullsack, 1995; Willett, 1999) designed for large deformation fluid Stokes, or creeping, flows. The
model solves the equilibrium force balance equations for incompressible flows in two dimensions
∇⋅ σ + ρg = 0 .......................................................................................................................... (1)
∇⋅ v = 0 ................................................................................................................................... (2)
where ρ is density, g is gravitational acceleration, v is the velocity vector with components v and u in the
x and z directions, and σ is the stress tensor with components ( zzxzxx σσσ ,, ). The pressure is given
by, 2/)( zzxxp σσ +−= , and the deviatoric part of the stress tensor, σ′, relates stress to deformation by
way of the rheological properties of the material.
We use linear viscosity to represent viscous material (i.e., salt)
),(2),,( , zzxzxxzzxzxx εεεησσσ &&&=′′′........................................................................................... (3)
where η is viscosity and the components of strain rate are

zu
xu
zv
xv
zzxzxx ∂∂
=⎟⎠⎞
⎜⎝⎛
∂∂
+∂∂
=∂∂
= εεε &&& ;21;
................................................................ (4)
Non-cohesive frictional-plasticity is modeled by the Drucker-Prager yield criterion, which is
equivalent to the Mohr-Coulomb criterion for incompressible, plane-strain deformation.
effpJ φsin)( 2/12 ⋅=′
............................................................................................................... (5)
where 2J ′ is the second invariant of the deviatoric stress and effφ is the effective internal angle of friction
of the plastic material, defined in the next sub-section. If an effective viscosity, effη , is defined using
second invariants of deviatoric stresses, 2J ′ , and strain rates, 2I ′ , as 21
21 )(2)( 22 IJeff ′′=η , then the
incompressible plastic flow becomes equivalent to a viscous flow. The numerical solution is determined
iteratively using effηη = (Willett, 1999).
The model uses an Arbitrary Lagrangian-Eulerian (ALE) method (Fullsack, 1995) in which
computations are made on a Eulerian grid that adapts to the evolving model domain. The material
properties are tracked and updated using a set of Lagrangian nodal points. An initial Lagrangian mesh is
defined, and a large number of injected meshless particles are also added to improve the accuracy of the
tracking. This approach allows calculations to be made for large strains without the associated, and often
numerically unacceptable, distortion of the finite element mesh. Moreover, it allows for material flux
across the model surface, whereby sedimentation and erosion may be included. The model result figures
and animations show the Lagrangian mesh. In many places, however, it is too distorted to be useful and
has been deleted. In is useful to note here that, although we use the term ‘faulting’ throughout, the
continuum finite element model produces finite width shear zones, not true faults.
Model Geometry and Properties

The model setup is illustrated in Figure 2. A 1000 m thick viscous layer is overlain by a
prograding frictional-plastic overburden wedge of laterally varying thickness. The total model thickness,
h, varies from 5500 m to 1010 m following the half-Gaussian sediment profile function
h1 if x < x0
⎟⎟⎠
⎞⎜⎜⎝
⎛ −−⋅−+ 2
20
212)(
exp)(d
xxhhh if x ≥ x0 ………………………...(6)
where hc (1000 m) is the thickness of the viscous layer and h1 (4500 m) and h2 (10 m) are the limiting
thicknesses of the overburden. The width of the transition region (Fig. 2), l, is determined by the value of
d = 200 km (l approximately equals 2d) and the transition starts at x = x0. The total model length is 500
km. The viscous layer is 300 km long with 100 km wide buffer zones of overburden material at each end
to allow for deformation beyond the limits of the salt.
The Eulerian and Lagrangian grids consist of 88 vertical by 800 horizontal elements. The grids
are adjusted vertically to form a half-Gaussian-shaped topography (Eq. 6). The solution space has a
stress-free top surface. No horizontal or vertical velocities are permitted at the vertical model boundaries
or the base of the model. Viscous flow is therefore driven solely by the pressure gradient set up by the
prograding differential load of the prograding sediments on the viscous substrate.
Sediment progradation is modeled by translating the sediment profile function (Eq. 6) from
landward to seaward across the model at the progradation velocity Vsp. That is, x0(t) = x0(0) + Vsp⋅t, where
t is time. As the prograding surface is translated across the model, new overburden material is added to
fill the region between the current model surface and the prograding surface. This new material is then
included in the model calculations. If, during this process, the current sediment or salt surface is above the
kinematically defined prograding surface, material is neither added nor removed. The sedimentary
material added during progradation has the same properties as the pre-existing sediments. Material
properties are constant for all models in this paper, with the exception of models used to test the role of
density-driven processes (sub-sections ‘Model 2: No Density Contrast Between Salt and Overburden’ and
‘Model 3: Large Density Contrast Between Salt and Overburden’). The cohesionless frictional-plastic
h(x) = hc + 8

sedimentary overburden has an effective angle of friction effφ = 20°. The effective angle of friction is
chosen to represent an average sediment strength that takes into account the effects of pore fluid pressure
( ) φφ sinsin feff ppp −=.................................................................................................... (7)
where p is the solid pressure, pf is the pore fluid pressure, φ is the internal angle of friction of the dry
material, and effφ , is the effective internal angle of friction. A effφ of 20° represents conditions that are
close to hydrostatic pore fluid pressures for the parameters used here. Salt is modeled as a linear viscous
material with viscosity η = 1018 Pa.s.
Model Results
In the animations and figures that follow, each 2 Myr of deposition is shown as a single color
band. These thin bands are organized into thicker red, orange, yellow, green, and blue packages, each
package representing 10 Myr of deposition. The 2 Myr bands are visible as shades within the colored
packages. In this manner, the colored packages repeat every 50 Myr, beginning again with the brightest
red. Salt is colored magenta. The material properties are the same as those in Gemmer et al., (2004);
however, the width of the salt layer and the sediment geometry and progradation rate differ.
Model 1: Reference Model - Effect of Sediment Progradation
Model 1 is designed to investigate the effect of uniform rate, relatively slow, Vsp = 0.5 cm/yr,
progradation of uniform property, effφ = 20°, ρ = 2300 kg/m3 sediments over the 300 km wide, 1 km thick
salt layer, which has a density of 2200 kg/m3 and a viscosity of 1018 Pa·s. The initial configuration has a
10 m thick sedimentary overburden at the distal end of the salt and an 85 m thick overburden at the
proximal, or landward, end of the salt.
Salt deformation is initiated as soon as the sedimentary wedge starts to prograde (Fig. 3A)
demonstrating that for thin, and therefore weak, overburden only a small pressure gradient is

required to cause seaward salt flow. The overburden is less than 150 m thick at the landward end of the
salt when the salt begins to flow, and contractional deformation of the downdip part of the prograding
sediments causes mini-basins to form. (Note that our definitions of selected salt-tectonic terms are
provided in the appendix). It is clear that the differential loading by the sediment, and not buoyancy
forces owing to the density contrast, initiates the instability because an equivalent model with no
progradation remains stable.
In Phase 1 of the evolution, the warping of the overburden, the evacuation of the salt from
beneath the downwarps, and its flow into the adjacent upwarps results in the formation of mini-basins.
The salt evacuation creates accommodation space for the sediments and the system evolves diachronously
forming a series of mini-basins (Anim. 1, 14.5 Myr). These local flows occur simultaneously with the
regional salt channel flow, which has a Poiseuille character in the proximal salt and a Couette character in
more distal regions (Fig. 3A, deformed tracking mesh).
Phase 2 of the evolution involves a combination of several processes. Extension and listric
normal faulting are initiated in the overburden above the proximal salt (Anim. 1), as is clearly seen in the
yellow and green strata of Figure 3B. This part of the system has evolved during overburden
progradation, becoming part of the unstable region updip from the toe of the slope where the mini-basins
form.
At more distal locations the combined regional and local flows lead to the development of
triangular-shaped diapirs at the flanks of the mini-basins, some of which are fault bounded (Fig. 3B).
Some of these mini-basin bounding diapirs deflate (Fig. 3B, example at 138 km, and Anim. 1) and new
depocenters form directly above them.
Phase 3 (Anim. 1, 40.5-60.5 Myr) is characterized by the wholesale extension of the system
beneath the slope, and the seaward translation of pre-rafts (defined in appendix) of older overburden that
become progressively separated by widening, mainly asymmetric, fault-bounded grabens to form rafts
(Fig. 3C; defined in appendix). During the formation of the large fault-bounded depocenters, the strata in
the mini-basins are deformed to create a turtle structure (Fig. 3B and 3C). This 'inversion' results from a

combination of the rollover style synkinematic sedimentation on the hangingwall of the listric normal
growth faults and the regional evacuation of the salt.
Sedimentation and salt withdrawal in Phase 3 leads to deflation of the diapirs that bound the mini-
basins and salt is expelled to form more diapirs and mini-basins at the base of the prograding slope. In this
manner, diapirs, mini-basins, and extensional grabens form diachronously with their age decreasing
seaward. The progressive evacuation of salt, from landward to seaward, leaves extensional basins
superimposed on the older mini-basins in areas where the majority of the salt has been evacuated (Anim.
1).
This process of diachronous mini-basin formation would continue, but at 40.5 Myr the flowing
salt reaches its distal deposition limit, which acts as a buttress to its continued seaward flow and forces
thickening of the evacuated salt (Anim. 1). At 60.5 Myr, Phase 4 of the evolution begins when the salt has
thickened sufficiently that it overthrusts younger sediments beyond its depositional limit and forms a
large salt nappe (Anim. 1 and Fig. 3D; refer to appendix for definition). The mini-basins located adjacent
to the depositional limit of the salt and within the salt nappe (Fig. 3D) are highly allochthonous and were
formed earlier at the base of the slope and were advected seaward with the salt. No new distal mini-basins
form after 30.5 Myr in this model because the specified prograding depositional profile progressively falls
below the surface of the main body of evacuated salt as the salt thickens at the base of the slope (Anim. 1,
50.5 Myr). This means that the prograding sediment wedge cannot create new mini-basins by
topographically-induced flow. Even the existing distal mini-basins evolve progressively more slowly as
they are advected both seaward and upward as the salt surface rises (Anim. 1, 70.5-100.5 Myr and Fig.
3D).
Natural systems may behave in this way, but it is equally likely that sediments will continue to
prograde over the distal salt and that new mini-basins will form. The interesting model result is the clear
linkage between the development of mini-basins and the topographic forcing by the prograding sediment
wedge.

Model 2: No Density Contrast Between Salt and Overburden
The recent paradigm shift in the interpretation of salt tectonics has lead to a strong emphasis on
the differential pressure that exists between thick proximal sediments and thin distal sediments overlying
the salt as the main driving force (e.g., Jackson and Vendeville, 1994). While this interpretation is correct,
the effect of buoyancy forces acting in concert with the pressure driven flows requires further
investigation. Two model experiments are used to investigate the effect of buoyancy forces. Models 1, 2,
and 3 are the same except that in Model 2 (this section) the salt has the same density as the overburden
(2300 kg/m3) and in Model 3 the density contrast is larger than that found in natural systems.
The initial response to sediment loading by the prograding overburden is similar in both Models 1
and 2. The loading drives a topographically-induced flow and a mini-basin is created (Anim. 2, 8 Myr).
Subsequently in Model 2, a single wide basin develops (Anim. 2, 20 Myr), in contrast to the set of mini-
basins separated by salt diapirs in Model 1. There is some tendency for diapirism of the salt as it is
evacuated, but the main effect is the development of pillows and rollers (defined in the appendix) as the
salt is segmented during Phase 2 of the evolution, when listric normal faulting and extension of the
overburden become important. For the parameter values chosen for these models it is clear that even a
small density contrast, 100 kg/m3, between the salt and overburden has a significant impact on the
development of mini-basins. When the buoyancy forces act together with the channel flow, there is
significant diapirism, as seen in Model 1, but large-scale salt evacuation dominates when the salt is not
buoyant, as in Model 2. The difference between Models 1 and 2 becomes more subtle later in their
evolution. The general distribution of extensional structures, the formation of pre-rafts and rafts and the
intervening depocenters are similar, as is the overall rate of salt expulsion (Fig. 4A and 4B; Anim. 1 and
Anim. 2). The salt begins to overthrust its depositional limit at about the same time, 60 Myr, and the large
overthrust salt nappe develops in a similar manner (Fig. 4A and 4B). Hence, the differential sediment load
controls the overall pattern of proximal extension, distal contraction, and seaward salt flow. However, the
buoyancy force owing to the density contrast is responsible for the remaining distal mini-basins and salt
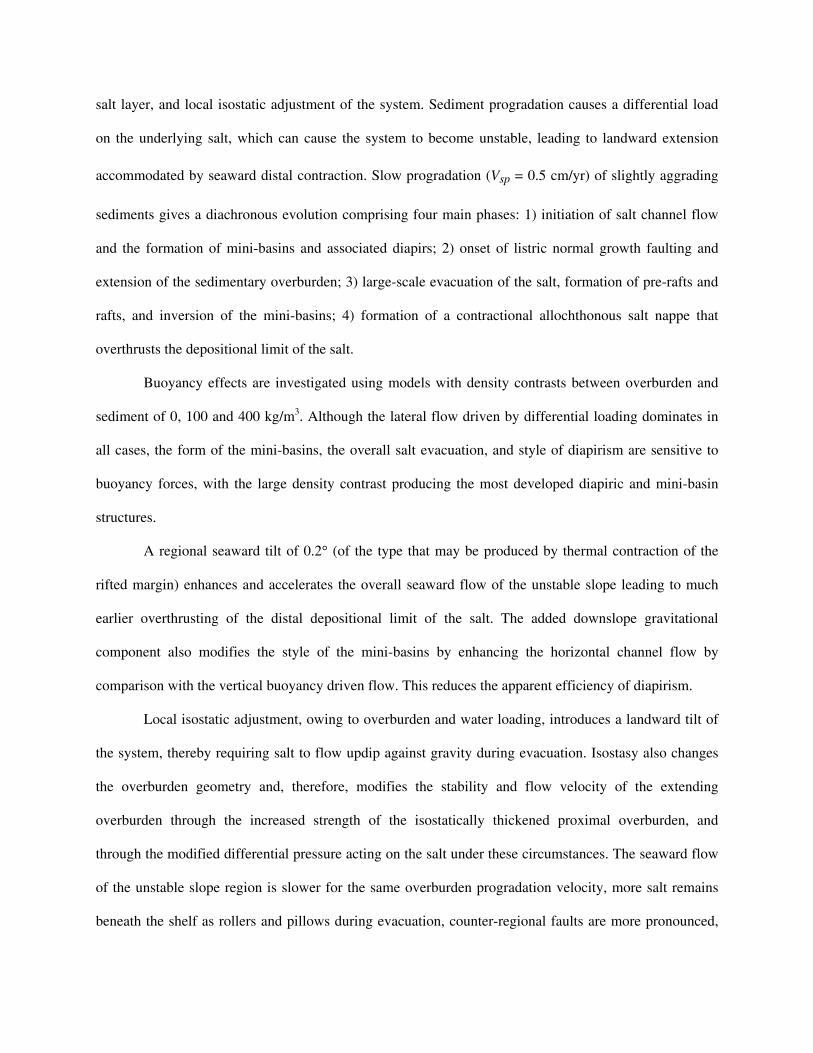
diapirs in Model 1. There is also a distinct difference between the final structure of the advected and
disaggregated wide, single early mini-basin (Anim. 2, 24 Myr) of Model 2 (Fig. 4A, 280-370 km, orange
and yellow) and the equivalent separated set of mini-basins in Model 1 (Fig. 4B, 270-360 km, orange and
yellow). The most striking difference between the models is the inclined smooth interface between the
salt and overburden in Model 2 (Fig. 4A, 250-450 km).
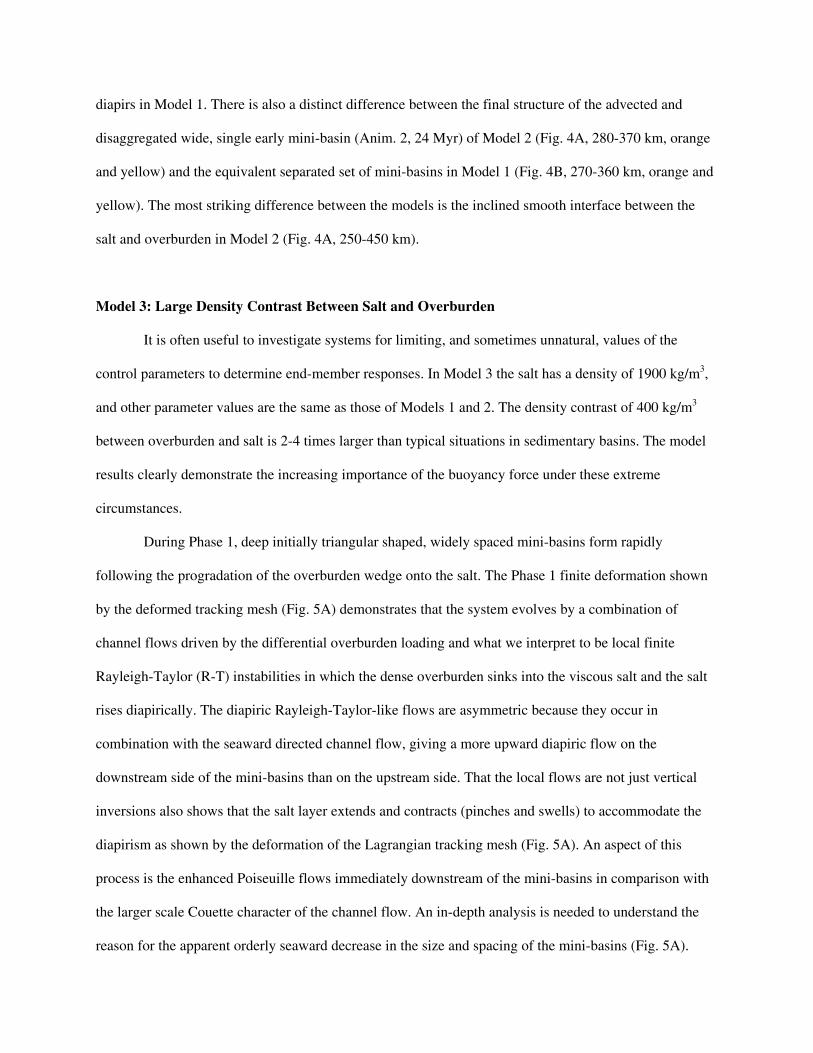
Model 3: Large Density Contrast Between Salt and Overburden
It is often useful to investigate systems for limiting, and sometimes unnatural, values of the
control parameters to determine end-member responses. In Model 3 the salt has a density of 1900 kg/m3,
and other parameter values are the same as those of Models 1 and 2. The density contrast of 400 kg/m3
between overburden and salt is 2-4 times larger than typical situations in sedimentary basins. The model
results clearly demonstrate the increasing importance of the buoyancy force under these extreme
circumstances.
During Phase 1, deep initially triangular shaped, widely spaced mini-basins form rapidly
following the progradation of the overburden wedge onto the salt. The Phase 1 finite deformation shown
by the deformed tracking mesh (Fig. 5A) demonstrates that the system evolves by a combination of
channel flows driven by the differential overburden loading and what we interpret to be local finite
Rayleigh-Taylor (R-T) instabilities in which the dense overburden sinks into the viscous salt and the salt
rises diapirically. The diapiric Rayleigh-Taylor-like flows are asymmetric because they occur in
combination with the seaward directed channel flow, giving a more upward diapiric flow on the
downstream side of the mini-basins than on the upstream side. That the local flows are not just vertical
inversions also shows that the salt layer extends and contracts (pinches and swells) to accommodate the
diapirism as shown by the deformation of the Lagrangian tracking mesh (Fig. 5A). An aspect of this
process is the enhanced Poiseuille flows immediately downstream of the mini-basins in comparison with
the larger scale Couette character of the channel flow. An in-depth analysis is needed to understand the
reason for the apparent orderly seaward decrease in the size and spacing of the mini-basins (Fig. 5A).

During Phase 2 (Anim. 3, 20-60 Myr), listric normal growth faulting and shearing against the
diapirs dominates the unstable and extending overburden and the salt is evacuated and shortened to form a
series of massive salt walls (Fig. 5B). Large-scale symmetric and asymmetric mock-turtle (refer to
appendix) anticlinal structures (Vendeville and Jackson, 1992) form in the depocenters between the salt
walls. The early synformal mini-basins/grabens become nearly grounded on basement, the flanks subside
further by growth faulting against the diapirs, and the mini-basins are inverted to form the cores of the
arched mock-turtle anticlines. At this stage (Anim. 3, 40 Myr) growth is confined to the boundaries of the
salt walls. However, later (Anim. 3, 80 Myr) the mock turtles are themselves disrupted by normal faults.
The evolved form of Model 3 (Anim. 3, 96 Myr) contrasts with Model 2. In particular, there are
diapirs in the section below the slope region and the interface between the evacuated salt and the
overburden is subvertical. and not shallowly dipping across a 100 km wide zone as in Model 2. This
difference in geometry clearly reflects the role of the vertical buoyancy force which was absent in Model
2.
Model 4: Regional Seaward Tilt of the Model
Some passive continental margins, for example the Angolan Margin (e.g., Duval et al., 1992;
Marton et al., 2000), are interpreted to have undergone significant seaward tilt (i.e., seaward end down)
subsequent to the time of salt deposition. Thermal contraction and isostatic adjustment of the extended
and rifted lithosphere, which would be expected to increase seaward, is one mechanism that would
produce both syn-rift and post-rift tilting. The effects of seaward margin tilt are investigated in Model 4
(Fig. 6, Anim. 4) which is the same as Model 1, with the addition of an initial 0.2° seaward tilt applied to
the entire model. This tilt equates to 1.75 km of subsidence of the distal end of the model, at x = 500 km,
with respect to the proximal end. This model, which instantaneously tilts the salt layer, is equivalent to a
natural example in which the tilt occurs sufficiently rapidly that it is finished before there is either
sediment progradation or the system becomes unstable. More complex examples in which the tilt and salt
tectonics evolve simultaneously can also be investigated.

Tilting adds a downslope component of gravitational forcing to the model which is superimposed
on the instability that develops during sediment progradation. The main question is whether the addition
of such a small gravitational component modifies the model evolution by comparison with Model 1. The
effect is significant. During Phase 1, the system forms a wide mini-basin, flanked by more distal discrete
mini-basins (Fig. 6A, Anim. 4), a response that is intermediate to that of Models 1 and 2. The addition of
the downslope gravitational forcing enhances the instability of the system, in comparison with Model 1,
and the Couette flow and salt evacuation are therefore more efficient. Consequently, in relative terms,
buoyancy is less efficient which leads to the lower level of diapirism, more like Model 2 where the
buoyancy force is completely suppressed. The same effect manifests in Phase 2 and the result is less salt
trapped beneath the proximal basin than in Model 1 (Fig. 6B and 6C). The overall faster Couette flow in
Model 4 can be seen from the overthrusting of the distal depositional limit of the salt, which occurs at 28
Myr by comparison with approximately 60.5 Myr in Model 1 (Anim. 1). This effect can be seen in Figure
6 where panels B and C are shown at 50 Myr for Models 1 and 4, respectively.
Model 5: Local Isostatic Compensation of Sediment Load
Model 4 clearly shows that margin tilt can have a significant effect on salt structure development,
even when the downslope component of gravitational forcing is small. In this section, we investigate the
effect of local isostatic compensation of the prograding overburden, which introduces a tilt into Model 5
that has the opposite sense to that in Model 4. This model experiment specifically addresses the effects of
the thicker overburden, which results from isostatic adjustment, and the landward tilt owing to
compensation on the model evolution. Model 5 is the same as Model 1, with the addition of the isostatic
compensation. As material is added to the model, each column of Eulerian finite elements is adjusted
vertically in every timestep to account for the current total weight of material in the column. The total
weight includes the existing material (taking into account the difference in density between salt and
overburden), new overburden added this timestep, and the weight of the overlying water column between

the seabed and sea level, assuming the sea level is at a reference height z = 5500 m, which is the
maximum elevation of the prograding overburden wedge (Anim. 5 and Fig. 7). Here, the water loading
only influences the isostatic balance. Elsewhere, Gemmer et al. (in prep.) investigate the effect of water
loading and pore fluid pressure on the deformation of the system. The compensating mantle density is
3200 kg/m3. The profile of the prograding overburden remains the same as that in Model 1, therefore, the
prograding wedge is much thicker owing to the additional accommodation space created by isostatic
compensation (Anim. 5).
The Phase 1 evolution of Model 5 is similar to Model 1, with the early creation of a series of
mini-basins (Fig. 7A, 100-140 km) and intervening diapers. In the next phase, listric normal growth
faulting starts on the basin boundaries (Fig. 7B). Later in Phase 2 the subsidence caused by the isostatic
adjustment reduces the seaward Couette flow by comparison with Model 1 (Anim. 5, 48 Myr). The
evacuation of the salt is less efficient than in Model 1 and significant amounts of salt remain trapped
beneath the proximal overburden (Fig. 7C and 7D and Anim. 5).
Another aspect of Phase 2 is the style of the listric growth faults. At approximately 40 Myr there
is no strongly preferred polarity of the basin-bounding faults (Anim. 5). The faulting has modified the
early diapirs into large amplitude rollers but these have a generally symmetrical triangular shape.
Between 40 Myr and 60 Myr, the extending system develops several significant counter-regional faults
positioned on the proximal flanks of the salt rollers (Anim. 5 and Fig. 7C).
In Phase 3, growth faulting in the proximal basin becomes more symmetrical with graben
development augmenting the counter-regional faults. This process evolves diachronously in the seaward
direction and appears to be a precursor to stabilization of the overburden. The pattern of counter-regional
faulting, symmetric graben formation and eventual stability correlate with decreasing asymmetry and
decreasing local taper of the system suggesting that asymmetric faulting is favored when the system has a
higher taper. The evolution of the system is accompanied by the progressively seaward migrating
diachronous creation of mini-basins and diapirs, the deflation of the diapirs, and formation of counter-

regional faults. These processes are repeated until the salt flow reaches and eventually overthrusts its
depositional limit in phase four (Anim. 5, 80 Myr).
Discussion
The numerical models described in the previous section display a wide range of behavior and
structures related to salt mobilization and continued deformation; structures that are comparable to those
shown in published natural examples and analog models (e.g., Peel et al., 1995; Koyi, 1996; Ge et al.,
1997; Tari et al., 2002; Vendeville, sub.). On the basin or regional scale, the dominant process driving
deformation is differential loading. However, the role of buoyancy, owing to the density contrast, is
evidently important for the development of smaller scale features, such as mini-basins and diapirs.
The development of various structures and deformation patterns seen in the models can be
categorized into four phases. In Phase 1, warping of prograding overburden results in the formation of
depocenters in the downwarps, and a concentration of salt in the upwarps. As sedimentation continues,
salt is progressively evacuated from beneath the depocenters forming mini-basins flanked by diapirs. In
Phase 2, the mini-basins begin to be dissected by listric normal faults as the overburden is extended in the
region updip from the slope. This process leads into Phase 3 of the evolution, where the overburden
experiences increasing amounts of extension and is rafted into blocks separated by grabens. In Phase 4,
the final phase, the seaward salt flow reaches the distal buttress that is its depositional limit. At this point,
seaward movement of the salt is inhibited and it begins to thicken substantially, eventually overthrusting
younger sediments forming a large allochthonous salt nappe. The Phase 1 development of mini-basins
and diapirs is concentrated at the toe of the prograding overburden slope, and propagates seaward as the
sediment profile progrades. The phase-to-phase evolution of the system therefore occurs diachronously,
such that more distal regions of the model may be experiencing Phase 1 deformation, while proximal
regions have begun to develop Phase 2 or 3 extensional structures.

Each model progresses through the developmental phases somewhat differently, owing to the
differences in model parameters. In some models, one or more phases may be suppressed. The evolution
of Model 1 is driven by the prograding differential load and small buoyancy forces resulting from the 100
kg/m3 density contrast between the sediments and salt. In Model 2, there is no density contrast, and
deformation is driven solely by differential loading alone. The regional salt flow pattern and rate in Model
2 are comparable to Model 1, which develops Phase 2 and 3 structures similar to those in Model 1 (Fig.
4). However, the early warping in Phase 1 of Model 1 is suppressed in Model 2, and the deformation is
dominated by horizontal seaward salt flow, as opposed to the local vertical flows, and the Model 2 system
evolves a smooth salt-sediment interface that contains only small perturbations (Fig. 4A). This is notably
different from Model 1, which develops mini-basins and diapirs early on (Fig. 3A), and eventually large
salt walls as Phase 4 begins (Fig. 3D). Based on this finding, we infer that the development of diapirs and
mini-basins in Model 1 is due in part to buoyancy forces.
The nature of the instability that creates the mini-basins needs to be investigated more carefully.
One end-member process is that described by Fletcher et al. (1995) in which a mini-basin forms by the
topographically-induced flow induced by an overlying sediment wedge that has its surface slope
maintained by deposition and erosion during deformation. The mini-basins in Model 1 have similar
geometries to the Fletcher et al. (1995, Fig. 24 and 25) results. However, the development of these
features may be more complicated because the current models have a frictional-plastic overburden (rather
than viscous). As a result, there is a finite density contrast between the salt and overburden, and the
overburden progrades during development of the mini-basins. Under these circumstances, the type of
instabilities in a frictional material overlying a viscous half-space (Triantafyllidis and Leroy, 1994) may
also be important. The length scales of the basins, 5-10 km, are too large for folding instabilities of the
thin overburden and the process may best be described conceptually as warping of the overburden. The
competition between seaward and upward salt flow is also important, and in cases where the upward
component is enhanced, diapirs and mini-basins are favored. In Model 2, the upward component is
completely suppressed, and therefore it does not produce diapirs or mini-basins.

Model 3 displays the opposite extreme. In this model, the density contrast is larger (400 kg/m3)
than in Model 1, and the upward component of salt flow, driven by the larger buoyancy effect, dominates
the system. Some aspects of the effect of buoyancy forces on lubrication squeeze flows have been
addressed by Lehner (2000) who emphasizes that the early structural evolution of the top salt is sensitive
to the combined effects of differential loading and buoyancy, as well as the geometry of the salt bottom
and, “…consequently must have a decisive influence on the entire salt tectonic history of a basin”.
Buoyancy adds nonlinearity to the Reynold's equation that describes simplified lubrication flows (Lehner
2000, equation 11), and this nonlinearity may drive the instability that creates perturbation of the top salt
that subsequently grows as a finite Rayleigh-Taylor instability.
The buoyancy force also enhances the Phase 3 development in Model 3 and large mini-basins and
salt walls form (Fig. 5). Although the density contrast is greater than that in nature, the structures in
Model 3 look similar to those seen in many natural examples. Equivalent models with an even larger
density contrast develop a complete range of salt structures, including coalesced canopies. That the
diapirism appears more realistic for density contrasts that are larger than those that occur naturally
suggests that other model parameters need adjusting. The efficiency of buoyancy-driven diapirism
depends on the relative rates of vertical and horizontal flow. Consequently, a model system that is less
unstable horizontally (i.e., has a lower Couette velocity) will evolve more slowly and therefore has more
time for vertical diapirism driven by lower, more natural, density contrasts, to develop. Gemmer et al.
(2004) show that the Couette velocity depends on the geometry and effective internal angle of friction of
the overburden, the thickness and viscosity of the salt layer and the transition width of the sediment
progradational profile. Any combination of, a reduction in the differential thickness, h1-h2, of the
overburden; an increase in φeff; or an increase in l or the salt viscosity, will reduce the Couette velocity
and may correspondingly increase the relative efficiency of diapirism. However, the buoyancy-driven
diapirism also depends on the strength of the overburden which is a function of φeff and it is likely that an
increase in φeff alone will further suppress diapirism. Clearly, it is necessary to explore the model

behaviors in relation to variations in model parameters. This can be done most effectively if the search is
done for variations in the values of the parameter groups that control a non-dimensional version of the
model.
Model 4 is tilted seaward by 0.2°, which enhances seaward salt flow owing to the additional
downhill gravitational component. In this model, which has the same density contrast as Model 1, diapirs
and mini-basins comparable to those in Model 1 do not form; instead the system is dominated by seaward
salt flow. This flow is also faster and overthrusting occurs ~30 Myr earlier in Model 4 than in Model 1
(Fig. 6). This has potentially important implications for regions that are thought to have experienced early
thermal related subsidence, e.g., the Angolan margin, and it may be an important mechanism that initiates
early salt movement, even in the absence of differential loading.
Model 5 includes local isostatic adjustment. As sediments prograde, the model subsides creating
more accommodation space and a thicker sediment wedge than in the other models. The subsidence also
causes the salt layer to become tilted landward. It appears that this landward tilt of the salt layer has a
larger effect on the flow regime than the increased differential pressure in the salt caused by the thicker
overburden wedge resulting in a slower seaward Couette flow than in Model 1. However, there are
complicating factors that need to be analyzed, including the effect of the thicker overburden at the
proximal limit of the salt on the stability of the system and the velocity of the Couette flow when the
system is unstable (cf., Gemmer et al., 2004). The slower seaward flow allows the buoyancy to be more
effective and therefore the Phase 1 evolution of diapirs and mini-basins are more pronounced in Model 5
than in Model 1 (Fig. 7, part 1).
Conclusions
We have presented preliminary 2D finite element numerical models of sediment progradation
above a linear viscous salt layer. The models were used to investigate how sediment progradation,

buoyancy, margin tilt, and isostatic subsidence affect salt tectonic deformation in passive continental
margin settings.
Sediment progradation causes a differential load on the salt and can induce an unstable seaward
flow resulting in a deformational evolution that may be categorized into four main phases: 1) formation of
mini-basins and associated flanking diapirs; 2) onset of listric normal growth faulting and extension of the
overburden; 3) large scale salt evacuation, formation of pre-rafts and rafts, and inversion of the mini-
basins, and; 4) formation of a contractional allochthonous salt nappe that overthrusts the depositional
limit of the salt.
Decreased salt density increases vertical buoyancy forces, thereby enhancing local upward salt
flow and diapirism. In contrast, models with no density contrast show a near complete suppression of
diapirism and localized mini-basin formation, indicating that these structures are sensitive to buoyancy
effects. Seaward tilt of the model has a similar effect to a reduction of the density contrast, because, when
tilted, seaward salt flow is enhanced by the gravitational effect of flowing downhill, thereby reducing the
relative importance of the upward buoyancy-related flow component. Local isostatic adjustment causes
subsidence and increased accommodation and sedimentation. This subsidence causes the salt layer to be
tilted landward, and therefore salt is forced to flow upward. This decreases the seaward component of the
flow, and in contrast to seaward tilt, causes the relative importance of the upward buoyancy-related flow
component to be enhanced, leading to the formation of more pronounced diapirs and mini-basins.
Acknowledgements
This research is funded by an ACOA-Atlantic Innovation Fund contract, and an IBM-Shared
University Research Grant. Steven Ings was supported by NSERC and NRCan scholarships. Chris
Beaumont acknowledges support of the Canada Research Chair in Geodynamics. Lykke Gemmer was
supported by the Carlsberg Foundation. We thank John Shimeld, Bruno Vendeville, Bill Powell, Brian
West, and Ray Fletcher for helpful discussions, and Susanne Buiter and Ritske Huismans who reviewed

earlier drafts of the manuscript. We also thank Paul Post, Stephen Palmes, and Kevin Lyons for reviewing
the manuscript and providing editorial comments, and Ulisses T. Mello and the organizers of the
GCSSEPM 24th Bob F. Perkins Research Conference for inviting us to participate. Sopale software
developed by Philippe Fullsack was used for the model calculations.
Appendix
Definitions of various salt tectonics terminology, as used in this paper:
Mini-basin: A basin in which most of the accommodation space is created by salt withdrawal from
beneath the basin, and not by extensional graben formation. Sedimentation in these basins is
contemporaneous with the salt withdrawal.
Mock-turtle structure: An anticlinal structure resulting from the inversion of stratigraphy in a mini-basin
formed directly overlying a deflating diapir (modified after Vendeville and Jackson, 1992).
Nappe: A large-scale salt sheet formed when salt overthrusts its distal depositional limit. Salt nappes may
carry overlying sediments and advected mini-basins formed further landward.
Pillow: A salt structure in conformable contact with overlying sediments in which the vertical dimension
is much smaller than the horizontal dimension, resulting in a broad feature with shallowly sloping sides
(modified after Jackson and Talbot, 1994).
Pre-raft: A fault block of laterally translating overburden that is bounded by listric normal faults. These
blocks have not yet separated and still overlie their original footwall (modified after Jackson and Talbot,
1994).
Raft: A fault block of laterally translating overburden that has separated from adjacent fault blocks to the
degree that it no longer rests in its original footwall. These packages form during extension of pre-
existing mini-basins and are bounded by grabens (modified after Jackson and Talbot, 1994).

Roller: Triangular salt structures in which one flank is gently dipping and in conformable contact with the
overburden, and a more steeply dipping flank whose overburden contact forms a normal fault (modified
after Jackson and Talbot, 1994).
Turtle structure: An anticlinal structure resulting from the inversion of stratigraphy in a mini-basin as the
flanking diapirs deflate (modified after Jackson and Talbot, 1994).
References
Cobbold, P.R., K.E. Meisling, and V.S. Mount, 2001, Reactivation of an obliquely rifted margin, Campos
and Santos basins, southeastern Brazil: AAPG Bull., v.85, p. 1925-1944.
Cohen, H.A., and S. Hardy, 1996, Numerical modeling of stratal architectures resulting from differential
loading of a mobile substrate: in G.I. Alsop, D.J. Blundell and I. Davison, eds., Salt tectonics:
Geological Society of London Special Publication 100, p. 265-273.
Cotton, J.T., and H. Koyi, 2000, Modeling of thrust fronts above ductile and frictional detachments:
Application to structures in the Salt Range and Potwar Plateau, Pakistan: Geological Society of
American Bull., v. 112, p. 351-363.
Demercian, S., P. Szatmari, and P.R. Cobbold, 1993, Style and pattern of salt diapirs due to thin-skinned
graviational gliding, Campos and Santos basins, offshore Brazil: Tectonphysics, v. 228, p. 393-
433.
Duval, B., C. Cramez, and M.P.A. Jackson, 1992, Raft tectonics in the Kwanza Basin, Angola: Marine
and Petroleum Geology, v. 9, p.389-404.
Fletcher, R.C, M.R. Hudec, and I.A. Watson, 1995, Salt glacier and composite sediment-salt glacier
models for the emplacement and early burial of allochthonous salt sheets: in M.P.A. Jackson, D.G
Roberts and S. Snelson, eds., Salt tectonics: a global perspective: AAPG Memoir 65, p. 77-108.
Fullsack, P., 1995, An arbitrary lagrangian-eulerian formulation for creeping flows and its applications in
tectonic models: Geophysical Jour. International, v. 120, p. 1-23.

Ge, H., M.P.A. Jackson, B.C. Vendeville, M.O. Maler, and J.W. Handschy, 1997, Deformation of
prograding wedges over a ductile layer - applications of physical models to geologic examples:
GCAGS Transactions, v. XLVII, p. 177-184.
Gemmer, L., S. Ings, S. Medvedev, and C. Beaumont (2004), Salt tectonics driven by differential
sediment loading: Stability analysis and finite element experiments: Basin Research, v. 16, p.
199-218.
Gemmer, L., C. Beaumont and S. Ings, in preparation, Dynamic modelling of passive margin salt
tectonics – effects of water loading, sediment properties, and sedimentation patterns.
Jackson, M.P.A., and C.J. Talbot, 1994, Advances in salt tectonics, in P.L. Hancock, ed., Continental
deformation. International Union of Geological Sciences, p. 159-179.
Jackson, M.P.A., and B.C. Vendeville, 1994, Regional extension as a geological trigger for diapirism:
Geological Society of America Bull., v. 106, p. 57-73.
Kaus, B.J.P., and Y.Y. Podladchikov, 2001, Forward and reverse modelling of the three-dimensional
viscous Rayleigh-Taylor instability: Geophysical Research Letters, v. 28, p. 11095-11098.
Koyi, H., 1996, Salt flow by aggrading and prograding overburdens: in G.I. Alsop, D.J. Blundell and I.
Davison, eds., Salt tectonics: Geological Society of London Special Publication 100, p. 243-258.
Last, N.C., 1988, Deformation of a sedimentary overburden on a slowly creeping substratum (Innsbruck
1988): in G.S. Swoboda, ed., Numerical Methods in Geomechanics, p. 577-585.
Lehner, F.K., 1977, A theory of substratal creep under varying overburden with applications to tectonics:
EOS Abstracts, v. 58, p. 508.
Lehner, F.K., 2000, Approximate theory of substratum creep and associated overburden deformation in
salt basins and deltas: in F.K. Lehner and J.L. Urai, eds., Aspects of Tectonic Faulting, p. 21-47.
Springer-Verlag, Berlin.

Marton, L.G., G.C. Tari, and C.T. Lehmann, 2000, Evolution of the Angolan passive margin, West
Africa, with emphasis on post-salt structural styles: in M. Webster and M. Talwani, eds., Atlantic
Rifts and Continental Margins: American Geophysical Union Geophysical Monograph, v. 115, p.
129-149.
Peel, F.J., C.J. Travis, and J.R. Hossack, 1995, Genetic structural provinces and salt tectonics of the
Cenozoic offshore U.S. Gulf of Mexico: A preliminary analysis: in M.P.A. Jackson, D.G Roberts
and S. Snelson, eds., Salt tectonics: a global perspective: AAPG Memoir 65, 153-175.
Podladchikov, Y., C. Talbot, and A.N.B. Poliakov, 1993, Numerical models of complex diapirs:
Tectonophysics, v. 228, p. 189-198.
Poliakov, A.N.B., Y. Podladchikov, and C.. Talbot, 1993, Initiation of salt diapirs with frictional
overburdens: numerical experiments: Tectonophysics, v. 228, p. 199-210.
Rowan, M., B.D. Trudgil, and J.C. Fiduk, 2000, Deep-water, salt-cored foldbelts: Lessons from the
Mississippi Fan and Perdido foldbelts, northern Gulf of Mexico: in M. Webster and M. Talwani,
eds., Atlantic Rifts and Continental Margins: American Geophysical Union Geophysical
Monograph, v. 115, p. 173-191.
Shimeld, J., 2004, A comparison of salt tectonic sub-provinces beneath the Scotian Slope and Laurentian
Fan: GCSSEPM 24th Bob F. Perkins Research Conference (this volume).
Talbot, C.J., 1992, Centrifuged models of Gulf of Mexico profiles: Marine and Petroleum Geology, v. 9,
p. 412-432.
Tari, G.C., P.R. Ashton, K.L. Coterill, J.S. Molnar, M.C. Sorgenfrei, P.W.A. Thompson, D.W. Valasek,
and J.F. Fox, 2002, Are west Africa deepwater salt tectonics analogues to the Gulf of Mexico?:
Oil and Gas Journal, v. 4, p. 73-81.
Triantafyllidis, N., and Y.M. Leroy, 1994, Stability of a frictional material layer resting on a viscous half-
space: Jour. of the Mechanics and Physics of solids, v. 42, p. 51-110.

Turcotte, D.L., and G. Schubert, 1982, Geodynamics - Applications of Continuum Physics to Geological
Problems. Wiley, New York, 450 pp.
Van Keken, P.E., 1993, Numerical modeling of thermochemically driven fluid flow with non-Newtonian
rheology: applied to the Earth's lithosphere and mantle. PhD thesis, Faculteit Aardwetenschappen
der Rijksuniversiteit, Utrecht.
Vendeville, B.C., submitted, Salt tectonics driven by sediment progradation. Part 1. Mechanics and
kinematics.
Vendeville, B.C., and M.P.A. Jackson, 1992, The rise of diapirs during thin-skinned extension: Marine
and Petroleum Geology, v. 9, p. 331-353.
Willett, S.D., 1999, Rheological dependence of extension in wedge models of convergent orogens:
Tectonophysics, v. 305, p. 419-435.
Worall, D. M., and S. Snelson, 1989, Evolution of the northern Gulf of Mexico, with emphasis on
Cenozoic growth faulting and the role of salt, in A. W. Bally and A. R. Palmer, eds., The Geology
of North America: an overview, pp. 97-138. Geological Society of America, The Geology of
North America, v. A, Boulder, Colorado.
Wu, S., A. Bally, and C. Cramez, 1990, Allochthonous salt, structure and stratigraphy of the north-eastern
Gulf of Mexico. Part II: Structure: Marine and Petroleum Geology, v. 7, p. 334-370.

Figure 1: Illustration of flow regimes associated with differential loading of frictional sediment overburden
(gold) acting on viscous salt (magenta). A) Poiseuille channel flow of salt, stable sediment overburden; B)
marginally unstable overburden giving combination of Poiseuille and Couette salt channel flows; C) very
unstable overburden such that the salt channel is dominated by Couette flow. Panels B and C show regions of
proximal extensional failure and distal contractional failure of the overburden.
Figure 2: Basic model geometry and properties. Salt layer (magenta), pre-existing sediment overburden (gold),
prograding sediments (10 Myr depositional intervals, orange through red cycles, each comprising five variably
shaded bands of 2 Myr duration). All overburden sediments have the same frictional-plastic properties. Top
surface is the prograding sediment profile function (Eq. 6) which advances seaward (to the right) at velocity Vsp.
This kinematic sedimentation model produces an aggradational stratigraphy during progradation over the salt.
See text for description of other parameters.
Figure 3: Model 1 results. A) Phase 1 formation of mini-basins (100-160 km) during early sediment
progradation. Note Poiseuille and Couette styles of flow in salt shown by deformed Lagrangian tracking grid. B)
Phase 2 extension and normal growth faulting, deflation of proximal diapirs (138 km, see also panel C) and
development of distal mini-basins and triangular shaped diapirs. C) Phase 3 continued extension of slope region,
formation of pre-rafts and rafts of older sediments, continued 'inversion' of mini-basins, and evacuation of salt.
D) Phase 4 formation of large overthrust salt tongue carrying existing mini-basins. The phases evolve
diachronously from proximal to distal regions.
Figure 4: Comparison of Model 2 (no density contrast between salt and overburden) and Model 1 (100 kg/m3
density contrast) results during Phase 4 showing the influence of the lower salt density on diapirism and salt
evacuation in Model 1.
Figure 5: Model 3 results showing effect of large density contrast (400 kg/m3) between overburden and salt. A)
Enhanced development of mini-basins and diapirs during Phase 1. B) Development of mock-turtle structures
and massive salt walls during Phase 2.
Figure 6: Model 4 results showing effect of initial basinward tilt of model. A) Phase 1 development of wide

mini-basin by comparison with discrete local mini-basins in Model 1 (Fig. 3A). B) and C) comparison of Model
1 and Model 4 at 50 Myr showing enhanced seaward flow caused by seaward tilt in Model 4.
Figure 7: Model 5 results showing effect of isostatic compensation. A) Phase 1 development of mini-basins and
associated diapirs. B) Phase 2 onset of extensional normal faulting during sediment progradation. C) Phase 2
landward tilting of salt and development of counter-regional normal growth faults. D) Phase 3 diachronous
evolution to graben faulting augmenting counter-regional faults. E) Phase 4 formation of salt tongue that
progressively climbs above the isostatically adjusting sediments during overthrusting.
Animation 1: Model 1 results showing effect of progradation at Vsp = 0.5 cm/yr of frictional-plastic sediments
over salt. Color coding for all animations: salt (magenta), pre-existing sediments (gold), prograding sediments
(10 Myr depositional intervals, orange through red cycles, each comprising five variably shaded bands of 2 Myr
duration). All overburden sediments have the same effective internal angle of friction, 20°, and density 2300
kg/m3. Salt is linearly viscous with viscosity 1018 Pa.s, density 2200 kg/m3, and is initially 1 km thick. 0-28.5
Myr: Phase 1 formation of mini-basins (100-180 km) during early sediment progradation. Note Poiseuille and
Couette styles of flow in salt shown by deformed Lagrangian tracking grid. 28.5-40.5 Myr: Phase 2 extension
and normal growth faulting, deflation of proximal diapirs (138 km), and development of distal mini-basins and
triangular shaped diapirs. 40.5-60.5 Myr: Phase 3 continued extension of slope region, formation of pre-rafts
and rafts of older sediments, continued 'inversion' of mini-basins, and evacuation of salt. 60.5-100.5 Myr: Phase
4 formation of large overthrust salt tongue carrying existing mini-basins. The phases evolve diachronously from
proximal to distal regions.
Animation 2: Model 2 has the same properties as Model 1 except that the salt has the same density as the
sediments, 2300 kg/m3. 0-28 Myr: Phase 1 evolution of wide continuous mini-basin and Couette flow of salt
shown by deformed Lagrangian marker grid. 28-40 Myr: Phase 2 extension and normal growth faulting, local
'inversion' within the wide mini-basin. 40-60 Myr: Phase 3 wholesale extension of the overburden and formation
of rafts, efficient evacuation of salt to form dipping interface between salt and overburden and no significant
diapirs. 60-100 Myr: Phase 4 formation of allochthonous overthrust salt tongue.

Animation 3: Model 3 has the same properties as Model 1 except that the salt is much less dense than the
sediments, 1900 kg/m3. 0-28 Myr: Phase 1 enhanced development of mini-basins and diapirs and onset of
normal growth faulting. 28-40 Myr: Phase 2 development of mock-turtle structures and massive salt walls
during extension of the overburden. 40-64 Myr: Phase 3 continued extension of slope region and formation of
salt diapirs. 64-100 Myr: Phase 4 formation of allochthonous overthrust salt tongue, counter-regional faults and
proximal graben structures.
Animation 4: Model 4 is the same as Model 1 except that there is an initial basinward tilt of 0.2° of the entire
model. 0-28 Myr: Phase 1 development of wide mini-basin and adjacent discrete mini-basins, onset of
extensional growth faulting and local inversions in the interior of the single wide mini-basin. 28-40 Myr: Phases
2 and 3 extension and normal growth faulting, formation of distal mini-basins, and flow of salt beyond distal
depositional limit. 40-82 Myr: Phase 4 enhanced evacuation and flow of the salt forming allochthonous
overthrust tongue, seaward advection of mini-basins that were formed at the base of the slope in Phase 3,
continued wholesale extension of the slope region with widespread rafting of older sedimentary packages.
Animation 5: Model 5 is the same as Model 1 except the system is locally isostatically compensated for the
weight of the salt and sediments and assumed water loading above the sediments to the level of the prograding
shelf (5500 m). The mantle density used in the isostatic calculation is 3200 kg/m3. 0-20 Myr: Phase 1
development of mini-basins and associated diapirs. 20-32 Myr: Phase 2 onset of extensional normal fauting
during sediment progradation. 32-60 Myr: Phase 2 landward tilting of salt and development of counter-regional
normal growth faults. 60-80 Myr: Phase 3 diachronous evolution to graben, faulting augmenting counter-
regional faults. 80-108 Myr: Phase 4 evacuation and thickening of distal salt and formation of salt tongue that
progressively climbs above the isostatically adjusting sediments during overthrusting.

No horizontal movementof overburden
Overburden movingas rigid block
Overburden movingas rigid block
Poiseuille flow
Couette flow dominates
Combination of Poiseuilleand Couette flow
A
C
B
Landward
Seaward

l =400 km
h = 1.0 km
z
x
x = 500 kmx,z = 0 km
z = 5.5 km
c
300 km
h = 0.01 km2
10 Myrdeposition10 Myrdeposition
� �=2200 kg/m, =10 Pa.s183
h = 4.5 kmh = 4.5 km11
� �=2300 kg/m, =20� �=2300 kg/m, =20oo33
effeff
Vertical exaggeration (VE) = 28

A
B
C
Model 1
D
Phase 1 (t = 10 Myr)
Phase 2 (t = 32 Myr)
Phase 3 (t = 42 Myr)
Phase 4 (t = 95 Myr)
MINI-BASINS
EXTENSIONALFAULTING
TURTLESTRUCTURE
100 120 140 160 180
3.02.52.01.51.00.50.0
z(k
m)
x (km)
100 120 140 160 180
3.02.52.01.51.00.50.0
z(k
m)
x (km)
100 120 140 160 180
3.02.52.01.51.00.50.0
z(k
m)
x (km)
360 400 440 480
3.53.02.52.01.51.00.50.0
z(k
m)
x (km)
MINI-BASINS
VE = 6
VE = 6
VE = 6
VE = 8

A
B
Model 2 Phase 4 (t = 84 Myr)
Phase 4 (t = 84 Myr)Model 1
VE = 12.5
VE = 12.5
100 200 300 400
5.0
4.0
3.0
2.0
1.0
0.0
z(k
m)
x (km)
100 200 300 400
5.0
4.0
3.0
2.0
1.0
0.0
z(k
m)
x (km)

A
B
Model 3 Phase 1 (t = 20 Myr)
Phase 2 (t = 40 Myr)
VE = 6
VE = 9 MOCK TURTLESTRUCTURE
100 120 140 160 180
3.02.52.01.51.00.50.0
z(k
m)
x (km)
100 120 140 160 180 200 220 240
3.02.52.01.51.00.50.0
z(k
m)
x (km)

A
B
Model 4 Phase 1 (t = 20 Myr)
Phase 3 (t = 50 Myr)Model 1
BPhase 4 (t = 50 Myr)Model 4
VE = 6
VE = 11.5
VE = 11.5
100 120 140 160 180
3.02.52.01.51.00.50.0
z(k
m)
x (km)
100 200 300 400
5.0
4.0
3.0
2.0
1.0
0.0
z(k
m)
x (km)
100 200 300 400
5.0
4.0
3.0
2.0
1.0
0.0
z(k
m)
x (km)

A
B
C
Model 5 Phase 1 (t = 16 Myr)
Phase 2 (t = 28 Myr)
Phase 2 (t = 56 Myr)
VE = 2
VE = 2
VE =2
100 120 140 160 180
4.0
2.0
0.0
-2.0
-4.0
z(k
m)
x (km)
100 120 140 160 180
4.0
2.0
0.0
-2.0
-4.0
z(k
m)
x (km)
100 120 140 160 180
4.0
2.0
0.0
-2.0
-4.0
z(k
m)
x (km)

D
E
Model 5 Phase 3 (t = 76 Myr)
Phase 4 (t = 104 Myr)
VE = 2
VE =2.5
120 140 160 180 200 220
4.0
2.0
0.0
-2.0
-4.0
z(k
m)
x (km)
320 340 360 380 400 420 440
4.0
2.0
0.0
-2.0
-4.0
z(k
m)
x (km)