Numerical Modeling of Flexible Pavement Constructed On ... · Mostafa Deep Hashem Civil Engineering...
16
European International Journal of Science and Technology Vol. 2 No. 10 December, 2013 19 Numerical Modeling of Flexible Pavement Constructed On Expansive Soils Mostafa Deep Hashem 1 , Ahmed Mousa Abu-Baker 2 1,2 Associate Prof, Civil Engineering Department Faculty of Engineering, Al-Minia University, EGYPT *Corresponding author: Mostafa Deep Hashem Civil Engineering Department Faculty of Engineering, Al-Minia University, EGYPT Email: [email protected] . Abstract Expansive soils are the soils which swell significantly when come in contact with water and shrink when water squeezes out. Roads constructed on these soils are subjected to large uplifting forces caused by the swelling. These forces will induce heaving, cracking, and breakup of roads. This paper discusses the findings on analysis results of a pavement structure constructed on dry and saturated expansive subgrade soil through numerical analysis using the Finite Elements Method. Plaxis program v8.2 was used to model the soil behavior. The structure was subjected to the loads from two trucks with dual wheel load of 350kN/m 2 per axle. Modeling was performed by a static plain strain analysis and the element mesh consisted of triangular elements each with 15 nodes. The results showed that the values of vertical displacement for saturated drained subgrade and dry undrained subgrade were much higher than that occurs in dry drained subgrade. The values of vertical displacement under the center of shoulder were very lower compared with that occurs under the center of different wheel loads. Keywords: Flexible pavements, expansive soil, finite elementmethod,plaxis v8.2, soil behavior. 1. Introduction Expansive soils are the soils which swell significantly when come in contact with water and shrink when the water squeezes out. The severity of damages done by expansive soil has been well documented in literature worldwide (Chen, 1988; Nelson and Miller, 1992; Gourley et al., 1993).Expansive soil swellsduring rainy seasons as they absorb water and shrink when this water evaporates. Because of this extreme volumechange, it causes distress to many civil engineering structures. There are many plastic types of clay that swell considerably when water is added to them and then shrink with the loss of water. Roads constructed on these clays are subjected to large uplifting forces caused by the swelling. These forces will induce heaving,
Transcript of Numerical Modeling of Flexible Pavement Constructed On ... · Mostafa Deep Hashem Civil Engineering...

European International Journal of Science and Technology Vol. 2 No. 10 December, 2013
19
Numerical Modeling of Flexible Pavement Constructed On
Expansive Soils
Mostafa Deep Hashem1, Ahmed Mousa Abu-Baker
2
1,2Associate Prof, Civil Engineering Department
Faculty of Engineering, Al-Minia University, EGYPT
*Corresponding author:
Mostafa Deep Hashem
Civil Engineering Department
Faculty of Engineering,
Al-Minia University, EGYPT
Email: [email protected].
Abstract
Expansive soils are the soils which swell significantly when come in contact with water and shrink when
water squeezes out. Roads constructed on these soils are subjected to large uplifting forces caused by the
swelling. These forces will induce heaving, cracking, and breakup of roads. This paper discusses the
findings on analysis results of a pavement structure constructed on dry and saturated expansive subgrade
soil through numerical analysis using the Finite Elements Method. Plaxis program v8.2 was used to model
the soil behavior. The structure was subjected to the loads from two trucks with dual wheel load of
350kN/m2
per axle. Modeling was performed by a static plain strain analysis and the element mesh consisted
of triangular elements each with 15 nodes. The results showed that the values of vertical displacement for
saturated drained subgrade and dry undrained subgrade were much higher than that occurs in dry drained
subgrade. The values of vertical displacement under the center of shoulder were very lower compared with
that occurs under the center of different wheel loads.
Keywords: Flexible pavements, expansive soil, finite elementmethod,plaxis v8.2, soil behavior.
1. Introduction
Expansive soils are the soils which swell significantly when come in contact with water and shrink when the
water squeezes out. The severity of damages done by expansive soil has been well documented in literature
worldwide (Chen, 1988; Nelson and Miller, 1992; Gourley et al., 1993).Expansive soil swellsduring rainy
seasons as they absorb water and shrink when this water evaporates. Because of this extreme volumechange,
it causes distress to many civil engineering structures. There are many plastic types of clay that swell
considerably when water is added to them and then shrink with the loss of water. Roads constructed on these
clays are subjected to large uplifting forces caused by the swelling. These forces will induce heaving,
European International Journal of Science and Technology ISSN: 2304-9693 www.eijst.org.uk
20
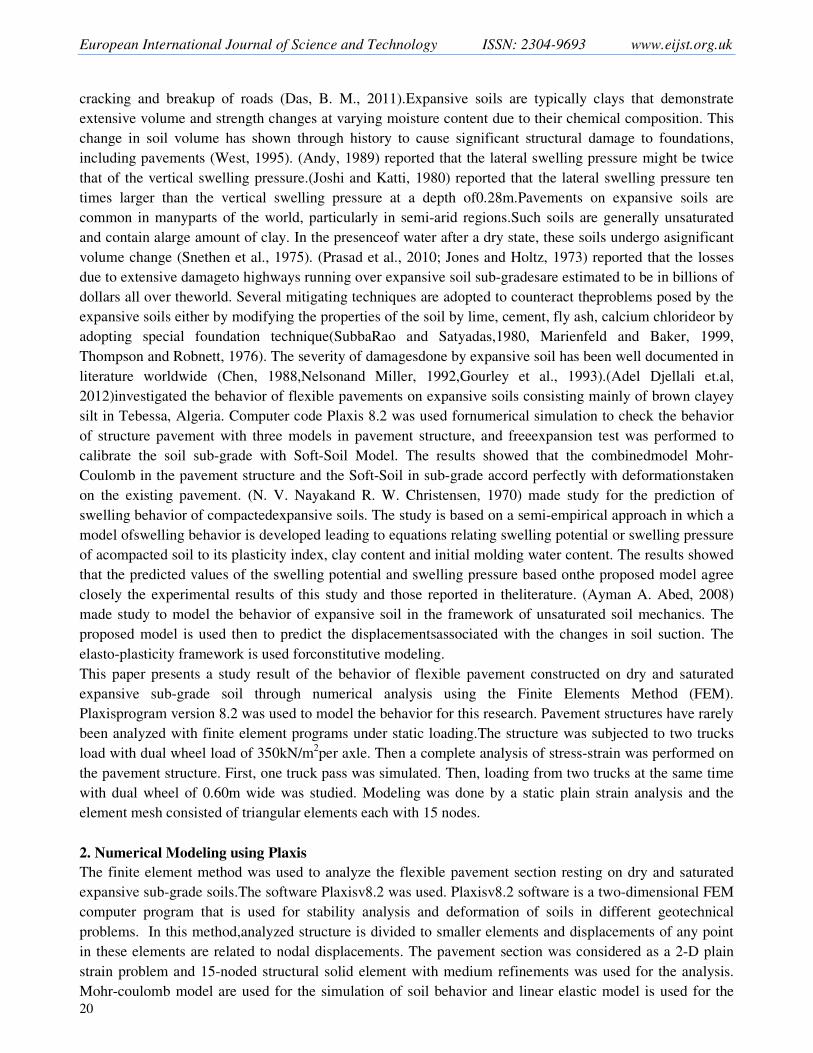
cracking and breakup of roads (Das, B. M., 2011).Expansive soils are typically clays that demonstrate
extensive volume and strength changes at varying moisture content due to their chemical composition. This
change in soil volume has shown through history to cause significant structural damage to foundations,
including pavements (West, 1995). (Andy, 1989) reported that the lateral swelling pressure might be twice
that of the vertical swelling pressure.(Joshi and Katti, 1980) reported that the lateral swelling pressure ten
times larger than the vertical swelling pressure at a depth of0.28m.Pavements on expansive soils are
common in manyparts of the world, particularly in semi-arid regions.Such soils are generally unsaturated
and contain alarge amount of clay. In the presenceof water after a dry state, these soils undergo asignificant
volume change (Snethen et al., 1975). (Prasad et al., 2010; Jones and Holtz, 1973) reported that the losses
due to extensive damageto highways running over expansive soil sub-gradesare estimated to be in billions of
dollars all over theworld. Several mitigating techniques are adopted to counteract theproblems posed by the
expansive soils either by modifying the properties of the soil by lime, cement, fly ash, calcium chlorideor by
adopting special foundation technique(SubbaRao and Satyadas,1980, Marienfeld and Baker, 1999,
Thompson and Robnett, 1976). The severity of damagesdone by expansive soil has been well documented in
literature worldwide (Chen, 1988,Nelsonand Miller, 1992,Gourley et al., 1993).(Adel Djellali et.al,
2012)investigated the behavior of flexible pavements on expansive soils consisting mainly of brown clayey
silt in Tebessa, Algeria. Computer code Plaxis 8.2 was used fornumerical simulation to check the behavior
of structure pavement with three models in pavement structure, and freeexpansion test was performed to
calibrate the soil sub-grade with Soft-Soil Model. The results showed that the combinedmodel Mohr-
Coulomb in the pavement structure and the Soft-Soil in sub-grade accord perfectly with deformationstaken
on the existing pavement. (N. V. Nayakand R. W. Christensen, 1970) made study for the prediction of
swelling behavior of compactedexpansive soils. The study is based on a semi-empirical approach in which a
model ofswelling behavior is developed leading to equations relating swelling potential or swelling pressure
of acompacted soil to its plasticity index, clay content and initial molding water content. The results showed
that the predicted values of the swelling potential and swelling pressure based onthe proposed model agree
closely the experimental results of this study and those reported in theliterature. (Ayman A. Abed, 2008)
made study to model the behavior of expansive soil in the framework of unsaturated soil mechanics. The
proposed model is used then to predict the displacementsassociated with the changes in soil suction. The
elasto-plasticity framework is used forconstitutive modeling.
This paper presents a study result of the behavior of flexible pavement constructed on dry and saturated
expansive sub-grade soil through numerical analysis using the Finite Elements Method (FEM).
Plaxisprogram version 8.2 was used to model the behavior for this research. Pavement structures have rarely
been analyzed with finite element programs under static loading.The structure was subjected to two trucks
load with dual wheel load of 350kN/m2per axle. Then a complete analysis of stress-strain was performed on
the pavement structure. First, one truck pass was simulated. Then, loading from two trucks at the same time
with dual wheel of 0.60m wide was studied. Modeling was done by a static plain strain analysis and the
element mesh consisted of triangular elements each with 15 nodes.
2. Numerical Modeling using Plaxis
The finite element method was used to analyze the flexible pavement section resting on dry and saturated
expansive sub-grade soils.The software Plaxisv8.2 was used. Plaxisv8.2 software is a two-dimensional FEM
computer program that is used for stability analysis and deformation of soils in different geotechnical
problems. In this method,analyzed structure is divided to smaller elements and displacements of any point
in these elements are related to nodal displacements. The pavement section was considered as a 2-D plain
strain problem and 15-noded structural solid element with medium refinements was used for the analysis.
Mohr-coulomb model are used for the simulation of soil behavior and linear elastic model is used for the

European International Journal of Science and Technology Vol. 2 No. 10 December, 2013
21
simulation of asphalt concrete layer. The thickness of each layer in the pavement section resting on
expansive sub-grade soils, the material parameters and constitutive models used were shown in Table1. The
total thickness of the pavement was 0.5 m. 2m thickness clayey silt sub-grade was covered with a 0.20 m
layer of crushed gravel as sub-base, 0.20 m crushed gravel as base course and 0.1 m asphalt concrete on
top.The bottom of model was fixed in both vertical and horizontal directions. Both edges of the models were
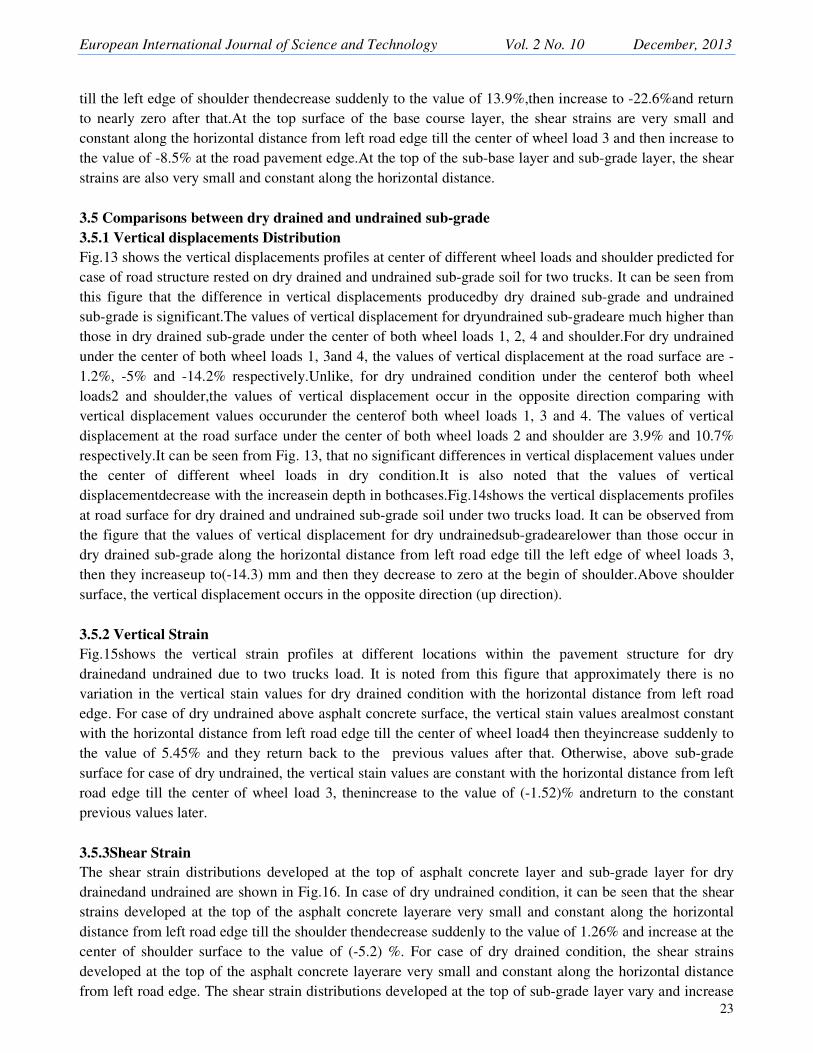
restricted from horizontal movement. The structure was subjected to the loads from two trucks with dual
wheel load of 350kN/m2 per axle and distributed over a circular area of radius 30 cm. To model the surface
load of the dual wheel, the total load is transferred to the pavement surface through an average contact
pressure of 350 kPa as shown in Fig.1.At first, passing of just one truck was simulated. Then, loading from
two trucks at the same time with dual wheel of 0.60m wide was studied as shown in Fig.1. For case of
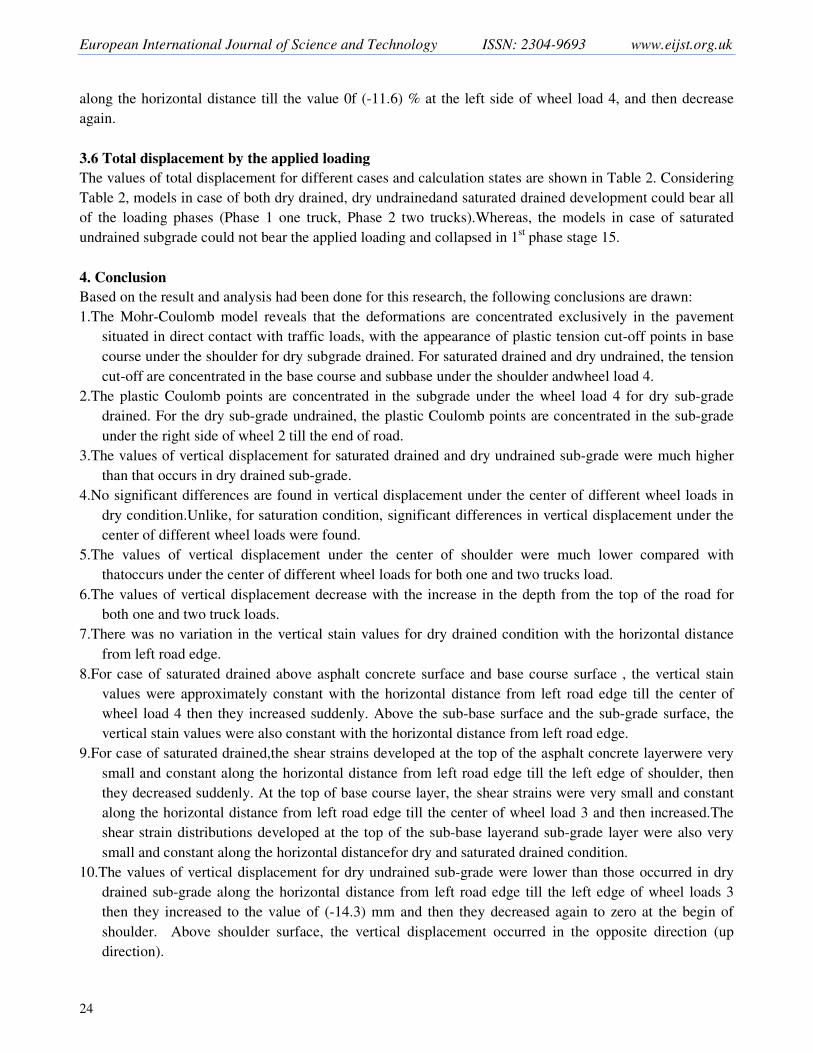
saturated expansive soil sub-grade, the ground water level was modeled as a phreatic level at the top surface
of sub-grade according to actual field ground water condition as shown in Fig.2.After defining the material
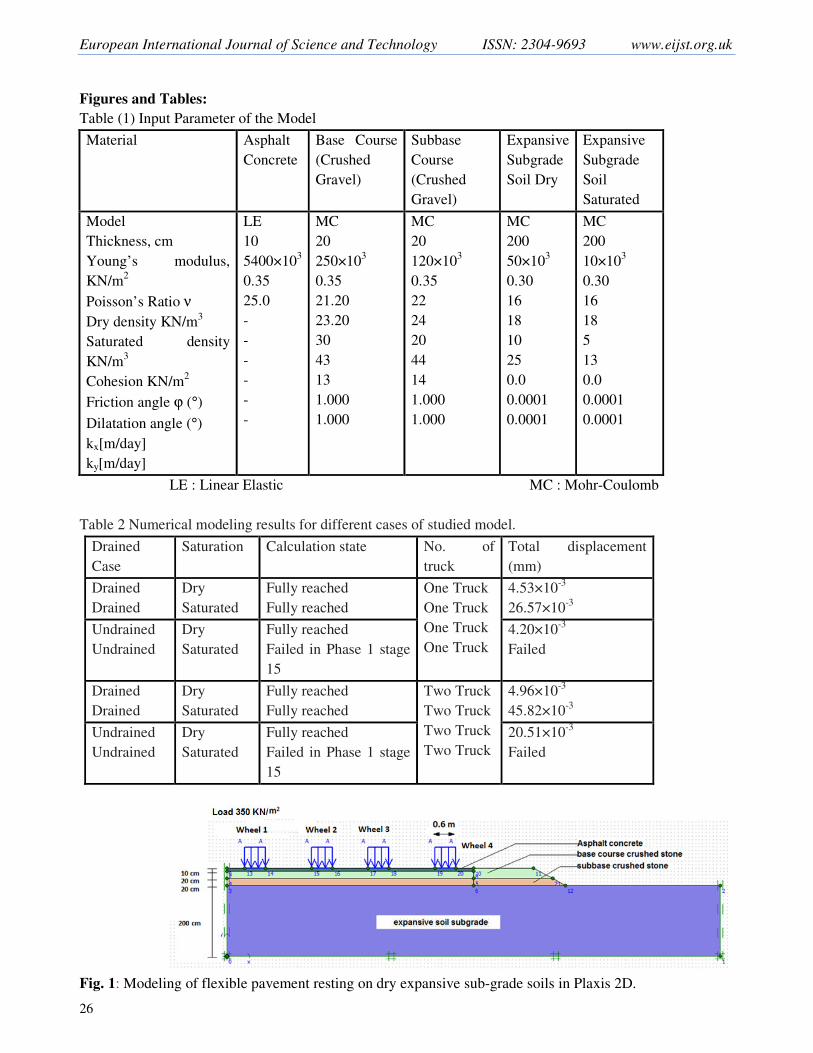
properties and boundary conditions the finite element mesh is generated as shown in Fig.3.
3. Results and Discussion
3.1 Deformation behaviors by the Finite Elements simulation
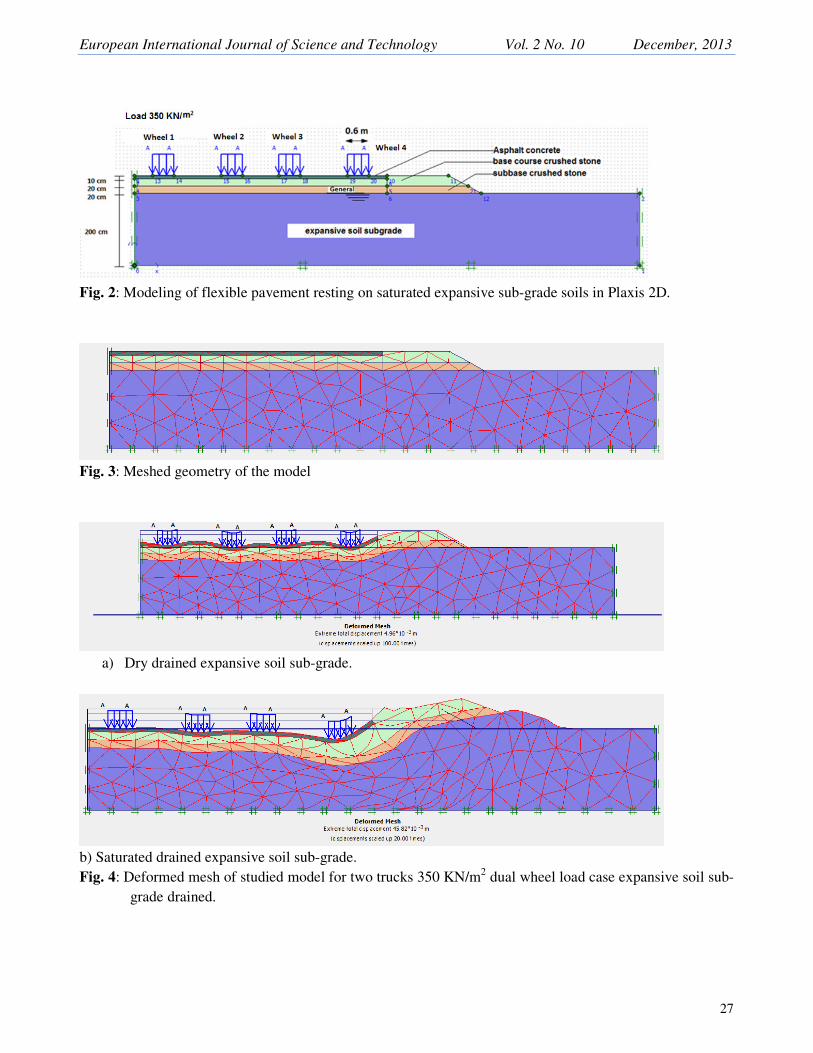
Fig.4showsthe deformed mesh and settlementbehavior of the Finite Elements models for dry and saturated
drained expansive sub-grade soil studied. The figureshows that the difference of deformation behavior
producedby dry and saturated drained sub-gradeis significant.As shown inFig.4.a, the value of total
displacement for dry expansive subgrade soil drained is4.96×10-3
m, whileits value for saturated expansive
sub-grade soil drained is45.82×10-3
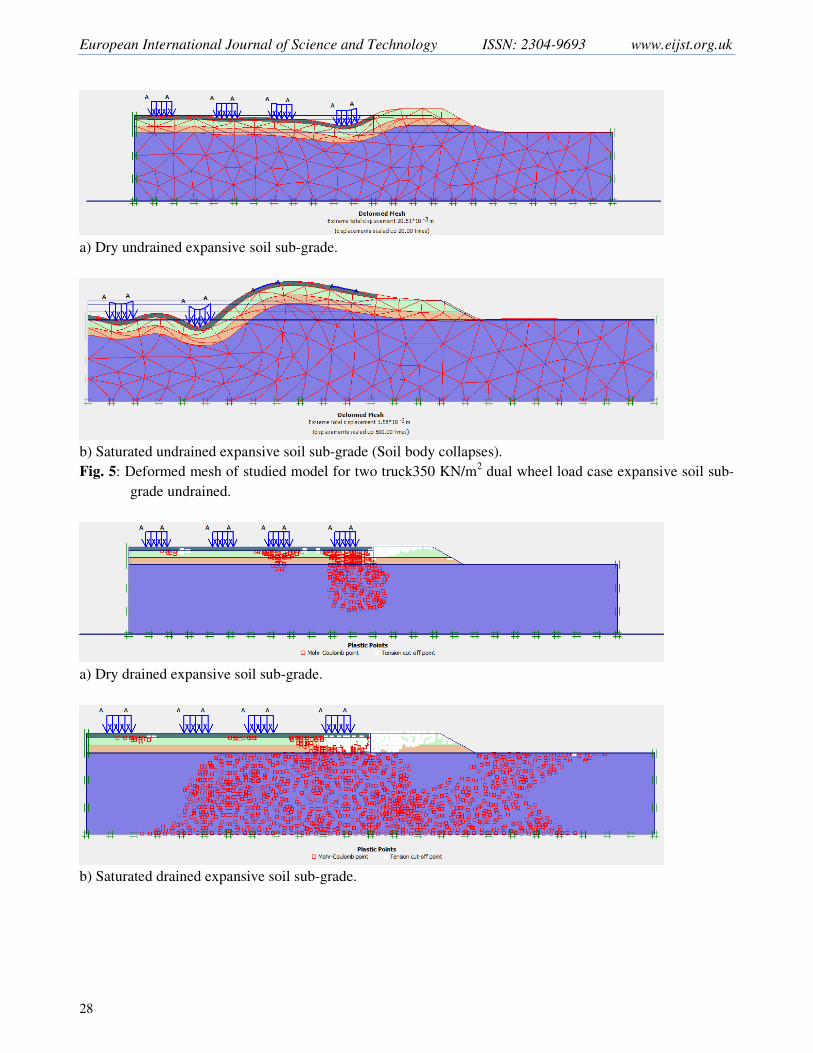
m as shown inFig.4.b. Fig.5shows the deformed mesh and
settlementbehavior of the Finite Elements models for dry and saturated undrained expansive sub-grade soil
studied. The figureshows that the difference of deformation behavior producedby dry and saturated
undrained sub-grade is significant. As shown in Fig.5.a, the value of total displacement for dry expansive
sub-grade soil undrained is20.51×10-3
m, while for saturated expansive sub-grade soil,the soil body
collapsed as shown in Fig.5.b.
3.2 plastic points and tension cut-off
The modeling results have been presented in Fig.6. Linear Elastic model was appliedfor asphalt concrete
layer and Mohr-Coulomb model was appliedfor the other soil layers. Fig.6 shows the plastic points in sub-
grade and pavement in the model. It is observed that the plastic Coulomb points are concentrated in the sub-
grade under the wheel load 4 for dry sub-grade drained. For the dry sub-grade undrained, the plastic
Coulomb points are concentrated in the sub-grade underthe right side of wheel 2 till the end of road. The
tensile stresses (tension cut-off) are concentrated in the base course under the shoulder for dry sub-grade
drained. For saturated drained and dry undrained, the tensile stresses (tension cut-off) are concentrated in the
base course and sub-base under the shoulder andwheel load 4.
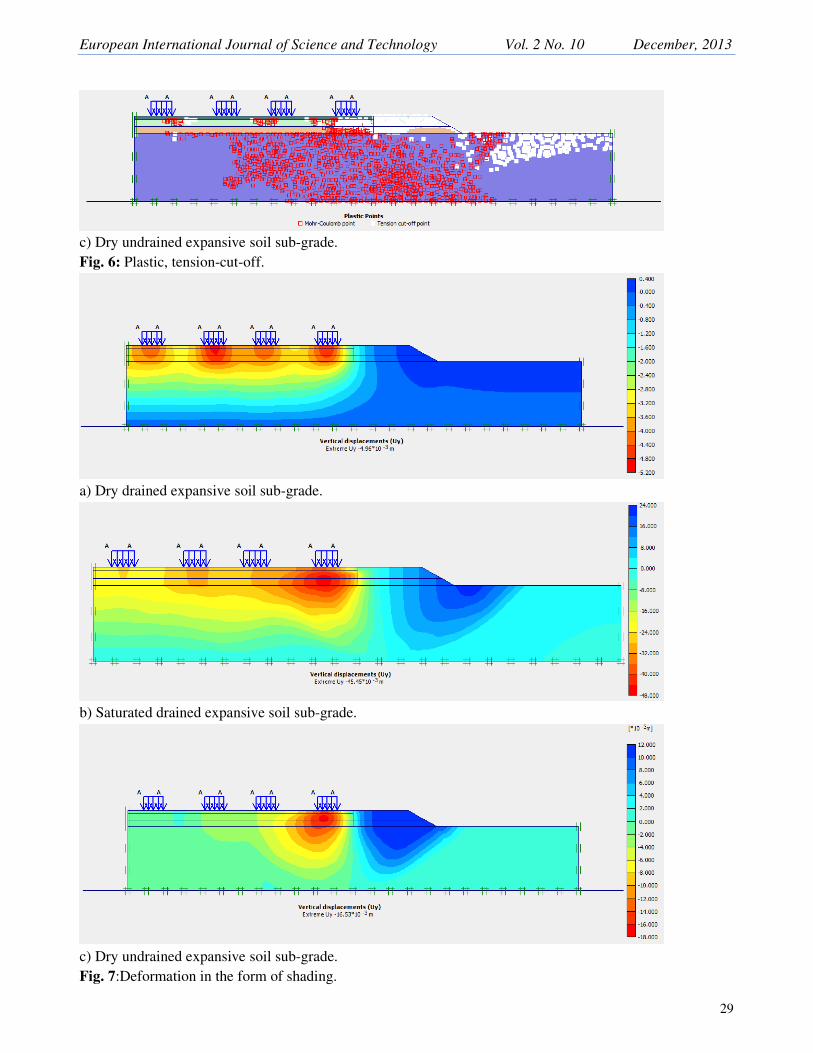
3.3 Deformation in the form of shading
Fig.7 illustrates the deformation after two cycles of loading. The figure depicts that for dry drained sub-
grade, the total displacement is 4.96x10⁻³
m, whilefor saturated sub-grade drained,the total displacement
is45.45x10-3
m. For dry undrained sub-grade, the total displacement is 16.53x10⁻³
m. On the other hand, it
was evidenced in the dry undrained sub-grade results that the movements had concentrated largely in sub-
grade beneath the wheel 4 with maximum displacement of 16.53x10⁻³
m.
European International Journal of Science and Technology ISSN: 2304-9693 www.eijst.org.uk
22
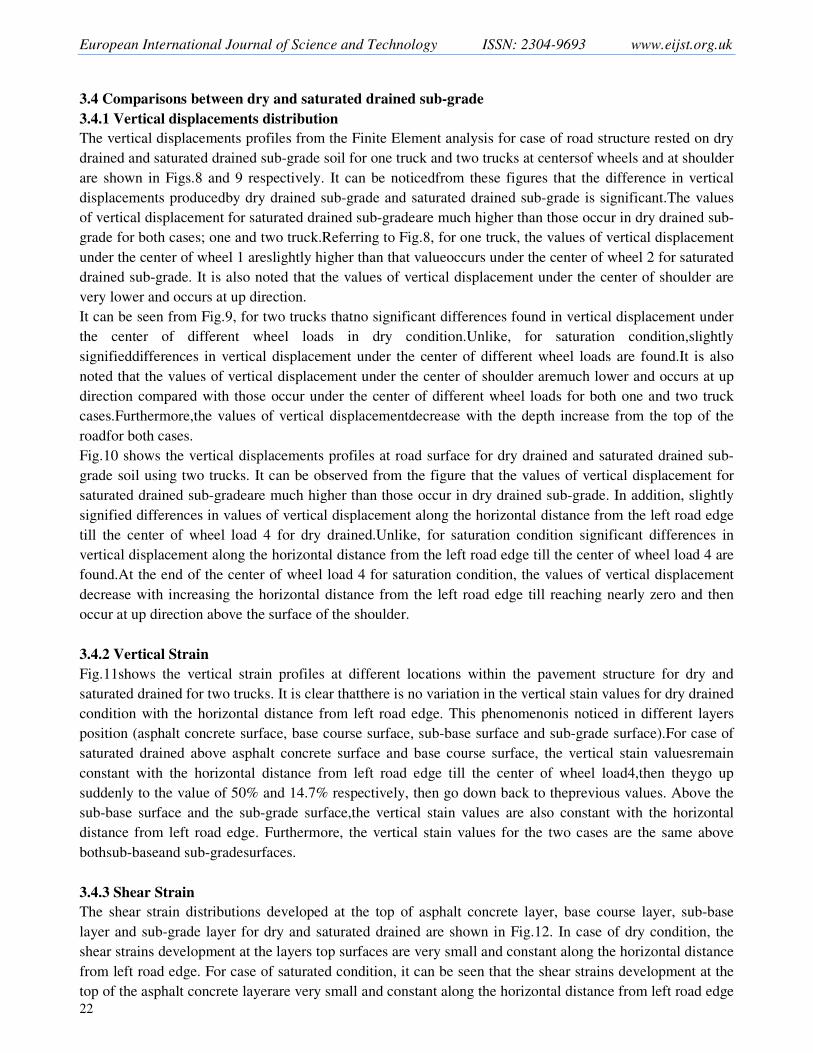
3.4 Comparisons between dry and saturated drained sub-grade
3.4.1 Vertical displacements distribution
The vertical displacements profiles from the Finite Element analysis for case of road structure rested on dry
drained and saturated drained sub-grade soil for one truck and two trucks at centersof wheels and at shoulder
are shown in Figs.8 and 9 respectively. It can be noticedfrom these figures that the difference in vertical
displacements producedby dry drained sub-grade and saturated drained sub-grade is significant.The values
of vertical displacement for saturated drained sub-gradeare much higher than those occur in dry drained sub-
grade for both cases; one and two truck.Referring to Fig.8, for one truck, the values of vertical displacement
under the center of wheel 1 areslightly higher than that valueoccurs under the center of wheel 2 for saturated
drained sub-grade. It is also noted that the values of vertical displacement under the center of shoulder are
very lower and occurs at up direction.
It can be seen from Fig.9, for two trucks thatno significant differences found in vertical displacement under
the center of different wheel loads in dry condition.Unlike, for saturation condition,slightly
signifieddifferences in vertical displacement under the center of different wheel loads are found.It is also
noted that the values of vertical displacement under the center of shoulder aremuch lower and occurs at up
direction compared with those occur under the center of different wheel loads for both one and two truck
cases.Furthermore,the values of vertical displacementdecrease with the depth increase from the top of the
roadfor both cases.
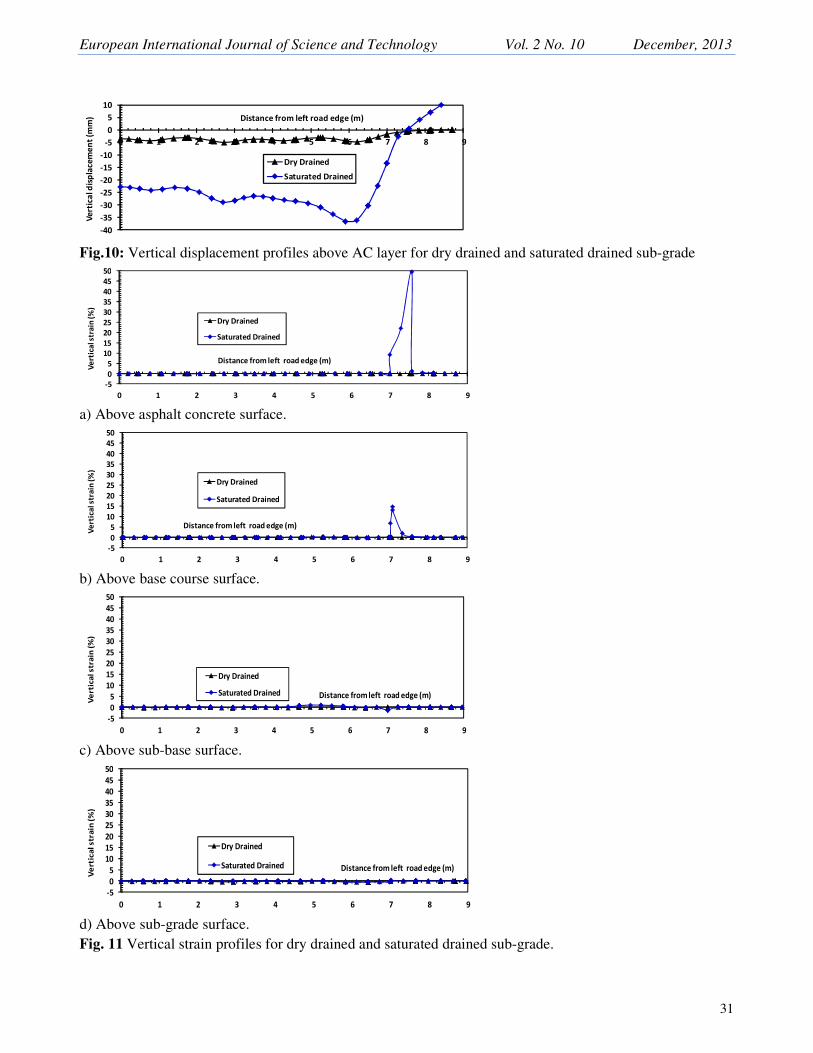
Fig.10 shows the vertical displacements profiles at road surface for dry drained and saturated drained sub-
grade soil using two trucks. It can be observed from the figure that the values of vertical displacement for
saturated drained sub-gradeare much higher than those occur in dry drained sub-grade. In addition, slightly
signified differences in values of vertical displacement along the horizontal distance from the left road edge
till the center of wheel load 4 for dry drained.Unlike, for saturation condition significant differences in
vertical displacement along the horizontal distance from the left road edge till the center of wheel load 4 are
found.At the end of the center of wheel load 4 for saturation condition, the values of vertical displacement
decrease with increasing the horizontal distance from the left road edge till reaching nearly zero and then
occur at up direction above the surface of the shoulder.
3.4.2 Vertical Strain
Fig.11shows the vertical strain profiles at different locations within the pavement structure for dry and
saturated drained for two trucks. It is clear thatthere is no variation in the vertical stain values for dry drained
condition with the horizontal distance from left road edge. This phenomenonis noticed in different layers
position (asphalt concrete surface, base course surface, sub-base surface and sub-grade surface).For case of
saturated drained above asphalt concrete surface and base course surface, the vertical stain valuesremain
constant with the horizontal distance from left road edge till the center of wheel load4,then theygo up
suddenly to the value of 50% and 14.7% respectively, then go down back to theprevious values. Above the
sub-base surface and the sub-grade surface,the vertical stain values are also constant with the horizontal
distance from left road edge. Furthermore, the vertical stain values for the two cases are the same above
bothsub-baseand sub-gradesurfaces.
3.4.3 Shear Strain
The shear strain distributions developed at the top of asphalt concrete layer, base course layer, sub-base
layer and sub-grade layer for dry and saturated drained are shown in Fig.12. In case of dry condition, the
shear strains development at the layers top surfaces are very small and constant along the horizontal distance
from left road edge. For case of saturated condition, it can be seen that the shear strains development at the
top of the asphalt concrete layerare very small and constant along the horizontal distance from left road edge
European International Journal of Science and Technology Vol. 2 No. 10 December, 2013
23
till the left edge of shoulder thendecrease suddenly to the value of 13.9%,then increase to -22.6%and return
to nearly zero after that.At the top surface of the base course layer, the shear strains are very small and
constant along the horizontal distance from left road edge till the center of wheel load 3 and then increase to
the value of -8.5% at the road pavement edge.At the top of the sub-base layer and sub-grade layer, the shear
strains are also very small and constant along the horizontal distance.
3.5 Comparisons between dry drained and undrained sub-grade
3.5.1 Vertical displacements Distribution
Fig.13 shows the vertical displacements profiles at center of different wheel loads and shoulder predicted for
case of road structure rested on dry drained and undrained sub-grade soil for two trucks. It can be seen from
this figure that the difference in vertical displacements producedby dry drained sub-grade and undrained
sub-grade is significant.The values of vertical displacement for dryundrained sub-gradeare much higher than
those in dry drained sub-grade under the center of both wheel loads 1, 2, 4 and shoulder.For dry undrained
under the center of both wheel loads 1, 3and 4, the values of vertical displacement at the road surface are -
1.2%, -5% and -14.2% respectively.Unlike, for dry undrained condition under the centerof both wheel
loads2 and shoulder,the values of vertical displacement occur in the opposite direction comparing with
vertical displacement values occurunder the centerof both wheel loads 1, 3 and 4. The values of vertical
displacement at the road surface under the center of both wheel loads 2 and shoulder are 3.9% and 10.7%
respectively.It can be seen from Fig. 13, that no significant differences in vertical displacement values under
the center of different wheel loads in dry condition.It is also noted that the values of vertical
displacementdecrease with the increasein depth in bothcases.Fig.14shows the vertical displacements profiles
at road surface for dry drained and undrained sub-grade soil under two trucks load. It can be observed from
the figure that the values of vertical displacement for dry undrainedsub-gradearelower than those occur in
dry drained sub-grade along the horizontal distance from left road edge till the left edge of wheel loads 3,
then they increaseup to(-14.3) mm and then they decrease to zero at the begin of shoulder.Above shoulder
surface, the vertical displacement occurs in the opposite direction (up direction).
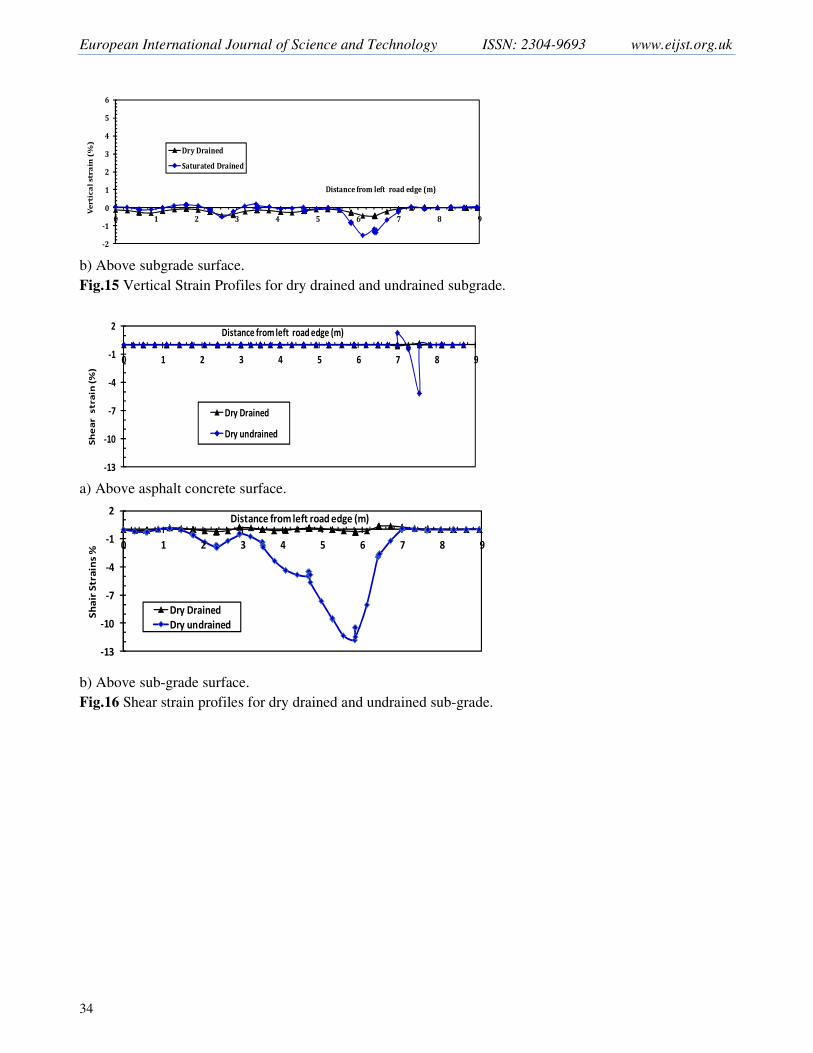
3.5.2 Vertical Strain
Fig.15shows the vertical strain profiles at different locations within the pavement structure for dry
drainedand undrained due to two trucks load. It is noted from this figure that approximately there is no
variation in the vertical stain values for dry drained condition with the horizontal distance from left road
edge. For case of dry undrained above asphalt concrete surface, the vertical stain values arealmost constant
with the horizontal distance from left road edge till the center of wheel load4 then theyincrease suddenly to
the value of 5.45% and they return back to the previous values after that. Otherwise, above sub-grade
surface for case of dry undrained, the vertical stain values are constant with the horizontal distance from left
road edge till the center of wheel load 3, thenincrease to the value of (-1.52)% andreturn to the constant
previous values later.
3.5.3Shear Strain
The shear strain distributions developed at the top of asphalt concrete layer and sub-grade layer for dry
drainedand undrained are shown in Fig.16. In case of dry undrained condition, it can be seen that the shear
strains developed at the top of the asphalt concrete layerare very small and constant along the horizontal
distance from left road edge till the shoulder thendecrease suddenly to the value of 1.26% and increase at the
center of shoulder surface to the value of (-5.2) %. For case of dry drained condition, the shear strains
developed at the top of the asphalt concrete layerare very small and constant along the horizontal distance
from left road edge. The shear strain distributions developed at the top of sub-grade layer vary and increase
European International Journal of Science and Technology ISSN: 2304-9693 www.eijst.org.uk
24
along the horizontal distance till the value 0f (-11.6) % at the left side of wheel load 4, and then decrease
again.
3.6 Total displacement by the applied loading
The values of total displacement for different cases and calculation states are shown in Table 2. Considering
Table 2, models in case of both dry drained, dry undrainedand saturated drained development could bear all
of the loading phases (Phase 1 one truck, Phase 2 two trucks).Whereas, the models in case of saturated
undrained subgrade could not bear the applied loading and collapsed in 1st phase stage 15.
4. Conclusion
Based on the result and analysis had been done for this research, the following conclusions are drawn:
1.The Mohr-Coulomb model reveals that the deformations are concentrated exclusively in the pavement
situated in direct contact with traffic loads, with the appearance of plastic tension cut-off points in base
course under the shoulder for dry subgrade drained. For saturated drained and dry undrained, the tension
cut-off are concentrated in the base course and subbase under the shoulder andwheel load 4.
2.The plastic Coulomb points are concentrated in the subgrade under the wheel load 4 for dry sub-grade
drained. For the dry sub-grade undrained, the plastic Coulomb points are concentrated in the sub-grade
under the right side of wheel 2 till the end of road.
3.The values of vertical displacement for saturated drained and dry undrained sub-grade were much higher
than that occurs in dry drained sub-grade.
4.No significant differences are found in vertical displacement under the center of different wheel loads in
dry condition.Unlike, for saturation condition, significant differences in vertical displacement under the
center of different wheel loads were found.
5.The values of vertical displacement under the center of shoulder were much lower compared with
thatoccurs under the center of different wheel loads for both one and two trucks load.
6.The values of vertical displacement decrease with the increase in the depth from the top of the road for
both one and two truck loads.
7.There was no variation in the vertical stain values for dry drained condition with the horizontal distance
from left road edge.
8.For case of saturated drained above asphalt concrete surface and base course surface , the vertical stain
values were approximately constant with the horizontal distance from left road edge till the center of
wheel load 4 then they increased suddenly. Above the sub-base surface and the sub-grade surface, the
vertical stain values were also constant with the horizontal distance from left road edge.
9.For case of saturated drained,the shear strains developed at the top of the asphalt concrete layerwere very
small and constant along the horizontal distance from left road edge till the left edge of shoulder, then
they decreased suddenly. At the top of base course layer, the shear strains were very small and constant
along the horizontal distance from left road edge till the center of wheel load 3 and then increased.The
shear strain distributions developed at the top of the sub-base layerand sub-grade layer were also very
small and constant along the horizontal distancefor dry and saturated drained condition.
10.The values of vertical displacement for dry undrained sub-grade were lower than those occurred in dry
drained sub-grade along the horizontal distance from left road edge till the left edge of wheel loads 3
then they increased to the value of (-14.3) mm and then they decreased again to zero at the begin of
shoulder. Above shoulder surface, the vertical displacement occurred in the opposite direction (up
direction).

European International Journal of Science and Technology Vol. 2 No. 10 December, 2013
25
11.For case of dry undrained above asphalt concrete surface, the vertical stain values were approximately
constant with the horizontal distance from left road edge till the center of wheel load4 then they
increasedsuddenly to the value of 5.45% before returning back to the constant previous values.
12. In case of dry undrained condition,the shear strains developed at the top of the asphalt concrete
layerwere very small and constant along the horizontal distance from left road edge till the shoulder
wherethey decreased suddenly. At the top of sub-grade layer they increased along the horizontal distance
till the value 0f (-11.6) % at the left side of wheel load 4 and then they decreased again.
13.The models in case of both dry drained, dry undrained and saturated drained sub-grade could bear all of
the loading phases (Phase 1 one truck, Phase 2 two trucks). Whereas, the models in case of saturated
undrained sub-grade could not bear the applied loading and collapsed in 1st phase stage 15.
5. References
Chen, F.H.(1988) Foundations on expansive soils, Elsevier Science publication, Newyork.
Nelson, D.J., and Miller, D.J. (1992) Expansive soils, problems and practice in foundation and pavement
engineering, John wiley and Sons, Newyork.
Gourley, C.S., Newill, D., and Shreiner, H.D.(1993) “Expansive soils:TRL’s research strategy, ” Proc.Int.
Symposium on engineering characteristics of arid soils.
Das, B. M. Principles of Foundation Engineering. (2011).7th edition.Cengage Learning.
West, T R (1995), Geology Applied to Engineering, Prentice Hall.
Andy, B.F.,(1989), "Laboratory evaluation of lateral swelling pressure,"Journal ofGeotechnical Engineering
. ASCE, Vol. 115, No.lO, pp. 1481-1486.
JoshiR.P.,andKatti,R.K.,(1980),"Lateral pressure development under surcharges,"proceedings , 4th
International Conference on expansive soils, Denver, CO, pp. 227-241
Snethen, D. R., Townsend, F. C., Johnson, L. D., Patrick, D. M. and Vedros, S. P. J. (1975) “Review of
engineeringexperiences with expansive soils in highwaysubgrades”, US Army Engineer Water Ways
ExperimentStation, FHWA, USA.
Prasad, D. S. V., Kumar, M. and Prasadaraju, G.V. R.(2010) “Behavior of reinforced subbases on
expansivesoil subgrade”, Global Journal of Researches in Engineering,Vol. 10, pp. 225-235.
Jones, D. E. and Holtz, W. G. (1973) “Expansive soilsthehidden disaster” , Civil Engineering : American
Societyof Civil Engineers, Vol. 43, No. 8, pp. 49-51.
Subaraob, K. S. and Satyadas, G. C. (1980) “Prewettedand overloaded expansive soil”, Proceedings
ofGeotech. 80, Bombay, pp. 29-32.
Marienfeld, M. L. and Baker, T. L. (1999) “Pavingfabric interlayer as a pavement moisture
barrier”,Transportation Research Circular, E-C006, ISSN 0097-8515.
Thompson, M. R. and Robnett, Q. L. (1976) “Pressureinjected lime for treatment of swelling soils”. In:One
of the 4 reports Prepared for the 54th Annual meetingof the TRB, TRR-568, pp. 24-34.
Djellali A., Ounis A. and SaghafiB., (2012), “Behavior of Flexible Pavements on Expansive Soils”,
International Journal of Transportation Engineering, Vol.1/ No.1/ Winter 2012, PP 1-14.
Nayak,N. V. and Christensen,R. W., “swelling characteristics of compacted, expansive soils”, 1970, Clays
and Clay Minerals, 1971, Vol. 19, pp. 251-261.
AymanA. Abed, (2008), “Numerical Modeling ofExpansive Soil Behavior”, Ph.D thesis, Institute for
geotechnical, Stuttgart University, Germany.
European International Journal of Science and Technology ISSN: 2304-9693 www.eijst.org.uk
26
Figures and Tables:
Table (1) Input Parameter of the Model
Material Asphalt
Concrete
Base Course
(Crushed
Gravel)
Subbase
Course
(Crushed
Gravel)
Expansive
Subgrade
Soil Dry
Expansive
Subgrade
Soil
Saturated
Model
Thickness, cm
Young’s modulus,
KN/m2
Poisson’s Ratio ν
Dry density KN/m3
Saturated density
KN/m3
Cohesion KN/m2
Friction angle ϕ (°)
Dilatation angle (°)
kx[m/day]
ky[m/day]
LE
10
5400×103
0.35
25.0
-
-
-
-
-
-
MC
20
250×103
0.35
21.20
23.20
30
43
13
1.000
1.000
MC
20
120×103
0.35
22
24
20
44
14
1.000
1.000
MC
200
50×103
0.30
16
18
10
25
0.0
0.0001
0.0001
MC
200
10×103
0.30
16
18
5
13
0.0
0.0001
0.0001
LE : Linear Elastic MC : Mohr-Coulomb
Table 2 Numerical modeling results for different cases of studied model.
Drained
Case
Saturation Calculation state No. of
truck
Total displacement
(mm)
Drained
Drained
Dry
Saturated
Fully reached
Fully reached
One Truck
One Truck
One Truck
One Truck
4.53×10⁻³
26.57×10⁻³
Undrained
Undrained
Dry
Saturated
Fully reached
Failed in Phase 1 stage
15
4.20×10⁻³
Failed
Drained
Drained
Dry
Saturated
Fully reached
Fully reached
Two Truck
Two Truck
Two Truck
Two Truck
4.96×10⁻³
45.82×10⁻³
Undrained
Undrained
Dry
Saturated
Fully reached
Failed in Phase 1 stage
15
20.51×10⁻³
Failed
Fig. 1: Modeling of flexible pavement resting on dry expansive sub-grade soils in Plaxis 2D.
European International Journal of Science and Technology Vol. 2 No. 10 December, 2013
27
Fig. 2: Modeling of flexible pavement resting on saturated expansive sub-grade soils in Plaxis 2D.
Fig. 3: Meshed geometry of the model
a) Dry drained expansive soil sub-grade.
b) Saturated drained expansive soil sub-grade.
Fig. 4: Deformed mesh of studied model for two trucks 350 KN/m2 dual wheel load case expansive soil sub-
grade drained.
European International Journal of Science and Technology ISSN: 2304-9693 www.eijst.org.uk
28
a) Dry undrained expansive soil sub-grade.
b) Saturated undrained expansive soil sub-grade (Soil body collapses).
Fig. 5: Deformed mesh of studied model for two truck350 KN/m2 dual wheel load case expansive soil sub-
grade undrained.
a) Dry drained expansive soil sub-grade.
b) Saturated drained expansive soil sub-grade.
European International Journal of Science and Technology Vol. 2 No. 10 December, 2013
29
c) Dry undrained expansive soil sub-grade.
Fig. 6: Plastic, tension-cut-off.
a) Dry drained expansive soil sub-grade.
b) Saturated drained expansive soil sub-grade.
c) Dry undrained expansive soil sub-grade.
Fig. 7:Deformation in the form of shading.

European International Journal of Science and Technology ISSN: 2304-9693 www.eijst.org.uk
30
Fig. 8: vertical displacements profile of dry and saturated drained sub-grade for one truck.
Fig. 9:vertical displacements profile of dry and saturated drained sub-grade for two trucks.
European International Journal of Science and Technology Vol. 2 No. 10 December, 2013
31
-40
-35
-30
-25
-20
-15
-10
-5
0
5
10
0 1 2 3 4 5 6 7 8 9
Ve
rtic
al d
isp
lace
me
nt
(mm
) Distance from left road edge (m)
Dry Drained
Saturated Drained
Fig.10: Vertical displacement profiles above AC layer for dry drained and saturated drained sub-grade
-5
0
5
10
15
20
25
30
35
40
45
50
0 1 2 3 4 5 6 7 8 9
Ve
rtic
al s
tra
in (
%)
Distance from left road edge (m)
Dry Drained
Saturated Drained
a) Above asphalt concrete surface.
-5
0
5
10
15
20
25
30
35
40
45
50
0 1 2 3 4 5 6 7 8 9
Ve
rtic
al str
ain
(%
)
Distance from left road edge (m)
Dry Drained
Saturated Drained
b) Above base course surface.
-5
0
5
10
15
20
25
30
35
40
45
50
0 1 2 3 4 5 6 7 8 9
Ve
rtic
al str
ain
(%
)
Distance from left road edge (m)
Dry Drained
Saturated Drained
c) Above sub-base surface.
-5
0
5
10
15
20
25
30
35
40
45
50
0 1 2 3 4 5 6 7 8 9
Ve
rtic
al str
ain
(%
)
Distance from left road edge (m)
Dry Drained
Saturated Drained
d) Above sub-grade surface.
Fig. 11 Vertical strain profiles for dry drained and saturated drained sub-grade.

European International Journal of Science and Technology ISSN: 2304-9693 www.eijst.org.uk
32
-25
-20
-15
-10
-5
0
5
10
15
0 1 2 3 4 5 6 7 8 9
Sh
ea
r S
tra
in (
%)
Distance from left road edge (m)
Dry Drained
Saturated Drained
a) Above asphalt concrete surface.
-25
-20
-15
-10
-5
0
5
10
15
0 1 2 3 4 5 6 7 8 9
Sh
air
Str
ain
s %
Distance from left road edge (m)
Dry Drained
Saturated Drained
b) Above base course surface.
-25
-20
-15
-10
-5
0
5
10
15
0 1 2 3 4 5 6 7 8 9
Sh
air
Str
ain
s %
Distance from left road edge (m)
Dry Drained
Saturated Drained
c) Above sub-base surface.
-25
-20
-15
-10
-5
0
5
10
15
0 1 2 3 4 5 6 7 8 9
Sh
air
Str
ain
s % Distance from left road edge (m)
Dry Drained
Saturated Drained
d) Above sub-grade surface.
Fig.12 Shear Strain Profiles for dry drained and saturated drained subgrade.

European International Journal of Science and Technology Vol. 2 No. 10 December, 2013
33
Fig.13 Vertical displacements profile of dry drained and undrained sub-grade in case of two trucks.
-15
-10
-5
0
5
10
15
0 1 2 3 4 5 6 7 8 9
Ve
rtic
al D
isp
lace
me
nt
mm
)
Distance from left road edge (m)
Dry Drained
Dry undrained
Fig. 14Vertical displacement profiles above AC layer for dry drained and undrained sub-grade.
-2
-1
0
1
2
3
4
5
6
0 1 2 3 4 5 6 7 8 9
Ve
rtic
al
stra
in (
%)
Distance from left road edge (m)
Dry Drained
Dry undrained
a) Above asphalt concrete surface.
European International Journal of Science and Technology ISSN: 2304-9693 www.eijst.org.uk
34
-2
-1
0
1
2
3
4
5
6
0 1 2 3 4 5 6 7 8 9
Ve
rti
ca
l str
ain
(%
)
Distance from left road edge (m)
Dry Drained
Saturated Drained
b) Above subgrade surface.
Fig.15 Vertical Strain Profiles for dry drained and undrained subgrade.
-13
-10
-7
-4
-1
2
0 1 2 3 4 5 6 7 8 9
Sh
ea
r stra
in (
%)
Distance from left road edge (m)
Dry Drained
Dry undrained
a) Above asphalt concrete surface.
-13
-10
-7
-4
-1
2
0 1 2 3 4 5 6 7 8 9
Sh
air
Str
ain
s %
Distance from left road edge (m)
Dry Drained
Dry undrained
b) Above sub-grade surface.
Fig.16 Shear strain profiles for dry drained and undrained sub-grade.