Numerical Analysis of Embankments on soft...
86
Y X Z Numerical Analysis of Embankments on soft soil Haarajoki Test Embankment Master’s thesis in Structural Engineering and Building Technology AMARDEEP AMAVASAI Department of Civil and Environmental Engineering Division of Geo Engineering CHALMERS UNIVERSITY OF TECHNOLOGY G¨ oteborg, Sweden 2015 Master’s thesis 2015:37
Transcript of Numerical Analysis of Embankments on soft...

Y
XZ
Numerical Analysis of Embankments onsoft soilHaarajoki Test EmbankmentMaster’s thesis in Structural Engineering and Building Technology
AMARDEEP AMAVASAI
Department of Civil and Environmental EngineeringDivision of Geo EngineeringCHALMERS UNIVERSITY OF TECHNOLOGYGoteborg, Sweden 2015Master’s thesis 2015:37


MASTER’S THESIS IN STRUCTURAL ENGINEERING AND BUILDING TECHNOLOGY
Numerical Analysis of Embankments on soft soil
Haarajoki Test Embankment
AMARDEEP AMAVASAI
Department of Civil and Environmental EngineeringDivision of Geo Engineering
CHALMERS UNIVERSITY OF TECHNOLOGY
Goteborg, Sweden 2015

Numerical Analysis of Embankments on soft soilHaarajoki Test EmbankmentAMARDEEP AMAVASAI
c© AMARDEEP AMAVASAI, 2015
Master’s thesis 2015:37ISSN 1652-8557Department of Civil and Environmental EngineeringDivision of Geo EngineeringChalmers University of TechnologySE-412 96 GoteborgSwedenTelephone: +46 (0)31-772 1000
Cover:Numerical simulation of Haarajoki embankment for pore-pressure distribution after 1500 days
Chalmers ReproserviceGoteborg, Sweden 2015

Numerical Analysis of Embankments on soft soilHaarajoki Test EmbankmentMaster’s thesis in Structural Engineering and Building TechnologyAMARDEEP AMAVASAIDepartment of Civil and Environmental EngineeringDivision of Geo EngineeringChalmers University of Technology
Abstract
The purpose of this thesis is to benchmark Creep-Sclay1S model, an advanced constitutivemodel for soft soil analysis, against a well-documented field observation. The objective includeparameter determination for Creep-Sclay1S model in an automated environment using a seriesof newly developed algorithms in MATLAB. A test embankment constructed at Haarajokiin 1997 by the Finnish National Road Administration is considered in this thesis for thevalidation of Creep-Sclay1S model due to well documented long term behaviour of soft soilunder embankment loading. Half of the area is improved with prefabricated vertical drains.In this thesis, the other half comprising of unimproved ground is considered for the analysisFrom geological investigation, the soil deposit in Haarajoki has a high amount of variation dueto its history of intermittent saline and fresh water influx. The initial 2m thick desiccatedclay layer is heavily overconsolidated. The quality of laboratory tests for most of the soilsamples from Haarajoki exhibit poor standard suffering from sampling effects, noisy data andlack of key information. The soil deposits from Haarajoki have been divided into 6 layersbased on the index tests provided. Data from incremental loading tests of Haarajoki samplesare digitized and stored in separate arrays in MATLAB. The data is then manipulated andnecessary parameters are derived by using a set of newly developed algorithms in MATLAB.Experimental simulations using Creep-Sclay1S model show good accordance with laboratoryresults for oedometer incremental loading tests and triaxial tests. However, simulation foroedometer with Constant Rate of Strain (CRS) shows deviation from its laboratory results.A sensitivity analysis of parameters on CRS simulation shows that preoverburden pressurehas the highest influence followed by isotropic parameters and initial stress condition. Sincepre-consolidation pressure is highly strain rate dependant, sample disturbance before CRStesting can be a key reason for the observed deviation. Soil behaviour under embankmentloading is simulated with the same model parameters used for simulation of element tests.The predictions are in good accordance with field measurements for settlement and pore-pressure distribution. The most influential parameters for embankment simulation includes thepermeability, dry crust stiffness and modified creep index. The settlements are exaggeratedwhen creep index values corresponding to in-situ stress condition are used. This value doesnot have a significant impact on the element test simulations due to short duration of testsand smaller domain. Dry crust has been found to be the most sensitive layer followed byinitial soft soil layer (2-4m depth) which is similar to field observations. It is recommended touse a spatial differential stiffness model for dry crust analysis with proper capturing of OCRvariation. Sensitivity analysis for permeability, dry crust layer and effects from geometry andline load analysis on the overall simulation are investigated.
Keywords: Embankment, Soft soil, Creep-Sclay1S, parameter determination
i

ii

Contents
Abstract i
Contents iii
Acknowledgements iv
List of Figures vi
List of Tables ix
List of Notations x
1 Introduction 1
1.1 Background . . . . . . . . . . . . . . . . . . . . . . . . . . . . . . . . . . . . . . . 1
1.2 Aim and Objective . . . . . . . . . . . . . . . . . . . . . . . . . . . . . . . . . . . 2
1.3 Thesis structure . . . . . . . . . . . . . . . . . . . . . . . . . . . . . . . . . . . . . 3
2 Literature review 4
2.1 Constitutive model for simulating soft soil behaviour . . . . . . . . . . . . . . . . 4
3 Geological History 6
4 Test Embankment 9
4.1 General information . . . . . . . . . . . . . . . . . . . . . . . . . . . . . . . . . . 9
4.2 Field Observations . . . . . . . . . . . . . . . . . . . . . . . . . . . . . . . . . . . 9
4.3 Embankment . . . . . . . . . . . . . . . . . . . . . . . . . . . . . . . . . . . . . . 10
4.4 Soil Profile . . . . . . . . . . . . . . . . . . . . . . . . . . . . . . . . . . . . . . . . 11
4.5 Layering . . . . . . . . . . . . . . . . . . . . . . . . . . . . . . . . . . . . . . . . . 12
5 Parameter Determination 13
5.1 Initial stress state parameters . . . . . . . . . . . . . . . . . . . . . . . . . . . . . 13
5.2 Isotropic parameters . . . . . . . . . . . . . . . . . . . . . . . . . . . . . . . . . . 14
5.3 Anisotropic parameters . . . . . . . . . . . . . . . . . . . . . . . . . . . . . . . . . 18
5.4 Destructuration parameters . . . . . . . . . . . . . . . . . . . . . . . . . . . . . . 19
5.5 Viscous parameters . . . . . . . . . . . . . . . . . . . . . . . . . . . . . . . . . . . 20
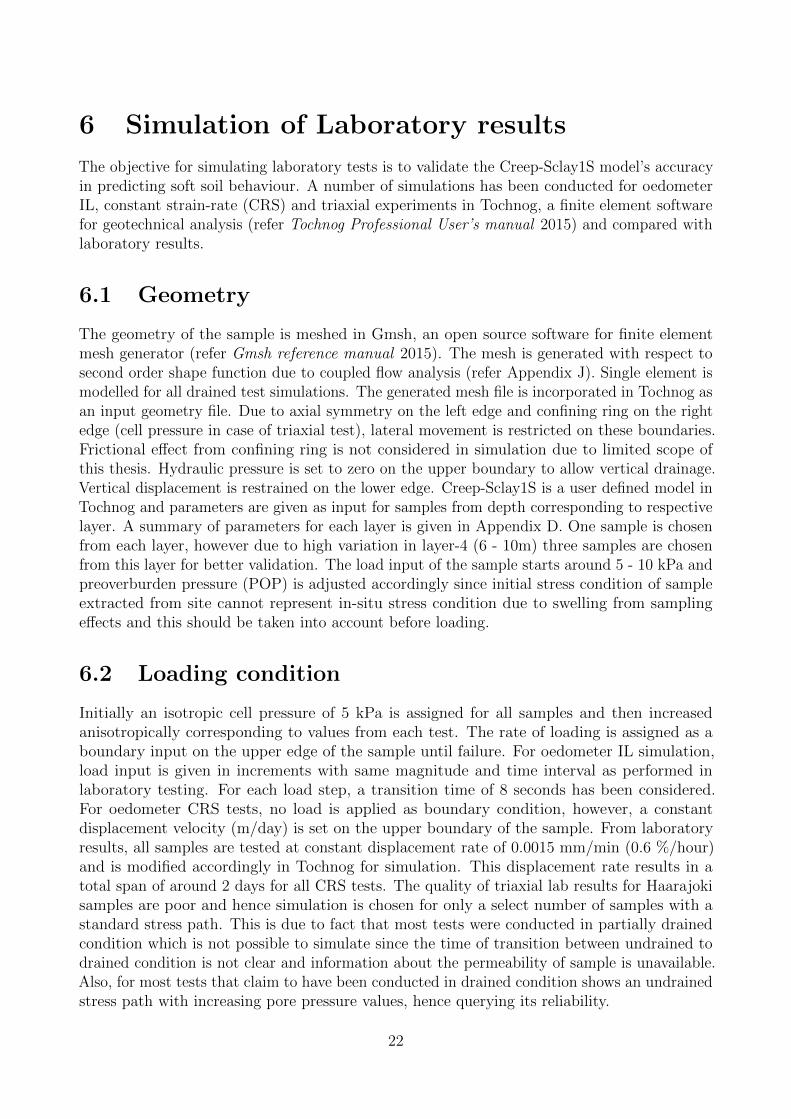
6 Simulation of Laboratory results 22
6.1 Geometry . . . . . . . . . . . . . . . . . . . . . . . . . . . . . . . . . . . . . . . . 22
6.2 Loading condition . . . . . . . . . . . . . . . . . . . . . . . . . . . . . . . . . . . . 22
6.3 Results . . . . . . . . . . . . . . . . . . . . . . . . . . . . . . . . . . . . . . . . . . 23
6.3.1 Oedometer IL test . . . . . . . . . . . . . . . . . . . . . . . . . . . . . . . . . . 23
6.3.2 Oedometer CRS test . . . . . . . . . . . . . . . . . . . . . . . . . . . . . . . . . 25
6.3.3 Triaxial test . . . . . . . . . . . . . . . . . . . . . . . . . . . . . . . . . . . . . . 28
iii

7 Embankment simulation 297.1 Initial condition . . . . . . . . . . . . . . . . . . . . . . . . . . . . . . . . . . . . . 297.2 Results from simulation . . . . . . . . . . . . . . . . . . . . . . . . . . . . . . . . 307.3 Drycrust sensitivity . . . . . . . . . . . . . . . . . . . . . . . . . . . . . . . . . . . 367.4 Permeability sensitivity . . . . . . . . . . . . . . . . . . . . . . . . . . . . . . . . . 377.5 Load type sensitivity . . . . . . . . . . . . . . . . . . . . . . . . . . . . . . . . . . 397.6 Geometry sensitivity . . . . . . . . . . . . . . . . . . . . . . . . . . . . . . . . . . 417.7 Mesh sensitivity . . . . . . . . . . . . . . . . . . . . . . . . . . . . . . . . . . . . . 42
8 Conclusions & Recommendations 448.1 Conclusions . . . . . . . . . . . . . . . . . . . . . . . . . . . . . . . . . . . . . . . 448.2 Recommendations . . . . . . . . . . . . . . . . . . . . . . . . . . . . . . . . . . . 45
References 46
A Instrument installation 48A.1 Layout . . . . . . . . . . . . . . . . . . . . . . . . . . . . . . . . . . . . . . . . . . 48A.2 Installation procedure . . . . . . . . . . . . . . . . . . . . . . . . . . . . . . . . . 48A.3 Instrument position . . . . . . . . . . . . . . . . . . . . . . . . . . . . . . . . . . . 49
B Embankment construction schedule 50
C Layering 51
D Summary of parameters 55
E Initial in-situ stress condition 56
F Other methods of determining pre-consolidation pressure 57
G Determination of modified intrinsic creep index 59
H Experimental procedure 60H.1 Oedometer test . . . . . . . . . . . . . . . . . . . . . . . . . . . . . . . . . . . . . 60H.2 Triaxial test . . . . . . . . . . . . . . . . . . . . . . . . . . . . . . . . . . . . . . . 61
I Parameter sensitivity analysis on CRS simulation 62
J Flow equation 63
K Settlement results from embankment simulation 64
L Pore pressure results from Embankment simulation 66
iv

Acknowledgements
Foremost, I would like to sincerely thank my supervisor, Dr. Jelke Dijkstra, for his guidance,understanding, and most importantly, his patience during my work. His mentorship wasparamount who has always been available and encouraged me to grow as an independentthinker.
I would like to thank Prof. Minna Karstunen, the examiner, for providing me this opportunity.Her experience and immense knowledge in numerical analysis has saved me from many criticalsituations during this thesis. I am extremely grateful as not many graduate students are giventhe opportunity to develop their own individuality and work with such independence.
I would also like to thank Dr. Jean-Philippe Gras from Chalmers University of Technologyand Dr. Nallathamby Sivasithamparam from Norwegian Geotechnical Institute, Norway, forproviding guidance with Creep-Sclay1S model before starting this thesis. Additionally, I wouldlike to thank Dr. Mats Karlsson from Chalmers University of Technology for providing guidanceon some basic concepts and sharing his expertise.
Finally, I would like to thank my friends and family who, with their constant love andsupport, provided the necessary motivation and encouragement to overcome several obstaclesin my life and moulded me into a person that I am today.
iv


List of Figures
1.1 Schematic diagram of Thesis structure . . . . . . . . . . . . . . . . . . . . . . . . 32.1 Illustration of constitutive yield surface used in Creep-Sclay1S model . . . . . . . . 43.1 (a.) Map illustrating the extent of Eemian Sea at 130000-115000 BP (Forsstrom and
Eronen 1985) (b.) Map illustrating the retreat of ice sheet towards northern Baltic in
different time periods after Weichselian glaciation (Nenonen and Portaankorva 2009) 63.2 (a) Map illustrating the extent of Baltic Ice Lake at 12600-10300 BP (Bjork 2008) (b)
Yoldian Sea at 10300-9300 BP (Bjork 2008) . . . . . . . . . . . . . . . . . . . . . 73.3 (a) Map illustrating the extent of Ancylus Lake at 9500–8000 BP (Bjork 2008) (b)
Littorina Sea at 7500-4000 BP (Bjork 2008) . . . . . . . . . . . . . . . . . . . . . 84.1 Illustration of Haarajoki embankment cross-section (Yildiz et al. 2009) . . . . . . . 104.2 Typical characteristics of soil deposit from Haarajoki . . . . . . . . . . . . . . . . 114.3 Illustration of layering of typical samples from Haarajoki deposit based on similar
characteristics . . . . . . . . . . . . . . . . . . . . . . . . . . . . . . . . . . . . 125.1 Illustration of pre-consolidation stress determination for typical Haarajoki samples . 135.2 (a) Distribution of pre-consolidation stress and σ
′v with depth (b) Distribution of
overconsolidation ratio with depth . . . . . . . . . . . . . . . . . . . . . . . . . . 145.3 Illustration of determination of compression and swelling index for a typical Haarajoki
sample from e− log(σ′v) plot . . . . . . . . . . . . . . . . . . . . . . . . . . . . . 15
5.4 Distribution of λ∗, λ∗i and κ∗ along soil depth . . . . . . . . . . . . . . . . . . . . 165.5 Illustration of K and OCR distribution along Oedometer IL stress path for Haarajoki
sample from depth 4.13-4.22m (ID = 1648V) . . . . . . . . . . . . . . . . . . . . 175.6 Determination of parameters from εv − ln(p
′) plot . . . . . . . . . . . . . . . . . . 17
5.7 Illustration of bonding relation between intact and reconstituted clay (Yin, and
Karstunen 2011) . . . . . . . . . . . . . . . . . . . . . . . . . . . . . . . . . . . 195.8 (a) Determination of modified creep index from εv − ln(t) plot (b) from e− log(t) plot 205.9 Illustration of Reference time determination for a typical Haarajoki sample . . . . . 216.1 Comparison of Oedometer IL simulation result with laboratory data for typical
Haarajoki sample at depths 6.13-6.22m and 4.34-4.37m . . . . . . . . . . . . . . . 236.2 (a) Relation between Permeability and Void ratio from Taylor’s formula (b) Difference
between constant and dynamic permeability analysis for typical Haarajoki sample at
depth 15.2-15.23m . . . . . . . . . . . . . . . . . . . . . . . . . . . . . . . . . . 246.3 Mesh sensitivity analysis in oedometer IL simulation for typical Haarajoki sample . 256.4 (a) Comparison with CRS simulation with Laboratory data for a typical Haarajoki
sample from a depth of 15.1m (b) 5.1m . . . . . . . . . . . . . . . . . . . . . . . 256.5 (a) Modification of Strain rate to match Lab data for a typical Haarajoki sample at
depth 15.1m (b) 5.1m . . . . . . . . . . . . . . . . . . . . . . . . . . . . . . . . 266.6 Comparison of different simulations with hydraulic properties modification for typical
Haarajoki sample at depth 5.1m . . . . . . . . . . . . . . . . . . . . . . . . . . . 266.7 (a) Modification of pre-consolidation stress to fit CRS lab data for typical Haarajoki
sample at depth 15.1m (b) Modification of Initial bonding to fit CRS lab data for
typical Haarajoki sample at depth 2.1m . . . . . . . . . . . . . . . . . . . . . . . 276.9 Comparison of triaxial simulation result with laboratory data for typical Haarajoki
sample at depths 8.03-8.15m and 12.87-12.97m . . . . . . . . . . . . . . . . . . . 287.1 Embankment geometry . . . . . . . . . . . . . . . . . . . . . . . . . . . . . . . 29
vi

7.2 In-situ stress equilibrium prior to embankment loading in Tochnog . . . . . . . . . 30
7.3 (a) Comparison of Creep-Sclay1S simulation with field data for settlement along
embankment centre line at Haarajoki (b) Difference between original and modified
values of µ∗i on settlement prediction along embankment centre line at Haarajoki . . 31
7.4 (a) Comparison of Creep-Sclay1S simulation with field data for settlement along 4m
right of embankment centre line (b) along 9m right of embankment centre line at
Haarajoki . . . . . . . . . . . . . . . . . . . . . . . . . . . . . . . . . . . . . . . 31
7.5 Comparison of simulation with field data for pore pressure measurements at different
depths in Haarajoki . . . . . . . . . . . . . . . . . . . . . . . . . . . . . . . . . 32
7.6 Simulation result of groundflow pressure distribution after 1500 days generated in
Gmsh for Haarajoki soil . . . . . . . . . . . . . . . . . . . . . . . . . . . . . . . 33
7.7 Creep-Sclay1S prediction for settlement along embankment centre line at Haarajoki
after 1000 years . . . . . . . . . . . . . . . . . . . . . . . . . . . . . . . . . . . 33
7.8 (a) Comparison of Creep-Sclay1S simulation with field data for lateral displacement
along 4m right of embankment centre line after 1 year (b) after 3 years . . . . . . . 34
7.9 (a) Comparison of Creep-Sclay1S simulation with field data for lateral displacement
along 9m right of embankment centre line after 1 year (b) after 3 years . . . . . . . 34
7.10 (a) Settlements along embankment centre line from simulation for different time
period (b) Pore pressure distribution along embankment centre line from simulation
for different time period . . . . . . . . . . . . . . . . . . . . . . . . . . . . . . . 35
7.11 (a) Ground flow pressure after 1500 days from simulation with high stiff dry crust
layer (b) Comparison of settlement from simulation of high stiff dry crust layer with
field data . . . . . . . . . . . . . . . . . . . . . . . . . . . . . . . . . . . . . . . 36
7.12 (a) Comparison of pore pressure distribution for high stiff dry crust layer analysis
with original simulation after 35 days embankment construction (b) after 1500 days 37
7.13 Comparison between analyses with different values of permeability with field data for
settlement along embankment centre line . . . . . . . . . . . . . . . . . . . . . . 38
7.14 (a)Comparison of simulation with field data for pore pressure dissipation at depth of
4m (b) 15m . . . . . . . . . . . . . . . . . . . . . . . . . . . . . . . . . . . . . . 38
7.15 (a) Comparison between line load and embankment material analysis with field data
for settlement along embankment centre line (b) 9m right of embankment centre line 39
7.16 (a) Comparison of line load with embankment material analysis for lateral deformations
at 4m right of embankment centre line (b) 9m right of embankment centre line . . . 39
7.17 (a) Comparison between line load and embankment material analysis for pore pressure
distribution after 35 days embankment construction (b) after 365 days . . . . . . . 40
7.18 (a) Comparison between line load and embankment material analysis for pore pressure
distribution after 1500 days (b) Simulation from line load analysis for ground flow
pressure after 1500 days in Haarajoki . . . . . . . . . . . . . . . . . . . . . . . . 40
7.19 (a) Comparison of Creep-Sclay1S simulation of different geometries with field data
for settlement along embankment centre line (b) Lateral deformation after 1 year for
different geometries at 4m right of embankment centre line . . . . . . . . . . . . . 41
7.20 (a) Comparison of pore pressure distribution of different geometries after 35 days
embankment construction (b) after 1500 days . . . . . . . . . . . . . . . . . . . . 42
7.21 (a) Comparison of simulation with 900 and 22000 elements with field data for settlement
along embankment CL (b) for lateral displacement at 4m right of embankment CL . 43
vii

7.22 (a) Comparison of simulation with 900 and 22000 elements for pore pressure behaviour
after 35 days embankment construction (b) after 365 days . . . . . . . . . . . . . . 43A.1 Layout of Haarajoki test embankment with instrument positions (Yildiz et al.
2009) . . . . . . . . . . . . . . . . . . . . . . . . . . . . . . . . . . . . . . . . . 48B.1 Illustration of schedule for embankment construction at Haarajoki . . . . . . . 50F.1 Illustration of Casagrande’s method for determination of pre-consolidation stress
(Holtz and Kovacs 1981) . . . . . . . . . . . . . . . . . . . . . . . . . . . . . . 57F.2 Illustration of Schmertmann’s proposal of eventual intersection of virgin com-
pression line between laboratory and in-situ samples at e = 0.42e0 (Knappettand Craig 2014) . . . . . . . . . . . . . . . . . . . . . . . . . . . . . . . . . . . 58
F.3 Principle for evaluation of pre-consolidation stress according to Sallfors (1975) 58G.1 Determination of intrinsic creep value from Grimstad and Degago 2010 . . . . 59H.1 Schematic diagram of an Oedometer apparatus (Knappett and Craig 2014) . . . . . 60H.2 Schematic diagram of a commonly used triaxial apparatus (Knappett and Craig 2014) 61K.1 Settlement with maximum value of 0.149m under embankment centre line after
35 days of embankment construction at Haarajoki . . . . . . . . . . . . . . . . 64K.2 Settlement with maximum value of 0.261m under embankment centre line after
365 days at Haarajoki . . . . . . . . . . . . . . . . . . . . . . . . . . . . . . . 64K.3 Settlement with maximum value of 0.422m under embankment centre line after
1500 days at Haarajoki . . . . . . . . . . . . . . . . . . . . . . . . . . . . . . . 65K.4 Settlement with maximum value of 1.060m under embankment centre line after
1000 years at Haarajoki . . . . . . . . . . . . . . . . . . . . . . . . . . . . . . . 65L.1 Groundflow with maximum excess pore pressure upto 58 kPa around 16m depth
after 35 days of its construction for Haarajoki soil deposit . . . . . . . . . . . . 66L.2 Groundflow with maximum excess pore pressure upto 42 kPa around 12 - 16m
depth after 365 days of embankment loading for Haarajoki soil deposit . . . . 66L.3 Groundflow with maximum excess pore pressure upto 32 kPa around 8 - 15m
depth after 1500 days of embankment loading for Haarajoki soil deposit . . . . 67L.4 Groundflow with no excess pore pressures after 1000 years of embankment
loading for Haarajoki soil deposit . . . . . . . . . . . . . . . . . . . . . . . . . 67
viii

List of Tables
A.1 Location of instruments under Haarajoki embankment for unimproved ground 49D.1 Summary of Creep-Sclay1S parameters derived from laboratory tests for Haara-
joki samples . . . . . . . . . . . . . . . . . . . . . . . . . . . . . . . . . . . . . 55E.1 Initial in-situ stress condition prior to embankment loading in Haarajoki soil profile 56I.1 Sensitivity of Creep-Sclay1S model’s parameters on oedometer CRS simulation
for Haarajoki samples . . . . . . . . . . . . . . . . . . . . . . . . . . . . . . . . 62
ix

List of Notations
Abbreviations
BP Before Present
CRS constant rate of strain
IL Incremental Loading
OCR overconsolidation ratio
PCP pre-consolidation pressure
POP preoverburden pressure
CL centre line
DMT Dilatometer test
OC overconsolidated
PMT Borehole pressuremeter test
Greek Symbols
α scalar rotation of yield function
α0 initial value of α
αd deviatoric rotational vector
χ degree of bonding
χ0 initial bonding
˙εcij creep strain rate
Λ visco-plastic multiplier
εpd plastic deviatoric strain
εv volumetric strain
εpv plastic volumetric strain
εpv plastic volumetric strain
η stress ratio
x

η0 initial stress ratio
ηK0 Mobilization with K0 loading
γ unit weight (kN/m3)
γf unit weight of fluid (kN/m3)
κ slope of the swelling path
κ∗ modified swelling index
λ∗ modified compression index
λi slope of the intrinsic compression path
λ∗i modified intrinsic compression index
µ∗ modified creep index
µ∗i modified intrinsic creep index
∇ Del operator in three dimensional cartesian coordinate system
ω parameter controlling absolute rate of rotation of yield surface
ωd parameter controlling relative effectiveness of plastic strain
φ′cv friction angle at critical state
ψ′
dilatancy angle
ρf density of fluid (t/m3)
ρs density of solid (t/m3)
σ′p0 preconsolidation pressure of intact sample (kPa)
σ′pi0 preconsolidation pressure of reconstituted sample (kPa)
σ′
h effective horizontal stress (kPa)
σ′v effective vertical stress (kPa)
τ reference time (days)
θ value of lode angle
ξ parameter controlling absolute rate of destructuration
ξd parameter controlling relative effectiveness of destructuration rate
xi

Roman Symbols
A cross-sectional area (m2)
c cohesion (kPa)
Cα secondary compression index
Cc compression index
ck constant of proportionality used in Taylor’s relation
Cs swelling index
cv vertical coefficient of consolidation (m2/year)
e void ratio
e0 Initial void ratio
g gravity (m/s2)
Gs specific gravity
H Total head (m)
hv velocity head (m)
k Hydraulic conductivity (m/s)
K0 Coefficient of lateral earth pressure at rest
KNC0 Coefficient of lateral earth pressure at rest in normally consolidated region
M slope of critical state line
m ratio of critical state slope in extension to compression
Mc slope of critical state line in Triaxial compression
Me slope of critical state line in extension
p′
mean effective stress (kPa)
p′eq size of current stress surface in p’-q plane (kPa)
p′eq size of current stress surface in p’-q plane (kPa)
p′mi size of intrinsic yield curve in p’-q plane (kPa)
p′p size of normal consolidation surface in p’-q plane (kPa)
xii

Q volumetric flow of fluid (m3/s)
q mean deviatoric stress (kPa)
qv discharge velocity(m/s)
Rref time resistance value at reference time
rs,min time resistance number for undisturbed sample
rsi time resistance number for reconstituted sample
rs time resistance number
St sensitivity factor
t time (days)
u pore pressure (kPa)
v specific volume
z elevation head (m)
R time resistance
xiii


1 Introduction
1.1 Background
The Industrial revolution in the mid-nineteenth century has led to a sharp rise in social andeconomic development creating new opportunities and progressive scientific advancement in ashort period of time. As a consequence, demand for infrastructure in small scale constructionsuch as roads, railways, dwellings etc. and large scale construction such as harbours, dams andairports has increased tremendously, creating densely populated coastal regions covered withsilt and clayey deposits. This situation has forced construction to move into marshy terrainsand sites with highly compressible soft soils due to eventual scarcity of good quality sites.
Soft soil is a highly anisotropic material due to its depositional history. During deposition,the orientation of clay particles determine the characteristic of the soil along with conditionssuch as pore water properties and changes in loading history. Clay is composed of irregularlyarranged particles bonded together to form an anisotropic fabric. Upon loading, the particlecontacts are gradually destroyed due to plastic strain increment and this process of bonddegradation is known as destructuration (Rouainia and Muir Wood 2000). Additionally, softsoils exhibit viscous behaviour leading to long term deformations.
Due to insufficient data, attempts to fully understand this complex behaviour in engineeringapplications has been difficult and pose a serious challenge for Geotechnical engineers aroundthe globe. Several innovative ideas has been proposed by researchers for modelling soft soil butdue to its extreme variation in nature and complex behaviour coupled with insufficient data hasproven difficult for a complete validation. Hence several methods were resorted to gain insightin soil’s behaviour to observe patterns and formulate models. Among them, constructionof trial embankments on soft soil deposits has been used more commonly around the worlddue to its simple execution. With advancement in instrumentation, measuring devices suchas piezometers, inclinometers etc. have been used to accumulate more detailed informationand gain a better understanding about the real nature of soft soil’s behaviour. Even withthe available data, conventional calculation methods did not prove to be accurate, forcingengineers and researchers to resort to numerical analysis. The advent of Finite element methodpaved the way for advanced computations and take into account the non-linear nature of softsoils. The incorporation of simplified continuum models to analyse complex reality is morecommonly used in soft soil analysis. Recently developed advanced constitutive models such asCreep-Sclay1S provide more accurate predictions than conventional calculations as they takeinto account anisotropy, bond degradation and viscous behaviour of soft soil.
A trial embankment with data comprising of long term field observation is required for acomprehensive validation of Creep-Sclay1S model. In order to choose a benchmark case, thequality of available test data and site investigation for different trial embankments are surveyed.The Test embankment constructed at Haarajoki, Finland in 1997 by the Finnish National RoadAdministration is chosen as the benchmark case for validating Creep-Sclay1S model in thisthesis due to availability of long term data. Several finite element studies have been publishedin recent years for the Haarajoki embankment (Cundy and Neher 2003; Stapelfeldt et al. 2009;
1

Yildiz et al. 2009). The analysis from Naatanen et al. 1998 uses an isotropic elasto-plasticmodel with small strain analysis and does not consider many of the key features in soft soilproperty. Cundy and Neher 2003 uses the multi-laminate constitutive model accounting foranisotropy by directional distribution of state variables responsible for bonding but does notconsider viscous properties in soft soil. Stapelfeldt et al. 2009 uses an elasto visco-plastic model,EVP-SCLAY1S, based on overstress theory (Perzyna 1963 and Perzyna 1966) which accountsfor anisotropy, destructuration and soil viscosity. Although most of the previous studiesaccount for anisotropy and destructuration, not many deal with viscous behaviour of soft soilfor Haarajoki embankment. Also, the parameters used in the analysis has not been discussedin detail in any of the published results, hence querying the reliability of the analysis itself. Inthis thesis, emphasis is given to consistent parameter determination for Creep-Sclay1S modelfrom existing laboratory results. The sensitivity of parameters on experimental simulation andembankment analysis is investigated. Also, other factors such as boundary effects, permeabilityand numerical issues affecting the results are investigated in detail.
1.2 Aim and Objective
The aim of this thesis is to benchmark Creep-Sclay1S model, an advanced constitutive modelfor soft soil analysis, against a well documented field observation. The objectives of this thesisinclude
• Interpretation of data from laboratory experiments and site investigation.
• Determination of parameters for Creep-Sclay1S model in an automated environmentusing a series of newly developed algorithms in MATLAB.
• Simulation of oedometer and triaxial experiments in Tochnog using Creep-Sclay1S modeland comparison with available laboratory results.
• Boundary value level comparison of model vs. site.
2

1.3 Thesis structure
Initial part of the work includes literature review to gain knowledge about the fundamentals ofsoft soil behaviour, constitutive modelling and surveying previous publications. Evaluationof laboratory data includes digitisation of results from oedometer and triaxial experiments,inclinometer and piezometer measurements, soil profile etc. The digitised data is importedinto MATLAB software for manipulation and interpretation. Parameters necessary for Creep-Sclay1S model are determined from imported data in MATLAB using customized and defaultalgorithms. The algorithm is encoded to process large sets of data in a fully automatedenvironment and time efficient manner with focus on accuracy. Using these parameters,oedometer and triaxial tests are simulated with Creep-Sclay1S model in Tochnog, a finiteelement analysis tool and validated with existing laboratory results. After finalisation ofparameters, the embankment with soil profile is simulated with the model in Tochnog. Thefinal settlement from the simulation is compared with field measurements and the prediction isvalidated.
Laboratory Data analysis
Layering of depth in soft
soil deposit
Parameter determination
for each layer
Tri-axial & Oedometer test
simulation using Creep-Sclay1S
model
Comparison with Laboratory
results
Finalisation of parameters
for each layer
Determination of settlement and
pore-pressure
Comparison with field
measurements
Embankment simulation with
Creep-Sclay1S model
Discussion of Results
MATLAB
MATLAB
TOCHNOG
TOC
HN
OG
RE-
EVA
LUA
TIO
N
OP
TIM
ISA
TIO
N
ERR
OR
MO
NITO
RIN
G
CHECK FOR PARAMETER CAUSING DEVIATION
Figure 1.1: Schematic diagram of Thesis structure
3

2 Literature review
2.1 Constitutive model for simulating soft soil behaviour
Soft soils are highly anisotropic material due to depositional history. During deposition, theorientation of clay particles can influence the anisotropic characteristics resulting in timedependant behaviour. Hence advanced constitutive models with incorporation of anisotropy,bonding and rate dependency are required to better represent soft soil behaviour. The recentlydeveloped Creep-Sclay1S model (Sivasithamparam 2012) is based on Anisotropic creep model(Leoni et al. 2008) and SCLAY1S model (Karstunen et al. 2005). The model uses a constitutiveyield surface as shown in Figure 2.1.
Figure 2.1: Illustration of constitutive yield surface used in Creep-Sclay1S model
The yield criterion comprises of an intrinsic surface represented by p′mi, a current stress
state surface an outer rotated ellipse denoting the normal consolidation surface in the p′-q
plane and its evolution with respect to volumetric strains are described according to hardeninglaw from equation 2.1.
∆p′
p =p′p
λ∗i − κ∗∆εpv (2.1)
where p′p is the size of the normal consolidation surface. λ∗i and κ∗ denotes the modified
compression index and modified swelling index respectively. The size of the current stresssurface is represented by p
′eq which can be derived from equation 2.2.
p′
eq =p′2 + (q − αp′)2
(M2 − α2) p′(2.2)
The model uses the concept of visco-plastic multiplier presented by Grimstad et al. 2008 forcapturing creep behaviour in soft soil. The viscoplastic multiplier is given by equation 2.3.
4

Λ =µ∗iτ.
(peq
(1 + χ).p′mi
)λ∗i−κ∗
µ∗i
.M2
c − α20
M2c − η20
(2.3)
where Mc denotes the critical state slope in Triaxial compression, µ∗i is the intrinsic creepindex which can be derived from standard laboratory test, α0 refers to the initial inclination ofthe yield surface and η0 refers to the initial stress ratio. With incorporation of the visco-plasticmultiplier, the analysis can go above the Critical state line (into dry side) similar to the MCCmodel. However, this in most cases can result in higher values of undrained shear strength forOC soils. Due to assumption of an associated flow rule, the creep strain rate and plastic strainincrement are represented by the viscoplastic multiplier from equation 2.4.
˙εcij = Λ∂p′eq
∂σ′ij
∆εcij = ∆t Λ∂p′eq
∂σ′ij
(2.4)
The model uses three hardening laws which are similar to the S-CLAY1S model exceptthat the plastic strains were replaced with creep strains. The first hardening law describes theevolution of the size of intrinsic yield surface p
′mi from equation 2.5.
dp′
mi =vp′mi
λi − κdεpv (2.5)
If the destructuration parameter χ is neglected, the first hardening law reduces to ModifiedCam Clay analysis (equation 2.1). The second hardening law describes the change in orientationof the yield surface which can also be called as the rotational hardening law proposed byWheeler et al. 2003 is given in equation 2.6.
dαd = ω
([3η
4− αd
]〈dεpv〉 + ωd
[η3− αd
]dεpd
)(2.6)
where η is the stress ratio, ω and ωd are model constants. ω controls the absolute rate ofrotation of the yield surface whereas ωd controls the relative effectiveness of plastic strains.Thethird hardening law describes the degradation of inter-particle bonding with plastic straining.Here a bonding parameter χ is introduced which gets reduced to a target value of zero withincrease in plastic strains. The evolution of the bonding parameter χ is given in equation 2.7.
dχ = ξ ([0− χ] |dεpv|+ ξd [0− χ] dεpd) = −ξχ (|dεpv|+ ξddεpd) (2.7)
From equation 2.7, the bonding parameter χ depends on two additional soil properties ξ andξd. ξ controls the absolute rate of destructuration whereas ξd controls the relative effectivenessof plastic strains during bond degradation. The critical state (M) in Creep-Sclay1S model isincorporated as a function of Lode angle. This gives a smooth yield surface comparable to theDrucker-Pragar failure criterion. The formulation of lode angle dependency in Creep-Sclay1Smodel is given by equation 2.8.
M(θ) = Mc
(2m4
1 +m4 + (1−m4)sin3θα
) 14
(2.8)
where m is the ratio of critical state slope in extension to the critical state in compression.
5

3 Geological History
In order to understand the variation in soil property, it becomes necessary to survey thegeological history of the region to avoid misinterpretation. The geography for southern Finlandslightly differs from other Scandinavian regions, bordering several water bodies such as BalticSea, Gulf of Finland and Gulf of Bothnia. Hence, periods of glaciation and melting haspredominantly influenced the region’s geological characteristics. The late Pleistocene epochlasting from 130,000 to 12,000 BP (Before Present) experienced several glacial events withconstant variation in temperature and climate patterns (Clayton et al. 1991). During the initialstages of this period, Scandinavia region was completely surrounded by the Eemain Sea withsouthern Finland completely inundated by this saline inflow (Forsstrom and Eronen 1985). Thelocation of the Eemian Sea is approximately close to the present day Baltic Sea. This is knownas the Eemain stage (Marine Isotope Stage 5e) that existed roughly around 130,000 to 115,000BP (NEEM 2013) during the interglacial period when temperatures were 4–10◦C warmer thanpresent. From Figure 3.1 (a), it is evident that southern Finland including Haarajoki wascompletely inundated by saline water during this period.
Figure 3.1: (a.) Map illustrating the extent of Eemian Sea at 130000-115000 BP (Forsstrom and
Eronen 1985) (b.) Map illustrating the retreat of ice sheet towards northern Baltic in different time
periods after Weichselian glaciation (Nenonen and Portaankorva 2009)
The Weichselian glaciation started with the prelude of gradual cooling and intermittentinterstadial periods where ice sheets overwhelmed the whole Scandinavian region. The icesheets reached its maximum around 20,000 BP reaching 3 kilometers thick after which glaciersstarted to melt and reached southern Finland around 13,100 BP. The quaternary deposits foundin this region were deposited by the late Weichselian glaciation (Nenonen and Portaankorva2009). The retreat of the Weichselian glaciers marked the formation of Baltic Ice Lake infront of the receding ice sheet. As the ice sheet retreated north, glacio-lacustrine sedimentssuch as clay and silt were deposited in the Baltic. The growing fresh water Baltic Ice Lakefrom melt-waters was isolated from the saline Atlantic ocean by the Danish straits land bridgealong with ice barriers extending across Mount Billingen in south-central Sweden blocking thesaline water entry from the western North sea and northern Arctic sea towards Finland (Wefer
6

et al. 2002). Due to isostatic rebound of land, the elevation of Oresund strait was uplifted anddammed the ice lake to increasingly higher levels from 7m below current sea level to +28m.The sediments contained low organic carbon and varved feature of clay became thinner andblended into homogenous clay in distal areas (Wefer et al. 2002).
Figure 3.2: (a) Map illustrating the extent of Baltic Ice Lake at 12600-10300 BP (Bjork 2008) (b)
Yoldian Sea at 10300-9300 BP (Bjork 2008)
With further melting and retreat of ice sheet from south-central Sweden, the water level inthe dammed Baltic Ice Lake started to reduce, giving away 25m of water around 10,300 BPand established a connection to marine water. This event is marked by a color change in claysand change in sediment density. During this period, the elevation of sills in Danish straits were20m above current sea level and saline water inflow predominantly occurred from south-centralSweden (Figure 3.2 (b)). This period marked the transition from fresh water Baltic Ice Laketo saline Yoldian Sea stage (Wefer et al. 2002).
The Yoldian Sea stage (10,300 – 9300 BP) is the period between the final drainage of BalticIce Lake until a new barrier impeded the saline water inflow into Baltic Sea. The varved featureof clay sediments in the Gotland Basin remained for atleast for another 300 years followed byan increase in iron-sulphide minerals giving rise to high magnetic susceptibility. There is asharp increase in organic carbon content during this interval.
The continuous uplift of south-central Sweden restricted the flow of marine waters and withan elevated basin level marked the end of the Yoldian Sea stage and gave rise to the fresh waterAncylus Lake with maximum water elevation of 7m below the current sea level. The AncylusLake stage existed between 9300 BP and 8700 BP and created fjords with inundation in largeareas. The organic content during this stage was low due to retreating saline conditions. Thefurther north, the more glacially influenced the sediment deposits existed. Since land upliftsubsided during this period, the relative sea level increased significantly and flooded the marinecoasts of western Baltic around 9000 BP. This marked the beginning of a gradual end for theAncylus Lake stage after the flooding of the Oresund strait by the marine ocean from west.
7

Figure 3.3: (a) Map illustrating the extent of Ancylus Lake at 9500–8000 BP (Bjork 2008) (b)
Littorina Sea at 7500-4000 BP (Bjork 2008)
The transition from fresh water Ancylus Lake stage to brackish Littorina Stage (initialstages of this period is referred as the Mastogloia Sea Stage) was gradual. The gradualincrease in water level had inundated many of the coastal regions including Haarajoki in theBaltic around 7000 BP (Wefer et al. 2002). During this transition, the bottom waters becamedense and increasingly salty due to gradual intrusion of marine water. The nutrients fromthe saline bottom rose to the surface and supported biological productivity. At the end ofthe transgression, the transition from the Atlantic to the Sub-boreal Chrono zone created adrastic climate change with a period of cooling lasting for 500 years. Due to cooler conditions,there is abrupt drop in salinity with decrease in organic carbon and biological production,decreasing tendency for anoxia production and increasing abundance of species indicative ofcold conditions which lasted from 5000 to 3700 BP.
The transition from Littorina to post-Littorina environment around 3700 BP (Wefer et al.2002) is a period with fluctuating rainfall conditions. The sediments are much lighter in colorindicating lack of salinity due to continuous leaching from rainfall. Climate fluctuations from2000 BP have been less than 2◦C. Land continued to rise and regions around Gulf of Bothniaand Gulf of Finland rose out of sea. Sediments in the Gotland basin are homogeneous dueto well oxygenated environment from cooler conditions during 400 – 300 BP. The spread ofagriculture around the Baltic Sea region caused changes in vegetation, pollen patterns, increasein land erosion and sedimentation rates of Lakes. This could have affected the over-consolidationratio for soft soil deposits at top layer which is attributed predominantly by human activity.
8

4 Test Embankment
4.1 General information
The test embankment at Haarajoki, situated in the vicinity of Jarvenpaa, Finland is constructedbetween July and August, 1997 by the Finnish National Road Administration (Vepsalainenet al. 1997) to organize a competition with tasks involving evaluation of settlements, horizontaldisplacements and pore pressure. The 2.9m high embankment is constructed as a noise barrierand is founded on soft soil deposits. The deposits in this area are characterized by a highdegree of anisotropy and natural inter-particle bonding (Yildiz et al. 2009) which influences itsstress-strain behaviour. Half of the embankment is constructed on virgin soil with no groundimprovement whereas the other half on ground improved area with prefabricated vertical drainsinstalled in a regular pattern with 1m intervals in a square grid. The prefabricated drainsare 100mm wide and 3-4mm thick (Vepsalainen et al. 1997). Experiments such as oedometertests (both Incremental Loading (IL) and Constant Rate of Strain (CRS)) and triaxial testshas been conducted by Road Administration Consulting Laboratory along with Laboratoryof Soil mechanics and Foundation Engineering at Helsinki University of Technology, Finland.Since clay is highly anisotropic, there is large variation with respect to depth which is alsoevident from laboratory results from oedometer IL tests. Hence depths exhibiting similarstress-strain behaviour and initial conditions are grouped in a single layer and this process oflayering samples with respect to depth would be discussed later in this Chapter. The lab resultscombined with field monitoring data from FinnRA is used for the validation of Creep-Sclay1Sand the extent of accuracy depends on the quality of data provided. Several results has alreadybeen published regarding Haarajoki test embankment analyses with different constitutivemodels as mentioned in Chapter 2, however no comparison shall be made with previous analysissince the main objective of this thesis limits to accurate derivation of parameters and validationof model therewith.
4.2 Field Observations
It has been observed that even on ground improved areas, primary consolidation continuessignificantly after three years of embankment construction (Vepsalainen et al. 1997). The straineffects is found to be minor below a depth of 10 meters. The effects of three year consolidationperiod is clearly observed on layers closer to the embankment. The increase of undrained shearstrength and pre-consolidation pressure are small for subsoil that was slightly overconsolidatedbefore embankment construction. Hence it is clear from field observations that the most criticalregion should exist around 2 – 4m for soft soil layer combined with dry crust behaviour. The2m thick dry crust layer can distort the prediction accuracy since even advanced models areunable to capture the stress strain behaviour for dry crust soils due to difficulty in its parameterderivation.
9

4.3 Embankment
An illustration of the Haarajoki embankment cross-section is shown in Figure 4.1. Theembankment is 2.9 m high and 100 m long. The crest of the embankment is 8 m wide withslopes constructed at a gradient of 1:2. The phreatic level is at the ground surface. Theembankment material varies from sandy gravel to gravel with a moisture content of 2.5 %and maximum dry density of 2.20 g/cm3. Size distribution includes 18 % of 32 to 64 mmfraction and 20 % for more than 64 mm. The density of the embankment material is 21kN/m3.Class-3 geotextile has been spread on the levelled ground over the entire embankment. Theembankment is underlain by heavily overconsolidated crusted clay layer. The dry crust layer is2 m thick and is followed by 20.2 m thick soft clay deposit as shown in Figure 4.1. Depositsthat are more permeable than clay such as silt and till can be found beneath the soft clay layer.
Figure 4.1: Illustration of Haarajoki embankment cross-section (Yildiz et al. 2009)
The embankment is constructed on an average of 0.5m high on every two days. The schedulefor embankment construction is illustrated in Appendix B. The material is transported in sucha way that the compaction effect is uniform over the entire area. Compaction is done to 90%relative density using a 6 tonne roller with regular intervals of moistening. Stones over 300mmare removed from the embankment.
10

4.4 Soil Profile
The water content for soft clay varies between 70 – 120 % with maximum water content inthe shallow layer of soft soil and decreases with depth. The water content for soft soil isequal to or, in most cases, greater than their liquid limit. Soft soil around 3m depth exhibitthe highest plasticity index and tends to decrease with depth. The dry crust layer, however,exhibits a much lower range of water content ranging between 35 – 55 %. The loss of watercan be due to dessication from high temperature variation. This leads to crack propagationand high permeability properties in the first initial layers. From dessication, there is swellingin soil leading to reduction in void ratio and subsequent increase in its unit weight as shown inFigure 4.2. The unit weight for dry crust layer varies between 16.86 – 17.68 kN/m3 whereasfor soft soil, the unit weight varies between 13.72 - 16.21 kN/m3 increasing with depth. Theorganic content varies between 1.2 % - 2.2 %. The sensitivity of the soil varies between 20 – 65depending on the depth.
20 40 60 80 100 120 1400
2
4
6
8
10
12
14
16
18
20
Water content (%)
Dep
th
(m
)
0 0.5 1 1.5 2 2.5 30
2
4
6
8
10
12
14
16
18
20
Organic content (%)
Dep
th
(m
)
10 20 30 40 50 600
2
4
6
8
10
12
14
16
18
20
Undrained shear strength (kPa)
Dep
th
(m
)
0 1 2 3 40
2
4
6
8
10
12
14
16
18
20
e0(void ratio)
De
pth
(m
)
12 13 14 15 16 17 18 190
2
4
6
8
10
12
14
16
18
20
Unit weight (KN/m3)
Dep
th
(m
)
0 10 20 30 40 50 600
2
4
6
8
10
12
14
16
18
20
Sensitivity
De
pth
(m
)
Figure 4.2: Typical characteristics of soil deposit from Haarajoki
11

4.5 Layering
From soil profile, there is evidence of high variation between samples from different depth andnecessary measures should be taken to avoid error in the validation procedure. Hence it isnecessary to divide the soil profile into layers of similar characteristics in order to perform areliable validation. In order to test the efficiency of the model, it is necessary to investigate thesoil with comparatively low number of layers. However, the number of layers should not be tooless since high variation may affect the accuracy of the final result. This procedure is importantfor validating Creep-Sclay1S model and a comprehensive analysis should be undertaken.
In CRS tests for Haarajoki samples, two different strain rates (0.0015 mm/min and 0.0025mm/min) are used which can be helpful to validate different parameters. However test resultsfor samples with 0.0025mm/min beyond 10m are either missing or not done. Also, a constantstrain rate cannot be representative of site condition since embankment is constructed in stages(refer Appendix B). In triaxial test data, the critical slope for compression (Mc) can be a keyaspect to consider in layering of samples.
Data for oedometer tests with incremental loading for 30 samples from different depths areavailable with details of initial condition and stress-strain behaviour. This data is importedinto MATLAB script and saved in separate arrays. These data are then processed to plotlog(σ
′v)− e curve for all samples. Samples with similar in-situ void ratio (e0) and stress-strain
behaviour are compiled as a single layer. Other aspects such as unit weight and undrainedshear strength are also considered and corrected accordingly. The initial layer comprising ofdry crusted clay is treated as a separate layer with thickness 0 - 2m. Typical compiled layers 3and 6 of soft soil deposit are shown in Figure 4.3. A complete summary of layers is reported inAppendix C.
100
101
102
103
1
1.5
2
2.5
3
3.5
4
Log(σ’v) − kPa
Vo
id r
ati
o, e
Depth = 4.13−4.22 mOedometer ID =1648V
Depth = 4.34−4.37 mOedometer ID =1601
Depth = 5.2−5.23 mOedometer ID =1609
Haarajoki − Layer33.5 − 6m
100
101
102
103
104
0.5
1
1.5
2
2.5
Log(σ’v) − kPa
Vo
id r
ati
o, e
Depth = 15.2−15.23 mOedometer ID =1613
Depth = 17.2−17.23 mOedometer ID =1628
Haarajoki − Layer615 − 20m
Figure 4.3: Illustration of layering of typical samples from Haarajoki deposit based on similar
characteristics
12

5 Parameter Determination
5.1 Initial stress state parameters
Pre-consolidation pressure represents the maximum effective stress which a soil has undergonefrom its origin of deposit. It defines the yielding point of a soil when the stress path transits fromelastic to elastic plastic region. Hence, an accurate determination of pre-consolidation stress isof major importance as its high influence on experimental simulation would be mentioned later.Several methods have been proposed to determine an accurate value for pre-consolidationpressure (refer Appendix F). Oedometer tests with Constant Rate of Strain (CRS) for Haarajokisamples does not hold sufficient information for most of the depths as mentioned in section4.5. Hence one dimensional Oedometer Incremental Loading (IL) tests are taken due to theirbetter consistency of data for all depth.
Data from oedometer IL tests are digitized and stored in separate arrays in MATLAB. Thechange in void ratio are plotted against σ
′v in log scale for all samples. A linear tangent is
plotted on the swelling region (Figure 5.1). The points on the normally consolidated regionare interpolated with cubic spline to obtain a smooth curve and extrapolated to intersect onthe linear tangent from overconsolidated region. This intersection point is presumed as thepre-consolidation stress (PCP). The advantage of using this method is the convenience forthe user to automate this process for large data sets in a simple and time efficient manner.The values derived from this method have a margin of error that is well within the rangedescribed by Casagrande (Appendix F). The sensitivity of this error margin and its influenceon simulation results shall be investigated.
1 10 100 10000
0.5
1
1.5
2
2.5
3
3.5
4
4.5
5
Log(σv’) − kPa
Vo
id R
ati
o, e
Depth = 4.13−4.22 mOedometer ID = 1648VPCP =40.6409 KPae
0 = 3.024
Haarajoki
1 10 100 1000 100000
0.5
1
1.5
2
2.5
3
3.5
4
Log(σv’) − kPa
Vo
id R
ati
o,
e
Depth = 13.22−13.25 mOedometer ID = 1605 PCP =87.7977 KPae
0 = 2.537
Haarajoki
Figure 5.1: Illustration of pre-consolidation stress determination for typical Haarajoki samples
The PCP is determined for all samples and compared with the effective stress in eachlayer (Figure 5.2 (a)). It is clearly evident that there is sample disturbance in all layers withlarge variation in the fourth layer (6 - 10m). Hence this shows that the quality of laboratory
13

experiments undertaken for Haarajoki samples are poor and requires several approximations forcurve fitting. The distribution of pre-consolidation stress with depth merges with the effectivestress path around 15m which is similar to presented previous papers (Yildiz et al. 2009).
0 20 40 60 80 100 120
0
2
4
6
8
10
12
14
16
Stress in kPa
De
pth
(m
)
PCP
insitu σv’
Layers
Haarajoki
0 1 2 3 4 5
0
2
4
6
8
10
12
14
16
18
20
Stress in kPa
De
pth
(m
)
insitu OCR
Layers
Haarajoki
Figure 5.2: (a) Distribution of pre-consolidation stress and σ′v with depth (b) Distribution of
overconsolidation ratio with depth
The overconsolidation ratio (OCR) is defined as the ratio of pre-consolidation stress to currenteffective vertical stress of the soil (Muir Wood 2010). It can be formed due to several factorssuch as erosion of top layer in a certain period of soil’s history. When the current stress stateof a soil is below pre-consolidation pressure, lower settlement values are predicted due to highelastic moduli in overconsolidated region. OCR and POP (preoverburden pressure) providesinformation about the intensity of swelling in soil which is significant for excavation problems.Heavily overconsolidated clays exhibit plastic softening whereas normally consolidated andslightly overconsolidated clays exhibit plastic hardening (Muir Wood 1991). However this ishard to interpret from the Haarajoki samples due to poor quality of triaxial test results.
The initial void ratio (e0) defines the ratio of volume of voids to volume of solid particles inthe sample. The information about the distribution of initial void ratio with depth is shown inFigure 4.2. Other parameters such as solid density (ρs in t/m3), specific gravity (Gs) and Unitweight (γ in kN/m3) are taken from laboratory data.
5.2 Isotropic parameters
Data from one dimensional incremental loading tests with unload-reload cycles have been usedto determine the isotropic parameters. In e− log(σ′v) plot, the slope for normal consolidationline is measured as the compression index (Cc) and the slope of the unload-reload hysteresisloop is measured as the swelling index (Cs) as shown in equation 5.1.
Derivation of parameters from e − log(σ′v) plot is straight forward, similar to procedure
14

mentioned in section 5.1. Isotropic parameters can also be derived directly from εv − ln(p′)
plot where the slope of normal consolidation line is defined as the modified compression index(λ∗) and the slope of the unloading path gives the modified swelling index (κ∗). For calculationof mean effective stress, information about coefficient of lateral earth pressure at rest (K0)is necessary and OCR for each stress point must be calculated for all samples. Hence theaccuracy of pre-consolidation stress is significant as mentioned earlier in section 5.1. In thisthesis, both cases of λ∗ and κ∗ emerging from e− log(σ
′v) plot and εv − ln(p
′) are calculated for
comparison. In Creep S-Clay1S model, intrinsic value for compression index and creep indexare used. The slope of λ∗i represents the stress path of a reconstituted sample in which allparticle bonds are destroyed. The relation between the parameters derived from e− log(σ
′v)
and εv − ln(p′) are given by equations 5.2 and 5.3 (Sivasithamparam 2012).
Cc =∆ e
∆ log(σ′v)Cs =
∆ e
∆ log(σ′v)(5.1)
λ∗ =λ
1 + e0κ∗ =
κ
1 + e0(5.2)
λ∗ =Cc
2.3(1 + e0)κ∗ ≈ 2Cs
2.3(1 + e0)(5.3)
1 10 100 1000 100001
1.5
2
2.5
3
3.5
4
Log(σv
’)−kPa
Vo
id r
ati
o, e
Interpolated curve
Oedometer ID = 1648VDepth =4.13−4.22me
0 =3.024
Cc =2.218� λ* = 0.23965
Cci =0.89556� λi
* = 0.096763
Haarajoki
Cc
Cci
1 10 100 10001
1.5
2
2.5
3
3.5
4
Log(σv’)− kPa
Vo
id r
ati
o, e
Depth = 4.13 − 4.22 mOedometer ID = 1648Ve
0 = 3.024
Cs = 0.12297
κ* = 0.026573
Haarajoki
Cs
Figure 5.3: Illustration of determination of compression and swelling index for a typical Haarajoki
sample from e− log(σ′v) plot
For the determination of modified swelling index, the slope of the first unload stress pathis considered as shown in Figure 5.3 (b). During observation of several e − log(σ
′v) plots of
different samples from Haarajoki, it is found that the unloading path is not always constant andhas a high variation. This can be an issue during analysis since this variable highly influencesthe elastic region in the model and yet there are no clear definition as to how to determinethis parameter. It can well be due to bad quality of data, however many authors have claimedthe same and refuse to give a definite statement for κ (Muir Wood 1991). Figure 5.4 showsthe distribution of calculated values of λ∗, λ∗i and κ∗ in the e− log(σ
′v) plot. It clearly shows
15

that there is large variation in λ∗ than in λ∗i . Hence it is evident that using intrinsic valueswould give more accurate predictions than normal values. However, the parameter κ∗ sharesthe same amount of variation as λ∗ which shows that the unloading path for one dimensionaloedometer tests are highly varying for each sample.
0 0.2 0.4 0.60
2
4
6
8
10
12
14
16
18
20
Dep
th (
m)
λ*
0 0.2 0.4 0.60
2
4
6
8
10
12
14
16
18
20
λ*
i
0 0.02 0.04 0.060
2
4
6
8
10
12
14
16
18
20
κ*
Figure 5.4: Distribution of λ∗, λ∗i and κ∗ along soil depth
In order to plot εv − ln(p′) curve, information about horizontal effective stress acting on
the sample at all stress points is required to construct the mean effective stress of the sample.K0 is defined as the ratio between horizontal and vertical effective stress of a soil. It can beaccurately measured from a borehole pressuremeter test (PMT) or a Dilatometer test (DMT)(Knappett and Craig 2014), however due to high cost factors these tests are not commonlyused and alternate empirical relations are resorted. Jaky 1948 proposed a relation which iscommonly used for deriving the K0 value and is given in equation 5.4 (a). However, thisformula does not mention the history but only the structure of the soil. Since the value of K0
is not constant in the overconsolidated region, equation 5.4 (a) cannot be taken for calculationof the mean effective stress. The relation formulated by Kulhawy and Mayne 1990 for thedetermination of K0 takes into account the history of the soil given by equation 5.4 (b).
KNC0 = (1− sin φ′) K0 = (1− sin φ′).OCR sinφ′ (5.4)
Using the formula from equation 5.4 (b), it is observed that heavy OC clays exhibited higherK0 values with sometimes values more than 1.00. However, the accuracy of the mean effectivestress is bound to be affected due to the use of this empirical formula and taking into accountthe sample disturbance effects. Hence, values from e− log(σ
′v) plots, although with sampling
effects, should provide a comparatively reliable result. The values from both plots, e− log(σ′v)
and εv − ln(p′), were analysed and found that the variation in λ∗ and λ∗i values range between
0.11− 0.13% and 0.11− 0.87% respectively which is very negligible. The reason can be due to
16

a constant value of OCR and K0 in the normally consolidated region (as shown in Figure 5.5)leading to a constant ratio between σ
′
h and σ′v. However, a high difference in the value of κ∗
between the two plots have been observed ranging 22− 26% lower in the εv − ln(p′) plot. The
proportion of change in p′
and σ′v are not constant during one-dimensional unloading of thesample due to a constant change of OCR in the swelling region.
1 10 100 10001.4
1.6
1.8
2
2.2
2.4
2.6
2.8
3
3.2
1.231 0.9290.701
0.594
0.594
0.594
0.594
0.594
1.629
log(σ’v) − kPa
Vo
id r
ati
o,
e
K
1 10 100 10001.4
1.6
1.8
2
2.2
2.4
2.6
2.8
3
3.2
6.021 3.0101.505
1.000
1.000
1.000
1.000
1.000
12.000
log(σ’v) − kPa
Vo
id r
ati
o, e
OCR
Figure 5.5: Illustration of K and OCR distribution along Oedometer IL stress path for Haarajoki
sample from depth 4.13-4.22m (ID = 1648V)
10 20 50 150 400
−0.2
−0.1
0
0.1
0.2
0.3
0.4
0.5
ln(p’) − kPa
Vo
lum
etr
ic s
tra
in (
εv)
Depth =4.13−4.22 m
NC Line
λi* = 0.096654
λ* = 0.23938
OC line
κ* = 0.018129
Haarajoki
λ*
λi
*
κ*
Figure 5.6: Determination of parameters from εv − ln(p′) plot
Poisson’s ratio is an elastic parameter and usually ranges between 0.1 - 0.3 for soft soils. Due
17

to poor quality of triaxial test results for Haarajoki samples, values from previous papers (Yildizet al. 2009) are taken for initial calculations and then optimised in experimental simulations.
The critical state line (M) is the most important parameter due to its influence on six otherparameters. A sample is said to have reached its critical state when stress ratio η becomesconstant with indefinite plastic shearing under constant volume. When the critical state isreached, a unique line of failure is formed in the q − p′ − v plane where q is the deviatoricstress, p
′is the mean effective stress and v is the specific volume. In triaxial test, when cell
pressure acts as a minor principal stress, then the test corresponds to triaxial compressionand gives the critical state line in compression, Mc. On the contrary, when cell pressureacts as a major principal stress, then the test corresponds to triaxial extension and gives thecritical state line in extension, Me. Soft soils are highly anisotropic and the behaviour of asoil sample would depend mostly on the orientation of its particles with respect to appliedstress, the amount of bonding and particle interaction. Citing this reason, the value of criticalstate in compression is highly unlikely to be equal to its extension counterpart and there areexperimental evidences to support this statement (Gens 1982). Since no triaxial extension testswere performed for Haarajoki samples, Me is calculated from equation 5.5 where φ
′cv is derived
from triaxial compression test. The relation between Mc, Me and φ′cv is given by equations 5.5
(Muir Wood 1991).
Mc =6 sin φ
′cv
3 + sin φ′cvMe =
6 sin φ′cv
3− sin φ′cv(5.5)
5.3 Anisotropic parameters
In order to achieve better accuracy in predicting soil behaviour, Creep-Sclay1S takes intoaccount the anisotropic characteristics that exists in soft soil due to its depositional history.The anisotropy proposed in the model describes the initial inclination of yield surface (α0) andkinematic hardening refers to the change in inclination during plastic straining. Assumingan associated flow rule and a 0.66 ratio difference between volumetric and deviatoric plasticstrains, Wheeler et al. 2003 proposed a method for determining the initial inclination of theyield surface (α0) for normally consolidated soils which is given by the equation 5.6 (a).
α0 =η2K0
+ 3ηK0 −M2c
3ηK0 =
3(1−KNC0 )
(1 + 2KNC0 )
(5.6)
where ηK0 is the normally consolidated stress ratio and Mc is the slope of critical state linein compression. By definition, stress ratio is defined as the ratio between deviatoric stress (q)and the mean effective stress (p
′). Hence in order to determine the value of η0, it is required to
estimate the horizontal effective stress which is assumed from the empirical relation given byJaky 1948 for KNC
0 (equation 5.4).The parameter ωd, also known as shear rotation parameter, defines the relative effectiveness
of plastic volumetric and shear strains in rotational hardening (Wheeler et al. 2003). Theparameter ω can be determined from curve fitting from isotropic compression test or Triaxialextension test where significant change in anisotropy is observed (Yin et al. 2011). It controlsthe absolute rate at which the surface of normal consolidation rotates with viscous straining.Leoni et al. 2008 assumes that anisotropy is erased when α0/α reaches 10, which allegedlyoccurs at 2 or 3 times the pre-consolidation stress. The value of ω can, therefore, be estimated
18

from equation 5.7. This relation is, however, based on several assumptions and does not yielda reliable value. For this thesis, a simple relation (Yin et al. 2011) has been used for ω rangingbetween 10/λi to 20/λi.
ω =1
λ∗ln
(10M2
c − 2α0ωdM2
c − 2α0ωd
)ωd =
3
8.(4M2
c − 4η2K0 − 3ηK0)
(η2K0 −M2c + 2ηK0)
(5.7)
5.4 Destructuration parameters
The Creep-Sclay1S model incorporates the effects of bonding and destructuration which isrepresented by three paramaters. The amount of bonding between particles is represented by ascalar quantity, χ. Based on sensitivity of the soil, the initial bonding, χ0, can be determinedfrom the empirical relation, χ0 = ST − 1. This is due to introduction of a sensitivity factorto relate intact samples containing some particle bonding to reconstituted samples where allbondings are destroyed. Hence the relation of stress between intact and reconstituted sampleis given by σ′p0 = ST .σ′pi0, where σ′p0 is the apparent pre-consolidation stress of the intactsample as shown in the Figure 5.7 and σ′pi0 is the pre-consolidation stress corresponding toreconstituted sample which are related by a sensitivity factor describing the amount of bondingthat exists in the intact sample (Figure 5.7). The amount of bonding decreases to a value ofzero with increasing plastic strains and the stress path for the intact clay would eventuallymerge with its reconstituted counterpart.
Figure 5.7: Illustration of bonding relation between intact and reconstituted clay (Yin, and
Karstunen 2011)
The parameters ξv and ξd controls the rate of bond degradation due to volumetric anddeviatoric strains respectively. To estimate ξv, the sample is isotropically compressed to erasethe initial anisotropy in the sample such that there would only be volumetric strains. Leoniet al. 2008 suggests that experimental evidence show by isotropically loading the sample atvalues two or three times larger than the pre-consolidation pressure, it is possible to erase
19

the initial anisotropy of the sample. Hence, very low values of η must be simulated in theTriaxial test such that the shear strains would be small and effects from shear parameterswould be negligible. In order to determine ξd, ξv is used along with high η (q/p′) simulationin tri-axial test to obtain bond degradation from shear effects. This procedure is based onseveral presumptions and is not definite, since pre-consolidation stress varies for different strainrates. However not many alternate procedures are available for the determination of theseparameters. In the laboratory data for Haarajoki samples, there are no experiments dedicatedfor destructuration parameters and only information regarding sensitivity of the soil at differentdepths are available. Citing this reason, default values are taken (Yin, and Karstunen 2011)such as 9.0 for ξv (from typical range of 8.0 - 12.0) and 0.20 for ξd (from typical range of 0.20 -0.30).
5.5 Viscous parameters
The modified creep index µ∗ can be derived from two methods. It can be directly measured inεv − ln(t) plot and through parameter Cα (as mentioned in equation 5.9) from e− log(t) plot.However both plots would give the same value for µ∗ since void ratio difference and volumetricstrain are related. The scale of time does not have an effect on the value of creep index due torepresentation in logarithmic scale. The Creep-Sclay1S model uses intrinsic values for modifiedcreep index (µ∗i ).
µ∗ =∆ εv
∆ ln t(5.8)
Cα =∆ e
∆ log tµ∗ =
Cα2.3(1 + e0)
(5.9)
0.001 0.01 0.1 1 10 100
0
0.02
0.04
0.06
0.08
0.1
0.12
0.14
0.16
0.18
Ln(Time)−hours
Vo
lum
etr
ic s
tra
in −
εv
Depth = 4.13−4.22 mLoad Step = 54−108 kPae
0 =3.024
µ* = 0.0096233 [∆εv/∆Ln(t)]
Haarajoki−Creep
µ*
µ*
µ*
µ*
µ*
µ*
µ*
µ*
µ*
µ*
µ*
µ*
µ*
0.001 0.01 0.1 1 10 100 10002.2
2.3
2.4
2.5
2.6
2.7
2.8
2.9
3
3.1
Time (hours)−Logscale
Vo
id r
ati
o, e
Depth = 4.13−4.22 mLoad Step = 54−108 kPae
0 =3.024
Cα =0.089165 [ ∆e/∆log(t) ]
µ* = 0.0096341 [Cα/2.3(1+e
0)]
Haarajoki−Creep
Cα
Cα
Cα
Cα
Cα
Cα
Cα
Figure 5.8: (a) Determination of modified creep index from εv − ln(t) plot (b) from e− log(t) plot
In Laboratory tests for Haarajoki samples, there are only a maximum of two creep tests foreach sample which is insufficient for estimation of the intrinsic creep index. The determinationof intrinsic creep value according to Grimstad and Degago 2010 using time resistance number is
20

mentioned in Appendix G. Hence, load steps that represent the in-situ conditions are chosen asthe value for µ∗i and optimised during simulation. Reference time (τ) is linked to the definitionof pre-consolidation stress (Brinkgreve et al. 2008). The value is usually taken as one daysince Oedometer test is performed with 24 hours time step. However, lab results for Haarajokisamples show time steps longer than 7 days. Hence time step before and after attainment ofpre-consolidation stress is compared and an average value is chosen for the analysis.
−1 3 7 11 15 19 23
101
102
103
0.01
0.02
0.73
1.73
2.73
9.73
16.73
17.73
18.73
19.15
19.19
19.23
19.28
19.32
20.32
20.57
Time (days)
Eff
ec
tiv
e v
ert
ica
l s
tre
ss
− L
og
(k
Pa
)
Depth = 15.2−15.23m (ID:1613)
PCP = 81 kPa
PCP reached at = 1.7333 daysStep before PCP = 1 dayStep after PCP = 1 dayReference Time =1 day
Haarajoki − Layer 6
Figure 5.9: Illustration of Reference time determination for a typical Haarajoki sample
21
6 Simulation of Laboratory results
The objective for simulating laboratory tests is to validate the Creep-Sclay1S model’s accuracyin predicting soft soil behaviour. A number of simulations has been conducted for oedometerIL, constant strain-rate (CRS) and triaxial experiments in Tochnog, a finite element softwarefor geotechnical analysis (refer Tochnog Professional User’s manual 2015) and compared withlaboratory results.
6.1 Geometry
The geometry of the sample is meshed in Gmsh, an open source software for finite elementmesh generator (refer Gmsh reference manual 2015). The mesh is generated with respect tosecond order shape function due to coupled flow analysis (refer Appendix J). Single element ismodelled for all drained test simulations. The generated mesh file is incorporated in Tochnog asan input geometry file. Due to axial symmetry on the left edge and confining ring on the rightedge (cell pressure in case of triaxial test), lateral movement is restricted on these boundaries.Frictional effect from confining ring is not considered in simulation due to limited scope ofthis thesis. Hydraulic pressure is set to zero on the upper boundary to allow vertical drainage.Vertical displacement is restrained on the lower edge. Creep-Sclay1S is a user defined model inTochnog and parameters are given as input for samples from depth corresponding to respectivelayer. A summary of parameters for each layer is given in Appendix D. One sample is chosenfrom each layer, however due to high variation in layer-4 (6 - 10m) three samples are chosenfrom this layer for better validation. The load input of the sample starts around 5 - 10 kPa andpreoverburden pressure (POP) is adjusted accordingly since initial stress condition of sampleextracted from site cannot represent in-situ stress condition due to swelling from samplingeffects and this should be taken into account before loading.
6.2 Loading condition
Initially an isotropic cell pressure of 5 kPa is assigned for all samples and then increasedanisotropically corresponding to values from each test. The rate of loading is assigned as aboundary input on the upper edge of the sample until failure. For oedometer IL simulation,load input is given in increments with same magnitude and time interval as performed inlaboratory testing. For each load step, a transition time of 8 seconds has been considered.For oedometer CRS tests, no load is applied as boundary condition, however, a constantdisplacement velocity (m/day) is set on the upper boundary of the sample. From laboratoryresults, all samples are tested at constant displacement rate of 0.0015 mm/min (0.6 %/hour)and is modified accordingly in Tochnog for simulation. This displacement rate results in atotal span of around 2 days for all CRS tests. The quality of triaxial lab results for Haarajokisamples are poor and hence simulation is chosen for only a select number of samples with astandard stress path. This is due to fact that most tests were conducted in partially drainedcondition which is not possible to simulate since the time of transition between undrained todrained condition is not clear and information about the permeability of sample is unavailable.Also, for most tests that claim to have been conducted in drained condition shows an undrainedstress path with increasing pore pressure values, hence querying its reliability.
22

6.3 Results
6.3.1 Oedometer IL test
The results from the Oedometer IL test simulation has a very good agreement with theLaboratory data as shown in Figure 6.1. This is reasonable since highly influential parameterssuch as λ∗i , κ
∗ and pre-consolidation stress are derived from samples of IL experiments. Forsome samples when started from initial values (6.75 kPa), there were excess creep deformationin the elastic region showing a high µ∗i value and would be optimised during embankmentanalysis. However, when simulation is done from second load step (13.5 kPa), yields a properelastic stress path cohering well with lab data. From the results of the IL simulations, it is safeto state that the model’s prediction is close to the lab data and requires no optimisation forparameters at this stage.
101
102
103
−0.2
−0.1
0
0.1
0.2
0.3
0.4
0.5
0.6
Effective vertical stress − Logscale (kPa)
Ax
ial
str
ain
(−
)
Creep−Sclay1S
Lab data (ID: 1649V)
HaarajokiLayer 4 (6.13 − 6.22m)
101
102
103
−0.2
−0.1
0
0.1
0.2
0.3
0.4
0.5
0.6
0.7
Effective vertical stress − Logscale (kPa)
Ax
ial
str
ain
(−
)
Creep−Sclay1S
Labdata(ID:1601)
HaarajokiLayer3 (4.34−4.37m)
0 2 4 6 8 10 12 140
0.05
0.1
0.15
0.2
0.25
0.3
0.35
0.4
Axia
l str
ain
(−
)
Time (days)
Creep−Sclay1S
Lab data (ID: 1649V)
HaarajokiLayer 4 (6.13 − 6.22m)
0 5 10 15 20 25 300
0.05
0.1
0.15
0.2
0.25
0.3
0.35
0.4
0.45
Axia
l str
ain
(−
)
Time (days)
Creep−Sclay1S
Labdata(ID:1601)
HaarajokiLayer3 (4.34−4.37m)
Figure 6.1: Comparison of Oedometer IL simulation result with laboratory data for typical
Haarajoki sample at depths 6.13-6.22m and 4.34-4.37m
23

Permeability change with respect to void ratio has been modelled using dependency functionin Tochnog. The relation between permeability and void ratio is calculated from Taylor’sformula (Taylor 1948) which is given by, log(K/K0) = ∆e/ck, where ck = 0.5e0 as shown inFigure 6.2(a). Simulations with both conditions, constant and dynamic permeability, resultedin no significant difference (Figure 6.2(b)). This can be due to slow increment of load thatallows faster drainage in the sample. Hence, sample should be loaded quickly so that rate ofdissipation due to permeability can be validated. Changes affecting the drained stress path arelargely influenced by parameter input of which preoverburden pressure is the most significantfollowed by isotropic parameters and initial stress input.
0.8 1 1.2 1.4 1.6 1.8 20
0.1
0.2
0.3
0.4
0.5
0.6
0.7
0.8
0.9
1x 10
−6
Void ratio
Perm
eab
ilit
y (
m2)
0 200 400 600 800 1000 1200
0
0.05
0.1
0.15
0.2
0.25
0.3
0.35
0.4
Effective vertical stress − (kPa)
Ax
ial
str
ain
(−
)
Creep−Sclay1S
Lab data (ID: 1613)
Haarajoki (15.2−15.23m)
Permeability analysis
constantpermeability
dynamic permeability
Figure 6.2: (a) Relation between Permeability and Void ratio from Taylor’s formula (b) Difference
between constant and dynamic permeability analysis for typical Haarajoki sample at depth 15.2-15.23m
Mesh sensitivity analysis ranging from 1 element to 750 elements have been analysed andresulted in no significant change as shown in Figure 6.3. However significant change can beexpected if high amount of pore-pressure build-up is created in the sample. Hence validationof permeability and mesh sensitivity in oedometer IL, CRS and triaxial tests can only be donewhen there is faster loading rate.
24

0 200 400 600 800 1000 1200
0
0.05
0.1
0.15
0.2
0.25
0.3
0.35
0.4
Effective vertical stress − kPa
Axia
l s
tra
in (
−)
Creep−Sclay1S
Lab data ( ID:1613 )
Haarajoki (15.2−15.23m)Mesh Sensitivity
1 element
750 elements
Figure 6.3: Mesh sensitivity analysis in oedometer IL simulation for typical Haarajoki sample
6.3.2 Oedometer CRS test
The results for constant strain rate simulations, did not match with laboratory CRS data. Themargin of difference is large as shown in Figure 6.4. Therefore, samples from different depthswere chosen and still gave similar error. It can be due to several reasons such as bad quality oflab data, irregular monitoring of strain rate or sampling disturbance effects.
0 100 200 300 400 500 600
0
0.05
0.1
0.15
0.2
0.25
0.3
0.35
Effective vertical stress − (kPa)
Axia
l str
ain
(−
)
Lab data (ID: kilpa14.da2)
Creep−Sclay1S
Haarajoki (CRS − 15.1m)
Strain rate = 0.6 (%/hour)
0 50 100 150 200 250 300 350 400 450
0
0.05
0.1
0.15
0.2
0.25
0.3
0.35
Effective vertical stress − (kPa)
Axia
l str
ain
(−
)
Lab data (ID: kilpa4.da2)
Creep−Sclay1S
Haarajoki (CRS − 5.1m)
Strain rate = 0.6 (%/hour)
Figure 6.4: (a) Comparison with CRS simulation with Laboratory data for a typical Haarajoki
sample from a depth of 15.1m (b) 5.1m
With concern for maintaining a constant strain rate (which originally is a constant displace-ment rate) throughout the test in reality can be difficult, and modification is done to fit labdata. For sample taken at a depth of 15.1m, a strain modification, with the same parameters,spanning 200 days (0.006 %/hour) is required to actually match the lab data while originallyit is done at a strain rate spanning 2 days (0.6 %/hour). So the margin of difference in thiscase seems to be around 100 times (Figure 6.5) which is unrealistic.
25

0 100 200 300 400 500 600
0
0.05
0.1
0.15
0.2
0.25
0.3
0.35
Effective vertical stress − (kPa)
Axia
l str
ain
(−
)
Lab data (ID: kilpa14.da2)
Creep−Sclay1S
Haarajoki (CRS − 15.1m)
Strain rate = 0.6 (%/hour)
Strain rate = 0.06 (%/hour)
Strain rate = 0.006 (%/hour)
0 50 100 150 200 250 300 350 400 450
0
0.05
0.1
0.15
0.2
0.25
0.3
0.35
Effective vertical stress − (kPa)A
xia
l str
ain
(−
)
Lab data (ID: kilpa4.da2)
Creep−Sclay1S
Haarajoki (CRS − 5.1m)
Strain rate = 6.0 (%/hour)
Strain rate = 0.6 (%/hour)
Strain rate = 0.06 (%/hour)
Figure 6.5: (a) Modification of Strain rate to match Lab data for a typical Haarajoki sample at
depth 15.1m (b) 5.1m
Although initially hydraulic properties were taken as constant value similar to oedometer ILsimulations, dynamic permeability properties combined with water stiffness input were alsosimulated but yielded similar or almost no difference in the final result (Figure 6.6). This is dueto the rate of strain (0.0015mm/min for sample height of 15mm corresponding to 0.6 %/hour)which is slower than standard CRS tests conducted in Sweden (0.0024 mm/min with sampleheight of 20mm corresponding to 0.7 %/hour (Olsson 2010)) allowing complete drainage withno excess pore pressures. Hence, CRS tests for Haarajoki samples can be regarded as a fullydrained test.
0 50 100 150 200 250 300 350 400 450
0
0.05
0.1
0.15
0.2
0.25
0.3
0.35
Effective vertical stress − kPa
Ax
ial
str
ain
(−
)
Simulation with infinite water stiffness
Simulation with calculated water stiffness
Lab data (ID: kilpa4.da2)
Haarajoki (CRS − 5.1m)
Figure 6.6: Comparison of different simulations with hydraulic properties modification for typical
Haarajoki sample at depth 5.1m
26

Due to a large margin of difference between lab data and simulation, significant modificationsin parameters such as pre-consolidation stress, intrinsic compression index and swelling indexare required for optimisation. Since pre-consolidation stress is strain rate dependant, it isreasonable that sample disturbance can affect this value and subsequently the overall stresspath. Also other factors such as monitoring error, instrument fault etc. are difficult to measureand can affect the stress path dearly. Figure 6.7 shows the large modification required forpre-consolidation stress and sensitivity values to fit CRS lab data.
0 100 200 300 400 500 600
0
0.05
0.1
0.15
0.2
0.25
0.3
0.35
Effective vertical stress − kPa
Axia
l str
ain
(−
)
Lab data (ID: kilpa14.da2)
Creep−Sclay1S
Haarajoki (CRS − 15.1m)
PCP = 82 kPa (original)
PCP = 72 kPa
PCP = 62 kPa
PCP = 52 kPa
0 50 100 150 200 250 300 350 400
0
0.05
0.1
0.15
0.2
0.25
0.3
0.35
Effective vertical stress − (kPa)
Axia
l str
ain
(−
)
Lab data (ID: kilpa1.da2)
Creep−Sclay1S
Haarajoki (CRS − 2.1m)
Original(χ
0 = 14.58)
Modified(χ
0 = 2.25)
Figure 6.7: (a) Modification of pre-consolidation stress to fit CRS lab data for typical Haarajoki
sample at depth 15.1m (b) Modification of Initial bonding to fit CRS lab data for typical Haarajoki
sample at depth 2.1m
A separate sensitivity analysis for parameters is done and the range of effect each parameterinfluences on CRS stress path are recorded. It is observed that the pre-consolidation stress hasthe highest influence followed by isotropic parameters (summarized in Appendix D).
27

6.3.3 Triaxial test
Simulation is conducted for samples from depth 8.03-8.15m and 12.87-12.97m as the quality oftriaxial lab results for these depths show better quality. Other samples were ignored due topoor quality as mentioned in section 6.2.
0 0.05 0.1 0.15 0.2 0.25
20
30
40
50
60
70
80
Axial strain (−)
De
via
tori
c s
tre
ss
, q
(k
Pa
)
Creep−Sclay1S
Lab data − CADC1955
Haarajoki−Triaxial simulation8.03−8.15m
5 10 15 20 25 30 35 40 45 500
10
20
30
40
50
60
Mean effective stress, p’ (kPa)
Devia
tori
c s
tress, q
(kP
a)
Creep−Sclay1S
Lab data − CADC1955
Haarajoki−Triaxial simulation
8.03−8.15m
0 0.05 0.1 0.15 0.2
10
20
30
40
50
60
70
80
90
100
110
120
Axial strain (−)
De
via
tori
c s
tre
ss
, q
(k
Pa
)
Creep−Sclay1S
Lab data − CADC A70
Haarajoki−Triaxial simulation12.87−12.97m
0 10 20 30 40 50 60 70 800
10
20
30
40
50
60
70
80
Mean effective stress, p’ (kPa)
Devia
tori
c s
tress, q
(kP
a)
Creep−Sclay1S
Lab data − CADC A70
Haarajoki−Triaxial simulation12.87−12.97m
Figure 6.9: Comparison of triaxial simulation result with laboratory data for typical Haarajoki
sample at depths 8.03-8.15m and 12.87-12.97m
The results from triaxial test simulation (Figure 6.9) show a good match with experimentalresult. Both simulations show a slight deviation in the elastic region. This can be due toconsideration of purely drained condition in simulation whereas during laboratory testing aconstant pore pressure around 6 - 10 kPa would exist giving additional elastic stiffness to thesample. It can be observed that after pore pressure dissipation, the effective stress path fromthe experimental data gradually merge with the simulation curve as shown above.
28

7 Embankment simulation
7.1 Initial condition
The geometry of the Haarajoki embankment is meshed in Gmsh, as shown in Figure 7.1.The right half of the geometry is modelled due to symmetrical boundary conditions and tosave computation time. A length of 50m from embankment centre line has been consideredto prevent boundary effects on material velocity and groundwater flow. Meshing is doneusing elements with second order shape functions due to incorporation of flow analysis (referAppendix J).The mesh is locally refined in the embankment and the dry crust layer. Theminimum and maximum element size is 0.25m and 1.00m respectively. The total number ofelements is 5358 with 11033 nodes.
Y
XZ
Figure 7.1: Embankment geometry
The embankment is constructed in stages (Appendix B) which is simulated in Tochnog. TheMohr-coulomb model is used for modelling embankment behaviour. The material propertiesfor the embankment include 2.2 t/m3 dry density, 60000 kPa elastic modulus and poisson’sratio of 0.30. Also a cohesion of 2 kPa and 5 kPa dilatancy has been included (Vepsalainenet al. 1997). Since the material of embankment ranges between sandy gravel to gravel, thepermeability is presumed to be high. All layers of soft soils ranging from 2 to 18m are modelledby using Creep-Sclay1S model with the same parameters discussed in Chapter 6 (summarizedin Appendix D). Till now the parameters are not optimised and original values derived fromlab data are used. Since falling head permeability tests have not been conducted for Haarajokisamples, the value of vertical coefficient of consolidation (cv) is taken from the CRS data tocalculate hydraulic conductivity and an average value of permeability is assumed from empiricaldata comparison. The first 2m in the Haarajoki soil comprises of heavily overconsolidateddessicated clay. In general, Mohr-coulomb model is used for dry crust analysis, however, adefinite methodology to study its behaviour is yet to be formulated. The maximum load fromthe embankment is measured to be 60 kPa along the centre line. From oedometer IL data forHaarajoki dry crust samples, it is observed that a load of 60 kPa corresponds to linear elasticregion. Although, sampling of this clay involve large variation, It is known that the rate ofdessication is large on the surface and decreases gradually to a certain depth, here assumed till1m, suggesting a high elastic behaviour on the top surface. Hence the dessicated clay layer has
29

been divided into three linear elastic layers with large elastic stiffness on the top layer.Due to symmetrical boundary, lateral movement is restrained on the left boundary (centre
line of embankment) and also on the right side. Both lateral and vertical movement arerestrained on the bottom boundary. The unit weight of water is taken as 9.81 kN/m3. Hencea pressure head of 176.58 kPa is set at the bottom boundary. The phreatic level is set on theground level. A total of 7 post processing points have been chosen. Pore-pressures at depth of4, 7, 10 and 15m below embankment are recorded along with settlements on centre line, 4m and9m right of embankment. Prior to embankment loading, the in-situ stress equilibrium needsto be checked. Figure 7.2 shows the in-situ stress condition in Tochnog before embankmentloading which corresponds to calculated values of initial condition. The stress distributionwith depth is summarized in Appendix E.
0 20 40 60 80 100 120 140 160 180
−10
−5
0
5
10
15
Stress (kPa)
Dep
th (
m)
Pore pressure
Hydraulic Head
Effective vertical stress path
Effective horizontal stress path
Haarajoki − Stress equilibrium
Figure 7.2: In-situ stress equilibrium prior to embankment loading in Tochnog
7.2 Results from simulation
Figure 7.3 (a) shows the comparison between Creep-Sclay1S simulation and field data forsettlement along embankment centre line (CL) with respect to time. The simulation shows agood fit with field measurement, however, the modified creep index has been changed. Initiallythe simulation is run for 365 days to check the parameter’s sensitivity on deformation andpore pressure values. The parameters µ∗i , permeability and dry crust stiffness, dominate theoverall simulation. Due to large value of modified creep index, the initial deformation duringembankment construction is exaggerated as shown in Figure 7.3 (b). Since creep tests aredone for only two load steps from each sample, the value of creep index taken from load stepscorresponding to in-situ stress conditions have now proven to be much higher than intrinsicvalues. The intrinsic creep index cannot be derived from the available laboratory results andrequires an assumption from empirical data. It is observed that by reducing the modified creepindex to around 10 fold, a satisfactory result is achieved.
30

0 200 400 600 800 1000 1200 1400 1600
−0.1
0
0.1
0.2
0.3
0.4
0.5
0.6
0.7
Time (days)
Sett
lem
en
t (m
)
Creep−Sclay1S
Field data at Centre line
Haarajoki (1500 days)
0 200 400 600 800 1000 1200 1400 1600
0
0.1
0.2
0.3
0.4
0.5
0.6
0.7
Time (days)S
ett
lem
en
t (m
)
Creep−Sclay1S
Field data at embankment CL
Haarajoki
µ*
i−derived
µ*
i−modified
Figure 7.3: (a) Comparison of Creep-Sclay1S simulation with field data for settlement along
embankment centre line at Haarajoki (b) Difference between original and modified values of µ∗i on
settlement prediction along embankment centre line at Haarajoki
Figure 7.4 shows the settlement prediction from Creep-Sclay1S model at 4m and 9m rightof embankment CL. The slight deviation observed is attributed to the stiffness of top dry crustlayer. The rate of load distribution, with respect to area, from embankment to dry crust layerand deformation therewith relies heavily on the stiffness of this layer. Due to difficulty intesting dry crust samples, information from laboratory results can be insufficient and requiresexamination of several other data. A detailed examination of dry crust property is beyond thescope of this thesis and values close to empirical data are assumed for now.
0 200 400 600 800 1000 1200 1400 1600
0
0.1
0.2
0.3
0.4
0.5
0.6
0.7
Time (days)
Sett
lem
en
t (m
)
Creep−Sclay1S
Field data − 4m away from CL
Haarajoki
0 200 400 600 800 1000 1200 1400 1600
0
0.1
0.2
0.3
0.4
0.5
0.6
0.7
Time (days)
Sett
lem
en
t (m
)
Creep−Sclay1S
Field data − 9m away from CL
Haarajoki
Figure 7.4: (a) Comparison of Creep-Sclay1S simulation with field data for settlement along 4m
right of embankment centre line (b) along 9m right of embankment centre line at Haarajoki
31

Figure 7.5 shows the comparison of simulation with field data for pore pressure variationwith respect to time. The field data shows faster dissipation than simulated values. Thiscan be due to assumption of constant value of low permeability in simulation throughout theconsolidation period, whereas in reality, permeability starts from a higher value and decreasescorrespondingly with consolidation rate. Nevertheless, the result from simulation shows a closerprediction of pore pressure values beyond 7m depth and slightly excess values near surface. Asper simulation, after 1500 days, an excess pore pressure of 32 kPa exists around 10–15m.
0 100 200 300 400 500 600 7000
50
100
150
Time (days)
Po
re p
res
su
re (
kP
a)
Creep−Sclay1SField data at 4m
0 100 200 300 400 500 600 7000
50
100
150
Time (days)
Po
re p
res
su
re (
kP
a)
Creep−Sclay1SField data at 7m
0 100 200 300 400 500 600 70050
100
150
200
Time (days)
Po
re p
res
su
re (
kP
a)
Creep−Sclay1SField data at 10m
0 100 200 300 400 500 600 700100
150
200
250
Time (days)
Po
re p
res
su
re (
kP
a)
Creep−Sclay1SField data at 15m
Figure 7.5: Comparison of simulation with field data for pore pressure measurements at different
depths in Haarajoki
Figure 7.6 shows the distribution of pore pressures in soil after 1500 days. Maximumpressure is located around 10 - 15m under embankment centre line. This is reasonable sincelower permeability values are assigned with increasing depth creating a proportional gradientin dissipation rate.
32

-208 -192 -177
node_groundflow_pressure Y
Z X
Figure 7.6: Simulation result of groundflow pressure distribution after 1500 days generated in
Gmsh for Haarajoki soil
In order to perform an efficient validation for Creep-Sclay1S model, the embankment issimulated for a long period to investigate creep behaviour in soft soil. Figure 7.7 shows theCreep-Sclay1S simulation for settlement along embankment centre line after 1000 years. Thissimulation is done to investigate the creep rate in different time period to understand theeffect of visco-plastic multiplier in Creep-Sclay1S model. From Figure 7.7, a creep rate of 38mm/year is observed in the initial 14 years after embankment construction which graduallyreduces to 1.85 mm/year between 41 and 100 years. Finally, the creep rate reaches to 0.075mm/year between 100 and 1000 years showing that maximum deformation, of 1m, has reachedat 100 years with negligible creep afterwards.
0.01 0.1 1 10 100 1000 10000
0
0.2
0.4
0.6
0.8
1
1.2
Time (years) − Logscale
Sett
lem
en
t (m
)
Creep−Sclay1S
Field data at embankment CL
Haarajoki
Figure 7.7: Creep-Sclay1S prediction for settlement along embankment centre line at Haarajoki
after 1000 years
33

Figures 7.8 and 7.9 show the lateral deformation predicted from the simulation at 4m and9m right of embankment CL after 1 and 3 years. Field measurements show less deformation insoft soil layer than simulation. The deformation of dry crust layer at 4m right of embankmentCL after 1 and 3 years show good accordance with field values. Predictions are exaggerated at9m right of embankment CL which is attributed mainly due to stiffness properties of dry crustand soft soil.
−20 0 20 40 60 80 100
−5
0
5
10
15
Horizontal displacement (mm)
De
pth
(m
)
Field data
Creep−Sclay1S
Haarajoki − 4m right of CLLateral deformation after 1 year
−20 0 20 40 60 80 100
−5
0
5
10
15
Horizontal displacement (mm)
De
pth
(m
)
Field data
Creep−Sclay1S
Haarajoki − 4m right of CLLateral deformation after 3 years
Figure 7.8: (a) Comparison of Creep-Sclay1S simulation with field data for lateral displacement
along 4m right of embankment centre line after 1 year (b) after 3 years
−20 0 20 40 60 80 100
−5
0
5
10
15
Horizontal displacement (mm)
De
pth
(m
)
Field data
Creep−Sclay1S
Haarajoki − 9m right of CLLateral deformation after 1 year
−20 0 20 40 60 80 100
−5
0
5
10
15
Horizontal displacement (mm)
De
pth
(m
)
Field data
Creep−Sclay1S
Haarajoki − 9m right of CLLateral deformation after 3 years
Figure 7.9: (a) Comparison of Creep-Sclay1S simulation with field data for lateral displacement
along 9m right of embankment centre line after 1 year (b) after 3 years
In order to find the most critical region, the settlement and pore pressure with time isinvestigated for all depths. Figure 7.10 (a) shows the settlement along centre line of embankmentat different period. It is clearly evident that dry crust layer is the most critical region followed
34

by initial soft soil layers from 2 - 5m. Figure 7.10 (b) shows the pore pressure variation withtime. A peak in pore pressure value is observed after 35 days of embankment constructionfollowed by a slow dissipation rate. Difference can be observed between the new equilibriumstate attained after complete dissipation of pore pressures and the equilibrium state beforeembankment loading. Maximum pore pressures exist around 10 - 15m. Excess pore pressuresare completely dissipated after 75 years.
0 0.2 0.4 0.6 0.8 1 1.2 1.4
−10
−5
0
5
10
15
settlement (m)
Dep
th (
m)
35 days 365 days 1500 days 1000 years
Haarajoki (Creep−Sclay1S simulation)
0 50 100 150 200 250
−10
−5
0
5
10
15
Pore pressure (kPa)
De
pth
(m
)
Initial 35 days 1500 days 1000 years
Haarajoki (Creep−Sclay1S simulation)
Figure 7.10: (a) Settlements along embankment centre line from simulation for different time
period (b) Pore pressure distribution along embankment centre line from simulation for different time
period
35

7.3 Drycrust sensitivity
The sensitivity of dry crust stiffness and its impact on the overall analysis is investigated.The dry crust layer (2m thick) is modelled with an extremely high stiffness and its effecton the analysis is investigated. Due to high stiffness, most of the load from embankmentis uniformly distributed onto soft soil. As a consequence, the pore pressures are uniformlydissipated throughout the soil layer leaving excess pressure in the mid region (10 - 15m) asshown in Figure 7.11 (a). Due to this condition, settlement along centre line, 4m and 9m rightof embankment exhibit same value as shown in Figure 7.11 (b).
-195 -186 -177
node_groundflow_pressure Y
Z X
0 200 400 600 800 1000 1200 1400 1600
−0.2
−0.1
0
0.1
0.2
0.3
0.4
0.5
Time (days)
Sett
lem
en
t (m
)
Field data − centre line (CL)
Field data−4m right from CL
Field data−9m right from CL
Creep−Sclay1S
Haarajoki
Figure 7.11: (a) Ground flow pressure after 1500 days from simulation with high stiff dry crust
layer (b) Comparison of settlement from simulation of high stiff dry crust layer with field data
From Figure 7.12, A large difference in pore pressure development can be observed betweenanalysis done in single dry crust layer with high stiffness and analysis done with three layereddry crust with varying stiffness. The margin of difference is around 50 % and highlights theamount of sensitivity the dry crust exerts on the overall simulation results.
36

0 50 100 150 200 250
−4
−2
0
2
4
6
8
10
12
14
16
18
Stress (kPa)
Dep
th (
m)
Pore pressure after 35 days
(original simulation − 3 layers)
Pore pressure after 35 days
(single layer dry crust− high stiffness)
Initial pore pressureequilibrium
0 50 100 150 200 250
−4
−2
0
2
4
6
8
10
12
14
16
18
Stress (kPa)
Dep
th (
m)
Pore pressure after 1500 days
(original simulation − 3 layers)
Pore pressure after 1500 days
(single layer dry crust− high stiffness)
Initial pore pressureequilibrium
Figure 7.12: (a) Comparison of pore pressure distribution for high stiff dry crust layer analysis
with original simulation after 35 days embankment construction (b) after 1500 days
It is evident from above results that the dry crust layer has a significant impact on theoverall analysis of embankment loading. Hence, it should be analysed with a spatial differentialstiffness model and be able to capture on-site OCR variation.
7.4 Permeability sensitivity
The effect of permeability on the embankment simulation is investigated. Analysis with differentpermeability values are simulated with the same parameters and boundary conditions as theoriginal simulation. Figure 7.13 show the comparison of analyses between different permeability
37

values and field data for settlement under embankment centre line. It is evident that thedifference is large ranging 28-35 % for the case of 5 times the original permeability value.
0 500 1000 1500
0
0.1
0.2
0.3
0.4
0.5
0.6
0.7
Time (days)
Sett
lem
en
t (m
)
Field data at CL
Creep−Sclay1S
Haarajoki
k = 5 fold increased
k = original value
k = 5 fold decreased
Figure 7.13: Comparison between analyses with different values of permeability with field data for
settlement along embankment centre line
Figure 7.14 show the dissipation of pore pressures with time at 4m and 15m respectively. Afaster dissipation rate can be observed for increased permeability values, however, the differenceis larger at 15m depth due to proximity of drainage boundary compared to a depth of 4m.
0 100 200 300 400 500 600 70030
40
50
60
70
80
90
100
Time (days)
Po
re p
ressu
re (
kP
a)
Field data at 4m
Creep−Sclay1S
Haarajoki
k = 5 fold increased
k = original value
k = 5 fold decreased
0 100 200 300 400 500 600 700140
150
160
170
180
190
200
210
Time (days)
Po
re p
ressu
re (
kP
a)
Field data at 15m
Creep−Sclay1S
Haarajoki
k = 5 fold increased
k = original valuek = 5 fold decreased
Figure 7.14: (a)Comparison of simulation with field data for pore pressure dissipation at depth of
4m (b) 15m
38

7.5 Load type sensitivity
An alternative analysis by using a line load instead of an embankment material is investigatedusing same parameters to analyse difference between a compliant and stiff element on thesurface. The magnitude of line load is increased in stages similar to Haarajoki embankmentconstruction. Figure 7.15 shows the comparison of settlement prediction between analysis withline load and embankment material. The settlement predicted is higher with line load analysisalong embankment centre line whereas it is contrary at 9m away from centre line. It is evidentthat load is more concentrated near the centre line when analysed with line load compared toembankment material leading to excess deformation in that area.
0 200 400 600 800 1000 1200 1400 1600
0
0.1
0.2
0.3
0.4
0.5
0.6
0.7
Time (days)
Sett
lem
en
t (m
)
Creep−Sclay1S
Field data at embankment CL
Haarajoki
Line load analysis
Embankment materialanalysis
0 200 400 600 800 1000 1200 1400 1600
0
0.05
0.1
0.15
0.2
0.25
0.3
0.35
Time (days)
Sett
lem
en
t (m
)
Creep−Sclay1S
Field data − 9m away from CL
Haarajoki
Line load analysis
Embankment materialanalysis
Figure 7.15: (a) Comparison between line load and embankment material analysis with field data
for settlement along embankment centre line (b) 9m right of embankment centre line
−20 0 20 40 60 80 100 120
−4
−2
0
2
4
6
8
10
12
14
16
18
Horizontal displacement (mm)
Dep
th (
m)
Field data
Creep−Sclay1S
Haarajoki − 4m right of CLLateral deformation after 3 years
Line load analysis
Embankment materialanalysis
−20 0 20 40 60 80 100 120 140
−2
0
2
4
6
8
10
12
14
16
18
Horizontal displacement (mm)
Dep
th (
m)
Field data
Creep−Sclay1S
Haarajoki − 9m right of CLLateral deformation after 3 years
Line loadanalysis
Embankment materialanalysis
Figure 7.16: (a) Comparison of line load with embankment material analysis for lateral deformations
at 4m right of embankment centre line (b) 9m right of embankment centre line
39

Lateral deformations are exaggerated in line load analysis due to excess deformation alongcentre line as shown in Figure 7.16. It is clear that using line load as an alternative toembankment material is not advisable.
There are no significant changes in pore pressures between the two analyses with margin ofdifference ranging between 5 - 9 kPa. The only difference is that pore pressures are higher nearthe surface from line load analysis due to higher concentration of stress along embankmentcentre line. The excess pore pressure after 1500 days is similar for both the analysis as shownin Figure 7.18 (b).
0 50 100 150 200 250
−4
−2
0
2
4
6
8
10
12
14
16
18
Stress (kPa)
De
pth
(m
)
Pore pressure after 35 days(Line load analysis)
Pore pressure after 35 days(Embankment material analysis)
Initial pore pressureequilibrium
0 50 100 150 200 250
−4
−2
0
2
4
6
8
10
12
14
16
18
Stress (kPa)
De
pth
(m
)
Pore pressure after 365 days(Line load analysis)
Pore pressure after 365 days(Embankment material analysis)
Initial pore pressureequilibrium
Figure 7.17: (a) Comparison between line load and embankment material analysis for pore pressure
distribution after 35 days embankment construction (b) after 365 days
0 50 100 150 200 250
−4
−2
0
2
4
6
8
10
12
14
16
18
Stress (kPa)
De
pth
(m
)
Pore pressure after 1500 days(Line load analysis)
Pore pressure after 1500 days(Embankment material analysis)
Initial pore pressureequilibrium
-210 -193 -177
node_groundflow_pressure Y
Z X
Figure 7.18: (a) Comparison between line load and embankment material analysis for pore pressure
distribution after 1500 days (b) Simulation from line load analysis for ground flow pressure after 1500
days in Haarajoki
40

7.6 Geometry sensitivity
The sensitivity of the geometry on the analysis is investigated. The length of geometry isreduced from 50m to 20m and 15m to check the effect of boundary on result. Figure 7.19(a), shows the difference in settlement prediction between different geometries simulated withCreep-Sclay1S model. The settlement, after 1500 days along embankment CL, from 20m and15m geometry is predicted as 0.385m and 0.335m respectively whereas for 50m geometry, thesettlement predicted is 0.422m. This difference when scaled in long term analysis such as 10 or20 years, the accumulation of error can severely distort the prediction. Lateral displacementsare affected significantly by the boundary as shown in Figure 7.19.
0 200 400 600 800 1000 1200 1400 1600
0
0.05
0.1
0.15
0.2
0.25
0.3
0.35
0.4
0.45
0.5
Time (days)
Sett
lem
en
t (m
)
Creep−Sclay1S
Field data at embankment CL
Haarajoki
Geometry−15m length
Geometry−20m length
Geometry−50m length(original)
−20 −10 0 10 20 30 40 50 60 70 80 90
−5
0
5
10
15
Horizontal displacement (mm)
De
pth
(m
)
Field data
Creep−Sclay1S
Haarajoki − 4m right of CLLateral deformation after 1 year
Geometry − 50m length
Geometry − 20m length
Geometry − 15m length
Figure 7.19: (a) Comparison of Creep-Sclay1S simulation of different geometries with field data for
settlement along embankment centre line (b) Lateral deformation after 1 year for different geometries
at 4m right of embankment centre line
41

There is no significant difference in pore pressures between different geomtries as shown inFigure 7.20. Excess pore pressure of 31 kPa exists after 1500 days around 10-15m.
0 50 100 150 200 250
−5
0
5
10
15
Stress (kPa)
De
pth
(m
)
Pore pressure for length − 15m
Pore pressure for length − 20m
Pore pressure for length − 50m
Haarajoki (35 days)Geometry sensitivity
0 50 100 150 200 250
−5
0
5
10
15
Stress (kPa)
De
pth
(m
)
Pore pressure for length − 15m
Pore pressure for length − 20m
Pore pressure for length − 50m
Haarajoki (1500 days)Geometry sensitivity
Figure 7.20: (a) Comparison of pore pressure distribution of different geometries after 35 days
embankment construction (b) after 1500 days
7.7 Mesh sensitivity
The effect of number of elements on the accuracy of result is investigated. A Geometrywith 50m length is chosen for this analysis to avoid boundary effects and meshed in twoseparate files with 22000 elements and 900 elements for comparison. Figure 7.21 (a) showsthe comparison between Creep-Sclay1S simulation with 900 and 22000 elements for settlementalong embankment centre line at Haarajoki. The difference between the two analysis is not verylarge and the margin of error is around 5 %. This can be due to second order elements used inthis analysis. In case of first order elements, a large deviation may be expected, however, dueto incorporation of flow analysis, first order elements cannot be used.
42

0 500 1000 1500
0
0.05
0.1
0.15
0.2
0.25
0.3
0.35
0.4
0.45
0.5
Time (days)
Sett
lem
en
t (m
)
Field data atembankment centre line
Creep−Sclay1S
HaarajokiMesh sensitivity
900 elements
22000 elements
−20 −10 0 10 20 30 40 50 60 70 80
−5
0
5
10
15
Horizontal displacement (mm)
Dep
th (
m)
Field data
Creep−Sclay1S
Haarajoki − 4m right of CLLateral deformation after 1 year
900 elements
22000 elements
Figure 7.21: (a) Comparison of simulation with 900 and 22000 elements with field data for
settlement along embankment CL (b) for lateral displacement at 4m right of embankment CL
Figure 7.22 shows the pore pressure variation with time for simulation with 900 and 22000elements. After 35 days of embankment construction, the peak pore pressure value for 22000elements exhibit 25 kPa more at the bottom layer than 900 elements. A difference in porepressures of 10 kPa at bottom layer can be observed between the two analysis after 1 year.
0 50 100 150 200 250
−4
−2
0
2
4
6
8
10
12
14
16
18
Stress (kPa)
Dep
th (
m)
Pore pressure after35 days
(900 elements)
Pore pressure after35 days
(22000 elements)
Initial pore pressureequilibrium
0 50 100 150 200 250
−4
−2
0
2
4
6
8
10
12
14
16
18
Stress (kPa)
Dep
th (
m)
Pore pressure after365 days
(900 elements)
Pore pressure after365 days
(22000 elements)
Initial pore pressureequilibrium
Figure 7.22: (a) Comparison of simulation with 900 and 22000 elements for pore pressure behaviour
after 35 days embankment construction (b) after 365 days
From the above results, the number of elements does have a marginal impact on the result.However, the margin of error can vary for different geometry and boundary condition makingit a case specific problem. Hence a mesh sensitivity analysis should be investigated to avoid apossible large deviation in any analysis.
43

8 Conclusions & Recommendations
8.1 Conclusions
The thesis presents novel routines implemented in MATLAB for automated determination ofthe model parameters of an advanced constitutive model for soft soils. In this case the CREEP-SCLAY1S model is selected as the benchmark case is a test embankment with long-termmonitoring (4 years) on soft sensitive clay.
In addition to the strength and stiffness parameters (M , κ, λi) also the creep index (µ∗i )and pre-consolidation pressure are directly evaluated from the laboratory data (1D incrementaloedometer test, anisotropically consolidated undrained and drained triaxial tests in compression).The processing showed that with some non-linear interpolation data with a limited numberof data points and noise still could be adequately processed. The batch processing requiredlittle additional user intervention to complete the task properly. At this stage of the researchthe additional hardening parameters were set to best practice recommended values as thosedoesn’t seem to affect the results significantly. The initial K0 distribution is also determinedfrom the well known OCR relations and the strength properties.
The element level simulations with the newly derived model parameters have first beenshown to be in close agreement laboratory test data for the 1D incremental pedometer testand the drained triaxial test. On the other hand the CRS compression tests showed largerdiscrepancies resulting from the complexities of the CRS test that require coupled analysisand rate dependency in the constitutive model as well as high quality samples which were notavailable.
Furthermore, the new model parameter set is shown to lead to the best predictions of thetest embankment so far. The predictions are in good accordance with field measurements forsettlement and pore pressure distribution. The most influential parameters for embankmentsimulation includes the permeability, dry crust stiffness and modified creep index. Thesettlements are exaggerated when creep index values corresponding to in-situ stress conditionare used. This value does not have a significant impact on the element test simulations due toshort duration of tests and smaller domain. Dry crust has been found to be the most sensitivelayer followed by initial soft soil layer (2-4m depth) which is the same as field observations. Itis recommended to use a spatial differential stiffness model for dry crust analysis with propercapturing of OCR variation with strain increment.
It can be concluded that the performance of Creep-Sclay1S model combined with accurateparameter determination is efficient in capturing experimental and field behaviour of soft soil.
44

8.2 Recommendations
The following recommendations are proposed for further research:
• Automated model parameter derivation should be the de facto approach for numericalmodellers to increase the efficiency and reduce the human bias in the model parameterset.
• Improved modelling and characterisation of the in-situ dry crust is paramount forincreasing the accuracy of predictions of stability and safety of structures on and/orin soft soils. Given the complexity of the material, at first in-situ plate load tests orstrength assessment should be considered before systematically studying the behaviourin the laboratory (if sampling is possible at all).
• In cases where advanced constitutive models require validation against high quality datafrom advanced physical model tests on natural soils (these include field scale experiments)it is recommend to complement the test instrumentation with site investigation on highquality samples and using non standard stress path testing to capture all intricate featuresof the constitutive model used.
• Although the current rate dependent models seem to be a genuine improvement upon theprevious generations, still additional validation and modification (unloading/reloading)should be carried out.
45

References
Berre, T. (2013). Test fill on soft plastic marine clay at Onsøy in Norway. Canadian GeotechnicalJournal (ahead of print).
Bjork, S. (2008). The late Quaternary development of the Baltic Sea, 398–407.Brinkgreve, R. B. J., Broere, W., and Waterman, D. (2008). PLAXIS-2D (Version 9.0).Casagrande, A. (1936). The determination of the preconsolidation load and its practical signifi-
cance. Proceedings of the 1st International Conference on Soil Mechanics and FoundationEngineering 1.
Clayton, L. et al. (1991). Glaciation of Wisconsin.Cundy, M. and Neher, H. (2003). Numerical analysis of a test embankment on soft ground
using an anisotropic model with destructuration. Proc., Int. Workshop on Geotechnics ofSoft Soils-Theory and Practice, Noordwijkerhout, The Netherlands, 265–270.
Darcy, H. (1956). Determination des lois d’ecoulement de l’eau a travers le sable. Les FontainesPubliques de la Ville de Dijon, 590–594.
Dijkstra, J. and Karstunen, M. (2014). Survey of benchmark field tests for validation of creepmodels. Tech. rep. Chalmers University of Technology.
Forsstrom, L. and Eronen, M. (1985). Flandrian and Eemian shore levels in Finland andAdjacent Areas - a Discussion, 135–145.
Gens, A. (1982). Stress-strain and strength characteristics of a low plasticity clay. PhD thesis.Gmsh reference manual (2015). Version 2.9.3. url: http://geuz.org/gmsh/doc/texinfo/
gmsh.pdf.Grimstad, G. et al. (2010). Modelling creep and rate effects in structured anisotropic soft clays.
Acta Geotechnica. doi: 10.1007/s11440-010-0119-y.Grimstad, G. and Degago, S. A. (2010). A non-associated creep model for structured anisotropic
clay (n-SAC).Grimstad, G. et al. (2008). Modelling creep and rate effects using the time resistance concept
in a model for anisotropy and destructuration. Nordic Geotechnical Meeting, Sandefjord,Norway, 195–202.
Holtz, R. D. and Kovacs, W. D. (1981). An Introduction to Geotechnical Engineering. PrenticeHall. isbn: 0-13-484394-0.
Jaky, J. (1948). Pressure in Silos. International conference on Soil mechanics and Foundationengineering, Rotterdam, The Netherlands, 103–107.
Janbu, N. (1969). The resistance concept applied to deformation of soils. Proceedings of the7th international conference on soil mechanics and foundation engineering, Mexico city,191–196.
Karstunen, M. et al. (2005). Effect of Anisotropy and Destructuration on the Behaviour ofMurro Test Embankment. International Journal of Geomechanics, 87–97.
Karstunen, M. et al. (2013). Modelling rate-dependent behaviour of structured clays. Interna-tional Conference on Installation Effects in Geotechnical Engineering.
Knappett, J. A. and Craig, R. F. (2014). Craig’s Soil Mechanics. Spon Press. isbn: 978-0-415-56126-6.
Kulhawy, F. H. and Mayne, P. W. (1990). Manual on estimating soil properties for foundationdesign. Electric Power Research Institute Palo Alto, CA.
Leoni, M. et al. (2008). Anisotropic creep model for soft soils. Geotechnique, 215–226. doi:10.1680/geot.2008.58.3.215.
46

MATLAB manual (2008). Ordinary Differential Equations. Version 7.8. Mathworks. url:http://www.mathworks.com/access/helpdesk/help/techdoc/ref/ode45.html.
Muir Wood, D. (1991). Soil behaviour and critical state soil mechanics. Cambridge UniversityPress. isbn: 0-521-33782-8.
Muir Wood, D. (2010). Soil Mechanics - a one dimensional introduction. Cambridge Universitypress. isbn: 978-0-521-18730-5.
NEEM (2013). Eemian interglacial reconstructed from a Greenland folded ice core. Nature,489–493. doi: 10.1038/nature11789.
Nenonen, J. and Portaankorva, A. (2009). The Geology of the Lakeland Finland area.Naatanen, A., Vepsalainen, P., and Lojander, M. (1998). Finite element calculations on
Haarajoki test embankment. Proc.,4th European Conf. on Numerical Methods in GeotechnialEngineering (NUMGE), Udine, Italy, 151–160.
Olsson, M. (2010). “Calculating long term settlements in soft clays - with special focus onGothenburg region”. Licentiate Thesis. Chalmers University of Technology, Sweden.
Perzyna, P. (1963). Constitutive equations for work hardening and rate sensitive plasticmaterials. Proc.,Vibration problems.
Perzyna, P. (1966). Fundamental problems in viscoplasticity. Advanced applied mechanics.Rouainia, M. and Muir Wood, D. (2000). A kinematic hardening model for natural clays with
loss of structure. Geotechnique 50(2).Schmertmann, J. H. (1953). Estimating the true consolidation behaviour of clay from laboratory
test results, 1–26.Sivasithamparam, N. (2012). Modelling Creep behaviour of Soft Soils.Stapelfeldt, T., Vepsalainen, P., and Yin, Z.-Y. (2009). Numerical modelling of a Test embank-
ment on soft clay improved with vertical drains.Sallfors, G. (1975). Preconsolidation pressure of soft,high plastic clays. PhD Thesis.Taylor, D. W. (1948). Fundamentals of soil mechanics.Tochnog Professional User’s manual (2015). Version 22. FEAT-Finite Element Application
Technology. url: http://www.feat.nl/manuals/user/user.pdf.Vepsalainen, P., Lojander, M., and Koskinen, M. (1997). Competition to calculate settlements
at Haarajoki test Embankment. Competition programme, Competition materials, FinnRA,Finland.
Wefer, G. et al. (2002). Climate Development and History of the North Atlantic Realm. Springer.isbn: 978-3540432012.
Wheeler, S. J. et al. (2003). An anisotropic elastoplastic model for soft clays. CanadianGeotechnical Journal, 403–418.
Yildiz, A., Karstunen, M., and Krenn, H. (2009). Effect of Anisotropy and Destructuration onBehaviour of Haarajoki Test Embankment. International Journal of Geomechanics, 153–168.doi: 10.1061/(ASCE)1532-3641(2009)9:4(153).
Yin, Z.-Y., and Karstunen, M. (2011). Modelling strain rate dependency of natural soft clayscombined with anisotropy and destructuration. Acta mechanica solida sinica, 216–230. doi:10.1016/S0894-9166(11)60023-2.
Yin, Z.-Y. et al. (2011). Modelling Time Dependant Behaviour of Soft Sensitive Clay. Journal ofGeotechnical and Geo-Environmental engineering, 1103–1113. doi: 10.1061/(ASCE)GT.1943-5606.0000527.
47

A Instrument installation
A.1 Layout
The embankment layout is divided into station numbers fixed for each location as a referencepoint which are mentioned in the FinnRA report (Vepsalainen et al. 1997). Field measurementsfor area without ground improvement are recorded at station number 35840 as shown in FigureA.1, where horizontal displacement, settlements and pore pressure measurements at differentdepth are available. Hence cross-section at station number 35840 has been considered for theanalysis. Some of the instruments are installed before the construction of the embankment.Piezometers tips, inclinometer pipes, ground screws and extensometers are installed in areaswithout ground improvement before the construction of the work base. Settlement plates andpressure cells are installed in the same area simultaneously with spreading of the material. Inareas with prefabricated vertical drains, all instruments are installed immediately after draininstallation.
Figure A.1: Layout of Haarajoki test embankment with instrument positions (Yildiz et al.2009)
A.2 Installation procedure
Piezometer tips are installed two months prior to the construction of the embankment tomeasure the initial pore water pressure. In ground improved areas, piezometer tips are installedin the centre of the square of vertical drain strips. Inclinometers are also installed two monthsprior to the embankment construction in unimproved areas and in ground improved areas it isinstalled immediately after vertical drain installation. The inclinometer pipes are extended aswork on the embankment proceeds and installed in such a way that the bottom of the pipe is
48

anchored in dense moraine. Settlement plates of size 30cm x 30 cm and 1 cm thick are laidunder the embankment to measure the overall settlement of the layer. The plates are installedimmediately after drain installation in ground improved areas. The plates, connected to a rod,are laid in their assigned position in an excavated area of 0.5m x 0.5m of the work base andcompacted as tight as possible. The vertical alignment of the rods are checked regularly duringinstallation. The pressure cells are installed in the same procedure as for settlement plates.During construction of top surface of the embankment, settlement control points are installedby sinking half the length of a concrete pipe, 30 cm diameter, which is then filled with concreteand fastened with bolts on the top surface for determination of coordinates. By levelling thebolts in the control points, it is possible to observe the overall transition of the embankment.The installation schedule and location for all instruments are mentioned in the report providedby FinnRA (Vepsalainen et al. 1997).
A.3 Instrument position
Table A.1: Location of instruments under Haarajoki embankment for unimproved ground
Instruments Reference ID Station number Location
Settlement plates
P8 35840 9m leftP9 35840 4m leftP10 35840 Centre lineP11 35840 4m rightP12 35840 9m right
Piezometer tips
B1 35837 Centre lineB2 35837 Centre lineB3 35837 Centre lineB4 35837 Centre lineB5 35837 Centre line
InclinometersI1 35838 4m rightI2 35838 9m rightI5 35838 4m right
49

B Embankment construction schedule
Figure B.1: Illustration of schedule for embankment construction at Haarajoki
50

C Layering
100
101
102
103
104
0.5
1
1.5
2
2.5
3
3.5
log(σv’) − kPa
Vo
id r
ati
o
Oedometer nr = 1751 Depth =0.52−0.55 m
Oedometer nr = 1621 Depth =0.64−0.67 m
Oedometer nr = 1750VDepth =1.05−1.11 m
Oedometer nr = 1749 Depth =1.11−1.14 m
Oedometer nr = 1633 Depth =1.72−1.75 m
Oedometer nr = 1607 Depth =1.77−1.8 m
Haarajoki (0 − 2 m)
100
101
102
103
104
0.6
0.7
0.8
0.9
1
1.1
1.2
1.3
1.4
1.5
Magnified Layer 1
100
101
102
103
0.5
1
1.5
2
2.5
3
3.5
log(σv’) − kPa
Vo
id r
ati
o
Oedometer nr = 1632 Depth =2.31−2.34 m
Oedometer nr = 1625VDepth =3.03−3.09 m
Oedometer nr = 1624 Depth =3.09−3.12 m
Oedometer nr = 1604 Depth =3.22−3.25 m
Haarajoki
Layer 2 = 2 − 3.5 m
51

100
101
102
103
0.5
1
1.5
2
2.5
3
3.5
log(σv’) − kPa
Vo
id r
ati
o
Oedometer nr = 1648VDepth =4.13−4.22 m
Oedometer nr = 1601 Depth =4.34−4.37 m
Oedometer nr = 1609 Depth =5.2−5.23 m
Haarajoki
Layer 3 = 3.5 − 6 m
100
101
102
103
0.5
1
1.5
2
2.5
3
3.5
log(σv’) − kPa
Vo
id r
ati
o
Oedometer nr = 1627VDepth =6.06−6.12 m
Oedometer nr = 1626 Depth =6.12−6.15 m
Oedometer nr = 1610 Depth =7.2−7.23 m
Oedometer nr = 1650VDepth =8.25−8.34 m
Oedometer nr = 1603 Depth =8.34−8.37 m
Oedometer nr = 1630VDepth =8.97−9.03 m
Oedometer nr = 1629 Depth =9.03−9.06 m
Oedometer nr = 1611 Depth =9.2−9.23 m
Oedometer nr = 1631 Depth =9.32−9.35 m
Haarajoki
Layer 4 = 6 − 10 m
52

100
101
102
103
0.5
1
1.5
2
2.5
3
3.5
log(σv’) − kPa
Vo
id r
ati
o
Oedometer nr = 1612 Depth =11.2−11.23 m
Oedometer nr = 1606 Depth =11.22−11.25 m
Oedometer nr = 1605 Depth =13.22−13.25 m
Haarajoki
Layer 5 = 10 − 15 m
100
101
102
103
104
0.5
1
1.5
2
2.5
3
3.5
log(σv’) − kPa
Vo
id r
ati
o
Oedometer nr = 1613 Depth =15.2−15.23 m
Oedometer nr = 1628 Depth =17.2−17.23 m
Haarajoki
Layer 6 = 15 − 18 m
53

10
0
10
2
10
40
.51
1.52
2.53
3.5
Layer
10 −
2 m
Void ratio, e
10
0
10
2
10
40
.51
1.52
2.53
3.5
Layer
22 −
3.5
m
10
0
10
2
10
40
.51
1.52
2.53
3.5
Layer
33.5
− 6
m
10
0
10
2
10
40
.51
1.52
2.53
3.5
Layer
46 −
10 m
10
0
10
2
10
40
.51
1.52
2.53
3.5
Layer
510 −
15 m
10
0
10
2
10
40
.51
1.52
2.53
3.5
Lay
er
61
5 −
18 m
Lo
g (
σv’)
− k
Pa
SU
MM
AR
Y
54

DS
um
mary
of
para
mete
rs
Table
D.1
:Sum
mar
yof
Cre
ep-S
clay
1Spar
amet
ers
der
ived
from
lab
orat
ory
test
sfo
rH
aara
joki
sam
ple
s
Typ
eP
ara
mete
rsSym
bol
Dep
thof
layers
(m)
0-
22
-3.5
3.5
-6
6-
10
10
-15
15
-18
Isot
ropic
par
amet
ers
Sw
elling
index
κ∗
-0.
030
0.03
60.
034
0.04
00.
041
Intr
insi
cco
mpre
ssio
nin
dex
λ∗ i
-0.
100
0.10
50.
101
0.09
00.
086
Poi
sson
’sra
tio
ν′
0.35
00.
180
0.18
0.18
00.
180
0.28
0C
riti
cal
stat
ein
com
pre
ssio
nM
c1.
800
1.45
00.
940
1.24
01.
100
1.56
0C
riti
cal
stat
ein
exte
nsi
onM
e1.
130
0.97
70.
720
0.87
70.
805
1.03
0F
rict
ion
angl
eφ′ cv
43.8
1435
.726
23.9
7630
.919
27.6
9738
.248
Anis
otro
pic
par
amet
ers
Init
ial
incl
inat
ion
ofyie
ldsu
rfac
eα0
0.76
0.56
0.37
0.47
0.42
0.61
Abso
lute
effec
tive
nes
sin
rota
tion
alhar
den
ing
ω-
23-
4624
-48
30-
6035
-70
40-
80R
elat
ive
effec
tive
nes
sin
rota
tion
alhar
den
ing
ωd
0.95
0.98
0.43
0.8
0.64
1.02
Des
truct
ura
tion
par
amet
ers
Init
ial
bon
din
gχ0
1.76
14.5
825
.14
33.9
848
.46
61.0
Abso
lute
rate
ofdes
truct
ura
tion
ξ9.
09.
09.
09.
09.
09.
0R
elat
ive
rate
ofdes
truct
ura
tion
ξ d0.
20.
20.
20.
20.
20.
2V
isco
us
par
amet
ers
Cre
epco
effici
ent
µ∗ i
0.00
100.
0060
0.00
650.
0080
0.00
400.
0050
Ref
eren
ceti
me
(day
s)τ
1.0
1.0
1.0
1.0
1.0
1.0
Init
ial
stre
ssst
ate
par
amet
ers
Init
ial
void
rati
oe 0
1.33
3.35
3.03
2.38
2.58
1.96
Unit
wei
ght
for
each
laye
r(K
N/m
3)γ′
17.2
513
.78
14.1
14.7
814
.615
.9P
reco
nso
lidat
ion
pre
ssure
(kP
a)σ′ p
-49
5165
8792
Lat
eral
eart
hpre
ssure
atre
stK
NC
00.
308
0.41
60.
594
0.48
60.
535
0.38
1O
verc
onso
lidat
ion
rati
oO
CR
-2.
524
1.88
91.
358
1.31
01.
070
Pre
over
burd
enpre
ssure
(kP
a)P
OP
-29
.29
26.0
013
.50
20.7
88.
87
55

E Initial in-situ stress condition
Table E.1: Initial in-situ stress condition prior to embankment loading in Haarajoki soil profile
LayerDepth
(m)σv
(kPa)u
(kPa)σ′v
(kPa)PCP(kPa)
OCR(-)
POP(kPa)
φ′cv K0
σ′
h
(kPa)
0 - 2m
0.535 9.710 5.400 4.316 - - -
0.765
0.803 3.4680.655 11.830 6.570 5.258 - - - 0.803 4.2241.08 19.600 10.890 8.711 - - - 0.803 6.9991.125 20.130 11.180 8.947 - - - 0.732 6.5531.735 30.900 17.170 13.734 - - - 0.308 4.2261.785 31.780 17.660 14.126 - - - 0.658 9.300
2 - 3.5 m
2.325 40.000 22.960 17.043 50.209 2.946 33.165
0.624
0.782 13.3273.06 50.330 30.310 20.016 48.505 2.423 28.489 0.698 13.9653.105 50.740 30.610 20.135 55.633 2.763 35.499 0.753 15.1663.215 52.260 31.690 20.570 52.030 2.529 31.455 0.715 14.7143.235 52.530 31.880 20.650 43.546 2.109 22.896 0.643 13.284
3.5 - 6 m4.175 66.150 41.400 24.750 40.641 1.642 15.890
0.4180.726 17.973
4.355 68.270 42.870 25.400 50.682 1.996 25.290 0.786 19.9635.215 80.410 51.310 29.110 53.390 1.834 24.280 0.760 22.110
6 - 10 m
6.09 93.060 60.040 33.020 70.891 2.147 37.870
0.540
0.720 23.7726.135 93.500 60.330 33.170 83.167 2.508 50.000 0.780 25.8616.175 94.530 61.020 33.510 38.319 1.144 4.810 0.521 17.4546.355 96.740 62.490 34.250 47.306 1.381 13.060 0.574 19.6567.215 109.390 70.930 38.460 51.181 1.331 12.720 0.563 21.6578.295 125.720 81.820 43.910 45.189 1.029 1.280 0.493 21.6658.355 126.170 82.110 44.060 51.472 1.168 7.420 0.527 23.202
9 135.880 88.580 47.290 55.052 1.164 7.760 0.526 24.8609.045 136.320 88.880 47.440 65.619 1.383 18.180 0.574 27.2489.215 138.820 90.550 48.270 74.276 1.539 26.000 0.607 29.2869.335 140.590 91.720 48.860 95.003 1.944 46.140 0.684 33.431
10 - 15 m11.215 168.100 110.170 57.940 74.391 1.284 16.450
0.4830.601 34.830
11.235 168.400 110.360 58.030 85.998 1.482 27.960 0.643 37.29113.235 197.590 129.980 67.610 87.798 1.299 20.190 0.604 40.858
15 - 18 m15.215 226.720 149.410 77.310 80.400 1.040 3.080
0.6680.390 30.175
17.215 257.900 169.030 88.870 103.114 1.160 14.240 0.418 37.119
56

F Other methods of determining pre-consolidationpressure
Pre-consolidation pressure (σ′p) is the maximum overburden pressure sustained by a soil in its
history. It is also defined as the yielding point of a soil beyond which a transition is observedfrom elastic to elasto-plastic behaviour. An accurate determination of σ
′p is necessary due
to sensitivity of soft soil behaviour to loading. A number of methods have been proposedby different researchers to estimate an approximate value for pre-consolidation pressure.Casagrande 1936 proposed the most commonly used method of deriving σ
′p from e− log (σ
′v)
plot. The steps recommended from this method is mentioned in Holtz and Kovacs 1981 andexplained subsequently.
A point of maximum curvature is chosen from observation (Point A from Figure F.1) frome− log (σ
′v) curve. An horizontal line and a tangent is drawn from point A and intersected. The
angle formed from this intersection is bisected and a straight line is drawn from the normallyconsolidated region. The point of intersection between this line and the bisected line (Point Bfrom Figure F.1) is taken as the value of pre-consolidation pressure.
Figure F.1: Illustration of Casagrande’s method for determination of pre-consolidation stress(Holtz and Kovacs 1981)
Due to effects of sampling disturbance, there is an expected decrease in the slope of thevirgin compression line and the magnitude of error depends on the rate of disturbance of thesample. Hence it can be assumed that the slope of virgin compression line determined inlaboratory tests are, in most cases, slightly less than that found in in-situ conditions. Thisaffects the determination of pre-consolidation stress since accurate values are necessary toobtain the transition point of soil behaviour from elastic to elastic-plastic region. Schmertmann1953 pointed out that the slope of virgin compression line for disturbed samples would intersectits in-situ counterpart at a void ratio around 0.42 times the initial void ratio of the sample.
57

Figure F.2: Illustration of Schmertmann’s proposal of eventual intersection of virgin com-pression line between laboratory and in-situ samples at e = 0.42e0 (Knappett and Craig2014)
It is widely known that soft soils are highly strain-rate dependant which implies that the pre-consolidation stress would differ for different strain rates. This shows that the pre-consolidationvalue is sensitive to rate of loading. Sallfors 1975 proposed a methodology for the evaluation ofpre-consolidation pressure from constant strain-rate (CRS) tests. This method is commonlyused in Sweden. Soil samples are loaded at a constant strain-rate of 0.7%/hour. The resultsare plotted in an arithmetic scale corresponding to 10 kPa stress/1% strain ratio. The linearpart from the elastic and elastic-plastic region is intersected and an isosceles triangle is drawnas shown in Figure F.3. Finally, the point σ
′c is identified as the pre-consolidation pressure for
that sample.
Figure F.3: Principle for evaluation of pre-consolidation stress according to Sallfors (1975)
58

G Determination of modified intrinsic creepindex
Creep effect is recognized as one of the most important aspects of soft soil behavior. Differentmodels have been developed to account for viscous effects. Creep-Sclay1S model, an extensionof the S-CLAY1S model, incorporates creep effect. The model makes use of a visco-plasticmultiplier Grimstad et al. 2008 which is expressed from equation G.1.
Λ =µ∗iτ.
(peq
(1 + χ).p′mi
)λ∗i−κ∗
µ∗i.M2c − α2
0
M2c − η20
(G.1)
where µ∗i is the intrinsic creep index and its determination is explained by a time resistanceconcept according to Grimstad et al. 2010. The time resistance concept is first introducedby Janbu 1969. The time resistance, R, is given by the relation in equation G.2. The timeresistance number (rs) is obtained by numerical differentiation from equation G.2.
R =dt
dε(G.2)
rs =d(∂t/∂εa)
dt=dR
dt=
(∂t/∂εa(t)−Rref )
t− τ(G.3)
dt
dε(t) = rs.(t− τ) +Rref = rs.t (G.4)
dεvpvdt
=1
rs.t⇒ ∆εvpv =
1
rslnt
τ(G.5)
From equation G.5, the modified creep index (µ∗) parameter used in Creep-Sclay1S modelis similar to the time resistance number which is given by the relation rs = 1/µ∗. Grimstadand Degago 2010 claims that no creep would occur if limit tmax or OCRmax is reached. FigureG.1 shows the comparison of time resistance number between reconstituted and undisturbedsample. The initial structure is defined according to equation G.6.
χ0 =rsi − rs,minrs,min
(G.6)
Figure G.1: Determination of intrinsic creep value from Grimstad and Degago 2010
59

H Experimental procedure
H.1 Oedometer test
Oedometer tests are designed to create a one-dimensional loading condition that representsthe field condition for soils. Samples for this test are usually 20 mm thick and 50 mm widediametrically, however, this standard differs for different region. The soil is placed in acylindrical confining ring which prevents lateral deformation. In order to reduce friction, siliconpaste is applied on the surface of the ring enclosing the sample or rings made of teflon materialare also used. However, the type of method used for Haarajoki samples to reduce frictionfrom confining ring is not specified. During the test, the sample is covered in water to makeit air tight. Porous stones are placed on the top and bottom of the sample. The differencebetween the oedometer incremental loading (IL) tests and constant strain-rate is attributed tothe loading condition. A standard IL procedure comprises of incremental load steps which isdoubled on each step and kept constant for 24 hours. For oedometer CRS tests, the sample iscompressed at a constant displacement rate with varying load and the rate differs for differentregion. In Sweden, a standard deformation rate of 0.0024 mm/min (0.72%/hour) is used.Continuous monitoring is required for CRS tests to maintain a constant rate of displacement.In most cases, CRS tests are preferred over incremental loading as it takes less time and cost.
Figure H.1: Schematic diagram of an Oedometer apparatus (Knappett and Craig 2014)
60

H.2 Triaxial test
Another most commonly used laboratory testing for measuring soil behaviour is the triaxialapparatus which is suitable for all types of soil. The advantage of using this test over oedometeris that drainage can be controlled and pore pressure measurements be obtained. In the loadcell, the cylindrical soil sample is covered in a thin rubber membrane. Generally, the heightof the sample is taken as twice its diameter. The cell is filled with liquid, mostly water, andpressurized to a constant cell pressure. The sample is then loaded axially with a ram in additionto the cell pressure to initiate deviatoric stress in the sample until failure takes place, usuallyon a diagonal plane through the sample. The test can be conducted in drained condition andin undrained conditions where excess pore pressures can be measured. For triaxial compressiontest, the ram is pushed down at a constant rate which acts as the major principal stress withcell pressure acting radially on the sample. For triaxial extension tests, the cell pressure actsas the major principal stress and the soil shears in extension. Triaxial test is useful in deducingfriction angle (φ
′cv), dilatancy angle (ψ
′), cohesion (c), slope of critical state (M) and other
parameters. The stress path of the sample can be plotted in p′ − q plane and correspondingvolumetric and deviatoric strains can also be plotted.
Figure H.2: Schematic diagram of a commonly used triaxial apparatus (Knappett and Craig 2014)
61

IP
ara
mete
rse
nsi
tivit
yan
aly
sis
on
CR
Ssi
mu
lati
on
Table
I.1:
Sen
siti
vit
yof
Cre
ep-S
clay
1Sm
odel
’spar
amet
ers
onoed
omet
erC
RS
sim
ula
tion
for
Haa
rajo
ki
sam
ple
s
Sl.
No.
Para
mete
rsSym
bol
Ori
gin
al
valu
eM
odifi
ed
valu
eP
erc
enta
ge
of
chan
ge
Infl
uen
ceon
CR
Ssi
mu
lati
on
1R
elat
ive
effec
tive
nes
sof
rota
tion
alhar
den
ing
ωd
1.02
0.02
98.0
4In
crea
sein
pla
stic
com
pre
ssio
nbut
not
sign
ifica
nt
2A
bso
lute
effec
tive
nes
sof
rota
tion
alhar
den
ing
ω60
.00
2.00
96.6
7A
lmos
tno
chan
ge,
soneg
ligi
ble
3P
re-o
verb
urd
enpre
ssure
(kP
a)P
OP
87.0
067
.00
22.9
9Sig
nifi
cant
chan
geat
the
star
tof
elas
to-p
last
icre
gion
4Sw
elling
index
κ∗
0.04
10.
030
26.8
3Sig
nifi
cant
chan
gein
the
elas
tic
regi
on
5In
trin
sic
Com
pre
ssio
nin
dex
λ∗ i
0.08
90.
100
12.3
6Sig
nifi
cant
chan
gein
the
pla
stic
regi
on
6M
odifi
edin
trin
sic
cree
pin
dex
µ∗ i
0.00
50.
001
80.0
0M
arke
ddiff
eren
cein
the
pla
stic
stre
sspat
h
7In
itia
lb
ondin
gχ0
67.0
047
.00
29.8
5Q
uit
esi
gnifi
cant
chan
geat
the
end
ofpla
stic
com
pre
ssio
nst
ress
pat
h
8C
riti
cal
stat
ein
com
pre
ssio
nM
c1.
561.
0035
.90
Not
assi
gnifi
cant
asth
eot
her
isot
ropic
par
amet
ers
but
has
are
ason
able
diff
eren
ce9
Init
ial
void
rati
oe 0
1.96
3.96
102.
04N
och
ange
10U
nit
wei
ght
inK
N/m
3γ′
16.0
14.0
12.5
0N
och
ange
11P
oiss
on’s
rati
oν′
0.28
0.15
46.4
3Sligh
tch
ange
inth
eel
asti
cre
gion
but
not
sign
ifica
nt
62

J Flow equation
Darcy’s law formulated by Henry Darcy (Darcy 1956) governs the flow of water through aporous medium. In Geotechnical engineering, the flow of liquids in soft soil is generally slow.First, it is necessary to understand the Bernoulli’s proposal describing the hydrostatic conditionin soil which is given in equation J.1.
u+ ρfgz +1
2ρfv
2 = constant (J.1)
Where ρf is the density of fluid, u is the pore pressure and v is the velocity of fluid inthe porous medium. In the absence of frictional loss, the sum of pressure, potential energyand kinetic energy along a flow path is considered a constant. Hence the total head, H, of ahydraulic system can be rewritten from equation J.1 as J.2.
H = (u/ρfg) + z + hv = constant (J.2)
where h is the pressure head, z is the elevation head and hv is the velocity head. Forstationary fluid, which is the initial condition prior embankment loading, there is no kineticenergy and the velocity head can be ignored (hv = 0). From Darcy’s law, the discharge velocity(qv) is proportional to conductivity (k) and hydraulic gradient which is given by equation J.3.
qv =Q
A= −kdH
dx(J.3)
qv = −k[∂u
∂x
1
ρfg+∂z
∂x
]⇒ − k
γf
[∂u
∂x− ρfg
∂z
∂x
](J.4)
By considering three dimensional flow, the equationJ.4 is modified to J.5
qv = − k
γf
[∇u− ρfg
]where ∇ =
∂
∂x+
∂
∂y+
∂
∂z(J.5)
Since the z coordinate is considered in the vertical direction, the components of gravity withrespect to the three axes is given as, gx = 0, gy = 0 and gz = −g.
qvx = − k
γf
∂u
∂xqvy = − k
γf
∂u
∂yqvz = − k
γf
(∂u∂z
+ ρfg)
(J.6)
∇qv =∂qvx∂x
+∂qvy∂y
+∂qvz∂z
= −∇.( kγf∇u)
(J.7)
Due to assumption of homogeneous material, the hydraulic conductivity (k) and volumetricweight of fluid (γf ) are considered to be constants. Hence equation J.7 reduces to J.8
∇qv = − k
γf∇2u where ∇2 =
∂2
∂x2+
∂2
∂y2+
∂2
∂z2(J.8)
From equation J.8, the change in flow is quadratically proportional to the change in porepressure. This is one of the reasons for opting second order elements when flow analysis isincorporated.
63

K Settlement results from embankment simu-lation
0 0.0744 0.149
node_materi_velocity_integrated Y
Z X
Figure K.1: Settlement with maximum value of 0.149m under embankment centre line after35 days of embankment construction at Haarajoki
0 0.13 0.261
node_materi_velocity_integrated Y
Z X
Figure K.2: Settlement with maximum value of 0.261m under embankment centre line after365 days at Haarajoki
64

0 0.211 0.422
node_materi_velocity_integrated Y
Z X
Figure K.3: Settlement with maximum value of 0.422m under embankment centre line after1500 days at Haarajoki
0 0.528 1.06
node_materi_velocity_integrated Y
Z X
Figure K.4: Settlement with maximum value of 1.060m under embankment centre line after1000 years at Haarajoki
65

L Pore pressure results from Embankment sim-ulation
-234 -205 -176
node_groundflow_pressure Y
Z X
Figure L.1: Groundflow with maximum excess pore pressure upto 58 kPa around 16m depthafter 35 days of its construction for Haarajoki soil deposit
-219 -198 -177
node_groundflow_pressure Y
Z X
Figure L.2: Groundflow with maximum excess pore pressure upto 42 kPa around 12 - 16mdepth after 365 days of embankment loading for Haarajoki soil deposit
66

-209 -193 -177
node_groundflow_pressure Y
Z X
Figure L.3: Groundflow with maximum excess pore pressure upto 32 kPa around 8 - 15mdepth after 1500 days of embankment loading for Haarajoki soil deposit
-177 -177 -177
node_groundflow_pressure Y
Z X
Figure L.4: Groundflow with no excess pore pressures after 1000 years of embankment loadingfor Haarajoki soil deposit
67