![NSI Newsletter - March 2016 › Newsletter › NSI Newsletter - March 2016.pdfNSI Newsletter [ 3 ] Secretary’s Message Obituary NSI mourns the sad, untimely demise of a young upcoming](https://static.fdocuments.net/doc/165x107/5f2689493896984d0e36119a/nsi-newsletter-march-a-newsletter-a-nsi-newsletter-march-2016pdf-nsi-newsletter.jpg)
NSI 2014: The “Why” of Strengths and the “How” of Hope
29
NAVIANCE SUMMER INSTITUTE 2014 PALM SPRINGS, CALIFORNIA
description
In this Gallup keynote address presented by Brandon Busteed, learn how students chase academic success, a good job, and a great life by doing what they do best and by being hopeful throughout the process.
Transcript of NSI 2014: The “Why” of Strengths and the “How” of Hope

NAVIANCE SUMMER INSTITUTE 2014 PALM SPRINGS, CALIFORNIA

NAVIANCE SUMMER INSTITUTE 2014 | PALM SPRINGS, CALIFORNIA
THE WHY OF STRENGTHS AND THE HOW OF HOPE
Brandon Busteed
Executive Director
Gallup Education
@brandonbusteed

3Copyright © 2014 Gallup, Inc. All rights reserved.

4Copyright © 2014 Gallup, Inc. All rights reserved.

5Copyright © 2014 Gallup, Inc. All rights reserved.

6
Current Education Measures Insufficient
High School GPA, Rank In Class
SAT, ACT
INPUTS OUTPUTS
GPA, Rank In ClassRetention Rates,
Degree AttainmentGainful EmploymentAnd maybe…
- CLA, etc.
Hope is a stronger predictor of college success than SAT and GPA.
Copyright © 2014 Gallup, Inc. All rights reserved.

7
WHAT IS THE
ULTIMATE
OUTCOME OF AN EDUCATION ?
Copyright © 2014 Gallup, Inc. All rights reserved.

8
What Does A ‘Great Life’ Look Like?
Purpose Social Financial
CommunityPhysical
How you occupy your time; liking
what you do each day
Managing your economic life to
reduce stress and increase security
Relationships and love in your life
Good health and enough energy to get things done
daily
Engagement and involvement in the
area where you live
Copyright © 2014 Gallup, Inc. All rights reserved.

9
Well-being Matters to Organizations
None One Two Three Four Five$0
$2,000
$4,000
$6,000
$8,000
$10,000
$12,000
$9,370
$7,457$6,361
$5,387$4,570
$3,539
Annual Health-Related Cost to Employer(Disease Burden and Unhealthy Days)
Total Age: 44 and younger Age: 45 and older
Number of Elements Thriving at Baseline (2010)
Controlling for demographic differences at baseline (2010) Copyright © 2014 Gallup, Inc. All rights reserved.

10
Opportunities to learn and grow
Progress in last six months
I have a best friend at work
Coworkers committed to quality
Mission/Purpose of company
At work, my opinions seem to count
Someone encourages my development
Supervisor/Someone at work cares
Recognition last seven days
Do what I do best every day
BASIC NEEDS
INDIVIDUAL CONTRIBUTION
TEAMWORK
I have materials and equipment
I know what is expected of me at work
What Does a ‘Great Job’ Look Like?
GROWTH
Copyright © 2014 Gallup, Inc. All rights reserved.

11
Engagement Matters to Organizations
Series1
-70%
-60%
-50%
-40%
-30%
-20%
-10%
0%
10%
20%
30%
-37%
-25%
-49% -49%
-60%
12%18% 16%
Difference between top and bottom engagement quartiles
Turnover
Absen-teeism
SafetyIncidents
Customer Productivity Profitability
High-Turnover
Orgs.
Low-Turnover
Orgs.
Quality(Defects)
Copyright © 2014 Gallup, Inc. All rights reserved.

12
A Strengths Focus
2013 Poll Ignored Weakness Strengths0%
20%
40%
60%
80%
100%
18%
40%
22%1%
52%
57%
33%
38%
30%
2%
45%61% Engaged
Not Engaged
Actively Disengaged
Copyright © 2014 Gallup, Inc. All rights reserved.
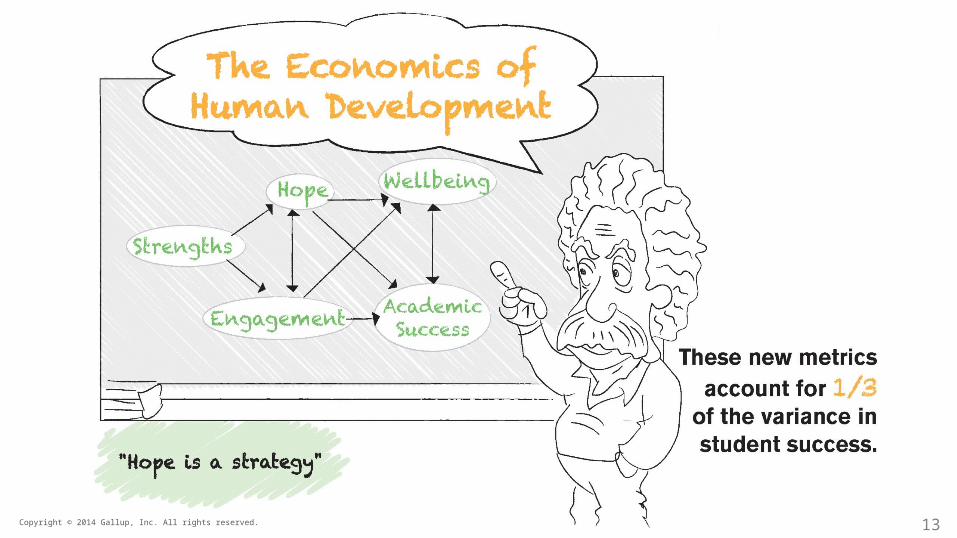
13Copyright © 2014 Gallup, Inc. All rights reserved.

14Copyright © 2014 Gallup, Inc. All rights reserved.

15Copyright © 2014 Gallup, Inc. All rights reserved.

16Copyright © 2014 Gallup, Inc. All rights reserved.

17Copyright © 2014 Gallup, Inc. All rights reserved.

18Copyright © 2014 Gallup, Inc. All rights reserved.

19Copyright © 2014 Gallup, Inc. All rights reserved.

20Copyright © 2014 Gallup, Inc. All rights reserved.

21
What Works in School is Real Work…
21st century skills predict work success
• “Worked on a long-term project that took several classes to complete” (28% HS vs. 50% college)
• “Used what you were learning about to develop solutions to real-world problems in your community or in the world” (22% vs. 27%)
Copyright © 2014 Gallup, Inc. All rights reserved.

22
…and Caring.
• Teacher support positively correlated with 21st century skill exposure
‘Teachers cared about my problems and feelings’
‘Teachers knew about my hopes and dreams’
23% of high school grads vs.
16% of college grads
18% of high school grads vs.
11% of college grads
Copyright © 2014 Gallup, Inc. All rights reserved.

23
Gallup-Purdue IndexGreat Jobs And Great Lives
Copyright © 2014 Gallup, Inc. All rights reserved.

24
It’s Not Where You Go…
No Difference in Workplace
Engagement or Well-being of
Graduates Between:
Public vs. private non-profits
Highly selective institutions and rest
Top 100 ranked schools in US News & World Report and rest
Copyright © 2014 Gallup, Inc. All rights reserved.

25
It’s How You Do It…
Graduates who were “emotionally supported”
as likely to be THRIVING in their well-being3x
during college have more than
double the odds of being ENGAGED in their work and nearly
– “At least one professor who made me excited about learning”– “Professors cared about me as a person”– “A mentor who encouraged my hopes and dreams”
Copyright © 2014 Gallup, Inc. All rights reserved.

26
It’s How You Do It…
double the odds of being ENGAGED in their work and more are thriving (13% vs. 10%)
– “Long-term project taking a semester or more to complete”– “Internship or job where applied learning”– “Extremely involved in extra-curricular activities & organizations”
Graduates who were “experiential and deep learning” have more than
Copyright © 2014 Gallup, Inc. All rights reserved.

27Copyright © 2014 Gallup, Inc. All rights reserved.

28Copyright © 2014 Gallup, Inc. All rights reserved.

29Copyright © 2014 Gallup, Inc. All rights reserved.