Novel Loci Associated with PR Interval in a Genome...
40
DOI: 10.1161/CIRCGENETICS.112.963991 1 Novel Loci Associated with PR Interval in a Genome-Wide Association Study of Ten African American Cohorts Running title: Butler et al.; genome-wide association study of PR interval Anne M. Butler, MS 1* ; Xiaoyan Yin, PhD 2* ; Daniel S. Evans, PhD, MPH 3* ; Michael A. Nalls, PhD 4* ; Erin N. Smith, PhD 5* ; Toshiko Tanaka, PhD 6* ; Guo Li, MS 7* ; Sarah G. Buxbaum, PhD 8,9 ; Eric A. Whitsel, MD, MPH 1,10 ; Alvaro Alonso, MD, MPH 11 ; Dan E. Arking, PhD 12 ; Emelia J. Benjamin, MD, MPH 2,13,14,15 ; Gerald S. Berenson, MD 16 ; Josh C. Bis, PhD 7 ; Wei Chen, PhD 16 ; Rajat Deo, MD 17 ; Patrick T. Ellinor, MD, PhD 18, 19 ; Susan R. Heckbert, MD, PhD 7,20 ; Gerardo Heiss, MD, PhD 1 ; Wen-Chi Hsueh, PhD 21 ; Brendan J. Keating, PhD 22 ; Kathleen F. Kerr, PhD 23 ; Yun Li, PhD 24, 25 ; Marian C. Limacher, MD 26 ; Yongmei Liu, MD, PhD 27 ; Steven A. Lubitz, MD, MPH 18 ; Kristin D. Marciante, PhD 7 ; Reena Mehra, MD 28 ; Yan A. Meng, PhD 29 ; Anne B. Newman, MD, MPH 30 ; Christopher Newton-Cheh, MD, MPH 18, 29,31 ; Kari E. North, PhD 1,32 ; Cameron D. Palmer, BSc 29 ; Bruce M. Psaty, MD, PhD 7,20,33,34,35 ; P. Miguel Quibrera, MS 1 ; Susan Redline, MD, MPH 36 ; Alex P. Reiner, MD 20 ; Jerome I. Rotter, MD 37 ; Renate B. Schnabel, MD, PhD 38 ; Nicholas J. Schork, PhD 39,40 ; Andrew B. Singleton, PhD 4 ; J. Gustav Smith, MD, PhD 41 ; Elsayed Z. Soliman, MD, MSc, MS 27 ; Sathanur R. Srinivasan, PhD 16 ; Zhu-ming Zhang, MD 27 ; Alan B. Zonderman, PhD 42 ; Luigi Ferrucci, PhD 6** ; Sarah S. Murray, PhD 39,43** ; Michele K. Evans, MD 6** ; Nona Sotoodehnia, MD, MPH 7,33** ; Jared W. Magnani, MD 2,13** ; Christy L. Avery, PhD 1** 1 Dept of Epidemiology, 10 Dept of Medicine, School of Medicine, 24 Dept of Genetics, 25 Dept of Biostatistics, 32 Carolina Ctr for Genome Sciences, Univ of North Carolina, Chapel Hill, NC; 2 NHLBI’s & BU’s Framingham Heart Study, Framingham, MA; 3 California Pacific Medical Ctr Research Institute, San Francisco, CA; 4 Laboratory of Neurogenetics, 6 Clinical Research Branch, National Institute on Aging, Bethesda, MD; 5 Dept of Pediatrics & Rady's Children's Hospital, Univ of California at San Diego, School of Medicine, La Jolla, CA; 7 Cardiovascular Health Research Unit, Dept of Medicine, 20 Dept of MP MP MP MPH H H H 3* 3 3 3 ; ; ; ; Mi Mi Mi Mich ch ch chae ae ae ael l l l A. A. A. A. N N N N S 7* ; Sa a arah G. B Bux ux uxba ba ba bau Eric A. Whitsel, MD, MPH 1,10 Al Al MD MPH 11 ; Dan E. Arking, PhD J W M 0 2 n M v Y Eric A A A. Wh Wh Wh hit i i se e el, l, l, , MD, MPH 1,10 ; Alvaro A A A Alo lo l l nso, MD, MPH 11 ; Dan E. Arking, PhD J. B Be Be B njamin n n n , MD MD MD MD, , MP MP M MPH H H H 2,13,1 4,15 ; ; ; ; Ge G G ra ra ra rald ld ld S. B Bere re rens ns ns nson o o , MD MD MD M 16 ; ; Jo sh sh sh C C C C. . Bi B B B s, s, s, P P P PhD hD hD D 7 ; W h h h hD D D 16 1 1 ; Rajat Deo o o, M MD D D 17 ; ; ; P Pa P tric ck T T. E E Ell lino or, , MD MD D MD, Ph PhD 18 8 8, 19 ; S S Sus sa s n n n n R. H H H Hec c ck k kber r rt, , M 0 ; Gera d rd do He H i iss, s s, M MD D, P PhD hD hD 1 1 1 1 ; Wen C C -Ch hi H H Hsu h eh, Ph Ph PhD D D 2 2 21 2 ; B B Brenda a dan J. J J K Keati ing, Ph PhD D 2 n F. Kerr, PhD 23 23 23 23 ; ; ; Yu Yu Yu Yun n Li Li Li Li, Ph Ph Ph PhD D D 24 24 24 24, , , , 25 25 25 ; ; ; ; Ma Ma Ma Mari ri ri r an an n C C C C. Li i i ima ma ma mach ch ch cher er r, MD MD MD MD 26 26 26 26 ; ; ; ; Yo Y Y Y ngmei Liu, M v v ven A. Lu ubi bi bi bitz t tz t , MD MD MD MD, MP MP MP MPH H H H 18 8 18 18 ; ; ; Kr Kr Kris is is isti ti tin n n D. D D D M M M Mar ar ar rci c c c an an nte te te, Ph Ph Ph PhD D D 7 7 7 7 ; ; ; ; Re Re Reen en ena a a Me Me M Mehr hr hr hra a a, MD 28 ; Y Y by guest on June 25, 2018 http://circgenetics.ahajournals.org/ Downloaded from by guest on June 25, 2018 http://circgenetics.ahajournals.org/ Downloaded from by guest on June 25, 2018 http://circgenetics.ahajournals.org/ Downloaded from by guest on June 25, 2018 http://circgenetics.ahajournals.org/ Downloaded from by guest on June 25, 2018 http://circgenetics.ahajournals.org/ Downloaded from by guest on June 25, 2018 http://circgenetics.ahajournals.org/ Downloaded from by guest on June 25, 2018 http://circgenetics.ahajournals.org/ Downloaded from by guest on June 25, 2018 http://circgenetics.ahajournals.org/ Downloaded from by guest on June 25, 2018 http://circgenetics.ahajournals.org/ Downloaded from by guest on June 25, 2018 http://circgenetics.ahajournals.org/ Downloaded from by guest on June 25, 2018 http://circgenetics.ahajournals.org/ Downloaded from by guest on June 25, 2018 http://circgenetics.ahajournals.org/ Downloaded from by guest on June 25, 2018 http://circgenetics.ahajournals.org/ Downloaded from by guest on June 25, 2018 http://circgenetics.ahajournals.org/ Downloaded from by guest on June 25, 2018 http://circgenetics.ahajournals.org/ Downloaded from by guest on June 25, 2018 http://circgenetics.ahajournals.org/ Downloaded from by guest on June 25, 2018 http://circgenetics.ahajournals.org/ Downloaded from by guest on June 25, 2018 http://circgenetics.ahajournals.org/ Downloaded from
Transcript of Novel Loci Associated with PR Interval in a Genome...

DOI: 10.1161/CIRCGENETICS.112.963991
1
Novel Loci Associated with PR Interval in a Genome-Wide Association Study
of Ten African American Cohorts
Running title: Butler et al.; genome-wide association study of PR interval
Anne M. Butler, MS1*; Xiaoyan Yin, PhD2*; Daniel S. Evans, PhD, MPH3*; Michael A. Nalls,
PhD 4*; Erin N. Smith, PhD5*; Toshiko Tanaka, PhD6*; Guo Li, MS7*; Sarah G. Buxbaum,
PhD8,9; Eric A. Whitsel, MD, MPH1,10; Alvaro Alonso, MD, MPH11; Dan E. Arking, PhD12;
Emelia J. Benjamin, MD, MPH2,13,14,15; Gerald S. Berenson, MD16; Josh C. Bis, PhD7; Wei
Chen, PhD16; Rajat Deo, MD17; Patrick T. Ellinor, MD, PhD18, 19; Susan R. Heckbert, MD,
PhD7,20; Gerardo Heiss, MD, PhD1; Wen-Chi Hsueh, PhD21; Brendan J. Keating, PhD22;
Kathleen F. Kerr, PhD23; Yun Li, PhD24, 25; Marian C. Limacher, MD26; Yongmei Liu, MD,
PhD27; Steven A. Lubitz, MD, MPH18; Kristin D. Marciante, PhD7; Reena Mehra, MD28; Yan A.
Meng, PhD29; Anne B. Newman, MD, MPH30; Christopher Newton-Cheh, MD, MPH18, 29,31;
Kari E. North, PhD1,32; Cameron D. Palmer, BSc29; Bruce M. Psaty, MD, PhD7,20,33,34,35; P.
Miguel Quibrera, MS1; Susan Redline, MD, MPH36; Alex P. Reiner, MD20; Jerome I. Rotter,
MD37; Renate B. Schnabel, MD, PhD38; Nicholas J. Schork, PhD39,40; Andrew B. Singleton,
PhD4; J. Gustav Smith, MD, PhD41; Elsayed Z. Soliman, MD, MSc, MS27; Sathanur R.
Srinivasan, PhD16; Zhu-ming Zhang, MD27; Alan B. Zonderman, PhD42; Luigi Ferrucci, PhD6**;
Sarah S. Murray, PhD39,43**; Michele K. Evans, MD6**; Nona Sotoodehnia, MD, MPH7,33**;
Jared W. Magnani, MD2,13**; Christy L. Avery, PhD1**
1Dept of Epidemiology, 10Dept of Medicine, School of Medicine, 24Dept of Genetics, 25Dept of Biostatistics, 32Carolina Ctr for Genome Sciences, Univ of North Carolina, Chapel Hill, NC; 2NHLBI’s &
BU’s Framingham Heart Study, Framingham, MA; 3California Pacific Medical Ctr Research Institute, San Francisco, CA; 4Laboratory of Neurogenetics, 6Clinical Research Branch, National Institute on
Aging, Bethesda, MD; 5Dept of Pediatrics & Rady's Children's Hospital, Univ of California at San Diego, School of Medicine, La Jolla, CA; 7Cardiovascular Health Research Unit, Dept of Medicine, 20Dept of
MPMPMPMPHHHH3*333 ; ; ; ; MiMiMiMichchchchaeaeaeaellll A.A.A.A. NNNN
S7*; Saaarah G. BBuxuxuxbabababau
Eric A. Whitsel, MD, MPH1,10 Al Al MD MPH11; Dan E. Arking, PhD
J W
M0 2
n M
v Y
Eric AAA. WhWhWhhitii seeel,l,l,, MD, MPH1,10; Alvaro AAAAlololl nso, MD, MPHHH11; Dan E. Arking, PhD
J. BBeBeB njaminnnn, MDMDMDMD, , MPMPMMPHHHH2,13,1,1,, 4,15;;;; GeGG rarararaldldld S. BBerererensnsnsnsonoo , MDMDMDM 16;; Joshshsh CCCC. . BiBBB s,s,s, PPPPhDhDhDD7; W
hhhhDDD1611 ; Rajat Deooo, MMDDD17;;; PPaP tricck TT. EEElllinoor,, MDMDDMD, PhPhD1888, 19; SSSussas nnn n R. HHHHeccckkkberrrt,, M0; Gera drddo HeH iiss,ss, MMDD, PPhDhDhD1111; Wen CC-Chhi HHHsu heh, PhPhPhDDD22212 ; BBBrendaadan J.JJ KKeatiing, PhPhDD2
n F. Kerr, PhD23232323;;; YuYuYuYunn LiLiLiLi, PhPhPhPhDDD24242424,,, , 252525;;;; MaMaMaMariririr anann CCCC. Liiiimamamamachchchchererr, MDMDMDMD26262626;;;; YoYYY ngmei Liu, M
vvven A. Luubibibibitzttzt , MDMDMDMD, MPMPMPMPHHHH1881818;;; KrKrKrisisisistititin nn D.DDD MMMMarararrciccc ananntetete, PhPhPhPhDDD7777;;; ; ReReReenenena aa MeMeMMehrhrhrhraaa, MD28; YY
by guest on June 25, 2018http://circgenetics.ahajournals.org/
Dow
nloaded from
by guest on June 25, 2018http://circgenetics.ahajournals.org/
Dow
nloaded from
by guest on June 25, 2018http://circgenetics.ahajournals.org/
Dow
nloaded from
by guest on June 25, 2018http://circgenetics.ahajournals.org/
Dow
nloaded from
by guest on June 25, 2018http://circgenetics.ahajournals.org/
Dow
nloaded from
by guest on June 25, 2018http://circgenetics.ahajournals.org/
Dow
nloaded from
by guest on June 25, 2018http://circgenetics.ahajournals.org/
Dow
nloaded from
by guest on June 25, 2018http://circgenetics.ahajournals.org/
Dow
nloaded from
by guest on June 25, 2018http://circgenetics.ahajournals.org/
Dow
nloaded from
by guest on June 25, 2018http://circgenetics.ahajournals.org/
Dow
nloaded from
by guest on June 25, 2018http://circgenetics.ahajournals.org/
Dow
nloaded from
by guest on June 25, 2018http://circgenetics.ahajournals.org/
Dow
nloaded from
by guest on June 25, 2018http://circgenetics.ahajournals.org/
Dow
nloaded from
by guest on June 25, 2018http://circgenetics.ahajournals.org/
Dow
nloaded from
by guest on June 25, 2018http://circgenetics.ahajournals.org/
Dow
nloaded from
by guest on June 25, 2018http://circgenetics.ahajournals.org/
Dow
nloaded from
by guest on June 25, 2018http://circgenetics.ahajournals.org/
Dow
nloaded from
by guest on June 25, 2018http://circgenetics.ahajournals.org/
Dow
nloaded from
DOI: 10.1161/CIRCGENETICS.112.963991
2
Epidemiology, 23Dept of Biostatistics, 33Dept of Medicine, 34Dept of Health Services, Univ of Washington, Seattle, WA; 8Jackson Heart Study, 9School of Health Sciences, Jackson State Univ,
Jackson, MS; 11Division of Epidemiology & Community Health, Univ of Minnesota, Minneapolis, MN; 12McKusick-Nathans Institute of Genetic Medicine, Johns Hopkins Univ School of Medicine, Baltimore, MD; 13Section of Cardiovascular Medicine, Boston Univ School of Medicine; 14Dept of Epidemiology,
15Section of Preventive Medicine, Boston Univ, Boston, MA; 16Dept of Epidemiology, Tulane Univ, New Orleans, LA; 17Division of Cardiovascular Medicine, Univ of Pennsylvania, Philadelphia, PA;
18Cardiovascular Research Ctr, MGH & Harvard Medical School, Charlestown; 19Cardiac Arrhythmia Service, 31Ctr for Human Genetic Research, MGH & Harvard Medical School, Boston, MA; 21Dept of
Medicine, Univ of California, San Francisco, CA; 22Dept of Pediatrics, Univ of Pennsylvania, Philadelphia, PA; 26Division of Cardiovascular Medicine, Univ of Florida College of Medicine,
Gainesville, FL; 27Dept of Epidemiology & Prevention, Wake Forest Univ, Winston-Salem, NC; 28Deptof Medicine, Case Western School of Medicine, Cleveland, OH; 29Program for Medical & Population
Genetics, Broad Institute of Harvard & MIT, Cambridge, MA; 30Dept of Epidemiology, Univ of Pittsburgh, Pittsburgh, PA; 35Group Health Research Institute, Group Health Cooperative, Seattle, WA;
36Dept of Medicine, Division of Sleep Medicine, Brigham & Women's Hospital, Harvard Medical School, Boston, MA; 37Medical Genetics Institute, Cedars-Sinai Medical Center, Los Angeles, CA; 38UnivMedical Ctr Hamburg, Clinic for General & Interventional Cardiology, Hamburg, Germany, 39The
Scripps Translational Science Institute; 40The Scripps Research Institute, La Jolla, CA;41Dept of Cardiology, Faculty of Medicine, Lund Univ, Lund, Sweden; 42Laboratory of Personality & Cognition,
National Institute on Aging, NIH, Baltimore MD; 43Scripps Health, La Jolla, CA *joint first authors / **joint senior authors
Correspondence:
Anne M. Butler
Department of Epidemiology
University of North Carolina
137 E Franklin St., Suite 306
Chapel Hill, NC 27514
Tel: 919-966-4312
Fax: 919-966-9800
E-mail: [email protected]
Journal Subject Codes: [8] Epidemiology; [171] Electrocardiology
ital, Harvard Medical lll S LoLoLoLossss AnAnAnAngegegegeleleleles,s,s,s, CCCCA;A;A;A; 38383838UnUnUnU
Hambubububurgrgrgrg,,,, GeGeGeGermrmrmrmanananany,y,y,y, 39TTTTe, La JJJJolololllalalala, , , , CACACACA;;;;41DeDeDeDeptpp o
y, Faculty of Medicine Lund Univ, Lund, Sweden; Laboratory of Personality & Cogn
n
y, Faculty yy of Medicine, Lund Univ, Lund, Sweden; Laboratoryy of Personality & CognNaNaNatititioon llal IInsnsnstitutuuttte on Aging, NIH, Baltimoreee MMD; 43Scrippppss Heealalalth, La Jolla, CA
****jojojjoinininnt t fififirsrsrst t tt aaaa**** uttutthohohoh rsss //// **** jooinnt seeeninininiorororor a* ututututhohohorsrsrs a
ndddence:
by guest on June 25, 2018http://circgenetics.ahajournals.org/
Dow
nloaded from

DOI: 10.1161/CIRCGENETICS.112.963991
3
Abstract:
Background - The PR interval (PR) as measured by the resting, standard 12-lead
electrocardiogram (ECG) reflects the duration of atrial/atrioventricular nodal depolarization.
Substantial evidence exists for a genetic contribution to PR, including genome-wide association
studies that have identified common genetic variants at nine loci influencing PR in populations
of European and Asian descent. However, few studies have examined loci associated with PR in
African Americans.
Methods and Results - We present results from the largest genome-wide association study to
date of PR in 13,415 adults of African descent from ten cohorts. We tested for association
between PR (ms) and approximately 2.8 million genotyped and imputed single nucleotide
polymorphisms. Imputation was performed using HapMap 2 YRI and CEU panels. Study-
specific results, adjusted for global ancestry and clinical correlates of PR, were meta-analyzed
using the inverse variance method. Variation in genome-wide test statistic distributions was
noted within studies (lambda range: 0.9–1.1), although not after genomic control correction was
applied to the overall meta-analysis (lambda: 1.008). In addition to generalizing previously
reported associations with MEIS1, SCN5A, ARHGAP24, CAV1, and TBX5 to African American
populations at the genome-wide significance level (P<5.0x10⁻⁸), we also identified a novel locus:
ITGA9, located in a region previously implicated in SCN5A expression. The 3p21 region
harboring SCN5A also contained two additional independent secondary signals influencing PR
(P<5.0x10⁻⁸).
Conclusions - This study demonstrates the ability to map novel loci in African Americans as
well as the generalizability of loci associated with PR across populations of African, European
and Asian descent.
Key words: electrocardiography; epidemiology; GWAS; single nucleotide polymorphism genetics; PR interval
eeeedddd sisisisingngngnglelelele nnnnucucucucleleleleooootidididide
CEU U U papapapanenenenelslslsls.... StStStStududududy-yy
z
n s
n
h y
s r
s g g ( ),
ultsss, adadaddjujujujusttststedeee fofofof r global ancestry and clininininicical correlates offf PPPPR, were meta-analyz
nvverrrse variancece mmettethohohoh ddd.d VVVarrriaiaiai tititionoon in n ggenoomme--wiwwiw dededed test t sttstatatatisssticc dididid ststriririribububub ttitit onoonsss wwaw s
n ssstututudies (l(l(l(lamama bda raaangeee: 0.00 9–––1.11 1)1)1)1 , allllthhouughh nnnoot aaftter ggenommmiccc cconoo trrrolololol cororrreccctiion
he overall meta-a-a-anananalysysysisisis ((laaambdadd : 1.000008)8)8). In aaddddititi ioion toto ggggenennerererala izing previously
sociations with MEMEME SISIS1,11, SSSCNCNCNCN5AA5A,, ARARARHGHGHGH APAPA 242424,, CAAVV1,, anddd d TBTBTBX5XX5 to African Amer
s atat tthehehe ggenenomome-e wiwiwidededed ssigigigi nininifififificacancncee lelelevevellll ((((PPPP((( <5<5<5<5.0.0.0x1x1x11000-8-8-88)))),, wewe aalslslsoo idididdenentititiiffffieieiedddffffff aa nnovovelelelddd
by guest on June 25, 2018http://circgenetics.ahajournals.org/
Dow
nloaded from

DOI: 10.1161/CIRCGENETICS.112.963991
4
Introduction
The PR interval (PR) is an electrocardiographic measurement of atrial conduction spanning the
onset of sinus depolarization through the atrioventricular node. PR is a predictor of incident atrial
fibrillation,1 a common cardiac arrhythmia,2 and a potent risk factor for pacemaker implantation,
heart failure, stroke, and all-cause mortality.1, 3 Substantial evidence exists for a genetic
contribution to PR. Family-based studies have estimated the heritability of PR at approximately
34%4, 5 and rare sodium channel mutations associated with atrial cardiac conduction defects have
been characterized.6, 7 Recent genome-wide association (GWA) studies performed in populations
of European and Asian descent have identified common polymorphisms at nine loci that are
associated with variation in PR.5, 8-11 For example, ARHGAP24, CAV1, SCN10A, and TBX5 have
been reported in at least two PR GWA studies.
To date, the majority of GWA studies examining PR were performed in populations of
European or Asian descent. The exception is a report by Smith and colleagues (2011),12 which
generalized four previously described PR loci identified in European and Asian populations
(SCN5A, SCN10A, MEIS1, and TBX5) to 6,247 African American participants from four cohorts.
However, Smith and colleagues neither detected novel associations nor identified genome-wide
significant associations with several previously replicated loci, including ARHGAP24, CAV1 and
WNT11.9, 10 It is therefore unclear whether these loci are relevant in African Americans.
Additionally, the increased genetic diversity in populations of African descent provides
opportunities for the identification of novel variants influencing PR. Epidemiologic studies have
also reported that PR is longer in individuals of African compared to European ancestry,13, 14
which provides additional motivation for GWA studies of PR in populations of African descent.
To further characterize genetic determinants of PR in populations of African descent, we
s performed in popopoppuluuu
ms atttt niinii e lolll ciiii thttthatatatat aaara
w 5 8 11 5
t
d s
o h
d fo r pre io sl described PR loci identified in E ropean and Asian pop lation
with h h h vavavaririririatatatioioioion n inininin PR.5, 8-11 For example, ARARARHGAP24, CAV1V1V1,,, SCN10A, and TBX5
teed iiin at least twtwwo PRPRPRR GWWWWA stststudududiees.
date, ttthehehehe mmmajororititity y ofofff GGGWAWAWA ststststudieeesss exexexexamaminiiiniining PRPRPRPR wweree ppppererffoforrmedededed iiin poopupulallatititionons
or Asian descent. ThThThT e exceptptption iiisi a reppport bbbby yy Smiitii h and ddd colllllllleagugg es ((2011),),12 wh
d ffo ii lsl dde iribbedd PRPR llo ici iiddentififiiedd iin EE dd AAsiia lla iti by guest on June 25, 2018http://circgenetics.ahajournals.org/
Dow
nloaded from

DOI: 10.1161/CIRCGENETICS.112.963991
5
extended the earlier efforts of Smith et al.12 by including GWA study data from six additional
African American cohorts (7,168 additional participants). These results were meta-analyzed with
those previously reported by Smith et al. to provide the largest GWA study of PR to date in
populations of African ancestry.
Results
We performed a GWA analysis of PR in 13,415 adults of African descent from ten cohorts,
including three studies from the Continental Origins and Genetic Epidemiology Network
(COGENT)15 and four studies from the Candidate-gene Association Resource (CARe)
consortia.16 Four of the ten studies were included in the earlier study by Smith et al.:12 the
Atherosclerosis Risk in Communities (ARIC) Study, the Cleveland Family Study (CFS), the
Jackson Heart Study (JHS), and the Multi-Ethnic Study of Atherosclerosis (MESA). Variation in
study size was noted across cohorts (range: 191 – 4,149 participants) and the largest contributing
study was composed entirely of females (Table 1). Across studies, participants were
predominantly female (72%), middle-aged (overall mean age: 58 years), obese (overall mean
body mass index (BMI): 31 kg/m2) and pre-hypertensive (overall mean systolic blood pressure
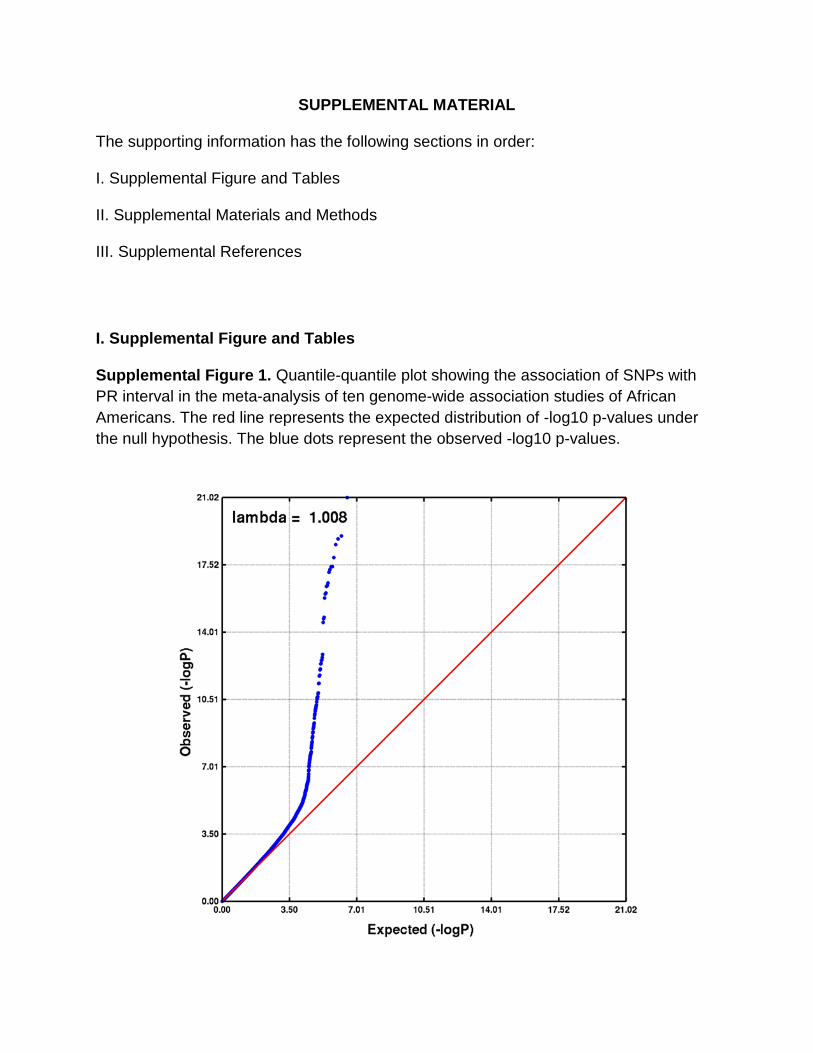
(SBP): 130 mmHg). Modest evidence of test statistic inflation was noted for the family-based
CFS
-analysis after genomic control was applied
1.008) (Supplemental Figure 1). A total of 2.8 million genotyped and imputed autosomal SNPs
were available for analysis after applying genotyping and imputation quality control measures
(Supplemental Table 1).
In the meta-analysis, 90 SNPs at six loci were associated with PR at the genome-wide
significance threshold of P < 5.0 x 10⁻⁸ after applying genomic control (Figure 1, Table 2). The
Resouuuurcrcrcrce e e e (C(C(C(CARARARARe)e)e)e)
12121212Four of the ten studies were included in the earlier study by Smith et al : the
rosis Risk in Communities (ARIC) Study, the Cleveland Family Study (CFS), th
e t
w b
c
Four of the ten studies were included in the earlier study byyy Smith et al.: the
rooosiiiis Risk in CoCoCommmmmmunununititititieieieies ss (A(A(AARIRIRIRIC)C SSSStuudyy, tthe e ClClCleveveve elllanana d dd FaFaFamimm lylylyy SSSStututuudydydydy ((((CFCFCCFS)S)S)S),,, th
earttt SSSStututuudydyy ((((JHJJJ S)S)), ,,, annanddd d the eee MuMuMuultltltl i-EtEtEtE hnnhnhnicicici SSStuuutudydyy oofff AAtAA heheherororoscscscscleeroooosiiissss (M(M((MESESESESAAA).... Vaaaaririat
was noted acrossssssss cococoohohohoh rtrtrtrtssss (r(rranananangegegee:::: 19191991111 –– 4,4,4,4 14141449999 ppartrtrtrticicicipipipipananaa tststss) ) ) ) ananannd d d thththheeee largest contrib
compposeddd eeentnntiririrrelelelely y ofofofof fffemememalalaleseses (((TaTaTablblblle ee 1)1)1). AcAcAcAcrorrosssss ssstutuudidididiess,, pappartrtrticicicicipipippaaantntntntsss wewwere
by guest on June 25, 2018http://circgenetics.ahajournals.org/
Dow
nloaded from

DOI: 10.1161/CIRCGENETICS.112.963991
6
strongest primary PR signal (P = 5.26 x 10-43, primary signals defined as the locus-specific SNP
with the lowest P-value), was observed for rs3922844 in SCN5A (effect allele frequency (AF) =
0.58), and corresponded to a 4.5 ms decrease in PR per copy of the C allele (Figure 2c). We also
identified two independent secondary signals at SCN5A/10A, a region characterized by low
patterns of linkage disequilibrium (LD) and multiple recombination peaks (Figure 2C); one in
SCN5A and a second in SCN10A, which was located 14.3 kb downstream of the SCN5A primary
signal (Table 2, secondary signals defined as the locus-specific SNP with the lowest genome-
wide significant P-value after conditioning on primary signals and successive secondary signals).
Estimates for the eight signals (six primary; two secondary) were generally consistent across
cohorts (Supplemental Table 2), and there was little evidence of among-study heterogeneity
(Cochran’s Q P 0.05). The primary signals also were robust to adjustment for local ancestry
(Supplemental Table 3).
Five of the loci associated with PR were previously identified in populations of European
and Asian descent: SCN5A/SCN10A, MEIS1, ARHGAP24, CAV1, and TBX5. Of note,
SCN5A/SCN10A, MEIS1, and TBX5 were also reported by the earlier PR GWA study of African
Americans.12 The novel locus, ITGA9, was located on chromosome 3, greater than one Mb
upstream from the primary SCN5A signal. Several genes resided nearby ITGA9, although only
ITGA9 and C3orf35 harbored SNPs in strong to moderate LD with rs267567.
None of the primary or secondary signals reported here were the same as the index SNPs
reported in populations of European or Asian ancestry. Although we identified both a primary
and secondary SCN5A signal for PR, only one study of European ancestral populations identified
SCN5A,10 and this study reported an index SNP (rs11708996) that was monomorphic in HapMap
YRI. The SCN10A SNP that we identified (rs6801957) was in low LD with both previously
ccessive secondaryryyy ssssig
erally consiiii tttstent acacaccrrror s
u y
s
n
e r
descent: SCN5A/SCN10A MEIS1 ARHGAP24 CAV1 and TBX5B Of note
uppllplplemememenenentatatallll Taaablbbb e 2), and there was little ee evvidence of amonnngggg-study heterogeneity
QQQQ PPPP 0.05). ThThThe prprriimi ararara y siiiignggnaaalss alsosso werere rorobububustt tooo aadjustttmeeennnt forrrr llllocccaaal ancnnces
ntal TaTaTaTablblblbleee 3).
e of the loci associiiated dd iiwithhhh PPRR R were pppreviiiously yy idididi en iitifififiiedddd iiiin popp pupp lations of Eur
dedd t: SSCNCN5A5A//SCSCN1N10A0A MEMEISIS11 AARHRHGAGAPP2424 CACAV1V1 dd TBTBX5X5BB OfOf ot by guest on June 25, 2018http://circgenetics.ahajournals.org/
Dow
nloaded from

DOI: 10.1161/CIRCGENETICS.112.963991
7
identified SCN10A variants (rs6800541 and rs6795970 (r2 < 0.10, HapMap YRI)), which were
reported in European ancestral populations. The MEIS1 index SNP rs3891585 was in moderate
LD with the previously described variant rs11897119 (r2 = 0.62, HapMap YRI). Of the two
index SNPs reported for ARHGAP24 in populations of European descent, rs7692808 was in high
LD (r2 = 0.94, HapMap YRI) and rs7660702 was in low LD (r2 = 0.22, HapMap YRI) with our
ARHGAP24 primary signal. Both studies that previously identified CAV1 as a PR-associated
locus reported the rs3807989 variant; this SNP was in very high LD with the primary CAV1 SNP
presented herein (r2 = 1.0, HapMap YRI). Finally, both GWA studies of PR that identified TBX5
reported the variant rs1895582, which also was in high LD with our TBX5 primary signal,
rs1895585 (r2 = 0.84, HapMap YRI).
We identified six loci associated with PR in populations of African descent, yet we were
unable to confirm associations at genome-wide significance thresholds for three PR loci that
were previously identified in individuals of European descent: NKX2-5, WNT11, and SOX5.8
Although the previously reported chromosome 5 and 11 loci had high minor allele frequencies
(MAF) across contributing studies, consistent directions of effect, and little evidence of
heterogeneity, neither previously reported index SNP was associated with PR (P > 0.01) (Table
3). Of note, all SNPs residing within a 1 Mb region of these loci had P-values that exceeded
0.0009 (results not shown). Data for the previously reported SOX5 index SNP were only
available in six contributing studies and the mean estimated MAF was 0.03. The SOX5 locus also
was monomorphic in the HapMap YRI population and all P-values within 1 Mb of this locus
exceeded 0.0002 (results not shown).
Discussion
This GWA study and meta-analysis of ten cohorts represents the largest effort in populations of
of PR that identifiiiiedededed
BX5 prpp imiii ary siiiigngngnalalalal,
( 2
o a
o 5
he pre io sl reported chromosome 5 and 11 loci had high minor allele freq enc
(r2 === 000.88884,44, HHHHappapMaMMM p YRI).
idddeeene tified six loooci assssocicciciaatedddd wwiiithh PRRR in popopuulalalatititionns off Affrf iiicananan descececec nttt, yyet wwwe
onfirm mmm asasasa sociii tatatiiioionsns tatatt gggennnomomomome-widididde sisisis gnnnifififiicicannncececece ttthrhhrhressshohohoholdldldl ss foff r ththththrereree PRPRPR llllocociii thththa
ously yy identified iiiin iiini ddidi iividudd als offff EEuropppean ddded scent: NKNNKX2X2X2X2-555,,, WNWWNT1TT 1, ,, and SOX5
hehh ii lsl rt ded hhr 55 dd 1111 ll ii hhadd hihi hgh imi lalllelle ff by guest on June 25, 2018http://circgenetics.ahajournals.org/
Dow
nloaded from
DOI: 10.1161/CIRCGENETICS.112.963991
8
African descent to identify genetic determinants of PR. By building on recent work from the
CARe consortium,12 we identify three additional loci associated with PR in African ancestral
populations; ARHGAP24, CAV1, and ITGA9. The ITGA9 locus represents a novel finding,
having not been identified in any prior GWA studies of PR to date.
ITGA9 is located approximately 1.1 Mb upstream from SCN5A and encodes an alpha
integrin, an integral membrane glycoprotein that mediates diverse functions including cell–cell
and cell–matrix adhesion, proliferation, and apoptosis.17, 18 ITGA9 also has been associated with
hypertension19 and several cancers.20-22 Although, ITGA9 has not been previously implicated in
atrioventricular conduction, the extended 3p22-24 region has been shown to harbor variants
affecting SCN5A expression. It is therefore possible that ITGA9 marks a distal SCN5A regulatory
element.23, 24 Interestingly, pathway analysis suggests a role for ITGA9 in cation binding,
hypertrophic cardiomyopathy, and dilated cardiomyopathy.25 Expression QTL studies also have
associated variation in ITGA9 with cis expression data from monocytes26 and lymphoblastoid
cell lines.27 However, the transferability of associations to cardiac myocyte and conduction tissue
warrants further investigation.
In addition to identifying ITGA9 as a potential cis-regulator of SCN5A, we also reported
three independent SNPs influencing PR at the 3p21 locus. The 3p21 locus harbors both SCN5A
and SCN10A, which encode integral membrane proteins and tetrodotoxin-resistant voltage-gated
sodium channel subunits. The NAv1.5 sodium channel alpha-subunit (encoded by SCN5A) is the
predominant alpha-subunit expressed in cardiac muscle, and is responsible for the initial
upstroke of the action potential in an ECG.28 SCN5A mutations are associated with Brugada
syndrome, long-QT syndrome, dilated cardiomyopathy, cardiac conduction disease, idiopathic
ventricular fibrillation and atrial fibrillation28 and have been identified in GWA studies of the
n previously impliccccataaa e
own tottt hhhharbobbb r variriririanananant
C u
2
i
v o
Ho e er the transferabilit of associations to cardiac m oc te and cond ction
CN5N5N5A AA exexexprprpresee sisisioono . It is therefore possibleeee ttthah t ITGA9 markkksss a distal SCN5A regu
24444 Innnterestinglyy, patthhwhwh ayayyy analalala yysiiis sugggggestts a roroleee foor ITIITGA9 innnn cccatioon nnn bibibindndddingg,,
ic carrrdidididiomomomo yoopapaththththy, aandn dddilililatatatated cararardddid omomomo yoyoyopapathththyyyy.2525255 EEEExppprerereressssiioionn QTQTQTQTL LL stududdiieiess allalsoso
variation in ITGAGAGAGA9 99 withhhh cis exprpp ession ddddata frfff om monocyty es262626 a dnddd lymyy php oblasto
HH hth tr fsf babililiit fof iia iti to didi te dnd dd ctiio by guest on June 25, 2018http://circgenetics.ahajournals.org/
Dow
nloaded from

DOI: 10.1161/CIRCGENETICS.112.963991
9
QT29, 30 and QRS intervals31 in populations of European descent.
The NAv1.8 sodium channel alpha-subunit (encoded by SCN10A) is characterized by a
long-duration action potential and preservation of excitability during rapid and sustained
stimulation.32 Seven variants at 3p21 have been previously reported,8, 10, 12 and by extending the
work of Smith et al.,12 we detected an additional independent signal at genome-wide significance
levels. The presence of numerous independent signals at the 3p21 region in African Americans
was previously reported by a SCN5A candidate gene study in approximately 3,000 JHS
participants, who also contributed to this analysis.33 By including nine additional studies, we
validate the previous work by Jeff and colleagues at genome-wide significance levels and
identify a neighboring genome-wide significant signal in SCN10A. The ability to identify
multiple SCN5A/SCN10A signals may in part be attributable to the greater nucleotide diversity
and lower LD in African populations, as 3p21 is characterized by low LD and high
recombination.
In addition to SCN5A, we generalized four additional PR loci to populations of African
ancestry: ARHGAP24, MEIS1, TBX5, and CAV1, the latter of which was also detected by a
GWA study of atrial fibrillation.34 Yet, the importance of NKX2-5, WNT11, and SOX5 in the
genetic architecture of PR in African Americans is less clear. Although the “winner’s curse” and
inflated genetic effect estimates from initial discovery35 may help explain the inconsistent
results, another possibility is that our study was underpowered to detect these loci, especially for
the SOX5 locus. In addition, our analysis was conducted in populations that were predominantly
female, obese and pre-hypertensive. The degree to which these characteristics influenced the
results presented herein remains unclear.
Several limitations of the present study warrant further consideration in order to inform
additional studiessss,,,, w
nificance lelll velllls annnnd ddd
n
C
L
addition to SCN5A e generali ed fo r additional PR loci to pop lations of Afri
neighghghghbobobooriririringngng genenenomoo e-wide significant siggggnnnal in SCN10A. Thhhhee e ability to identify
CN5N5N55A/SCN10AAA55 sssignnaaala s mamamam y inininin paraart beee aattrribbutaablblble e e e too tthehhe greeaaaterere nucllelel oootiiide diiiivver
LD iiiin nn AfAfAfAfririrican n popopopupupullalatitt ons,ss, aaaas 3p2121212 iiiis sss hchchhararacacteeeriiririzezezedddd bybbyy llllowow LLLLD DDD anananand dd hhhih ghghh
ion.
ddddiitiio to SCSCN5N5AA lalii ded ffo ddddiitiio ll PRPR llo ici to llatiio ff AfAf iri by guest on June 25, 2018http://circgenetics.ahajournals.org/
Dow
nloaded from
DOI: 10.1161/CIRCGENETICS.112.963991
10
future efforts examining the genetic architecture of PR. The first is study heterogeneity, a
common limitation of meta-analyses. In our meta-analysis, studies used common measurement
protocols for determining PR and its clinical correlates. In addition, statistical assessments of
heterogeneity did not suggest large variation in SNP effects across studies. Another limitation is
confounding, either from cryptic population stratification or unmeasured PR risk factors. For
example, one potential confounder we were unable to consider was atrial size, given widespread
unavailability of echocardiographs. However, we adjusted for BMI, height, and systolic blood
pressure, the major contributors to left atrial size. Regarding the potential for bias from
population substructure, we adjusted for principal components in study-specific regression
models and applied genomic control. These approaches are standard in GWA studies, yet the
potential for residual confounding to produce either false-negative or false-positive results
remains challenging to determine on a genome-wide level. Finally, we were unable to
independently replicate the association with ITGA9 in an independent population given
difficulties identifying additional studies of African American participants with ECG measures,
extant genotype data, and overlapping analytical timelines. Although results from other ancestral
population could provide confirmatory evidence of the association between PR and ITGA9,
failure to replicate could simply reflect allelic heterogeneity.
In summary, our results suggest that polymorphisms from six loci on five chromosomes
are associated with PR in African Americans, including a novel signal in ITGA9 that may
function as a distal SCN5A regulatory element. Our expanded meta-analysis also demonstrates
the ability to map novel genes in African Americans and the generalizability of genetic variants
associated with PR across global populations. Future work to refine these signals is clearly
warranted, including additional examination of the extended chromosome 3p region that harbors
tial for bias from ff
y-speciiiifififific regressisisisiooono
d h
o
a
n
identif ing additional st dies of African American participants ith ECG meas
d apppppplllieieieied ddd gegegenononomimmm c control. These approacacachehes are standard iiin n n GWA studies, yet th
or reeeesidual confofofounndiiiing ttttoo o prodododo uuucee eiiithher faalsee-n-nnneegee aativvvee or faaalsses ---posisisisititiitiveee rrresululullts
allengggininininggg g ttto ddd teteterermimiinene on aaaa ggenomememe-wiwiwiwideddde llleevelelel. FiFFiFinnan lllly,yy wee wwereeee uuunnnablllee ttoto
ntly yy replp icate the associiiatioii n withhhh ITITGAGAGAG 99 9 iiini an indeddd pepp ndddent popp pupp llall tion gggiven
iiddentifif ii ddddiitiio ll st ddiie fof AAffriic AAm iic iti ici nt ii hth ECECGG by guest on June 25, 2018http://circgenetics.ahajournals.org/
Dow
nloaded from

DOI: 10.1161/CIRCGENETICS.112.963991
11
SCN5A, SCN10A and ITGA9. GWA studies in other admixed populations, as well as fine-
mapping efforts, would be especially useful for further characterization loci identified herein, as
well as the identification of new genes influencing atrial arrhythmogenesis.
Materials and Methods
Study populations
A meta-analysis of ten studies was performed to investigate the genetic determinants of PR.
Three cohorts were from COGENT including the Health, Aging, and Body Composition Study
(Health ABC n=1,054), the Healthy Aging in Neighborhoods of Diversity across the Life Span
Study (HANDLS, n=945), and the Women’s Health Initiative (WHI, n=4,149), and four cohorts
were available from the CARe consortium, including the ARIC study (n=2,391), the CFS
(n=267), the JHS (n=1,962), and MESA (n=1,627). The Baltimore Longitudinal Study of Aging
(BLSA, n=155), the Bogalusa Heart Study (BHS, n=191), and the Cardiovascular Health Study
(CHS, n=674) were the remaining contributing studies. Additional information on the
participating studies is provided in the Supplementary Material. All studies were approved by
local ethics committees and all participants provided written informed consent.
PR interval measurement
For each study, certified technicians digitally recorded resting, supine (or semi-recumbent),
standard twelve-lead ECGs using comparable procedures for preparing participants, placing
electrodes, recording, transmitting, processing and controlling quality (Supplemental Table 4).
Participants with the following characteristics were excluded: poor quality ECG, extreme PR
(320 ms 80 ms), documented history of atrial fibrillation/flutter, heart failure, myocardial
infarction, pacemakers antedating ECG assessment, Wolff-Parkinson-White syndrome, and
second/third degree heart block.
rsity acacacacrorororossssssss tttthehehehe LLLLiffffeeee SSSS
NDLS, n 945), and the Women s Health Initiative (WHI, n 4,149), and four co
a
A
155), the Bogalusa Heart Study (BHS, n=191), and the Cardiovascular Health S
7
NDLS,,, n 945),),, and the Women s Health Initiative (WHI, n 4,149), and four co
abbbbleleee from thhhe CACACACAReReeRe ccconnonnsssororortititiiumumumm,, ininclclcllududuu ingg the e ARARARARICCICIC stttudududdyyy (((n=2,2,22,39393391)1)1)1), ,, thththhe e e CFCFCFFSSS
e JHJHJHJHSSS (((n=n==1,1,11,9662)2)2),,, ananannd MEMEMEM SASASAA (((n===1,1,1,626262627)7)7). ThThThee BaBBaB ltltltltimmmorooreeee LoLoLL ngngngngitttududududinnalalalal Stutututudydydy off A
155), the Bogalalalalususuusaa a a HeHeHearararartt StStStStudududu y y y y ((B(B(BHSHSHSHS, , n=n=n=n 19199191)11 , anananand ddd ththththe e CaCaCaC rdrdrddioioiovavavavascscscs ular Health S
7774))) were ththththeee rereemammainininnininining g g ccoc ntntntriririr bububuutititit ngngg ssstutuudidididiesess. AdAdAdddididid tititionononalalal iiiinfnfnfn ororormamamatitititiononn ooonn the
by guest on June 25, 2018http://circgenetics.ahajournals.org/
Dow
nloaded from

DOI: 10.1161/CIRCGENETICS.112.963991
12
Genotype arrays and imputation
Genome-wide SNP genotyping was performed within each cohort using the Affymetrix or
Illumina genotyping arrays (Supplemental Table 1). First -degree relatives were excluded in all
studies except the family-based CFS and JHS. SNPs were excluded for genotyping call rate
thresholds between <95% and <99% and MAF 1%, the determination of which was study-
specific.
Imputation was performed for ~2.5 million autosomal SNPs based on a 1:1 ratio of the
HapMap Phase 2 CEU and YRI populations (Supplemental Table 1). SNPs with imputation
quality< 0.3 or inconsistent allele designations as per HapMap forward strands were excluded. In
addition, SNPs not seen in > 2 studies were excluded from the meta-analyses. After exclusions,
2,845,108 genotyped and imputed SNPs were available.
Statistical analysis
Each study, with the exception of CFS, performed GWA analysis for PR across approximately
2.5 million SNPs based on linear regression under an additive genetic model. The family-based
CFS study was analyzed using linear mixed-effects models as implemented in the R GWAF
package.36 Specifically, the within pedigree random genetic effects were modeled using a kinship
coefficient matrix, with each family having a different covariance pattern. The full N x N kinship
variance covariance matrix was generated using the R kinship function within the GWAF
software package, according to the algorithm of K. Lange.37 Although the JHS has a limited
number of related participants, extensive analyses suggested that results from linear regression or
linear mixed effects models were concordant.15 Therefore, JHS results are based on linear
regression models unadjusted for family structure.
The association of each SNP with PR was adjusted for age, sex, height, BMI, systolic
SNPs with imputaaaatitititionooo
d strandddds were excccclulululud
N i
g
a
, a
SNPs based on linear regression nder an additi e genetic model The famil b
NPsss nnotottot sseeeeeen inininn > 2 studies were excluddedededed from the meta-anananalyses. After exclusi
geeeenooootyped andd d immpupuuttted d SNSNSNSNPssss wereere avvvaailaable.
anallllysssisisisis
, with the exceppp itiiion of ff CFCFCFC S,S,SS pepp rfffformed ddd GWGWGWAAA analllysyy iiisi fffof r PRPRPR across apppprpp oxima
SNSNPPs bb ded lili iio dde ddddiitii iti ddell ThTh ffa imill bb by guest on June 25, 2018http://circgenetics.ahajournals.org/
Dow
nloaded from
DOI: 10.1161/CIRCGENETICS.112.963991
13
blood pressure, RR interval, and study site, when appropriate, to maintain consistency with
Smith et al.12 All studies included principal components in linear models to adjust for variation in
global ancestry (Supplemental Table 1).38 Genotyped data were substituted for imputed data,
when available. Individual study results were corrected by their respective genomic inflation
;39 genomic inflation factors > 1 may indicate sample duplications, unknown or poorly
specified familial relationships, a poorly calibrated test statistic, systematic technical bias, or
gross population stratification.40
A fixed effects inverse variance meta-analysis was performed to combine beta
coefficients and standard errors from study-level regression results for each SNP. Primary
signals were defined as the locus-specific SNP with the lowest genome-wide significant P-value
(P < 5 x 10⁻⁸). Between-study heterogeneity of results was assessed by Cochran’s Q statistic.
Meta-analyses were implemented in the software METAL41 and were confirmed by an
independent analyst.
A two-stage strategy was used to identify secondary signals. First, LD pruning was
performed using PLINK, whereby independent signals were defined as at least two genome-wide
significant SNPs in low LD (r2 < 0.20) in the same 1 Mb region. Next, each study performed a
conditional analysis by adjusting for the most strongly associated SNP(s) at each locus with at
least two bins, restricting to SNPs with P-values < 5.0 x 10⁻⁸. SNPs outside 1 Mb of the primary
signal were not considered in conditional analyses because no loci exhibited LD patterns that
extended beyond 1 Mb, and because conditioning on potential mediators may induce bias, the
direction and magnitude of which are difficult to predict.42 Results for secondary signals were
presented after conditional adjustment that adjusted for locus-specific primary signals.
Additional iterations adjusting for subsequent secondary signals as well as the primary signal
to combine beta
r each hhh SNSNSNSNP.PPP PPPPriiiimaaaaryryryry
r
i
y
n
o stage strateg as sed to identif secondar signals First LD pr ning as
re ddddefefefe inininnedededed aaasss thhheee locus-specific SNP with hhh ththe lowest genomememee-wide significant P-
-8888). Between-sstuuudyy hhheh terororor genenneityyy of rrreesulltss wwasas aaaasssss esseed by Cococochrannnn’s’’s’ QQQ staaatiiisi ti
yses wwwerererereee e iiimplpllememenentteted dd in ttthehehehe sofffftwttwtwarararareee MEMEMEM TATATAT LLLL41414141 ananand wewewewerere ccoonfifififirmrmrmrmed bbby anan
nt analysyy t.
st st te dd to iiddentifif dnd isi lal FiFi t LDLD ini by guest on June 25, 2018http://circgenetics.ahajournals.org/
Dow
nloaded from

DOI: 10.1161/CIRCGENETICS.112.963991
14
were performed in the WHI, HABC, HANDLS, and CHS cohorts (n=5,768, 43% of sample size)
until no genome-wide significant associations remained.
As a sensitivity analysis, we assessed the impact of local ancestry by including SNP-
specific local ancestry estimates as a covariate in models for genome-wide significant signals.
Locus-specific ancestry (i.e. probabilities of whether an individual has 0, 1, or 2 alleles of
African ancestry at each locus) was only available for directly genotyped SNPs and was
estimated using a Hidden Markov Model and the local haplotype structure to detect transitions in
ancestry along the genome.43
Funding Sources: The ARIC Study is carried out as a collaborative study supported by National Heart, Lung, and Blood Institute contracts (HHSN268201100005C, HHSN268201100006C, HHSN268201100007C, HHSN268201100008C, HHSN268201100009C, HHSN268201100010C, HHSN268201100011C, and HHSN268201100012C), R01HL087641, R01HL59367 and R01HL086694; National Human Genome Research Institute contract U01HG004402; and NIH contract HHSN268200625226C. Infrastructure was partly supported by Grant Number UL1RR025005, a component of the NIH Roadmap for Medical Research.The BLSA was supported in part by the Intramural Research Program of the NIH/National Institute on Aging. A portion of that support was through a contract with MedStar Research Institute. The BHS was supported by grants HD-061437 and HD-062783 from the National Institute of Child Health and Human Development, and AG-16592 from the National Institute on Aging. ENS, SSM, and NJS were supported in part by NIH/NCRR Grant Number UL1 RR025774 and Scripps Genomic Medicine.The CFS was supported by (NIH HL 46380, M01RR00080), Case Western Reserve University. CHS was supported by NHLBI contracts N01-HC-85239, N01-HC-85079 through N01-HC-85086; N01-HC-35129, N01 HC-15103, N01 HC-55222, N01-HC-75150, N01-HC-45133 and NHLBI grants HL080295, HL075366, HL087652, HL085251, HL105756 with additional contribution from NINDS. Additional support was provided through AG-023629, AG-15928, AG-20098, and AG-027058 from the NIA. See also http://www.chs-nhlbi.org/pi.htm. DNA handling and genotyping was supported in part by National Center for Research Resources grant M01-RR00425 to the Cedars-Sinai General Clinical Research Center Genotyping core and National Institute of Diabetes and Digestive and Kidney Diseases grant DK063491 to the Southern California Diabetes Endocrinology Research Center.The Health ABC study was supported by NIA contracts N01AG62101, N01AG62103, and N01AG62106. The genome-wide association study was funded by NIA grant 1R01AG032098-01A1 to Wake Forest University Health Sciences and genotyping services were provided by the Center for Inherited Disease Research (CIDR). CIDR is fully funded through a federal contract from the NIH to The Johns Hopkins University, contract number HHSN268200782096C. This
ources: The ARIC Study is carried out as a collaborative study supported by Nag, and Blood Institute contracts HHSN268201100005 HHSN268201100006C2201100010C, HHSN268201100011C, and HHSN268201100012C), R01HL0876
4 ru h
n Aging. A portion of that support was through a contract with MedStar Researc
ourcesses:: ThThe ee ARARRIC Study is carried out as aa collaborative sstututudy supported by Nag, aaaandndndn Bloooodododod IInstitute contracts (HHSN26668820110000555C,CC HHHHHSH N268201100006C20010 100007C, HHHHSHSHSN2N2N2N2686868682020202 1111111000000000000 8C8C8CC, HHHSNSNN2626268282828201010110101100000000090909C,,, 20010 10111 0010C, HHHHHSNNN2688882202 1100010011CCC, andd HHHHSNSNSNSN226882001100000012222C), RR0R 1H1H1HL00088766777 aaaandndndd RRRR0101011HLHLHL0808080 6666 9494949 ; NaNaNaNatitititiononoo allll HHHumumumumananann GGGenenenenomomommeee e RReReR seseseararararchchch IIIInsnsnstititititututututetetee ccconononntrtrtrtracacacct
4402; and NIH ccconoontract HHHHHHSNS 26820062525226C.C IIInfnn rastructctururure ee was partly supporumber UL1RR0R0R0R0252525250000000 5,5,5, aaa cccomomomompopopoponenenentntntnt ooof fff ththhhee ee NNNIN H HHH RoRoRoRoadadadadmamamaapppp fofofof rrr MeMeMeMedical Researchwwwasasas sssupupuppopopoortrtrtededed iiinnn papapartrtrt bbby y y y thththeee InInIntrtrtrtramamamurururalalal RRReseseseaeaearcrcrcr hhh PrPrProgogogrararar mmm ofofof ttthehehe NNNIHIHIH/N/N/Natatatioioionananal llAAgigingng.. AA pporortititionon ooff thththatat ssupuppoportrt wwasas ttthrhhrououghgh aa cconontrttracacttt wiwiiththth MMMededStStStarar RReseseaearcrc
by guest on June 25, 2018http://circgenetics.ahajournals.org/
Dow
nloaded from

DOI: 10.1161/CIRCGENETICS.112.963991
15
research was supported in part by the Intramural Research Program of the NIH, National Institute on Aging.HANDLS was supported by the Intramural Research Program of the NIH, National Institute on Aging and the National Center on Minority Health and Health Disparities (contract # Z01-AG000513 and human subjects protocol # 2009-149). Data analyses for the HANDLS study utilized the high-performance computational capabilities of the Biowulf Linux cluster at the NIH, Bethesda, MD (http://biowulf.nih.gov). The JHS was supported by NIH contracts N01-HC-95170, N01-HC-95171, and N01-HC-95172 provided by the National Heart, Lung, and Blood Institute and the National Center for Minority Health and Health Disparities.The MESA was supported by University of Washington (N01-HC-95159), Regents of the University of California (N01-HC-95160), Columbia University (N01-HC-95161), Johns Hopkins University (N01-HC-95162, N01-HC-95168), University of Minnesota (N01-HC-95163), Northwestern University (N01-HC-95164), Wake Forest University (N01-HC-95165), University of Vermont (N01-HC-95166), New England Medical Center (N01-HC-95167), Harbor-UCLA Research and Education Institute (N01-HC-95169), Cedars-Sinai Medical Center (R01-HL-071205), University of Virginia (subcontract to R01-HL-071205). The WHI was funded by the National Heart, Lung, and Blood Institute, NIH, U.S. Department of Health and Human Services through contracts N01WH22110, 24152, 32100-2, 32105-6, 32108-9, 32111-13, 32115, 32118-32119, 32122, 42107-26, 42129-32, and 44221. Funding for WHI SHARe genotyping was provided by NHLBI Contract N02-HL-64278. CLA was supported by HL098458 and AMB acknowledges support from CA009330. PTE was supported by grants HL092577, DA027021, HL104156, and HL105780. YL was supported by grants HG006292 and HG006703. Additional support was provided by the National Institute of Environmental Health Sciences (ES017794).
Conflict of Interest Disclosures: BMP served on a data safety monitoring board (DSMB) for a clinical trial of a device funded by the manufacturer (Zoll-Lifecor). Otherwise, authors have no other conflicts to report.
References:
1. Cheng S, Keyes MJ, Larson MG, McCabe EL, Newton-Cheh C, Levy D, et al. Long-term outcomes in individuals with prolonged pr interval or first-degree atrioventricular block. JAMA.2009;301:2571-2577.
2. Lloyd-Jones DM, Wang TJ, Leip EP, Larson MG, Levy D, Vasan RS, et al. Lifetime risk for development of atrial fibrillation: The framingham heart study. Circulation. 2004;110:1042-1046.
3. Roy D, Talajic M, Dubuc M, Thibault B, Guerra P, Macle L, et al. Atrial fibrillation and congestive heart failure. Curr Opin Cardiol. 2009;24:29-34.
4. Havlik RJ, Garrison RJ, Fabsitz R, Feinleib M. Variability of heart rate, p-r, qrs and q-tdurations in twins. J Electrocardiol. 1980;13:45-48.
er (N01-HC-95167777),))) eddeddarararars-s-s-s-SiSiSiSinanananaiiii MeMeMeMedidididicaaaall ll CCCC1205)5))5). e NIHHHH UUUU SSSS DDDDepepepepaararartmtt
Human Services through contracts N01WH22110, 24152, 32100-2, 32105-6, 323, 32115, 32118-32119, 32122, 42107-26, 42129-32, and 44221. Funding for Wnu
by grants HL092577, DA027021, HL104156, and HL105780. YL was supported006292 and HG006703. Additional support was provided by the National Institun
Humumumananan SSSererervicececes through contracts N01WWWH2HH 2110, 24152,, 33332100-2, 32105-6, 323,,, 322212 15, 3232323211118-888 3222211111119,999 333212112122222 , ,,, 424242101010107-77 266, 4212122129-9-9-9 3223232, ,, ananand dd 4444444221.1.1.1. FFFFunununundiiingngngng ffforororor Wnooootyyyyping was pprrroviiiddededed d bybybyb NHLHHH BIBBI Conoontraact N0N0N02-22 HLHHH --644278...uppppppooorted bybybyy HLHLL09844458 aandn AAMBMBMBM accckknowwledgdgdges suuppppoort ffrooommff CCCAC 0000099399 3000. PTPPTE
by graaantntntntssss HHHL0909092522525777777, DADADA02020227777021, HLHLHLHL101010414414156565656, annanandddd HLHHLHL101010057557578008080. YLYLYLYL wwwas ssupuppopo trtrtede006292 and HG0G0G0G006060667070707 3.3.3. AAAdddddddditititi ioioioonananan ll l susususuppppppororort t t wawawaw s prprprp ovovovovidididi edededed bbbyy yy thththe eee NaNNN tional Instituntal Health Sciences ((ESESESE 0101011777779494944))).
by guest on June 25, 2018http://circgenetics.ahajournals.org/
Dow
nloaded from

DOI: 10.1161/CIRCGENETICS.112.963991
16
5. Smith JG, Lowe JK, Kovvali S, Maller JB, Salit J, Daly MJ, et al. Genome-wide association study of electrocardiographic conduction measures in an isolated founder population: Kosrae. Heart Rhythm. 2009;6:634-641.
6. Schott JJ, Alshinawi C, Kyndt F, Probst V, Hoorntje TM, Hulsbeek M, et al. Cardiac conduction defects associate with mutations in scn5a. Nat Genet. 1999;23:20-21.
7. Tan HL, Bink-Boelkens MT, Bezzina CR, Viswanathan PC, Beaufort-Krol GC, van Tintelen PJ, et al. A sodium-channel mutation causes isolated cardiac conduction disease. Nature.2001;409:1043-1047.
8. Chambers JC, Zhao J, Terracciano CM, Bezzina CR, Zhang W, Kaba R, et al. Genetic variation in scn10a influences cardiac conduction. Nat Genet. 2010;42:149-152.
9. Holm H, Gudbjartsson DF, Arnar DO, Thorleifsson G, Thorgeirsson G, Stefansdottir H, et al.Several common variants modulate heart rate, pr interval and qrs duration. Nat Genet.2010;42:117-122.
10. Pfeufer A, van Noord C, Marciante KD, Arking DE, Larson MG, Smith AV, et al. Genome-wide association study of pr interval. Nat Genet. 2010;42:153-159.
11. Denny JC, Ritchie MD, Crawford DC, Schildcrout JS, Ramirez AH, Pulley JM, et al.Identification of genomic predictors of atrioventricular conduction: Using electronic medicalrecords as a tool for genome science. Circulation. 2010;122:2016-2021.
12. Smith JG, Magnani JW, Palmer C, Meng YA, Soliman EZ, Musani SK, et al. Genome-wide association studies of the pr interval in african americans. PLoS Genet. 2011;7:e1001304.
13. Soliman EZ, Prineas RJ, Case LD, Zhang ZM, Goff DC, Jr. Ethnic distribution of ecg predictors of atrial fibrillation and its impact on understanding the ethnic distribution of ischemic stroke in the atherosclerosis risk in communities (aric) study. Stroke. 2009;40:1204-1211.
14. Ramirez AH, Schildcrout JS, Blakemore DL, Masys DR, Pulley JM, Basford MA, et al.Modulators of normal electrocardiographic intervals identified in a large electronic medical record. Heart Rhythm. 2011;8:271-277.
15. Reiner AP, Lettre G, Nalls MA, Ganesh SK, Mathias R, Austin MA, et al. Genome-wide association study of white blood cell count in 16,388 african americans: The continental origins and genetic epidemiology network (cogent). PLoS Genet. 2011;7:e1002108.
16. Musunuru K, Lettre G, Young T, Farlow DN, Pirruccello JP, Ejebe KG, et al. Candidate gene association resource (care): Design, methods, and proof of concept. Circ Cardiovasc Genet.2010;3:267-275.
17. Guo W, Giancotti FG. Integrin signalling during tumour progression. Nat Rev Mol Cell Biol.2004;5:816-826.
n G, Stefansdottir H,HHH ttttioioioionnnn. NaNaNaNatt tt GeGeGeGenenenenetttt.
i
Jon of genomic predictors of atrioventricular conduction: Using electronic medica
J -st dies of the pr inter al in african americans PL S G t 2011;7:e1001304
A,,, vvvananan NNNNoooooorddd CCCC, Marciante KD, Arkinggg DDDE, Larson MG, SmSSS ith AV, et al. Geniaaaattit ooono studyyyy of f f prppp intntntntererervavvv l.l.l. NaNaNaNat GeGeGeG neeeetttt. 201010;42:2:2:151515153-33 151515159.9.9
JCCCC, ,, RiRR tchie e e MDMDMD, CCraaawfofofordrd DC,C Scchilillddcroouut JJJS,SS, RRammiiireez AAHHH, PPuuulley y y y JMJMJM, et aaal..on offf gegegegennonon miiicc prprprededdiicictott rs oooffff atriovvvenenenentrtrtrt iicicullularar conononndudduductctc iooon:n:n:n: UUUU iisisinnng eelelelelectctcttroniniicc memedididica tool for genomemmm sssscicicicienenenncececec . CiCiCiCircrcrcululululatatattioioioionnn.. 202201010100;1;1;122222:2:2:201010101666-2-2-220202020 1.1.1.1
JGGG, Magnanannni i ii JWJWWJW,, , PaPaPaPalmlmlmerererer CCC, ,, MeMeMMengngngng YYYYA,AA,A, SSSSoloolimimimimanannan EEEEZ,Z,Z, MMMususususanananani ii i SKSKSKSK, ,, etetetet aaaallll.. GeG nome--st ddiie fof thhe iinte lal ii faf iri iic PLPL SS GG t 20201111 7;7 10100101303044 by guest on June 25, 2018
http://circgenetics.ahajournals.org/D
ownloaded from

DOI: 10.1161/CIRCGENETICS.112.963991
17
18. Daigo Y, Isomura M, Nishiwaki T, Tamari M, Ishikawa S, Kai M, et al. Characterization of a 1200-kb genomic segment of chromosome 3p22-p21.3. DNA Res. 1999;6:37-44.
19. Takeuchi F, Isono M, Katsuya T, Yamamoto K, Yokota M, Sugiyama T, et al. Blood pressure and hypertension are associated with 7 loci in the japanese population. Circulation.2010;121:2302-2309.
20. Ghosh A, Ghosh S, Maiti GP, Sabbir MG, Zabarovsky ER, Roy A, et al. Frequent alterations of the candidate genes hmlh1, itga9 and rbsp3 in early dysplastic lesions of head and neck: Clinical and prognostic significance. Cancer Sci. 2010;101:1511-1520.
21. Gulubova M, Vlaykova T. Immunohistochemical assessment of fibronectin and tenascin and their integrin receptors alpha5beta1 and alpha9beta1 in gastric and colorectal cancers with lymph node and liver metastases. Acta Histochem. 2006;108:25-35.
22. Ng CC, Yew PY, Puah SM, Krishnan G, Yap LF, Teo SH, et al. A genome-wide association study identifies itga9 conferring risk of nasopharyngeal carcinoma. J Hum Genet. 2009;54:392-397.
23. Weiss R, Barmada MM, Nguyen T, Seibel JS, Cavlovich D, Kornblit CA, et al. Clinical and molecular heterogeneity in the brugada syndrome: A novel gene locus on chromosome 3. Circulation. 2002;105:707-713.
24. London B, Michalec M, Mehdi H, Zhu X, Kerchner L, Sanyal S, et al. Mutation in glycerol-3-phosphate dehydrogenase 1 like gene (gpd1-l) decreases cardiac na+ current and causes inherited arrhythmias. Circulation. 2007;116:2260-2268.
25. Dennis G, Jr., Sherman BT, Hosack DA, Yang J, Gao W, Lane HC, et al. David: Database for annotation, visualization, and integrated discovery. Genome Biol. 2003;4:P3.
26. Zeller T, Wild P, Szymczak S, Rotival M, Schillert A, Castagne R, et al. Genetics and beyond--the transcriptome of human monocytes and disease susceptibility. PloS One.2010;5:e10693.
27. Montgomery SB, Sammeth M, Gutierrez-Arcelus M, Lach RP, Ingle C, Nisbett J, et al.Transcriptome genetics using second generation sequencing in a caucasian population. Nature.2010;464:773-777.
28. Remme CA, Wilde AA, Bezzina CR. Cardiac sodium channel overlap syndromes: Different faces of scn5a mutations. Trends Cardiovasc Med. 2008;18:78-87.
29. Newton-Cheh C, Eijgelsheim M, Rice KM, de Bakker PI, Yin X, Estrada K, et al. Common variants at ten loci influence qt interval duration in the qtgen study. Nat Genet. 2009;41:399-406.
30. Pfeufer A, Sanna S, Arking DE, Muller M, Gateva V, Fuchsberger C, et al. Common variants at ten loci modulate the qt interval duration in the qtscd study. Nat Genet. 2009;41:407-414.
A AA gegegegenonononomemememe-wiwiwiwidededede aaaasssssoooociiiiHum GeGGG netttt. 2020202009090909;5;5;5;54444:
R ahn
n cer
R,,,, BBBBarmadaaaa MMMM,MMM NNNNgugugguyeyyy n n n T,T,T,T, SSSeieieieibebb ll JSJSJSJ , CCavvlovvvicicicich hh h D,D,,D, KKKoroornbnbbnblit CACACACA, ,, eteee aalll.... ClClClininininicaheeeteeeerogeneity ininin thee bbbbrugagagag da ssynynnddrommmee: AA nnovvelelel ggggeeneee locuss onnn ccchrommmmooosomomme 333.3 n. 2020202002000 ;105555:7::: 07077-713133.
n B, Michalec MMMM, MeMeMeMehdhdhddii H,H,H,, ZZZZhuhuhuu XXXX, , , KeKeKeK rcrcchnhnhnerererer LLL, SaSaSaS nynynynyalalala SSSS, , ,, etetett aaalll.. MuMuMuM tation in glyce dehyydrogggenase 111 lilililikkek gggene (g(g( pddpd11-1 l)l)l)l) ddddecreases cardidididiac na+ current and causesrrrhythmiaas.s CiCiCiCircrccrcululuulatatatatioioionnnn... 2020202007070707;1;1; 16161616:2:22:226226260-0-00-2222222686866 ..
by guest on June 25, 2018http://circgenetics.ahajournals.org/
Dow
nloaded from

DOI: 10.1161/CIRCGENETICS.112.963991
18
31. Sotoodehnia N, Isaacs A, de Bakker PI, Dorr M, Newton-Cheh C, Nolte IM, et al. Common variants in 22 loci are associated with qrs duration and cardiac ventricular conduction. Nat Genet. 2010;42:1068-1076.
32. Renganathan M, Cummins TR, Waxman SG. Contribution of na(v)1.8 sodium channels to action potential electrogenesis in drg neurons. J Neurophysiol. 2001;86:629-640.
33. Jeff JM, Brown-Gentry K, Buxbaum SG, Sarpong DF, Taylor HA, George AL, Jr., et al.Scn5a variation is associated with electrocardiographic traits in the jackson heart study. Circ Cardiovasc Genet. 2011;4:139-144.
34. Ellinor PT, Lunetta KL, Albert CM, Glazer NL, Ritchie MD, Smith AV, et al. Meta-analysis identifies six new susceptibility loci for atrial fibrillation. Nat Genet. 2012;44:670-675.
35. Goring HH, Terwilliger JD, Blangero J. Large upward bias in estimation of locus-specific effects from genomewide scans. Am J Hum Genet. 2001;69:1357-1369.
36. Chen MH, Yang Q. Gwaf: An r package for genome-wide association analyses with family data. Bioinformatics. 2010;26:580-581.
37. Lange K. Mathematical and statistical methods for genetic analysis. New York: Springer-Verlag; 2002.
38. Pritchard JK, Stephens M, Donnelly P. Inference of population structure using multilocus genotype data. Genetics. 2000;155:945-959.
39. Devlin B, Roeder K. Genomic control for association studies. Biometrics. 1999;55:997-1004
40. de Bakker PI, Ferreira MA, Jia X, Neale BM, Raychaudhuri S, Voight BF. Practical aspects of imputation-driven meta-analysis of genome-wide association studies. Hum Mol Genet.2008;17:R122-128.
41. Willer CJ, Li Y, Abecasis GR. Metal: Fast and efficient meta-analysis of genomewide association scans. Bioinformatics. 2010;26:2190-2191
42. Robins JM, Greenland S. Identifiability and exchangeability for direct and indirect effects. Epidemiology. 1992;3:143-155.
43. Tang H, Coram M, Wang P, Zhu X, Risch N. Reconstructing genetic ancestry blocks in admixed individuals. Am J Hum Genet. 2006;79:1-12.
mation of locus-sppppececececi9.999
tion aaaananananalylylylysesesesessss wiwiwiwithththth fffamf
K g0
rd JK, Stephens M, Donnelly P. Inference of population structure using multiloca
B Roeder K Genomic control for association st dies Bi t i 1999;55:997
formamamatitiiticscscs.. 20222 1010100;26:580-581.
KKK.K MMMathematiccaaal andndndd staaaattit sticccaala mmmethhhods ffoor ggenennneetee icc aaannalyssisss. NeNeNeew YoYoYoYorkkk: Spririiing02222.. .
rd JK, Stephensnsss MMM,,,, DoDoDoD nnnnnnn elelelllylylyly PPP.... InInInI fefefeferererer ncncncee ofofofof pppoppppulululu atatatatioioioi n nn n stststs rururuuctctcturururreeee uusu ing multilocata. Genetics. 20000000000;11;15555 99:94545455-9995959599.
BBB RRo ded KK GGe imi nt ll ffo iciatiio st ddiie BiBi t ii 19199999 5;555:999977 by guest on June 25, 2018http://circgenetics.ahajournals.org/
Dow
nloaded from

DOI: 10.1161/CIRCGENETICS.112.963991
19
Table 1. Characteristics of 13,415 African-American participants from ten cohort studies.a
Variableb
ARIC
n=2,391
BLSA
n=155
BHS
n=191
CFS
n=267
CHS
n=674
HABCc
n=1,054
HANDLS
n=945
JHS
n=1,962
MESA
n=1,627
WHIc
n=4,149
PR interval (ms) 172 ± 27 172 ± 25 161 ± 23 169 ± 26 172 ± 29 171 ± 28 162 ± 25 171 ± 26 171 ± 26 167 ± 25
RR interval (ms) 923 ± 150 957 ± 130 896 ± 149 903 ± 131 921 ± 158 931 ± 154 907 ± 154 949 ± 148 975 ± 155 915 ± 146
Age (years) 53.2 ± 8.8 64.4 ± 11.4 35.7 ± 4.8 44.3 ± 15.2 72.6 ± 5.5 73.4 ± 2.9 48.6 ± 9.0 49.3 ± 11.7 62.1 ± 10.1 61.6 ± 6.8
Female sex (%) 1,480 (62) 98 (63) 127 (66) 154 (58) 431 (64) 609 (58) 527 (56) 1,203 (61) 887 (55) 4,149 (100)
BMI (kg/m2) 29.5 ± 6.1 28.3 ± 5.2 31.5 ± 8.7 34.5 ± 9.2 28.4 ± 5.5 28.5 ± 5.4 29.9 ± 8.1 32.3 ± 7.8 30.2 ± 5.9 31.6 ± 6.2
Systolic BP (mmHg) 128.1 ± 20.7 133.7 ± 15.6 124.3 ± 17.9 126.1 ± 14.4 146.2 ± 21.5 138.7 ± 22.0 120.8 ± 21.9 124.6 ± 17.8 131.6 ± 21.6 131.9 ± 17.3
Genomic inflati 1.023 0.969 0.989 1.099 1.043 1.014 0.947 1.079 1.008 1.010
% European ancestryd 15 (11, 22) ND 18 (13, 21) 18 (13, 26) 24 (16, 36) 19 (12, 28) 16 (11, 22) 16 (12, 21) 19 (12, 30) 21 (13, 31)
aSample sizes presented are the maximum number of participants with SNP data. bData are presented as mean (standard deviation) for continuous variables and percentages for categorical variables. cThe HABC and WHI studies replaced imputed data with genotyped data when available and therefore have a range of genotyped participants (HABC minimum = 939 participants; WHI minimum = 3,898 participants). dPresented as median (25th percentile, 75th percentile)ARIC, Atherosclerosis Risk in Communities; BLSA, Baltimore Longitudinal Study on Aging; BHS, Bogalusa Heart Study; CFS, Cleveland Family Study; CHS, Cardiovascular Health Study; HABC, The Health, Aging, and Body Composition Study; HANDLS, The Healthy Aging in Neighborhoods of Diversity across the Life Span Study; JHS, Jackson Heart Study; MESA, Multi-Ethnic Study of Atherosclerosis; ND, not determined. WHI, Women’s Health Initiative.
58) 527 (56))))
± 5.4 29292929.9.999 ±±±± 8888.1.1.1.1
.6 124 3 ± 17 9 126 1 ± 14 4 146 2 ± 21 5 138 7 ± 22 0 120 8 ± 21 9
mon) for continuous variables and percentages for categorical variabled data with genotyped data when available and therefore have a ran
.6 1212124.44 3333 ± 17171717.9 126.1 ± 14.4 146.2222 ±±± 21.5 138.7 ±±±± 22.0 120.8 ± 21.9
0.988889999 1.1.1.1 09090999999 1.0043 111.00010 44 0.0.0.9494949 7777
1818818 ((((13111 , , , , 2121211)) 18888 ((((1313131 , , , , 26222 )))) 24242424 ((((16666, ,,, 36363636)))) 199199 ((((122122, , 282828)))) 6166 ((11111 , ,,, 2222222)))
mber of particcccipipipipanaanantststss wwwwitititth hhh SNSNSNSNP PPP dadadadatatatata. onnn))) fffor coooontntntntininininuouououousuuu vvvvaraarariaiaiaiablblblb eseseses aaaandndndnd pppperererercecececentntnntagagagageseseses ffforororor ccccatatatategegegegororororiciciccalalalal variiiablblbleeddd dddattta wititithhh genotttypeddd dddattta whhhen av iiailllablblble anddd ththther ffefore hhhave a ran
by guest on June 25, 2018http://circgenetics.ahajournals.org/
Dow
nloaded from

DOI: 10.1161/CIRCGENETICS.112.963991
20
Table 2. Summary of six primary and two secondary independent loci (P < 5.0x10⁻⁸) obtained for PR in 13,415 African-American participants from ten cohort studies.
SNP Gene Chr
Position
(Build 36) Allelesa
Effect allele
Frequency
Study-specific
b p phet
Primary signalsc
rs3891585 MEIS1 2 66,610,480 A/G 0.43 +-++-+++++ 2.13 (0.31) 1.42 x 10⁻¹¹ 0.11
rs267567 ITGA9 3 37,549,028 A/G 0.18 +++-++++++ 2.73 (0.41) 4.14 x 10⁻¹¹ 0.54
rs3922844 SCN5A 3 38,599,257 T/C 0.58 ---------- -4.54 (0.33) 5.26 x 10-43 0.58
rs11732231ARHGAP2
4 4 86,902,584 C/G 0.23 ++++++++++ 2.28 (0.39) 2.96 x 10⁻⁹ 0.30
rs11773845 CAV1 7 115,978,537 A/C 0.36 ---------- -2.29 (0.33) 4.45 x 10⁻¹² 0.53
rs1895585 TBX5 12 113,286,521 A/G 0.30 ++-+++++++ 3.19 (0.35) 1.36 x 10⁻¹⁹ 0.42
Secondary signalsd
rs6763048 SCN5A 3 38,656,398 A/G 0.73 ++++++++++ 2.62 (0.38) 3.75 x 10⁻¹² 0.74
rs6801957 SCN10A 3 38,742,319 T/C 0.27 ++++ 3.36 (0.58) 9.11 x 10⁻⁹ 0.15
aCoded allele listed first. bStudy-specific direction of estimates are listed in alphabetical order by study. The + and - symbols represent an increase and decrease, respectively, in the PR interval per copy of the minor allele.cDefined as locus-specific SNP with the lowest P-value. dDefined as significant SNPs after conditional analysis that adjusted for locus-specific primary signal. The conditional analysis for rs6801957 was performed in four cohorts (CHS, HABC, HANDLS and WHI) adjusting for successively less significant SNPs until no genome-wide significant SNPs remained. Chr, chromosome; se, standard error; p, meta-analysis p-value; phet, Cochran’s Q heterogeneity p-value.
Table 3. Associations between PR and three previously reported PR loci10 that were not genome-wide significant in a meta-analysis of 13,415 African-American participants from ten cohort studiesi.
SNP Gene ChrPosition
(Build 36) AllelesaEffect Allele Frequency
Study-specific direction of b p phet
rs251253 NKX2-5 5 172,412,942 T/C 0.36 -++++++-++ 0.77 (0.33) 1.84 x 10⁻² 0.53rs4944092 WNT11 11 75,587,267 A/G 0.57 ++-+++++-+ 0.41 (0.32) 2.05 x 10⁻¹ 0.18rs11047543 SOX5 12 24,679,606 A/G 0.03 -+???---+? -2.49 (1.25) 4.57 x 10⁻² 0.12aCoded allele listed first. bStudy-specific direction of estimates are listed in alphabetical order of the studies. The + and - symbols represent an increase and decrease, respectively, in the PR interval per copy of the minor allele. A “?” denotes studies that did not contribute to the SNP meta-analysis.Chr, chromosome; se, standard error; p, meta-analysis p-value; phet, Cochran’s Q heterogeneity p-value.
----2.222 29292929 ((((0.000 33333333)))) 44.44 45454545 xxxx 10000
3.19999 ((((0.0.0.0.35353535)))) 1....36363636 xxx 10
l
0
0
ic tecgnificant SNPs after conditional analysis that adjusted for locus specific primary signal The con
lsd
SSSCS NNN5N A 3 3888,6,6565656,33,339888 A//A//GGGG 0..733 +++++++++++++++++++++++++++++ 2.2.2.62626262 (((0.0.0.383838)) 3.3.33.757575 xxx 10
SCCCN1N1N1N10A 3333 38,,74442,31919191 T/TT CCC 0..277 ++++++ 3.333 33633 (0..58585858) 9.111 xx 10
isted first.c direction of estitititimamamam tetetetesss ararare eee liiststtedededed iiin nn aaala phphphphababababeteteticiciccalaal ooordrdrdrdeer byyyy ssstutuuudydydydy. ThThThheee ++++ ananand ddd ---- ssys mbols representecrcrcreaeaeasesese,,, rererespspspececectititivevevelylyly,,, ininin ttthehehe PPPRRR ininintetetervrvrvalalal pppererer cccopopopyyy ofofof ttthehehe mmminininororor alalallelelelelele...cuus-specificcc SSSSNPNPNPN wwwwitititth h h ththththe ee lololoowewww ststtst PPP---vavavalulululue.ee. gniififica tnt SSNPNPs faftter co dndititiionall an lalysiis tthhatt dadjju tst ded ffor llocus specififiic p irimary siignall ThThe con by guest on June 25, 2018
http://circgenetics.ahajournals.org/D
ownloaded from

DOI: 10.1161/CIRCGENETICS.112.963991
21
Figure Legends:
Figure 1. Manhattan plot of the association of SNPs with PR in a meta-analysis of ten African
American cohorts. The x-axis represents the chromosomal position for each SNP, and the y-axis
represents the -log10 P-value for association with PR, which is truncated at 1x10-23.
Figure 2. Regional association plots of six loci associated with PR interval in ten African
American cohorts. SNP P-values (represented by circles) at each locus are shown on the –
log10(P-value) scale as a function of chromosomal position. Strength of LD is indicated by the
color category. Purple diamonds denotes the locus-specific primary signal. Recombination rate is
plotted in the background and known genes are shown on the bottom of the plot. A) MEIS1; b)
ITGA9; c) SCN5A; d) ARHGAP24; e) CAV1; f) TBX5.
s are shown on theeee ––––
of LD DDD isisisis iiiindndndndicicicicatatatatedededd bbbbyyy
o
h 1
S
oryyy. . . PuPuuPurprprprpleleele diaaamommm nds denotes the locus---spspspece ific primary sigigiggnal. Recombination
heee bbbbackgroundd d aaandd d knknknk owwwwnn geeennesss aare shhowwnn onon thehehe boootttom of ttthehehee ploooot.t AAAA) MEMMEIIISI 1
SCN5N5N5N5AAAA;;; d)d)d)d ARRRHGHGHGHGAPAPAPP2422 ; eee))) CCCAC V1V1V1V1;;; f)f)f)f) TBTBTBTBX5X5X5X .
by guest on June 25, 2018http://circgenetics.ahajournals.org/
Dow
nloaded from

by guest on June 25, 2018http://circgenetics.ahajournals.org/
Dow
nloaded from

by guest on June 25, 2018http://circgenetics.ahajournals.org/
Dow
nloaded from
Magnani and Christy L. AveryW.Alan B. Zonderman, Luigi Ferrucci, Sarah S. Murray, Michele K. Evans, Nona Sotoodehnia, Jared
Zhang,Andrew B. Singleton, J. Gustav Smith, Elsayed Z. Soliman, Sathanur R. Srinivasan, Zhu-ming Quibrera, Susan Redline, Alex P. Reiner, Jerome I. Rotter, Renate B. Schnabel, Nicholas J. Schork,Newman, Christopher Newton-Cheh, Kari E. North, Cameron D. Palmer, Bruce M. Psaty, P. Miguel
Yongmei Liu, Steven A. Lubitz, Kristin D. Marciante, Reena Mehra, Yan A. Meng, Anne B.Gerardo Heiss, Wen-Chi Hsueh, Brendan J. Keating, Kathleen F. Kerr, Yun Li, Marian C. Limacher,
Gerald S. Berenson, Josh C. Bis, Wei Chen, Rajat Deo, Patrick T. Ellinor, Susan R. Heckbert,Guo Li, Sarah G. Buxbaum, Eric A. Whitsel, Alvaro Alonso, Dan E. Arking, Emelia J. Benjamin, Anne M. Butler, Xiaoyan Yin, Daniel S. Evans, Michael A. Nalls, Erin N. Smith, Toshiko Tanaka,
American CohortsNovel Loci Associated with PR Interval in a Genome-Wide Association Study of Ten African
Print ISSN: 1942-325X. Online ISSN: 1942-3268 Copyright © 2012 American Heart Association, Inc. All rights reserved.
TX 75231is published by the American Heart Association, 7272 Greenville Avenue, Dallas,Circulation: Cardiovascular Genetics
published online November 8, 2012;Circ Cardiovasc Genet.
http://circgenetics.ahajournals.org/content/early/2012/11/08/CIRCGENETICS.112.963991World Wide Web at:
The online version of this article, along with updated information and services, is located on the
http://circgenetics.ahajournals.org/content/suppl/2012/11/08/CIRCGENETICS.112.963991.DC1Data Supplement (unedited) at:
http://circgenetics.ahajournals.org//subscriptions/
is online at: Circulation: Cardiovascular Genetics Information about subscribing to Subscriptions:
http://www.lww.com/reprints Information about reprints can be found online at: Reprints:
document. Permissions and Rights Question and Answer this process is available in the
located, click Request Permissions in the middle column of the Web page under Services. Further information aboutnot the Editorial Office. Once the online version of the published article for which permission is being requested is
can be obtained via RightsLink, a service of the Copyright Clearance Center,Circulation: Cardiovascular Genetics Requests for permissions to reproduce figures, tables, or portions of articles originally published inPermissions:
by guest on June 25, 2018http://circgenetics.ahajournals.org/
Dow
nloaded from
SUPPLEMENTAL MATERIAL
The supporting information has the following sections in order:
I. Supplemental Figure and Tables
II. Supplemental Materials and Methods
III. Supplemental References
I. Supplemental Figure and Tables
Supplemental Figure 1. Quantile-quantile plot showing the association of SNPs with PR interval in the meta-analysis of ten genome-wide association studies of African Americans. The red line represents the expected distribution of -log10 p-values under the null hypothesis. The blue dots represent the observed -log10 p-values.

Supplemental Table 1. Genotyping characteristics for the genome-wide association analyses of ten studies in the meta-analysis.a Study Genotyping array Genotype
calling algorithm
Study-specific filters Imputation software
GWAS statistical analysis software
Imputation quality (Median:
25%, 75%)
N. autosomal SNPs passing
QC Method of PC
estimatione Sample call rate
SNP call rate
SNP MAFb
HWE p-valuec
ARIC Affymetrix 6.0 Birdseed <95% <90% <1% NA MACH v1.16 PLINK 0.98 (0.91, 1.0) 796,384 EIGENSTRAT, 10 PCs
BLSA Illumina 550K BeadStudio ≤98.5% <99% <1% ≤10-4 MACH 1.0 Merlin 0.95 (0.86, 1.0 501,704 EIGENSTRAT, 2 PCs
BHS Illumina Human610 BeadChip, HumanCVD BeadChip
BeadStudio <99% <90% NA NA MACH v1.0.16 PLINK 0.96 (0.89, 0.99) 608,756 LAMP, 10 PCs
CFS Affymetrix 6.0 Birdseed <95% <90% <1% NA MACH v1.16 R 0.99 (0.94, 1.0) 867,495 EIGENSTRAT, 10 PCs
CHS Illumina HumanOmni1-Quad_v1 BeadChip system
Illumina Genome Studio
<95% ≤97% NA <10-5 BEAGLE version 3.2.1
R 0.98 (0.94, 1.0) 963,248 R, 10 PCs
HABC Illumina 1M BeadStudio <97% <97% <1% <10-6 MACH v1.16 R 0.97 (0.92, 1.0) 1,007,948 EIGENSTRAT, 2 PCs
HANDLS Illumina 1M d BeadStudio ≤95% ≤95% ≤1% ≤10-7 MACH v1.16 R, MACH2QTL 0.98 (0.93, 1.0) 907,763 PLINKv1.06, 10 PCs
JHS Affymetrix 6.0 Birdseed <95% <90% <1% NA MACH v1.16 PLINK 0.98 (0.92, 1.0) 868,969 EIGENSTRAT, 10 PCs
MESA Affymetrix 6.0 Birdseed <95% <90% <1% NA MACH v1.16 PLINK 0.99 (0.93, 1.0) 881,666 EIGENSTRAT, 10 PCs
WHI Affymetrix 6.0 Birdseed <95% <95% <1% <10-6 MACH v1.0.16 PLINK, ProbABEL 0.97 (0.89, 1.0) 829,370 STRUCTURE, 4 PCs
aAll studies used HapMap phase 2 release 22 build 36 and the HapMap Reference panel 1:1 CEU:YRI phase II. bSNP MAF filter applied pre-imputation. cGenotyped SNP results used to replace imputed SNP results were not filtered by HWE P-value. d1024 HANDLS participants were successfully genotyped at the equivalent of Illumina 1M SNP coverage (709 samples using Illumina 1M and 1Mduo arrays, the remainder using a combination of 550K, 370K, 510S and 240S to equate the million SNP level of coverage). eSoftware program used to estimate principal components (PC) and the number of top principal components used as covariates in the analysis. ARIC, Atherosclerosis Risk in Communities; BLSA, Baltimore Longitudinal Study on Aging; BHS, Bogalusa Heart Study; CFS, Cleveland Family Study; CHS, Cardiovascular Health Study; HABC, The Health, Aging, and Body Composition Study; HANDLS, The Healthy Aging in Neighborhoods of Diversity across the Life Span Study; JHS, Jackson Heart Study; MESA, Multi-Ethnic Study of Atherosclerosis; WHI, Women’s Health Initiative.

Supplemental Table 2. Summary of study-specific independent genome-wide significant association results for PR interval obtained at 17 independent loci.
Effect Allele Frequency
βb (se)
SNP Nearest Gene Chr Allelesa ARIC BLSA BHSc CFS CHS HABC HANDLS JHS MESA WHI
Primary signalsd
rs3891585 MEIS1 2 A/G 0.43 2.42 (0.78)
-1.37 (2.69)
0.97 (2.47)
3.51 (2.16)
-0.91 (1.44)
0.29 (1.21)
3.86 (1.11)
3.37 (0.83)
2.69 (0.88)
1.77 (0.54)
rs267567 ITGA9 3 A/G 0.18 2.72 (1.07)
6.61 (3.64)
3.01 (3.54)
-1.36 (2.79)
0.92 (1.93)
2.97 (1.57)
1.84 (1.51)
3.53 (1.11)
4.64 (1.17)
2.24 (0.68)
rs3922844 SCN5A 3 T/C 0.58 -5.08 (0.84)
-4.56 (3.00)
-4.09 (2.43)
-0.91 (2.46)
-5.35 (1.55)
-3.38 (1.18)
-4.06 (1.13)
-6.14 (0.86)
-4.57 (0.94)
-4.12 (0.57)
rs11732231 ARHGAP4 4 C/G 0.23 1.59 (1.00)
4.42 (3.14)
1.89 (3.18)
0.28 (2.89)
2.21 (1.84)
5.08 (1.43)
3.04 (1.31)
0.70 (1.01)
4.08 (1.13)
1.88 (0.64)
rs11773845 CAV1 7 A/C 0.36 -0.33 (0.83)
-1.34 (2.83)
-3.66 (2.48)
-4.01 (2.25)
-3.43 (1.62)
-2.29 (1.25)
-1.88 (1.18)
-2.51 (0.88)
-3.07 (0.95)
-2.64 (0.55)
rs1895585 TBX5 12 A/G 0.30 2.45 (0.89)
4.61 (3.07)
-0.42 (2.75)
2.78 (2.48)
5.37 (1.67)
4.57 (1.35)
1.08 (1.24)
4.04 (0.92)
2.90 (1.01)
3.36 (0.59)
Secondary signalse
rs6763048 SCN5A 3 A/G 0.73 2.25 (0.93)
7.13 (3.26)
4.61 (2.91)
3.70 (2.6)
4.20 (1.84)
2.02 (1.42)
3.89 (1.38)
3.92 (0.94)
2.95 (1.06)
3.19 (0.64)
rs6801957 SCN10A 3 T/C 0.17 --- --- --- --- 0.97 (2.13)
3.34 (1.69)
6.31 (1.52)
--- --- 2.96 (0.72)
aCoded allele listed first. bBeta (β) estimates represent the difference in PR interval (milliseconds) per copy of the minor allele, adjusted for the covariates in the model. ARIC, Atherosclerosis Risk in Communities; BLSA, Baltimore Longitudinal Study on Aging; BHS, Bogalusa Heart Study; CFS, Cleveland Family Study; CHS, Cardiovascular Health Study; HABC, The Health, Aging, and Body Composition Study; HANDLS, The Healthy Aging in Neighborhoods of Diversity across the Life Span Study; JHS, Jackson Heart Study; MESA, Multi-Ethnic Study of Atherosclerosis; WHI, Women’s Health Initiative. cThe Bogalusa Heart Study did not have information on two SNPs (rs10049479 and rs7627552). dDefined as locus-specific SNP with the lowest P-value. eDefined as significant SNPs after conditional analysis that adjusted for locus-specific primary signal. This approach was performed adjusting for successively less significant SNPs until no genome-wide significant SNPs were identified. Chr, chromosome; se, standard error.

Supplemental Table 3. Local ancestry analyses of primary and secondary PR loci that reached genome-wide significance (P < 5.0 x 10⁻⁸) across up to seven studies of African American participants.*
β (se)b
Pre-Local Ancestry Analysis
Post-Local Ancestry Analysis
SNP Nearest Gene Chr Allelesa Effect Allele Frequency ARIC CFS HABC HANDLS JHS MESA WHI N p β (se) p
Primary signalsc, d rs3891585 MEIS1 2 A/G 0.43 2.48
(0.78) 3.49
(2.22) -0.12 (1.19)
3.85 (1.11)
3.44 (0.83)
2.66 (0.88)
1.81 (0.54) 12,395 7.28 x 10⁻¹³
2.36 (0.32) 3.57 x 10⁻¹³
rs267567 ITGA9 3 A/G 0.18 1.86 (1.13)
-2.57 (3.02)
2.76 (1.61)
1.84 (1.50)
3.80 (1.21)
3.36 (1.25)
1.73 (0.76) 12,395 1.31 x 10⁻¹⁰
2.26 (0.46) 7.61 x 10-07
rs3922844 SCN5A 3 A/G 0.58 -- -- -3.00 (1.23)
-4.05 (1.13) -- -- -- 1,999 5.03 x 10-06
-3.57 (0.49) 1.78 x 10-05
rs11732231 ARHGAP4 4 C/G 0.23 -- -- 4.00 (1.65)
3.10 (1.31) -- -- -- 1,999 4.25 x 10-05
3.45 (1.03) 7.68 x 10-04
rs11773845 CAV1 7 A/C 0.36 -0.35 (0.86)
-4.56 (2.34)
-2.69 (1.30)
-1.80 (1.17)
-2.40 (0.90)
-3.12 (0.97)
-3.19 (0.58) 12,395 8.46 x 10⁻¹¹
-2.45 (0.35) 3.09 x 10⁻¹²
rs1895585 TBX5 12 A/G 0.30 -- -- 4.56 (1.33)
1.23 (1.23) -- -- 3.39
(0.59) 6,148 2.00 x 10⁻¹⁰ 3.20
(0.49) 9.15 x 10⁻¹¹ aCoded allele listed first. bLocal ancestry estimates were not available for three studies (Baltimore Longitudinal Study of Aging, Bogalusa Heart Study, and Cardiovascular Health Study). cDefined as locus-specific SNP with the lowest P-value. dSecondary signals were not presented because no cohort had local ancestry estimates for all relevant SCN5A/SCN10A loci. ARIC, Atherosclerosis Risk in Communities; CFS, Cleveland Family Study; CHS, Cardiovascular Health Study; HABC, The Health, Aging, and Body Composition Study; HANDLS, The Healthy Aging in Neighborhoods of Diversity across the Life Span Study; JHS, Jackson Heart Study; MESA, Multi-Ethnic Study of Atherosclerosis; WHI, Women’s Health Initiative. Chr, chromosome; se, standard error; p, meta-analysis p-value.

Supplemental Table 4. Phenotype details for the ten studies in the meta-analysis. Study ECG machine Measurement system ARIC Marquette MAC PC Marquette 12SL BLSA GE Marquette MAC5000 Marquette 12SL
BHS Marquette MAC PC Marquette 12SL
CFS Marquette MAC6 Marquette 12SL
CHS Marquette MAC PC Marquette 12SL
HABC Marquette MAC PC Marquette 12SL
HANDLS GE Marquette MAC5500 Marquette 12SL
JHS Marquette MAC PC MC MEANS
MESA Marquette MAC1200 Marquette 12SL
WHI Marquette MAC PC Marquette 12SL
ARIC, Atherosclerosis Risk in Communities; BLSA, Baltimore Longitudinal Study on Aging; BHS, Bogalusa Heart Study; CFS, Cleveland Family Study; CHS, Cardiovascular Health Study; HABC, The Health, Aging, and Body Composition Study; HANDLS, The Healthy Aging in Neighborhoods of Diversity across the Life Span Study; JHS, Jackson Heart Study; MESA, Multi-Ethnic Study of Atherosclerosis; WHI, Women’s Health Initiative.
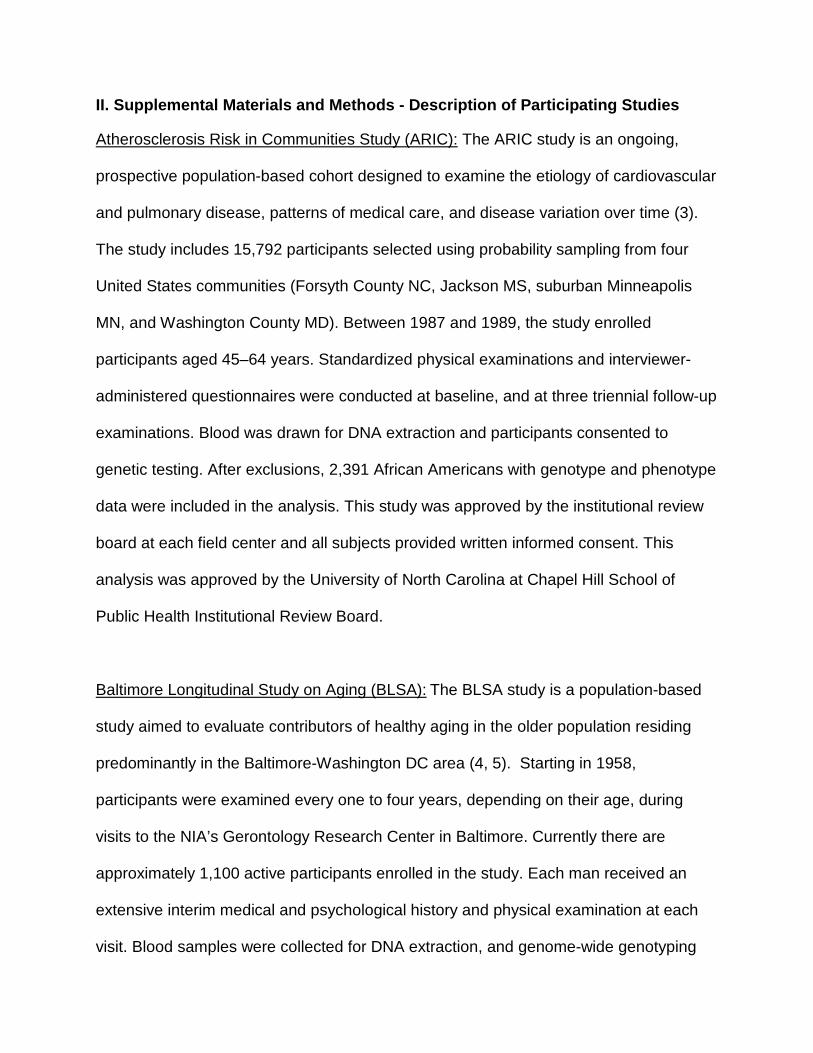
II. Supplemental Materials and Methods - Description of Participating Studies
Atherosclerosis Risk in Communities Study (ARIC): The ARIC study is an ongoing,
prospective population-based cohort designed to examine the etiology of cardiovascular
and pulmonary disease, patterns of medical care, and disease variation over time (3).
The study includes 15,792 participants selected using probability sampling from four
United States communities (Forsyth County NC, Jackson MS, suburban Minneapolis
MN, and Washington County MD). Between 1987 and 1989, the study enrolled
participants aged 45–64 years. Standardized physical examinations and interviewer-
administered questionnaires were conducted at baseline, and at three triennial follow-up
examinations. Blood was drawn for DNA extraction and participants consented to
genetic testing. After exclusions, 2,391 African Americans with genotype and phenotype
data were included in the analysis. This study was approved by the institutional review
board at each field center and all subjects provided written informed consent. This
analysis was approved by the University of North Carolina at Chapel Hill School of
Public Health Institutional Review Board.
Baltimore Longitudinal Study on Aging (BLSA): The BLSA study is a population-based
study aimed to evaluate contributors of healthy aging in the older population residing
predominantly in the Baltimore-Washington DC area (4, 5). Starting in 1958,
participants were examined every one to four years, depending on their age, during
visits to the NIA’s Gerontology Research Center in Baltimore. Currently there are
approximately 1,100 active participants enrolled in the study. Each man received an
extensive interim medical and psychological history and physical examination at each
visit. Blood samples were collected for DNA extraction, and genome-wide genotyping

was completed for 1,231 participants. After exclusions, 155 African Americans with
genotype and phenotype data were included in the analysis. The BLSA has continuing
approval from the Institutional Review Board (IRB) of the Johns Hopkins Bayview
Medical Center, the Gerentology Research Center, and Medstar Research Institute.
Informed consent was obtained from all participants.
Bogalusa Heart Study (BHS): The BHS is a long-term epidemiologic study of
cardiovascular risk factors from birth through the age of 38 years in a biracial population
with whites and African Americans. Between 1973 and 2008, nine cross-sectional
surveys of children aged 4-17 years and 10 cross-sectional surveys of adults aged 18-
48 years, who had been previously examined as children, were conducted for
cardiovascular disease risk factor examinations in Bogalusa, Louisiana (6). In the
ongoing Longitudinal Aging Study funded by NIH and NIA since 2000, there are 1,202
Caucasian and African American participants who have been examined 4-14 times from
childhood to adulthood with DNA available for genotyping. After exclusions, 191 African
Americans with genotype and phenotype data were included in the analysis. Study
protocols were approved by the Institutional Review Board of the Tulane University
Medical Center. Informed consent was obtained from all participants.
Cardiovascular Health Study (CHS): The CHS is a population-based, longitudinal cohort
designed to study risk factors for cardiovascular disease in the elderly (7). Starting in
1989, 244 African American adults aged 65 years or older were sampled from four
United States communities (Forsyth County, North Carolina; Pittsburgh, Pennsylvania;
Sacramento County, California; and Washington County, Maryland). Between 1992 and
1993, a second cohort of 687 African Americans was enrolled. Extensive physical and
laboratory evaluations were performed at baseline to identify the presence and severity
of CVD risk factors such as hypertension, hypercholesterolemia and glucose
intolerance; subclinical disease such as carotid artery atherosclerosis, left ventricular
enlargement, and transient ischemia; and clinically overt CVD. In 2010, genotyping was
performed for 844 African-American participants who consented to genetic testing and
had available DNA. After exclusions, 674 African Americans with genotype and
phenotype data were included in the analysis. The institutional review board at each of
the study sites approved the study protocols, and written informed consent was
obtained from all participants.
Cleveland Family Study (CFS): The CFS is a family-based longitudinal study designed
to study the risk factors for sleep apnea (8). Participants include first-degree or selected
second-degree relatives of a proband with either laboratory diagnosed obstructive sleep
apnea or neighborhood control of an affected proband. ECG recordings used for the
present study were performed at the final exam cycle conducted in a Clinical Research
Unit between 2001 and 2006. Families were selected for genotyping on the basis of
genetic informativity, including multigenerational data or individuals from the extremes
of the distribution of apnea phenotype (9, 10). The 632 African Americans with available
DNA were genotyped as part of CARe. After exclusions, 267 African Americans with
genotype and phenotype data were included in the analysis. The institutional review
board approved the study, and written informed consent was obtained from all
participants.
The Health Aging and Body Composition (HABC): The Health ABC Study is a
longitudinal study of the factors that contribute to incident disability and the decline in
function of healthier older persons, with a particular emphasis on changes in body
composition in old age (11, 12). Between 1997 and 1998, 3,075 adults aged 70-79
years were recruited using mass mailings with telephone follow-up. White individuals
were identified through a random sample of Medicare-eligible residents and African
American individuals were identified from two clinical centers in Pittsburgh,
Pennsylvania, and Memphis, Tennessee. Participants had no reported difficulty in
walking a quarter of a mile, climbing 10 steps without resting, or performing mobility-
related activities of daily living. Exclusion criteria were any life-threatening condition,
participation in any research study involving medications or modification of eating or
exercise habits, plans to move from the geographical area within 3 years and difficulty in
communicating with the study personnel or cognitive impairment. The key components
of Health ABC included a baseline exam with blood specimen collection, annual follow-
up clinical exams, and phone contacts every 6 months to identify major health events
and document functional status between clinic visits. After exclusions, 1,054 African
Americans with genotype and phenotype data were included in the analysis. The
institutional review boards at both clinical centers approved the study, and written
informed consent was obtained from all participants.

The Healthy Aging in Neighborhoods of Diversity across the Life Span Study
(HANDLS): HANDLS is an interdisciplinary, community-based, prospective longitudinal
epidemiologic study examining the influences of race and socioeconomic status (SES)
on the development of age-related health disparities in overall longevity, cardiovascular
disease, and cognitive decline among socioeconomically diverse African Americans and
whites in Baltimore (13). A total of 3,722 (2200 African American and 1522 Caucasian)
participants between 30 and 64 years of age were recruited as a fixed cohort of
participants by household screenings from an area probability sample of Baltimore
based on the 2000 Census. Data were collected in two separate phases. Phase 1
consisted of screening, recruitment, a household interview (assessing
sociodemographic information and physiological and psychological chronic exposure)
and a first 24 hour recall; phase 2 consisted of an in-depth examination in a mobile
medical research vehicle (MRV) and included a second dietary assessment with a 24
hour recall, psychometric measures (e.g. for depressive symptoms and cognitive
function), anthropometric and body composition measurements. Genotyping was
performed for 1,024 participants who self-report as African Americans. After exclusions,
945 African Americans with genotype and phenotype data were included in the analysis.
The study protocol was approved by the human subjects review boards at both MedStar
Research Institute and the University of Delaware. All participants provided written
informed consent.
Jackson Heart Study (JHS): The JHS is a prospective population-based study of the
causes of the high prevalence of common complex diseases among African Americans

in the Jackson, Mississippi metropolitan area, including cardiovascular disease, type-2
diabetes, obesity, chronic kidney disease, and stroke (14). Between 2000 and 2004,
5,302 adult African American residents of a tri-county area near Jackson, Mississippi
(Hinds County, Rankin County and Madison County) were recruited from four sources,
including (1) randomly sampled households from a commercial listing; (2) ARIC
participants; (3) a structured volunteer sample that was designed to mirror the eligible
population; and (4) a nested family cohort. Unrelated participants were between 35 and
84 years old, and members of the family cohort were ≥21 years old when consent for
genetic testing was obtained and blood was drawn for DNA extraction. ECG recordings
and DNA extraction were performed at the baseline examination. Based on DNA
availability, appropriate informed consent, and genotyping results that met quality
control procedures, genotype data were available for 3,030 individuals, including 885
who were also ARIC participants. In the current study, JHS participants who were also
enrolled in the ARIC study were analyzed with the ARIC dataset. After exclusions, 1,962
African Americans with genotype and phenotype data were included in the analysis.
The institutional review board approved the study protocol, and written informed
consent was obtained from all participants.
Multi-Ethnic Study of Atherosclerosis (MESA): MESA is a multicenter, population-based
cohort initiated to investigate subclinical cardiovascular disease and the risk factors that
predict progression to clinically overt cardiovascular disease (15). Between 2000 and
2002, the study enrolled 6,814 asymptomatic males and females aged 45–84 from six
US field centers (Baltimore, MD; Chicago, IL; Los Angeles, CA; New York, NY; St. Paul,

MN; Winston-Salem, NC). Those with a history of CVD (defined as physician-diagnosed
myocardial infarction, angina, heart failure, stroke, transient ischemic attack or history of
invasive procedure for CVD) were excluded from participation. Approximately 28% of
the sample was African American participants. ECG recordings and blood for DNA
extraction were obtained at the baseline examination. After exclusions, 1,627 African
Americans with genotype and phenotype data were included in the analysis. This study
was approved by the institutional review boards of each study site, and written informed
consent was obtained from all participants.
Women’s Health Initiative (WHI): The WHI is a large and complex clinical investigation
of strategies for the prevention and control of some of the most common causes of
morbidity and mortality among postmenopausal women, including cancer,
cardiovascular disease, and osteoporotic fractures. The WHI comprises both
randomized clinical trials (CT) and an observational study (OS). This study is limited to
WHI CT participants, as ECGs were not available for WHI OS participants. The WHI
clinical trials were designed to allow randomized, controlled evaluation of estrogen with
or without progestin treatment, calcium/vitamin D supplementation, and dietary
modification on the risk of breast and colorectal cancer, cardiovascular disease, and
bone fractures (16). Between 1993 and 1998, the trials enrolled 68,132 postmenopausal
women aged 50–79 years who were followed at one of 75 US examination sites
(including satellites, remote sites, and their changes in location). Women were ineligible
if they had medical conditions predictive of survival time less than 3 years, if they were
known to have conditions inconsistent with study participation and adherence, or if they

were active participants in another randomized, controlled trial. Those who remained
eligible and interested were invited to follow-up examinations at 1, 3, 6, and 9 years. Of
the CT and OS minority participants enrolled in WHI, the WHI SNP Health Association
Resource (SHARe) GWA study project includes 12,157 (8,515 self-identified African
American and 3,642 self-identified Hispanic) women who consented to genetic
research. DNA was extracted by the Specimen Processing Laboratory at the Fred
Hutchinson Cancer research Center (FHCRC) using specimens that were collected at
enrollment. Specimens were stored at -80°C. After exclusions, 4,149 African Americans
with genotype and phenotype data were included in the analysis. Study protocols and
consent forms were approved by the Institutional Review Boards at all participating
institutions.

III. Supplemental References
1. Price AL, Patterson NJ, Plenge RM, Weinblatt ME, Shadick NA, Reich D. Principal
components analysis corrects for stratification in genome-wide association studies. Nat
Genet. 2006;38:904-909.
2. Sankararaman S, Sridhar S, Kimmel G, Halperin E. Estimating local ancestry in
admixed populations. Am J Hum Genet. 2008;82:290-303.
3. The ARIC Investigators. The Atherosclerosis Risk in Communities (ARIC) Study:
design and objectives. The ARIC investigators. Am J Epidemiol. 1989;129:687-702.
4. Shock NW. (1984). U.S. Department of Health and Human Servises.
5. Harman SM, Metter EJ, Tobin JD, Pearson J, Blackman MR. Longitudinal effects of
aging on serum total and free testosterone levels in healthy men. Baltimore Longitudinal
Study of Aging. J Clin Endocrinol Metab. 2001;86:724-731.
6. Berenson GS. Bogalusa Heart Study: a long-term community study of a rural biracial
(black/white) population. Am J Med Sci. 2001;322:267-274.
7. Fried LP, Borhani NO, Enright P, Furberg CD, Gardin JM, Kronmal RA, et al. The
Cardiovascular Health Study: design and rationale. Ann Epidemiol. 1991;1:263-276.
8. Redline S, Tishler PV, Tosteson TD, Williamson J, Kump K, Browner I, et al. The
familial aggregation of obstructive sleep apnea. Am J Respir Crit Care Med. 1995;151:
682-687.

9. Palmer LJ, Buxbaum SG, Larkin E, Patel SR, Elston RC, Tishler PV, et al. A whole-
genome scan for obstructive sleep apnea and obesity. Am J Hum Genet. 2003;72:340-
350.
10. Palmer LJ, Buxbaum SG, Larkin EK, Patel SR, Elston RC, Tishler PV, et al. Whole
genome scan for obstructive sleep apnea and obesity in African-American families. Am
J Respir Crit Care Med. 2004;169:1314-1321.
11. Visser M., Simonsick EM, Colbert LH, Brach J, Rubin SM, Kritchevsky SB, et al.
Type and intensity of activity and risk of mobility limitation: the mediating role of muscle
parameters. J Am Geriatr Soc. 2005;53:762-770.
12. Cauley JA, Danielson ME, Boudreau RM, Forrest KY, Zmuda JM, Pahor M, et al.
Inflammatory markers and incident fracture risk in older men and women: the Health
Aging and Body Composition Study. J Bone Miner Res. 2007;22:1088-1095.
13. Evans MK, Lepkowski JM, Powe NR, LaVeist T, Kuczmarski MF, Zonderman AB.
Healthy aging in neighborhoods of diversity across the life span (HANDLS): overcoming
barriers to implementing a longitudinal, epidemiologic, urban study of health, race, and
socioeconomic status. Ethn Dis. 2010;20:267-275.
14. Taylor HA Jr, Wilson JG, Jones DW, Sarpong DF, Srinivasan A, Garrison RJ, et al.
Toward resolution of cardiovascular health disparities in African Americans: design and
methods of the Jackson Heart Study. Ethn Dis. 2005;15, S6-4-17.
15. Bild DE, Bluemke DA, Burke GL, Detrano R, Diez Roux AV, Folsom AR, et al. Multi-
ethnic study of atherosclerosis: objectives and design. Am J Epidemiol. 2002;156, 871-
881.

16. Design of the Women's Health Initiative clinical trial and observational study. The
Women's Health Initiative Study Group. Control Clin Trials. 1998;19:61-109.

![Novel Stress-Inducible Antisense RNAs of Protein-Coding ...Novel Stress-Inducible Antisense RNAs of Protein-Coding Loci Are Synthesized by RNA-Dependent RNA Polymerase1[OPEN] Akihiro](https://static.fdocuments.net/doc/165x107/5e55a965d46c5e2983693af9/novel-stress-inducible-antisense-rnas-of-protein-coding-novel-stress-inducible.jpg)