Identification of Genetic Overlap and Novel Risk Loci for ...
31
1 Identification of Genetic Overlap and Novel Risk Loci for Attention-Deficit/Hyperactivity Disorder and Bipolar Disorder Kevin S O’Connell (Ph.D.) 1 , Alexey Shadrin (Ph.D.) 1 , Shahram Bahrami (Ph.D.)1, Olav B Smeland (M.D. Ph.D.) 1 , Francesco Bettella (Ph.D.) 1 , Oleksandr Frei (Ph.D.) 1 , Florian Krull (Ph.D.) 1 , Ragna B. Askeland (MS) 2 , G. Bragi Walters (B.Sc.) 11,12 , Katrín Davíðsdóttir (M.D.) 13 , Gyða S. Haraldsdóttir (Ph.D.) 13 , Ólafur Ó. Guðmundsson (M.D.) 11,12,14 , Hreinn Stefánsson (Ph.D.) 11 , Chun C Fan (M.D. Ph.D.) 3,4 , Nils Eiel Steen (M.D. Ph.D.) 1 , Ted Reichborn-Kjennerud (MD, PhD) 2,5 , Anders M Dale (Ph.D.) 3,6,7,8 , Kári Stefánsson (M.D. Ph.D.) 11,12 , Srdjan Djurovic (Ph.D.) 9,10 , Ole A Andreassen (M.D. Ph.D.) 1,7 1 NORMENT, Institute of Clinical Medicine, University of Oslo and Division of Mental Health and Addiction, Oslo University Hospital, 0407 Oslo, Norway; 2 Department of Mental Disorders, Norwegian Institute of Public Health, Oslo, Norway; 3 Department of Radiology, University of California, San Diego, La Jolla, CA 92093, United States of America; 4 Department of Cognitive Science, University of California, San Diego, La Jolla, CA, USA; 5 Institute of Clinical Medicine, University of Oslo, Oslo, Norway; 6 Center for Multimodal Imaging and Genetics, University of California San Diego, La Jolla, CA 92093, United States of America; 7 Department of Psychiatry, University of California, San Diego, La Jolla, CA, USA; 8 Department of Neurosciences, University of California San Diego, La Jolla, CA 92093, United States of America; 9 Department of Medical Genetics, Oslo University Hospital, Oslo, Norway; 10 NORMENT, Department of Clinical Science, University of Bergen, Bergen, Norway; 11 deCODE genetics/Amgen, Reykjavík, Iceland; 12 Faculty of Medicine, University of Iceland, Reykjavík, Iceland; 13 The Centre for Child Development and Behaviour, Capital Area Primary Health Care, Reykjavik, Iceland; 14 Department of Child and Adolescent Psychiatry, National University Hospital, Reykjavik, Iceland. Corresponding Authors: Kevin S O’Connell or Ole A Andreassen Kevin S O’Connell Ph.D. Ole A. Andreassen M.D. Ph.D. Postdoctoral Fellow Professor of Biological Psychiatry, Division of Mental Health and Addiction Division of Mental Health and Addiction University of Oslo and Oslo University Hospital University of Oslo and Oslo University Hospital Kirkeveien 166, 0424 Oslo, Norway Kirkeveien 166, 0424 Oslo, Norway Email: [email protected] Email: [email protected]
Transcript of Identification of Genetic Overlap and Novel Risk Loci for ...
1
Identification of Genetic Overlap and Novel Risk Loci for Attention-Deficit/Hyperactivity Disorder and Bipolar Disorder
Kevin S O’Connell (Ph.D.)1, Alexey Shadrin (Ph.D.)1, Shahram Bahrami (Ph.D.)1, Olav B Smeland (M.D. Ph.D.)1, Francesco Bettella (Ph.D.)1, Oleksandr Frei (Ph.D.)1, Florian Krull (Ph.D.)1, Ragna B. Askeland (MS)2, G. Bragi Walters (B.Sc.)11,12, Katrín Davíðsdóttir (M.D.)13, Gyða S. Haraldsdóttir (Ph.D.)13, Ólafur Ó. Guðmundsson (M.D.)11,12,14, Hreinn Stefánsson (Ph.D.)11, Chun C Fan (M.D. Ph.D.)3,4, Nils Eiel Steen (M.D. Ph.D.)1, Ted Reichborn-Kjennerud (MD, PhD)2,5, Anders M Dale (Ph.D.)3,6,7,8, Kári Stefánsson (M.D. Ph.D.)11,12, Srdjan Djurovic (Ph.D.)9,10, Ole A Andreassen (M.D. Ph.D.)1,7 1NORMENT, Institute of Clinical Medicine, University of Oslo and Division of Mental Health and Addiction, Oslo University Hospital, 0407 Oslo, Norway; 2Department of Mental Disorders, Norwegian Institute of Public Health, Oslo, Norway; 3Department of Radiology, University of California, San Diego, La Jolla, CA 92093, United States of America; 4Department of Cognitive Science, University of California, San Diego, La Jolla, CA, USA; 5Institute of Clinical Medicine, University of Oslo, Oslo, Norway; 6Center for Multimodal Imaging and Genetics, University of California San Diego, La Jolla, CA 92093, United States of America; 7Department of Psychiatry, University of California, San Diego, La Jolla, CA, USA; 8Department of Neurosciences, University of California San Diego, La Jolla, CA 92093, United States of America; 9Department of Medical Genetics, Oslo University Hospital, Oslo, Norway; 10NORMENT, Department of Clinical Science, University of Bergen, Bergen, Norway; 11deCODE genetics/Amgen, Reykjavík, Iceland; 12Faculty of Medicine, University of Iceland, Reykjavík, Iceland; 13The Centre for Child Development and Behaviour, Capital Area Primary Health Care, Reykjavik, Iceland; 14Department of Child and Adolescent Psychiatry, National University Hospital, Reykjavik, Iceland. Corresponding Authors: Kevin S O’Connell or Ole A Andreassen Kevin S O’Connell Ph.D. Ole A. Andreassen M.D. Ph.D. Postdoctoral Fellow Professor of Biological Psychiatry, Division of Mental Health and Addiction Division of Mental Health and Addiction University of Oslo and Oslo University Hospital University of Oslo and Oslo University Hospital Kirkeveien 166, 0424 Oslo, Norway Kirkeveien 166, 0424 Oslo, Norway Email: [email protected] Email: [email protected]

2
Abstract
Differential diagnosis between childhood onset attention-deficit/hyperactivity disorder (ADHD)
and bipolar disorder (BD) remains a challenge, mainly due to overlapping symptoms and high
rates of comorbidity. Despite this, genetic correlation reported for these disorders is low and non-
significant. Here we aimed to better characterize the genetic architecture of these disorders
utilizing recent large genome-wide association studies (GWAS). We analyzed independent
GWAS summary statistics for ADHD (19,099 cases and 34,194 controls) and BD (20,352 cases
and 31,358 controls) applying the conditional/conjunctional false discovery rate
(condFDR/conjFDR) statistical framework that increases the power to detect novel phenotype-
specific and shared loci by leveraging the combined power of two GWAS. We observed cross-
trait polygenic enrichment for ADHD conditioned on associations with BD, and vice versa.
Leveraging this enrichment, we identified 19 novel ADHD risk loci and 40 novel BD risk loci at
condFDR < 0.05. Further, we identified five loci jointly associated with ADHD and BD
(conjFDR < 0.05). Interestingly, these five loci show concordant directions of effect for ADHD
and BD. These results highlight a shared underlying genetic risk for ADHD and BD which may
help to explain the high comorbidity rates and difficulties in differentiating between ADHD and
BD in the clinic. Improving our understanding of the underlying genetic architecture of these
disorders may aid in the development of novel stratification tools to help reduce these diagnostic
difficulties.
3
Introduction
Attention-deficit/hyperactivity disorder (ADHD) is a neurodevelopmental disorder with a
childhood-onset and a childhood prevalence of approximately 3-5% [1, 2], with the rate of
persistence into adulthood estimated at 15-65% [3]. ADHD is associated with psychosocial
disability and societal costs [4]. The most prominent features of ADHD are attentional
dysfunction, hyperactivity and impulsivity. Affected individuals may also experience additional
neuropsychological difficulties associated with memory [5], executive functioning [6] and
emotional dysregulation [7]. In contrast to ADHD, bipolar disorder (BD) has a peak prevalence
rate in the early 20s and decreases with age thereafter [8]. This disorder affects approximately
2% of the population when considering both BD I and II types [9]. Moreover, BD is
characterized by recurrent episodes of mania and depression, affecting thought, perception,
emotion, cognitive function and social behaviour [8].
Differential diagnosis between ADHD and BD, which relies on clinical observation and
parental/school reporting, remains a challenge [10, 11]. This is due to factors such as extensive
symptom overlap, reciprocal comorbidity, as well as the overlapping range in age of onset,
retrospective parental reports and non-episodic course of BD in youths[10, 11]. It is estimated
that approximately 20% of adult patients with ADHD have comorbid BD [10], and between 10-
30% of adults affected with BD present with comorbid ADHD [12–14]. This relationship has
been confirmed in a number of epidemiological, neuroimaging and family studies, however the
mechanisms behind this association are not fully understood [15]. Given the high heritability of
these disorders [16, 17], numerous studies attempted to identify a shared genetic basis that might

4
explain the high comorbidity rate [18–20]. The complex polygenic nature of these disorders and
the limited statistical power of the available genetic studies have, however, yet provided no clear
evidence for genetic overlap.
More recently, a genome-wide cross-disorder meta-analysis of ADHD and BD, using moderately
powered GWAS samples [21, 22], identified shared risk loci for these disorders [23]. Subsequent
to these findings, GWAS studies with larger sample sizes and greater statistical power have
identified many more significant loci for both ADHD [24] and BD [25], however genome-wide
genetic correlation between these disorders was low and non-significant (rg = 0.095, p = 0.081)
[24]. One pitfall in the LD-score regression-based estimates of genome-wide genetic correlation
is that the method relies on consistent effect directions of the overlapping variants for the
phenotypes of interest [26]. Recent evidence suggests mixed patterns of effect directions for the
variants shared between diverse phenotype pairs [27–34]. Such patterns may explain the low
genome-wide genetic correlation identified between ADHD and BD, and thereby highlight the
usefulness of improved statistical approaches suitable for disentangling the complex genetic
relationship of these disorders.
The aim of the current study was to investigate the genetic relationship between ADHD and BD
by applying a conditional/conjunctional false discovery rate (condFDR/conjFDR) approach [35,
36]. This approach increases the power to detect novel phenotype-specific and shared loci by
leveraging the combined power of two GWAS, and has been used previously to identify novel
and shared loci for a number of complex traits and disorders [27, 29, 32, 35–41]. Based on the

5
clinical and epidemiological findings, we hypothesized to discover polygenic overlap as well as
shared genetic loci between ADHD and BD.
6
Methods and Materials
GWAS Samples
GWAS summary statistics for ADHD and BD were obtained from the Psychiatric Genomics
Consortium (PGC). The ADHD sample comprised 19,099 cases and 34,194 controls from 12
cohorts [24], while the BD sample comprised 32 cohorts with 20,352 cases and 31,358 controls
[25]. The BD cases included 14,879 individuals with a diagnosis of BD type I (BD1), 3,421 with
BD type II (BD2), 977 with schizoaffective disorder, bipolar type (SAB), and the remaining with
unspecified BD [25]. The Norwegian Institutional Review Board for the South-East Norway
Region has evaluated the current protocol and found that no additional institutional review board
approval was needed because no individual data were used. More detailed descriptions are
available in the Supplementary Methods and original publications [24, 25].
Statistical Analyses
We generated conditional QQ plots in order to visually assess the cross-phenotype polygenic
enrichment, conditioning ADHD on BD and vice versa. QQ plots depict the quantiles of the
observed p-values on the y-axis against the theoretical quantiles under no association on the x-
axis. Such QQ plots follow a straight line in the case of no association, but deflect from this line
when some form of systematic association is present. Conditional QQ plots depict the differential
enrichment between pre-specified strata of single nucleotide polymorphisms (SNPs). The data
points on the QQ plot are weighted according to the LD structure around the corresponding SNP.
We used n=200 iterations of random pruning with an LD threshold r2=0.1 to define LD-blocks
throughout the genome. For each iteration, only one SNP from each block was selected to

7
contribute to the p-value distribution statistics. The procedure entails the selection of a primary
trait (e.g. ADHD) and the definition of SNP strata based on a secondary conditional trait (e.g.
BD). We plotted the SNP p-values of the primary trait conditional on different strengths of
association with the secondary trait (i.e. −log10 p- values > 1, 2, or 3). This enabled us to
determine if conditioning on a secondary trait leads to stronger association in the primary trait. A
stronger enrichment together with increased evidence for association with the secondary trait can
be an indicator of a shared polygenic architecture between the two traits. As a means for
comparison, we also estimated the genetic correlation between these ADHD and BD samples
[26, 42].
To identify shared loci between ADHD and BD we employed the condFDR/conjFDR method
[35, 36]. The condFDR method utilizes genetic association summary statistics from a trait of
interest (ADHD) together with those of a conditional trait (BD) to estimate the posterior
probability that a SNP has no association with the primary trait, given that the p-values for that
SNP in both the primary and conditional traits are lower than the observed p-values. This method
increases the power to identify loci associated with the primary trait by leveraging associations
with conditional traits, thereby re-ranking SNPs compared to the original GWAS p-value
ranking. The conjFDR statistic is defined as the maximum of the two mutual condFDR values
and is a conservative estimate of the posterior probability that a SNP has no association with
either trait, given that the p-values for that SNP in both the primary and conditional traits are
lower than the observed p-values. The conjFDR method thus allows the identification of loci
associated with both traits. An FDR level of 0.05 per pair-wise comparison was set for condFDR
and conjFDR. P-values were corrected for inflation using a genomic inflation control procedure
8
[35]. All code used for carrying out the described analyses is available online
(https://github.com/precimed/pleiofdr). More details about the condFDR/conjFDR methods can
be found in the original and subsequent publications [27, 29, 32, 35–41, 43], and the
Supplementary Methods.
Genomic loci definition
Independent genomic loci were defined according to the FUMA protocol [44]. First independent
significant SNPs were identified as SNPs with condFDR/conjFDR < 0.05 and linkage
disequilibrium (LD) r2 < 0.6 with each other. A subset of these SNPs (LD r2 < 0.1) were then
selected as lead SNPs. The borders for genomic loci were then defined by identifying all
candidate SNPs in LD (r2 ≧ 0.6) with a lead SNP. Loci were merged if they were separated by
less than 250 kb. These distinct regions, containing all of these candidate SNPs, were considered
to be a single independent genomic locus. All LD information was calculated from the 1000
Genomes Project reference panel [45]. Novel risk loci were defined as those not identified
(separated by at least 250 kb) in the original GWAS samples used for these analyses [24, 25] and
not identified as risk loci for ADHD or BD in previous studies.
Functional annotation
Positional and functional annotation of all candidate SNPs, in the genomic loci with a conjFDR
value < 0.10 having an LD r2 ≧ 0.6 with one of the independent significant SNPs, was performed
using ANNOVAR [46], implemented in FUMA [44]. SNPs were also annotated with Combined
Annotation Dependent Depletion (CADD) [47] scores, which predict how deleterious the SNP
effect is on protein structure/function, RegulomeDB [48] scores, which predict the likelihood of
9
regulatory functionality, and chromatin states, which predict transcription/regulatory effects from
chromatin states at the SNP locus [49, 50]. We also identified previously reported GWAS
associations in the NHGRI-EBI catalog [51] overlapping with the identified loci. Finally, we
queried SNPs for known expression quantitative trait loci (eQTLs) in the genotype tissue
expression (GTEx) portal [52].
Evaluation of identified loci in an independent ADHD case-control cohort
To assess the robustness of the condFDR/conjFDR results we examined the most significant
SNPs in the identified loci in the association summary statistics from a case-control ADHD
cohort from deCODE Genetics (n = 10,217 cases, n = 338,344 controls). A description of this
cohort is provided in the Supplementary Methods. In order to compare SNP effect directions,
sign concordance was determined between the PGC ADHD GWAS [24] and deCODE cohorts.
Results
Genetic Overlap and Correlation
The conditional QQ plots suggest the presence of enrichment for ADHD given BD (Figure 1A),
shown by the incremental incidence of association with ADHD (leftward deflection) as a
function of the significance of association with BD. Similar and even more marked results are
observed for the reverse relationship, BD conditioned on ADHD (Figure 1B). The LD score
regression analysis is in line with the enrichment showing a positive genetic correlation between
ADHD and BD (rg 0.121, SE 0.038, p = 0.002).

10
We leveraged this cross-phenotype polygenic enrichment using condFDR analyses and re-ranked
ADHD SNPs conditionally on their association with BD, and vice versa. At condFDR < 0.05 we
identified 33 loci associated with ADHD after conditioning on BD (Supplementary Figure 1,
Supplementary Table 1), 19 of which are novel ADHD-risk loci (Table 1). When considering the
allelic effect direction for the 33 lead SNPs in these ADHD-risk loci, 23 have concordant
direction of effect with BD (Supplementary Table 1). Functional annotation of the 19 novel
ADHD-risk loci revealed that the majority are intergenic or intronic (Table 1). One lead SNP
(rs992936, CADD = 20.5) has a CADD score above the threshold score of 12.37, suggestive of
deleteriousness [47] (Supplementary Table 1). After querying the GTEx portal [52], five lead
SNPs were identified as potential eQTLs for various tissues (Supplementary Table 2). Three
were identified as eQTLs for genes within at least one brain region (Supplementary Table 2).
The inverse conditional analysis identified 94 loci associated with BD after conditioning on
ADHD (Supplementary Figure 1, Supplementary Table 3), 40 of which are novel BD-risk loci
(Table 2). When considering the allelic effect direction for the 94 lead SNPs in these BD-risk
loci, 56 have concordant direction of effect with ADHD (Supplementary Table 3). Functional
annotation revealed the majority of the 40 novel BD-risk loci to be intergenic or intronic (Table
2). Five lead SNPs were reported to have a CADD score greater than 12.37, suggestive of
deleteriousness [47], and three lead SNPs reported low RDB scores (1f, 2a and 2b) indicative of
regulatory functionality [48] (Supplementary Table 3). Querying the GTEx portal [52] for these
novel BD-risk loci identified 12 lead SNPs as potential eQTLs for genes in at least one brain
tissue (Supplementary Table 4). Further, 29 of the identified BD-risk loci overlap with lead SNPs
from the analysis of bipolar I disorder only in the original GWAS (Supplementary Table 3) [25],
11
while none of the BD-risk loci overlap with lead SNPs from the analyses of bipolar II disorder or
schizoaffective disorder–bipolar type (Supplementary Table 3) [25].
A total of five loci were jointly associated with ADHD and BD at conjFDR < 0.05 (Figure 2,
Supplementary Table 5). Two of these loci (lead SNP rs323509, 5:103671867-104082179 and
lead SNP rs11167721, 5:154772692-154984679) are novel risk loci for both ADHD and BD
(Table 3), i.e. these loci were not identified in the original GWAS studies [24, 25] and not
implicated in these disorders by previous studies. One shared locus (lead SNP rs11936939,
4:101463177-101593148) was novel for ADHD, but not BD. Two of these novel shared loci
were included in the GWAS catalog due to reported associations with anorexia nervosa [53] and
depression [54], and cognitive decline [55], respectively. Furthermore, all five shared loci have
concordant effects on ADHD and BD risk (Supplementary Table 5), and none of these loci
overlap with lead SNPs from the analyses of bipolar I disorder, bipolar II disorder or
schizoaffective disorder–bipolar type (Supplementary Tables 3 and 5) [25].
Functional annotation of all SNPs with conjFDR < 0.1 within the loci shared between ADHD
and BD revealed that all candidate SNPs (n=73) are intronic or intergenic (Supplementary Table
6). Of these 73 candidate SNPs, three SNPs (rs2431108, rs13162928, rs1956002) reported
CADD scores above the 12.37 threshold score suggestive of deleteriousness [47]. After querying
the GTEx portal [52], ten candidate SNPs, all within the same genomic locus, were identified as
potential eQTLs for the RP11-6N13.1 gene in the testis (Supplementary Table 7). Gene-set and
pathway analysis, implemented in FUMA [44], of the genes nearest to these 73 lead SNPs

12
(Supplementary Table 6 revealed no significantly enriched biological processes, cellular
components or molecular functions.
Evaluation of identified loci in an independent ADHD case-control cohort
Of the five loci shared between ADHD and BD (conjFDR < 0.05), lead SNPs within four of
these loci showed concordant effect direction between the PGC GWAS and deCODE cohorts
(Supplementary Table 5). Moreover, when considering all candidate SNPs within these five loci,
46/73 showed concordant direction of effect (Supplementary Table 6). For the ADHD-risk loci
identified by conditioning on BD (condFDR < 0.01), 19/33 of the lead SNPs within these loci
were concordant in the deCODE cohort (Supplementary Table 1). The concordance rates were
similar for the ADHD-risk loci previously identified in the PGC ADHD GWAS [24] (7/12
concordant lead SNPs), and the additional ADHD-risk loci identified in the present study (12/21
concordant lead SNPs).
Discussion
The current study identified novel ADHD and BD associated risk loci, as well as novel genetic
loci shared between these disorders, by applying the condFDR/conjFDR method to GWAS
summary statistics [24, 25]. The results provide further evidence for a shared polygenic
architecture between ADHD and BD, and therewith potential new insight into the molecular
mechanisms that may explain the high comorbidity rates and shared phenotypes between these
disorders [12, 13].
13
We observed cross-trait polygenic enrichment between ADHD and BD using conditional QQ
plots (Figure 1), supporting recent genetic evidence [23] and prior epidemiological,
neuroimaging and family studies [15]. This observed enrichment was supported by significant
positive genome-wide genetic correlation identified in this study (rg 0.121, SE 0.038, p = 0.002).
Leveraging this enrichment, we used the condFDR approach to identify 19 novel risk loci for
ADHD (Table 1) and 40 novel risk loci for BD (Table 2). Expanding on our condFDR results,
we identified five risk loci shared by ADHD and BD using the conjFDR method (Table 3), two
of which are novel risk loci for both disorders (lead SNP rs323509, 5:103671867-104082179 and
lead SNP rs11167721, 5:154772692-154984679). Remarkably, when considering the identified
genetic correlation, all of the lead and candidate SNPs within the five loci jointly associated with
ADHD and BD show concordant direction of effect for these disorders (Supplementary Table 6).
The identification of polygenic overlap between ADHD and BD, that includes agonistic SNP
effects, may have important clinical implications. These results highlight a shared underlying
genetic risk for ADHD and BD that remains to be fully characterized. Specific symptoms and/or
clinical observations common to the diagnostic criteria for these disorders may have the same
genetic causes, which may help to explain the high comorbidity rates [10, 12, 13] and difficulties
in differential diagnosis between ADHD and BD [10, 11]. Although the shared genetic loci
identified in this study all had concordant effect directions, and thus may not be useful for
stratifying between ADHD and BD affected patients, they may aid the development of novel
genetic prediction tools to identify patients at risk of comorbid ADHD and BD. Moreover, an
improved understanding of the overlapping and discrete genetic components underlying these
disorders may aid in the development of novel stratification tools to help reduce the difficulty in
correctly diagnosing affected individuals.

14
To further evaluate the shared and ADHD-associated loci, identified utilizing the data from the
PGC ADHD GWAS, we examined the lead and candidate SNPs in an independent ADHD case-
control sample. Four of the five shared loci showed consistent direction of effect in the
independent ADHD sample (Supplementary Table 5). In addition, the majority of candidate
SNPs (46/73) within these shared loci showed similarly concordant effect direction, with similar
concordance rates as described in the original PGC ADHD GWAS [24].
We identified 33 ADHD-associated risk loci after conditioning ADHD on BD. These include the
12 loci reported in the initial GWAS [24], two loci attributed to ADHD in previous studies
(Supplementary Table 1) and 19 novel risk loci (Table 1). Similarly, after conditioning BD on
ADHD, we identified 94 BD-associated risk loci. The original BD study reported 19 significant
loci in a discovery phase GWAS (data we have used in this study) and 30 significant loci in a
combined GWAS including the discovery and a replication sample. Amongst the BD-associated
loci identified in this study (Supplementary Table 3), we replicated the 19 loci identified in the
discovery phase of the original GWAS [25], as well as 15 loci only identified in the combined
analysis [25]. In addition, we identified 21 loci attributed to BD in previous studies
(Supplementary Table 3), and identify a further 40 novel BD-associated risk loci (Table 2).
These results highlight how the condFDR approach can be used to exploit GWAS summary
statistics for improved power for loci discovery.
Further analysis of the novel ADHD-associated risk loci suggests that six lead SNPs may
function as eQTLs for a number of genes in numerous tissue types (Supplementary Table 2).
Three of these SNPs (rs28535523, rs227280, rs6032660) were suggested to alter the expression

15
of nine genes in specific brain tissues, including the caudate basal ganglia, cerebellar
hemisphere, cerebellum, cortex, frontal cortex BA9 and anterior cingulate cortex BA24. Among
these differentially expressed genes, three (CD40, MANBA, LRRC37A15P) were recently
identified as likely causal genes for ADHD [56], increasing confidence that these genes play
some role in the etiology of the disorder. Both the CD40 [57] and MANBA [58] genes encode
proteins involved in the immune system providing further evidence for the hypothesis that
dysfunction of the immune system may modulate risk of psychiatric disorders [59]. In addition,
four of these genes (GPX1, AMT, RNF123, INKA1) are listed in the GWAS catalog for
associations with general intelligence and educational attainment [51], two phenotypes linked
with ADHD in epidemiological, clinical and genetic studies [37, 60–64], suggesting that these
genes may play a role in brain networks involved in behavior and cognition.
A similar eQTL analysis of the lead SNPs for the novel BD-associated risk loci identified 28
SNPs that alter the expression of 68 genes in numerous tissue types (Supplementary Table 4). Of
these, 12 SNPs were identified as eQTLs for 19 genes within 13 specific brain tissues
(Supplementary Table 4). Three SNPs (rs11917269, rs2843728, rs4886883) were identified as
eQTLs for the HYAL3 (Cortex), PLPP5 (Cerebellum) and LINGO1 (Putamen) genes,
respectively (Supplementary Table 4). These genes are indexed in the GWAS catalog for
associations with schizophrenia and autism spectrum disorder, as well as general intelligence
[51], highlighting their potential involvement in psychiatric and cognitive phenotypes.
Interestingly, SNP rs4820214 was also identified as an eQTL for the TOP3B (Cortex, frontal
cortex BA9, nucleus accumbens), TOP3BP1 (Caudate, putamen, cerebellum, cortex, spinal cord

16
cervical c-1) and PPM1F (Putamen) genes, all of which were previously implicated with ADHD
risk in the GWAS catalog [51].
One limitation of the condFDR/conjFDR approach is that it is sensitive to LD-biases intrinsic to
the association p-values. The genetic variants with more correlations to their neighbours are
more likely to tag any causal variants than more isolated variants and this could result in slightly
inflated FDR estimates. Another limitation this method inherits from the GWAS it draws upon is
that it is agnostic with regard to the specific causal variants underlying the overlapping genomic
loci. These overlapping loci could result from both shared or separate causal variants, or
“mediated pleiotropy”, where one phenotype is causative of the other [65]. Further, since the
cross-trait enrichment reflects the extent of polygenic overlap between the phenotypes as well as
the power of the two GWAS samples analyzed, this enrichment will be more difficult to detect if
the utilized GWAS samples are inadequately powered.
The current findings of shared genetic loci between ADHD and BD may suggest that there are
overlapping clinical features between ADHD and BD, suggesting that subgroups of patients with
mixed clinical features could benefit from specific interventions. In addition, it should be noted
that there is a possibility that our findings of shared genetic loci between ADHD and BD may be
the result of bias from misdiagnosis in the original GWAS studies [24, 25], i.e., that ADHD
patients were misdiagnosed as BD, or vice versa. The number of such cases is estimated to be
small due to the inclusion/exclusion criteria employed in these studies [24, 25], the low genetic
correlation between these samples (rg 0.121), and the low prevalence of the disorders. At any
rate, this highlights the need for more meticulous phenotyping across psychiatric disorders in
17
future GWAS to more accurately determine the specific genetic architecture of these complex
traits across current nosological categories [66, 67].
Moreover, another possible limitation to this study is the over-representation of BD1 (73%) in
the BD GWAS, when compared to BD2 (17%) and SAB (5%) [25]. Although none of the shared
loci between ADHD and BD overlapped with lead SNPs from the analyses of these BD-
subtypes, a number of the identified BD-risk loci were shown to overlap with lead SNPs from
the BD1 analysis (Supplementary Tables 3 and 5) [25]. This indicates a potential bias of the loci
reported in this study to be more specific to BD1 and highlights the need to better clarify the
genetic architecture of these BD-subtypes, when larger, well-powered samples become available.
Finally, we show validation of the identified shared and ADHD-associated loci in an independent
ADHD sample. Due to the smaller sample size of cases in this independent ADHD cohort, we
were not able to perform true replication analyses using the condFDR/conjFDR method. An
independent BD sample was not available for similar assessment. These results highlight the
need to replicate the loci identified in this study in large well-powered independent cohorts and
additional experimental work is needed in order to establish the functional implications of these
loci and the reported tag SNPs.
In conclusion, we observed polygenic enrichment and identified five shared loci between ADHD
and BD that may help to explain the underlying mechanisms behind the high rates of
comorbidity observed for these disorders [12, 13, 15]. We leveraged this genetic overlap and
identified 20 novel ADHD-risk loci and 53 novel BD-risk loci, and 4 loci associated with both
disorders. These findings of shared polygenic architecture despite low genome-wide genetic

18
correlation have clinical implications, suggesting genetic factors underlying the comorbidity and
overlapping phenotypes between ADHD and BD.
Acknowledgements
Funding: NIH (NS057198, EB00790); the Research Council of Norway (229129, 213837,
223273, 226971); the South-East Norway Regional Health Authority (2013-123); KG Jebsen
Foundation (SKGJ-2011-36). The authors thank the Psychiatric Genetics Consortium (PGC) for
access to GWAS data, and the many people who provided DNA samples. The authors thank
Thomas Bjella, of the Oslo University Hospital & Institute of Clinical Medicine, for support with
the database. The analyses were performed on resources provided by UNINETT Sigma2 - the
National Infrastructure for High Performance Computing and Data Storage in Norway.
Conflicts of Interest
Dr. Andreassen has received a speaker’s honorarium from Lundbeck and a consultant for
HealthLytix Inc. Dr. Dale reports that he is a Founder of and holds equity in CorTechs Labs,
Inc., and serves on its Scientific Advisory Board. He is a member of the Scientific Advisory
Board of Human Longevity, Inc. He receives funding through research grants from GE
Healthcare to UCSD. The terms of these arrangements have been reviewed by and approved by
UCSD in accordance with its conflict of interest policies. G.B.W., O.O.G., H.S. and K.S. are
employees of deCODE genetics/Amgen. The other authors have no conflicts of interest to
declare.
Supplementary information is available at MP’s website

19
20
References
1. Franke B, Michelini G, Asherson P, Banaschewski T, Bilbow A, Buitelaar JK, et al. Live fast, die young? A review on the developmental trajectories of ADHD across the lifespan. Eur Neuropsychopharmacol. 2018;28:1059–1088.
2. Polanczyk GV, Salum GA, Sugaya LS, Caye A, Rohde LA. Annual research review: A meta-analysis of the worldwide prevalence of mental disorders in children and adolescents. J Child Psychol Psychiatry. 2015;56:345–365.
3. Faraone SV, Biederman J, Mick E. The age-dependent decline of attention deficit hyperactivity disorder: a meta-analysis of follow-up studies. Psychol Med. 2006;36:159–165.
4. Bálint S, Czobor P, Komlósi S, Mészáros A, Simon V, Bitter I. Attention deficit hyperactivity disorder (ADHD): gender- and age-related differences in neurocognition. Psychol Med. 2009;39:1337–1345.
5. Ossmann JM, Mulligan NW. Inhibition and attention deficit hyperactivity disorder in adults. Am J Psychol. 2003;116:35–50.
6. Boonstra AM, Oosterlaan J, Sergeant JA, Buitelaar JK. Executive functioning in adult ADHD: a meta-analytic review. Psychol Med. 2005;35:1097–1108.
7. Retz W, Stieglitz R-D, Corbisiero S, Retz-Junginger P, Rösler M. Emotional dysregulation in adult ADHD: What is the empirical evidence? Expert Rev Neurother. 2012;12:1241–1251.
8. Ferrari AJ, Stockings E, Khoo J-P, Erskine HE, Degenhardt L, Vos T, et al. The prevalence and burden of bipolar disorder: findings from the Global Burden of Disease Study 2013. Bipolar Disord. 2016;18:440–450.
9. Akiskal HS, Bourgeois ML, Angst J, Post R, Möller H, Hirschfeld R. Re-evaluating the prevalence of and diagnostic composition within the broad clinical spectrum of bipolar disorders. J Affect Disord. 2000;59 Suppl 1:S5–S30.
10. Brus MJ, Solanto MV, Goldberg JF. Adult ADHD vs. bipolar disorder in the DSM-5 era: a challenging differentiation for clinicians. J Psychiatr Pract. 2014;20:428–437.
11. Marangoni C, De Chiara L, Faedda GL. Bipolar disorder and ADHD: comorbidity and diagnostic distinctions. Curr Psychiatry Rep. 2015;17:604.
12. Wingo AP, Ghaemi SN. A systematic review of rates and diagnostic validity of comorbid adult attention-deficit/hyperactivity disorder and bipolar disorder. J Clin Psychiatry. 2007;68:1776–1784.
13. Torres I, Gómez N, Colom F, Jiménez E, Bosch R, Bonnín CM, et al. Bipolar disorder with comorbid attention-deficit and hyperactivity disorder. Main clinical features and clues for an accurate diagnosis. Acta Psychiatr Scand. 2015;132:389–399.
14. Pinna M, Visioli C, Rago CM, Manchia M, Tondo L, Baldessarini RJ. Attention deficit-hyperactivity disorder in adult bipolar disorder patients. J Affect Disord. 2019;243:391–396.
15. Larsson H, Rydén E, Boman M, Långström N, Lichtenstein P, Landén M. Risk of bipolar disorder and schizophrenia in relatives of people with attention-deficit hyperactivity disorder. Br J Psychiatry. 2013;203:103–106.
16. Faraone SV, Larsson H. Genetics of attention deficit hyperactivity disorder. Mol Psychiatry. 2018. 11 June 2018. https://doi.org/10.1038/s41380-018-0070-0.
17. Shih RA, Belmonte PL, Zandi PP. A review of the evidence from family, twin and adoption studies for a genetic contribution to adult psychiatric disorders. Int Rev Psychiatry. 2004;16:260–283.
18. Cross-Disorder Group of the Psychiatric Genomics Consortium, Lee SH, Ripke S, Neale BM, Faraone SV, Purcell SM, et al. Genetic relationship between five psychiatric disorders estimated from genome-wide SNPs. Nat Genet. 2013;45:984–994.

21
19. Landaas ET, Johansson S, Halmøy A, Oedegaard KJ, Fasmer OB, Haavik J. Bipolar disorder risk alleles in adult ADHD patients. Genes Brain Behav. 2011;10:418–423.
20. Schimmelmann BG, Hinney A, Scherag A, Pütter C, Pechlivanis S, Cichon S, et al. Bipolar disorder risk alleles in children with ADHD. J Neural Transm (Vienna). 2013;120:1611–1617.
21. Neale BM, Medland SE, Ripke S, Asherson P, Franke B, Lesch K-P, et al. Meta-analysis of genome-wide association studies of attention-deficit/hyperactivity disorder. J Am Acad Child Adolesc Psychiatry. 2010;49:884–897.
22. Psychiatric GWAS Consortium Bipolar Disorder Working Group. Large-scale genome-wide association analysis of bipolar disorder identifies a new susceptibility locus near ODZ4. Nat Genet. 2011;43:977–983.
23. van Hulzen KJE, Scholz CJ, Franke B, Ripke S, Klein M, McQuillin A, et al. Genetic Overlap Between Attention-Deficit/Hyperactivity Disorder and Bipolar Disorder: Evidence From Genome-wide Association Study Meta-analysis. Biol Psychiatry. 2017;82:634–641.
24. Demontis D, Walters RK, Martin J, Mattheisen M, Als TD, Agerbo E, et al. Discovery of the first genome-wide significant risk loci for attention deficit/hyperactivity disorder. Nat Genet. 2019;51:63–75.
25. Stahl EA, Breen G, Forstner AJ, McQuillin A, Ripke S, Trubetskoy V, et al. Genome-wide association study identifies 30 loci associated with bipolar disorder. Nat Genet. 2019;51:793–803.
26. Bulik-Sullivan BK, Finucane HK, Anttila V, Gusev A, Day FR, Loh P-R, et al. An atlas of genetic correlations across human diseases and traits. Nat Genet. 2015;47:1236–1241.
27. Smeland OB, Wang Y, Frei O, Li W, Hibar DP, Franke B, et al. Genetic Overlap Between Schizophrenia and Volumes of Hippocampus, Putamen, and Intracranial Volume Indicates Shared Molecular Genetic Mechanisms. Schizophr Bull. 2018;44:854–864.
28. Lee PH, Baker JT, Holmes AJ, Jahanshad N, Ge T, Jung J-Y, et al. Partitioning heritability analysis reveals a shared genetic basis of brain anatomy and schizophrenia. Mol Psychiatry. 2016;21:1680–1689.
29. Smeland OB, Bahrami S, Frei O, Shadrin A, O’Connell K, Savage J, et al. Genome-wide analysis reveals extensive genetic overlap between schizophrenia, bipolar disorder, and intelligence. Mol Psychiatry. 2019. 4 January 2019. https://doi.org/10.1038/s41380-018-0332-x.
30. Schmitt J, Schwarz K, Baurecht H, Hotze M, Fölster-Holst R, Rodríguez E, et al. Atopic dermatitis is associated with an increased risk for rheumatoid arthritis and inflammatory bowel disease, and a decreased risk for type 1 diabetes. J Allergy Clin Immunol. 2016;137:130–136.
31. Baurecht H, Hotze M, Brand S, Büning C, Cormican P, Corvin A, et al. Genome-wide comparative analysis of atopic dermatitis and psoriasis gives insight into opposing genetic mechanisms. Am J Hum Genet. 2015;96:104–120.
32. Smeland OB, Frei O, Kauppi K, Hill WD, Li W, Wang Y, et al. Identification of Genetic Loci Jointly Influencing Schizophrenia Risk and the Cognitive Traits of Verbal-Numerical Reasoning, Reaction Time, and General Cognitive Function. JAMA Psychiatry. 2017;74:1065–1075.
33. Bansal V, Mitjans M, Burik C a. P, Linnér RK, Okbay A, Rietveld CA, et al. Genome-wide association study results for educational attainment aid in identifying genetic heterogeneity of schizophrenia. Nat Commun. 2018;9:3078.
34. Bipolar Disorder and Schizophrenia Working Group of the Psychiatric Genomics Consortium. Genomic Dissection of Bipolar Disorder and Schizophrenia, Including 28 Subphenotypes. Cell. 2018;173:1705-1715.e16.

22
35. Andreassen OA, Djurovic S, Thompson WK, Schork AJ, Kendler KS, O’Donovan MC, et al. Improved detection of common variants associated with schizophrenia by leveraging pleiotropy with cardiovascular-disease risk factors. Am J Hum Genet. 2013;92:197–209.
36. Andreassen OA, Thompson WK, Dale AM. Boosting the Power of Schizophrenia Genetics by Leveraging New Statistical Tools. Schizophr Bull. 2013;40:13–17.
37. Shadrin AA, Smeland OB, Zayats T, Schork AJ, Frei O, Bettella F, et al. Novel Loci Associated With Attention-Deficit/Hyperactivity Disorder Are Revealed by Leveraging Polygenic Overlap With Educational Attainment. J Am Acad Child Adolesc Psychiatry. 2018;57:86–95.
38. Le Hellard S, Wang Y, Witoelar A, Zuber V, Bettella F, Hugdahl K, et al. Identification of Gene Loci That Overlap Between Schizophrenia and Educational Attainment. Schizophr Bull. 2017;43:654–664.
39. Desikan RS, Schork AJ, Wang Y, Thompson WK, Dehghan A, Ridker PM, et al. Polygenic Overlap Between C-Reactive Protein, Plasma Lipids, and Alzheimer Disease. Circulation. 2015;131:2061–2069.
40. Karch CM, Wen N, Fan CC, Yokoyama JS, Kouri N, Ross OA, et al. Selective Genetic Overlap Between Amyotrophic Lateral Sclerosis and Diseases of the Frontotemporal Dementia Spectrum. JAMA Neurol. 2018;75:860–875.
41. Witoelar A, Jansen IE, Wang Y, Desikan RS, Gibbs JR, Blauwendraat C, et al. Genome-wide Pleiotropy Between Parkinson Disease and Autoimmune Diseases. JAMA Neurol. 2017;74:780–792.
42. Bulik-Sullivan BK, Loh P-R, Finucane HK, Ripke S, Yang J, Schizophrenia Working Group of the Psychiatric Genomics Consortium, et al. LD Score regression distinguishes confounding from polygenicity in genome-wide association studies. Nat Genet. 2015;47:291–295.
43. Smeland OB, Frei O, Shadrin A, O’Connell K, Fan C-C, Bahrami S, et al. Discovery of shared genomic loci using the conditional false discovery rate approach. Hum Genet. 2019. 13 September 2019. https://doi.org/10.1007/s00439-019-02060-2.
44. Watanabe K, Taskesen E, Bochoven A van, Posthuma D. Functional mapping and annotation of genetic associations with FUMA. Nature Communications. 2017;8:1826.
45. The 1000 Genomes Project Consortium. A global reference for human genetic variation. Nature. 2015;526:68–74.
46. Wang K, Li M, Hakonarson H. ANNOVAR: functional annotation of genetic variants from high-throughput sequencing data. Nucleic Acids Res. 2010;38:e164.
47. Kircher M, Witten DM, Jain P, O’Roak BJ, Cooper GM, Shendure J. A general framework for estimating the relative pathogenicity of human genetic variants. Nat Genet. 2014;46:310–315.
48. Boyle AP, Hong EL, Hariharan M, Cheng Y, Schaub MA, Kasowski M, et al. Annotation of functional variation in personal genomes using RegulomeDB. Genome Res. 2012;22:1790–1797.
49. Roadmap Epigenomics Consortium, Kundaje A, Meuleman W, Ernst J, Bilenky M, Yen A, et al. Integrative analysis of 111 reference human epigenomes. Nature. 2015;518:317–330.
50. Zhu Z, Zhang F, Hu H, Bakshi A, Robinson MR, Powell JE, et al. Integration of summary data from GWAS and eQTL studies predicts complex trait gene targets. Nat Genet. 2016;48:481–487.
51. MacArthur J, Bowler E, Cerezo M, Gil L, Hall P, Hastings E, et al. The new NHGRI-EBI Catalog of published genome-wide association studies (GWAS Catalog). Nucleic Acids Res. 2017;45:D896–D901.
52. GTEx Consortium. The Genotype-Tissue Expression (GTEx) project. Nat Genet. 2013;45:580–585.
23
53. Duncan L, Yilmaz Z, Gaspar H, Walters R, Goldstein J, Anttila V, et al. Significant Locus and Metabolic Genetic Correlations Revealed in Genome-Wide Association Study of Anorexia Nervosa. Am J Psychiatry. 2017;174:850–858.
54. Hek K, Demirkan A, Lahti J, Terracciano A, Teumer A, Cornelis MC, et al. A genome-wide association study of depressive symptoms. Biol Psychiatry. 2013;73:667–678.
55. Raj T, Chibnik LB, McCabe C, Wong A, Replogle JM, Yu L, et al. Genetic architecture of age-related cognitive decline in African Americans. Neurol Genet. 2017;3:e125.
56. Fahira A, Li Z, Liu N, Shi Y. Prediction of causal genes and gene expression analysis of attention-deficit hyperactivity disorder in the different brain region, a comprehensive integrative analysis of ADHD. Behav Brain Res. 2019;364:183–192.
57. Grewal IS, Flavell RA. CD40 and CD154 in cell-mediated immunity. Annu Rev Immunol. 1998;16:111–135.
58. Hitomi Y, Nakatani K, Kojima K, Nishida N, Kawai Y, Kawashima M, et al. NFKB1 and MANBA Confer Disease-Susceptibility to Primary Biliary Cholangitis via Independent Putative Primary Functional Variants. Cell Mol Gastroenterol Hepatol. 2018. 4 December 2018. https://doi.org/10.1016/j.jcmgh.2018.11.006.
59. Jones KA, Thomsen C. The role of the innate immune system in psychiatric disorders. Mol Cell Neurosci. 2013;53:52–62.
60. Claesdotter E, Cervin M, Åkerlund S, Råstam M, Lindvall M. The effects of ADHD on cognitive performance. Nord J Psychiatry. 2018;72:158–163.
61. Strine TW, Lesesne CA, Okoro CA, McGuire LC, Chapman DP, Balluz LS, et al. Emotional and behavioral difficulties and impairments in everyday functioning among children with a history of attention-deficit/hyperactivity disorder. Prev Chronic Dis. 2006;3:A52.
62. Czamara D, Tiesler CMT, Kohlböck G, Berdel D, Hoffmann B, Bauer C-P, et al. Children with ADHD symptoms have a higher risk for reading, spelling and math difficulties in the GINIplus and LISAplus cohort studies. PLoS ONE. 2013;8:e63859.
63. Korrel H, Mueller KL, Silk T, Anderson V, Sciberras E. Research Review: Language problems in children with Attention-Deficit Hyperactivity Disorder - a systematic meta-analytic review. J Child Psychol Psychiatry. 2017;58:640–654.
64. Voigt RG, Katusic SK, Colligan RC, Killian JM, Weaver AL, Barbaresi WJ. Academic Achievement in Adults with a History of Childhood Attention-Deficit/Hyperactivity Disorder: A Population-Based Prospective Study. J Dev Behav Pediatr. 2017;38:1–11.
65. Solovieff N, Cotsapas C, Lee PH, Purcell SM, Smoller JW. Pleiotropy in complex traits: challenges and strategies. Nat Rev Genet. 2013;14:483–495.
66. Smoller JW, Andreassen OA, Edenberg HJ, Faraone SV, Glatt SJ, Kendler KS. Psychiatric genetics and the structure of psychopathology. Mol Psychiatry. 2019;24:409–420.
67. Sullivan PF, Agrawal A, Bulik CM, Andreassen OA, Børglum AD, Breen G, et al. Psychiatric Genomics: An Update and an Agenda. Am J Psychiatry. 2018;175:15–27.
68. Weber H, Kittel-Schneider S, Gessner A, Domschke K, Neuner M, Jacob CP, et al. Cross-disorder analysis of bipolar risk genes: further evidence of DGKH as a risk gene for bipolar disorder, but also unipolar depression and adult ADHD. Neuropsychopharmacology. 2011;36:2076–2085.
69. Jiang Y, Zhang H. Propensity Score-Based Nonparametric Test Revealing Genetic Variants Underlying Bipolar Disorder. Genet Epidemiol. 2011;35:125–132.
70. Scott LJ, Muglia P, Kong XQ, Guan W, Flickinger M, Upmanyu R, et al. Genome-wide association and meta-analysis of bipolar disorder in individuals of European ancestry. Proc Natl Acad Sci USA. 2009;106:7501–7506.
71. Pickard BS, Christoforou A, Thomson PA, Fawkes A, Evans KL, Morris SW, et al. Interacting haplotypes at the NPAS3 locus alter risk of schizophrenia and bipolar disorder. Mol Psychiatry. 2009;14:874–884.

24
72. Nurnberger JI, Koller DL, Jung J, Edenberg HJ, Foroud T, Guella I, et al. Identification of pathways for bipolar disorder: a meta-analysis. JAMA Psychiatry. 2014;71:657–664.

25
Figure Legends
Figure 1. Conditional QQ plots showing cross-phenotype polygenic enrichment between
attention deficit/hyperactivity disorder (ADHD) and bipolar disorder (BD). Plotted are the
nominal vs empirical −log10 p-values (corrected for inflation) for the trait of interest, below the
standard genome-wide association study threshold of p < 5.0 × 10⁻⁸, as a function of significance
of association with the conditional trait at the level of p ≤ 0.10, p ≤ 0.01 and p ≤ 0.001. The
dashed lines indicate the null hypothesis. (A) ADHD is the trait of interest and is conditioned on
BD. (B) BD is the trait of interest and is conditioned on ADHD.
Figure 2. Common genetic variants jointly associated with attention deficit/hyperactivity
disorder (ADHD) and bipolar disorder (BD) at conjunctional false discovery rate (conjFDR) <
0.05. Manhattan plot showing the –log10 transformed conjFDR values for each SNP on the y-
axis and chromosomal positions along the x-axis. The dotted horizontal line represents the
threshold for significant shared associations (conjFDR < 0.05). Independent lead SNPs are
encircled in black, and are annotated to the nearest gene. Further details for these shared loci are
provided in Supplementary Table 5 and 7. * Loci previously identified for ADHD [24, 68]
and/or BD [69–72].
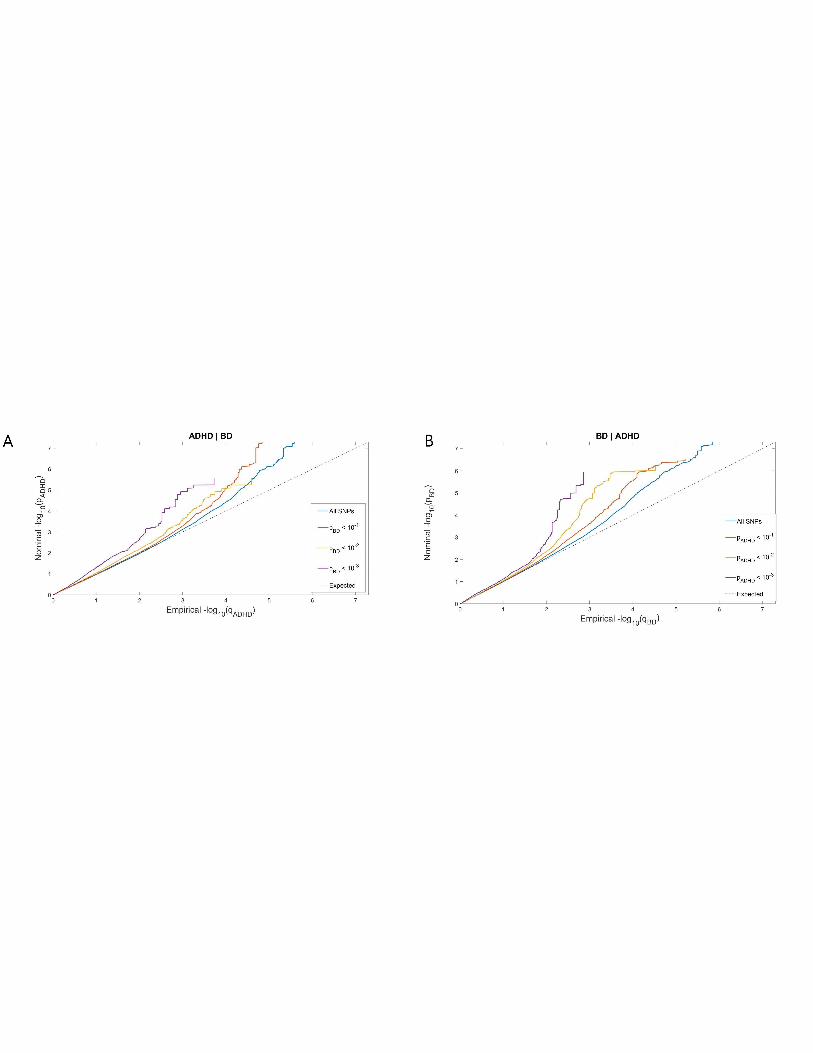

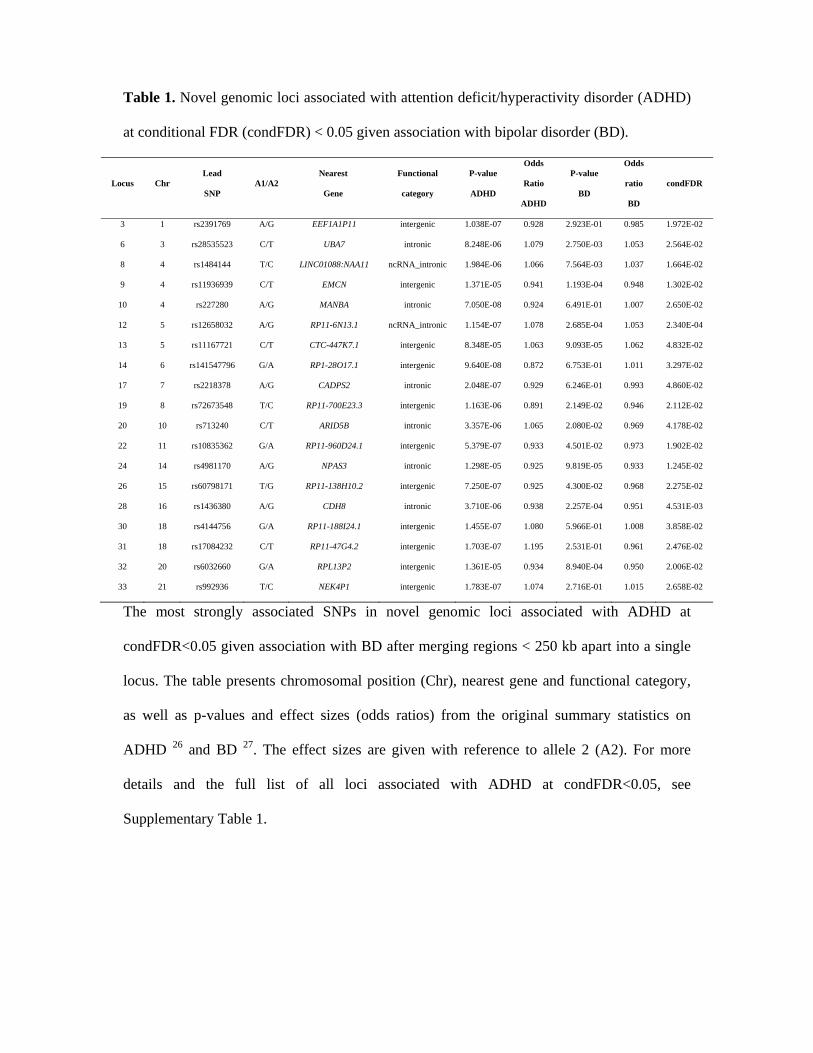
Table 1. Novel genomic loci associated with attention deficit/hyperactivity disorder (ADHD)
at conditional FDR (condFDR) < 0.05 given association with bipolar disorder (BD).
Locus Chr Lead
SNP A1/A2
Nearest
Gene Functional
category P-value
ADHD
Odds
Ratio
ADHD
P-value
BD
Odds
ratio
BD
condFDR
3 1 rs2391769 A/G EEF1A1P11 intergenic 1.038E-07 0.928 2.923E-01 0.985 1.972E-02
6 3 rs28535523 C/T UBA7 intronic 8.248E-06 1.079 2.750E-03 1.053 2.564E-02
8 4 rs1484144 T/C LINC01088:NAA11 ncRNA_intronic 1.984E-06 1.066 7.564E-03 1.037 1.664E-02
9 4 rs11936939 C/T EMCN intergenic 1.371E-05 0.941 1.193E-04 0.948 1.302E-02
10 4 rs227280 A/G MANBA intronic 7.050E-08 0.924 6.491E-01 1.007 2.650E-02
12 5 rs12658032 A/G RP11-6N13.1 ncRNA_intronic 1.154E-07 1.078 2.685E-04 1.053 2.340E-04
13 5 rs11167721 C/T CTC-447K7.1 intergenic 8.348E-05 1.063 9.093E-05 1.062 4.832E-02
14 6 rs141547796 G/A RP1-28O17.1 intergenic 9.640E-08 0.872 6.753E-01 1.011 3.297E-02
17 7 rs2218378 A/G CADPS2 intronic 2.048E-07 0.929 6.246E-01 0.993 4.860E-02
19 8 rs72673548 T/C RP11-700E23.3 intergenic 1.163E-06 0.891 2.149E-02 0.946 2.112E-02
20 10 rs713240 C/T ARID5B intronic 3.357E-06 1.065 2.080E-02 0.969 4.178E-02
22 11 rs10835362 G/A RP11-960D24.1 intergenic 5.379E-07 0.933 4.501E-02 0.973 1.902E-02
24 14 rs4981170 A/G NPAS3 intronic 1.298E-05 0.925 9.819E-05 0.933 1.245E-02
26 15 rs60798171 T/G RP11-138H10.2 intergenic 7.250E-07 0.925 4.300E-02 0.968 2.275E-02
28 16 rs1436380 A/G CDH8 intronic 3.710E-06 0.938 2.257E-04 0.951 4.531E-03
30 18 rs4144756 G/A RP11-188I24.1 intergenic 1.455E-07 1.080 5.966E-01 1.008 3.858E-02
31 18 rs17084232 C/T RP11-47G4.2 intergenic 1.703E-07 1.195 2.531E-01 0.961 2.476E-02
32 20 rs6032660 G/A RPL13P2 intergenic 1.361E-05 0.934 8.940E-04 0.950 2.006E-02
33 21 rs992936 T/C NEK4P1 intergenic 1.783E-07 1.074 2.716E-01 1.015 2.658E-02
The most strongly associated SNPs in novel genomic loci associated with ADHD at
condFDR<0.05 given association with BD after merging regions < 250 kb apart into a single
locus. The table presents chromosomal position (Chr), nearest gene and functional category,
as well as p-values and effect sizes (odds ratios) from the original summary statistics on
ADHD 26 and BD 27. The effect sizes are given with reference to allele 2 (A2). For more
details and the full list of all loci associated with ADHD at condFDR<0.05, see
Supplementary Table 1.

Table 2. Novel genomic loci associated with bipolar disorder (BD) at conditional FDR
(condFDR) < 0.05 given association with attention deficit/hyperactivity disorder (ADHD).
Locus Chr Lead
SNP A1/A2
Nearest
Gene Functional
category P-value
BD
Odds
Ratio
BD
P-value
ADHD
Odds
ratio
ADHD
condFDR
1 1 rs1278516 G/A RP5-850O15.4 intergenic 5.558E-07 0.893 2.745E-02 1.049 8.622E-03
3 1 rs12563424 T/C TMEM56 intergenic 5.293E-07 0.933 9.061E-02 0.977 1.796E-02
5 1 rs80148877 T/C RP4-640E24.1 intergenic 1.092E-06 0.860 1.495E-01 1.045 3.618E-02
6 1 rs4652746 G/A AL513344.1 intergenic 1.458E-06 1.096 8.772E-02 1.034 3.168E-02
7 1 rs7550853 A/C SMYD3 intronic 1.499E-05 0.936 1.176E-02 0.962 4.128E-02
8 2 rs5015511 G/A AC068490.2 ncRNA_intronic 1.122E-04 1.054 1.095E-04 1.057 3.928E-02
14 2 rs12621381 A/C snoU13 intergenic 9.798E-07 0.934 4.141E-03 0.962 3.756E-03
18 3 rs11917269 G/T CACNA2D2 intronic 1.322E-06 0.926 8.249E-03 0.958 7.084E-03
20 3 rs3774608 G/A CACNA1D intronic 7.716E-06 0.940 1.068E-02 1.036 2.604E-02
21 3 rs62252499 A/G CADM2 intronic 7.247E-05 1.063 1.557E-03 1.045 4.577E-02
23 3 rs6767302 A/G HMGN2P25 downstream 2.123E-07 1.073 4.113E-01 1.011 2.796E-02
24 3 rs55657715 A/G ATP11B intronic 6.111E-05 0.945 1.254E-03 1.047 3.741E-02
26 4 rs6829845 A/G IL21 intergenic 2.940E-07 1.076 9.240E-03 0.964 2.756E-03
30 5 rs7707252 A/G Y_RNA intergenic 2.987E-05 0.940 3.143E-04 1.056 1.386E-02
32 5 rs323509 A/C RP11-6N13.1 ncRNA_intronic 8.940E-06 1.067 1.655E-06 1.073 5.345E-03
35 5 rs9324815 A/G CTC-447K7.1 downstream 2.516E-05 0.942 3.118E-04 0.950 1.214E-02
42 7 rs6947663 G/A AC007652.1 ncRNA_intronic 3.947E-05 0.943 4.002E-03 1.043 4.494E-02
43 7 rs12538191 G/A RP4-647J21.1 intergenic 1.461E-07 0.909 9.158E-02 1.033 8.453E-03
45 7 rs73147614 G/A SMURF1 intronic 3.544E-05 0.838 4.694E-03 1.108 4.515E-02
50 8 rs2843728 C/T RP11-90P5.2 ncRNA_intronic 2.918E-06 0.934 1.272E-02 0.965 1.545E-02
51 8 rs10505139 A/G RP11-403P13.1 intergenic 6.337E-07 0.915 1.940E-01 0.977 3.115E-02
52 8 rs57957974 C/A PARP10 intronic 4.977E-07 1.076 2.120E-01 1.018 2.881E-02
53 9 rs57298275 T/C ANP32B intronic 3.392E-05 1.060 7.689E-04 1.047 1.993E-02
54 9 rs113314512 G/A RP11-6F6.1 intergenic 3.268E-05 1.174 3.734E-03 1.133 3.871E-02
55 9 rs10120508 G/A RP11-295D22.1 intergenic 9.078E-07 0.930 2.475E-01 1.018 4.293E-02
56 10 rs7915021 C/T ST8SIA6 intronic 6.859E-07 0.906 9.293E-02 0.967 2.119E-02
68 12 rs17680262 C/T TCHP UTR3 6.714E-06 1.115 2.196E-02 0.945 3.553E-02
69 14 rs72673100 C/A LINC00641 ncRNA_exonic 1.769E-06 0.931 1.134E-01 0.974 4.068E-02
74 15 rs4886883 A/G RP11-307C19.2 ncRNA_intronic 1.604E-05 0.942 5.222E-03 1.040 2.862E-02
77 16 rs58867145 C/T RP11-266L9.5 intergenic 2.192E-05 1.073 1.087E-03 1.059 1.676E-02
78 16 rs976498 C/T RP11-439I14.2 intergenic 6.602E-07 1.098 1.721E-01 1.025 2.971E-02
79 16 rs10492859 A/G CDH13:RP11-22H5.2 ncRNA_intronic 4.454E-06 1.076 4.385E-02 1.033 4.101E-02
80 17 rs2302776 A/G MED24 intronic 9.222E-07 1.070 2.283E-01 1.017 4.144E-02
81 17 rs7217151 C/T UTP18 intronic 4.378E-07 1.071 3.532E-01 1.013 3.618E-02
84 19 rs3843751 C/T SLC44A2 intronic 1.602E-07 1.079 1.996E-01 0.981 1.508E-02
86 19 rs56332086 C/T ZNF584 ncRNA_exonic 2.753E-05 0.930 7.121E-03 0.957 4.668E-02
90 20 rs12624433 G/A SLC12A5 intronic 7.448E-05 1.063 1.056E-03 1.052 4.036E-02
91 20 rs1850 T/C RP5-955M13.4:KCNG1 ncRNA_intronic 1.490E-07 0.927 6.569E-01 1.006 3.202E-02
92 20 rs6090435 G/A RP4-697K14.3 upstream 4.393E-07 0.927 4.019E-01 0.988 3.907E-02
93 22 rs4820214 C/T KB-1027C11.4 intergenic 6.717E-07 0.935 1.154E-01 0.978 2.383E-02
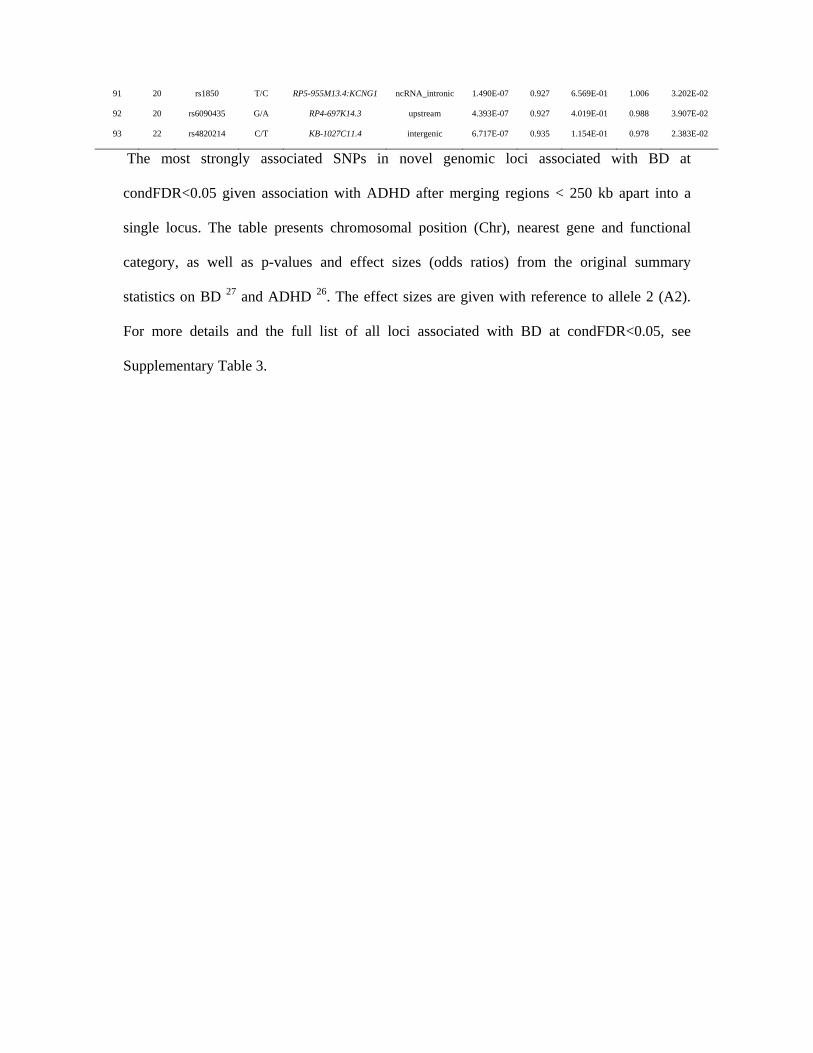
The most strongly associated SNPs in novel genomic loci associated with BD at
condFDR<0.05 given association with ADHD after merging regions < 250 kb apart into a
single locus. The table presents chromosomal position (Chr), nearest gene and functional
category, as well as p-values and effect sizes (odds ratios) from the original summary
statistics on BD 27 and ADHD 26. The effect sizes are given with reference to allele 2 (A2).
For more details and the full list of all loci associated with BD at condFDR<0.05, see
Supplementary Table 3.
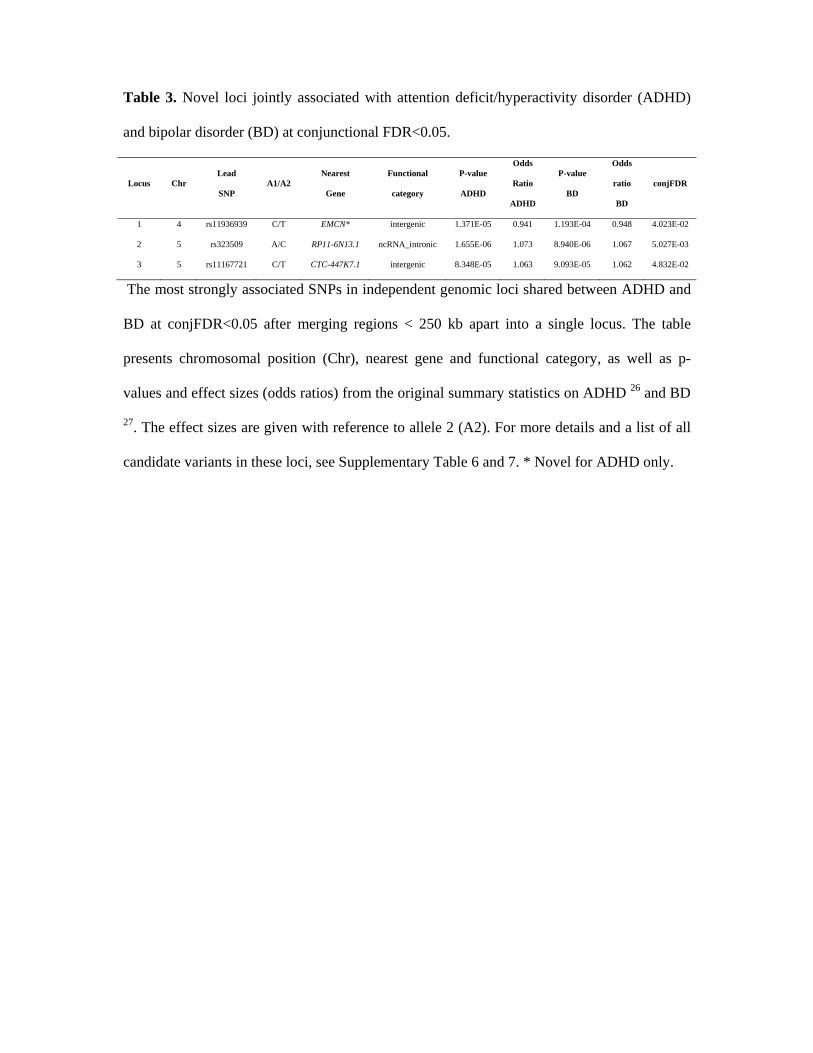
Table 3. Novel loci jointly associated with attention deficit/hyperactivity disorder (ADHD)
and bipolar disorder (BD) at conjunctional FDR<0.05.
Locus Chr Lead
SNP A1/A2
Nearest
Gene Functional
category P-value
ADHD
Odds
Ratio
ADHD
P-value
BD
Odds
ratio
BD conjFDR
1 4 rs11936939 C/T EMCN* intergenic 1.371E-05 0.941 1.193E-04 0.948 4.023E-02
2 5 rs323509 A/C RP11-6N13.1 ncRNA_intronic 1.655E-06 1.073 8.940E-06 1.067 5.027E-03
3 5 rs11167721 C/T CTC-447K7.1 intergenic 8.348E-05 1.063 9.093E-05 1.062 4.832E-02
The most strongly associated SNPs in independent genomic loci shared between ADHD and
BD at conjFDR<0.05 after merging regions < 250 kb apart into a single locus. The table
presents chromosomal position (Chr), nearest gene and functional category, as well as p-
values and effect sizes (odds ratios) from the original summary statistics on ADHD 26 and BD
27. The effect sizes are given with reference to allele 2 (A2). For more details and a list of all
candidate variants in these loci, see Supplementary Table 6 and 7. * Novel for ADHD only.