Nova Scotia Public Service Superannuation Plan
15
Nova Scotia Public Service Superannuation Plan Annual Report March 31, 2010
Transcript of Nova Scotia Public Service Superannuation Plan

Nova Scotia Public Service Superannuation Plan
Annual Report March 31, 2010

M a r c h 3 1 , 2 0 1 0
Pa g e i N o v a S c o t i a P u b l i c S e r v i c e S u p e r a n n u a t i o n P l a n
Table of ContentsMessage from the Minister of Finance .......................................................................................................1
Plan Governance ....................................................................................................................................2
Member Services .......................................................................................................................2
At a Glance ...........................................................................................................................................3
Net Assets Available for Benefits .................................................................................................3 Index Returns ............................................................................................................................3 Investment Performance .............................................................................................................3 Asset Mix ..................................................................................................................................4 Top 20 Public Equity Holdings .....................................................................................................4
Investment Management - Discussion and Analysis ....................................................................................5
Introduction ...............................................................................................................................5 Asset Mix ..................................................................................................................................5 Investment Performance .............................................................................................................6 Economic and Capital Market Briefing ..........................................................................................7 Investment Accomplishments within 2009/10 ...............................................................................9 Investment Themes in 2010/11 ..................................................................................................9
Plan Valuation .....................................................................................................................................10
Funded Ratio ...........................................................................................................................10 Unfunded Liability ....................................................................................................................10
Member Profile - Public Service Superannuation Plan ...............................................................................11
Member and Pensioner Administration ....................................................................................................12
Change in Active Member & Pensioner Membership .....................................................................12 Employee & Employer Contributions ...........................................................................................12 Pensions Paid ..........................................................................................................................12

M a r c h 3 1 , 2 0 1 0
A n n u a l R e p o r t M a r c h 3 1 , 2 0 1 0 Pa g e 1
NOVA SCOTIA
Finance Office of the Minister
PO Box 187, Halifax, Nova Scotia, Canada B3J 2N3 • Telephone 902 424-5720 Fax 902 424-0635 • www.gov.ns.ca
June 21, 2010
To: The Members and Beneficiaries of the Nova Scotia Public Service Superannuation Plan
As trustee of the Public Service Superannuation Plan, I am pleased to present for your information the annual report of the Plan for the year ended March 31, 2010.
With assets of $3.4 billion, the Plan covers 16,721 active members and 12,060 pensioners and survivors.
Although the Plan achieved very positive investment performance during the past year, it was necessary to make changes to the Plan to improve its long term health. Amendments to the Public Service Superannuation Act received Royal Assent in May, 2010. Details of these changes may be found at www.novascotiapension.ca.
Sincerely,
ORIGINAL SIGNED BY GRAHAM STEELE
Graham Steele Minister Trustee of the Public Service Superannuation Plan

Pa g e 2 N o v a S c o t i a P u b l i c S e r v i c e S u p e r a n n u a t i o n P l a n
P L A N G O V E R N A N C E
Plan Governance
The Trustee of the Public Service Superannuation Plan is the Minister of Finance.
The Public Service Superannuation Plan has been in operation since 1941. The Plan provides defined benefit pension coverage for employees of the Province and certain other public sector organizations.
The rules of the Plan are contained in the Public Service Superannuation Act and Regulations. The Minister of Finance, as Trustee of the Plan, is responsible for all aspects of Plan operation and administration.
Under the direction and oversight of the Trustee, certain functions are administered by the Nova Scotia Pension Agency. These functions include:
Pension Services – collection of employee and employer pension contributions, pension record-keeping, member services • and administration, pension payment calculation and disbursement and related administration functions including plan administration compliance.
Investment Services – the provision of investment services for the assets of the Plan. These activities are performed • according to the Statement of Investment Policies and Goals that has been approved by the Trustee.
Financial Reporting and Actuarial Services – the completion of annual reports, regulatory filings, actuarial analysis, pension • policy analysis, and financial reports for the Plan.
Member Services Contact from Members
In 2009/10 the Nova Scotia Pension Agency received more than 21,000 telephone calls, over 15,000 of which were from members and pensioners. Of these calls, 96% were answered without entering a queue. As well, 90% of calls were answered within 25 seconds.
Pension Seminars - One to One Client Counselling
From September to June retirement seminars are conducted across the province; hosted by the Public Service Commission and other employers. In 2009/10 the Agency participated in 28 seminars, with an estimated audience of over 450. The seminars are an excellent opportunity to learn about all aspects of retirement benefits, including pension, health benefits, and service awards.
Hours of Operation
Members and pensioners can reach the Agency between the hours of 8AM and 4:30PM, Monday through Friday.
Online Pension Benefit Calculator
An online pension benefit calculator is available on the Agency’s web site. The calculator will estimate the amount of pension a member will receive upon retiring. The calculators can be found at www.novascotiapension.ca. Click on Public Service Plan, then Calculators.

Net Assets Available for Benefits
AT A G L A N C E
A v e r a g e A n n u a l
(%) (C$) Quarter Ended March 31, 2010
1 Year March 31, 2010
4 Year March 31, 2010
10 Year March 31, 2010
S&P/TSX Equity 2.85% 40.73% 2.89% 4.76%
S&P/TSX 60 2.56% 37.41% 3.39% 4.35%
TSX Completion Equity Only 4.94% 59.18% 1.22% 5.56%
DEX Universe 1.26% 5.13% 5.33% 6.47%
DEX Canadian Trsy Bill - 30 Day 0.03% 0.21% 2.57% 2.96%
S&P 500 1.99% 20.77% -3.81% -4.19%
S&P Mid Cap 400 5.58% 32.31% -2.06% 2.28%
Russell 2000 TR 5.34% 31.25% -4.98% 0.03%
MSCI EAFE -2.39% 24.54% -4.26% -2.29%
Investment Performance
A v e r a g e A n n u a l
Quarter Ended March 31, 2010
1 Year March 31, 2010
4 Year March 31, 2010
10 Year March 31, 2010
Public Service Superannuation Fund Return1 2.04% 21.38% 1.65% 3.83%
Benchmark Return2 2.42% 25.09% 2.42% 3.76%
At a Glance
Index Returns
1 Fund Return is shown net of investment manager fees.2 The Benchmark was changed in September 2007 to reflect a passive 50% hedge on all international equities and a 100% hedge on all international fixed income.
3.23.5
3.83.6
2.9
0.0
0.5
1.0
1.5
2.0
2.5
3.0
3.5
4.0
2005 2006 2007 2008 2009
$ Billions at March 31
Year
3.4
2010
A n n u a l R e p o r t M a r c h 3 1 , 2 0 1 0 Pa g e 3

AT A G L A N C E
Stock Value % of Equity Portfolio
Royal Bank of Canada $45,940,578 2.30%
Toronto-Dominion Bank $42,889,821 2.14%
Bank of Nova Scotia $35,871,372 1.79%
Canadian Natural Resources $28,560,163 1.43%
Suncor Energy Inc. $27,177,226 1.36%
Transcanada Corp $20,896,289 1.04%
Sun Life Financial Inc. $16,389,881 0.82%
Rogers Communications Inc. $15,571,487 0.78%
Great-West Lifeco Inc. $14,090,634 0.70%
Imperial Oil Ltd. $14,042,624 0.70%
Exxon Mobil Corp $13,855,656 0.69%
Research in Motion $13,314,100 0.67%
Potash Corp of Saskatchewan $13,270,087 0.66%
Canadian Imperial Bank of Commerce $13,038,096 0.65%
Telus Corporation $12,815,618 0.64%
Manulife Finanical Corp $12,459,426 0.62%
Thomson Reuters Corp $11,830,019 0.59%
Nexen Inc. $11,515,883 0.58%
Metro Inc. $11,498,904 0.57%
Canadian National Railway Co. $11,374,839 0.57%
Top 20 Public Equity Holdings at March 31, 2010
Asset Mix at March 31, 2010
18.91%
30.94%
Canadian Equity
US Equity
International Equity
Fixed Income (Bonds)
Infrastructure
Cash & Cash Equivalents
Total Plan Assets
22.49%
18.91%
18.54%
30.94%
0.02%
3.00%
100.00%
Asset Mix Changes
Mar 2010 Mar 2009
19.87%
16.40%
18.64%
34.95%
n/a
2.25%
6.10%
22.49%
3.00%
18.54%
100.00%
Pa g e 4 N o v a S c o t i a P u b l i c S e r v i c e S u p e r a n n u a t i o n P l a n
Canadian Real Estate 6.10% 7.89%
0.02%

A n n u a l R e p o r t M a r c h 3 1 , 2 0 1 0 Pa g e 5
I N V E S T M E N T M A N A G E M E N T - D I S C U S S I O N A N D A N A LY S I S
Investment Management - Discussion and Analysis
Introduction
The Public Service Superannuation Fund (the “Fund”) is the funding vehicle for the Public Service Superannuation Plan. The primary goal of the Fund is to invest assets in a manner that maximizes investment returns, within an acceptable level of risk, to achieve the long term funding requirements of the Public Service Superannuation Plan.
The Minister of Finance is the Trustee of the Fund. The Trustee has ultimate responsibility for the management of the Fund. At the direction of the Trustee, the Nova Scotia Pension Agency performs investment management and investment administration duties.
The investment of the pension assets is guided by the Fund’s Statement of Investment Policies & Goals (the “SIP&G”) that has been approved by the Trustee. The SIP&G sets out the parameters within which the investments are managed. These parameters include permissible investments and the policy asset mix. The Investment Beliefs, also found within the SIP&G, state the general principles upon which the investments are made.
Asset Mix
Fiscal year 2009/10 began at the same approximate time that global financial markets sharply reversed the steady decline that had begun in 2008. This reversal lasted throughout the year as the markets experienced a prolonged and sustained recovery which eventually led to the posting of very strong performances.
Region Equity Index FY 2009/10 Return (CAD)
Canada S&P/TSX Equity Index 40.73%
U.S. S&P 500 Index 20.77%
Europe, Austrailasia, and Far East MSCI EAFE Index 24.54%
Emerging Economies MSCI Emerging Markets Index 46.02%
At the beginning of the 2009/10 fiscal year, as compared with the policy benchmark portfolio, the Fund was underweight in equities and overweight in fixed income and cash. This defensive position reduced the risk of financial loss. With the experience of extreme volatility in asset prices still very familiar, protective positioning was both responsible and necessary in the face of a great deal of uncertainty.
As fiscal 2009/10 progressed, key risks that existed at the beginning of the year diminished and, through active rebalancing, the Fund began to reflect the policy benchmark portfolio more closely. Leading into 2010, the Fund positions were closely aligned with the policy benchmark portfolio. Active positioning within asset classes was set up to protect against current threats such as those expected to result from unprecedented government stimulus and its essential unwind. The Fund was also positioned to benefit from more specific relative growth opportunities.

Investment Performance
Asset allocation decisions made throughout the fiscal year had a positive impact on the return and risk performance of the Fund. Under cautious and adaptive fund management, the Fund was able to provide a 21.38% investment return during the recovery in financial markets that spanned most of the fiscal year.
Improved conditions in the global financial markets and in the global economic environment were important in the currency markets as investors no longer sought the safe haven of the US dollar. The currency hedging program implemented by the Fund provided significant protection to its holdings denominated in US dollars and other foreign currencies and allowed the Fund to add 4.30% versus a comparable unhedged portfolio.
Stock selection was less rewarding than in other years. The rapidly rising equity prices did not distinguish between high and low quality companies. Many of the equity managers the Fund invests with have a bias toward investing in high-quality companies that is well aligned with the Fund’s long-term growth objectives and risk preferences. This year, however, that position underperformed the broad market indices and contributed to a relative underperformance of the Fund versus the policy benchmark.
Overall, the Fund underperformed its policy benchmark by 3.71% in 2009/10. This was due mainly to the underperforming quality bias of equity managers. In summary, during a time of enormous uncertainty in fiscal 2009, the Fund produced a strong return of 21.38% and provided protection from the prospect of excessive losses.
Pa g e 6 N o v a S c o t i a P u b l i c S e r v i c e S u p e r a n n u a t i o n P l a n
I N V E S T M E N T M A N A G E M E N T - D I S C U S S I O N A N D A N A LY S I S
10.0%
5.0%
0.0%
-5.0%
-10.0%
Overw
eig
ht/U
nderw
eig
ht
Fund Position vs. Policy Benchmark by Asset Class
Equities Fixed Income (Bonds)
Canadian Real Estate
Cash & CashEquivalents
March 2009 March 2010
-5.1%
-0.01%
4.0%
-0.1%
0.9%
-0.9%
0.3%1.0%
Asset Mix /continued

I N V E S T M E N T M A N A G E M E N T - D I S C U S S I O N A N D A N A LY S I S
Fiscal 2009/10 - An Engineered Recovery
Leading economists have labeled the global financial crisis which began in 2007 as the worst financial crisis since the Great Depression of the 1930s. As fiscal year 2009/10 began, institutional and retail investors had suffered a significant destruction of wealth. Although a large-scale effort by worldwide governments was initiated to stimulate economies, investors remained very anxious. Economic activity was in free fall as capital markets had anticipated months before. The intense dialogue between the economy and the markets continued throughout the spring and summer months.
By the end of February 2009, the S&P 500 Index had already suffered an 18.2% year-to-date drop. However, after making important lows in March, world equity markets rebounded sharply. Equities staged an inspiring rebound generating new highs in eleven months out of the next twelve. At the same time, the global economy began to stabilize. Well ahead of many optimistic forecasts, GDP growth turned positive by the third quarter of 2009 in most of the world’s major economies. The upturn in financial markets and the effects of a mountain of stimulative fiscal and monetary policies formed a basis for the return to an engineered normality for 2010.
Despite all the positive news this fiscal year, many of the economic issues still remain, and many new ones were born out of the crisis and the global government response to it. In the US, for example, the average unemployment rate for fiscal 2009 was more than twice the average unemployment rate during fiscal 2007. The International Monetary Fund, (“IMF”), shows a contraction of approximately 0.5% in world output in 2009, the first negative growth rate since World War II. The IMF is now projecting 4.25% growth for 2010 but maintains cautionary guidance:
Activity remains dependent on highly accommodative macroeconomic policies and is subject to downside risks, as fiscal fragilities have come to the fore. In most advanced economies, fiscal and monetary policies should maintain a supportive thrust in 2010 to sustain growth and employment. But many of these economies also need to urgently adopt credible medium-term strategies to contain public debt and later bring it down to more prudent levels.1
The arguments are becoming more and more convincing that the global economy has entered a 5-10 year period in which economies may grow slowly relative to historical norms. During this time, world economies may begin to resolve important structural issues. The challenges resulting from the collapse of the sub-prime credit markets, and the essential unwind of colossal stimulus, will be significant and may take a good deal of productive time to untangle.
A n n u a l R e p o r t M a r c h 3 1 , 2 0 1 0 Pa g e 7
Economic and Capital Market Briefing
1 “World Economic Outlook - Rebalancing Growth - April 2010”, International Monetary Fund
MSCI World Index Level and Daily High-Low Range
30-Mar-2010
1,200
1,100
1,000
900
800
2-Apr-2009 2-Jun-2009 31-Jul-2009 30-Sep-2009 30-Nov-2009 28-Jan-2010
5.0%
4.0%
3.0%
2.0%
1.0%
0.0%

I N V E S T M E N T M A N A G E M E N T - D I S C U S S I O N A N D A N A LY S I S
Pa g e 8 N o v a S c o t i a P u b l i c S e r v i c e S u p e r a n n u a t i o n P l a n
Economic and Capital Market Briefing /continued
Capital Market Performance
Canada
The S&P/TSX Equity Index was up 2.9% in the last quarter of fiscal 2009 and a whopping 40.7% for the year as a whole. The Canadian dollar made impressive gains on the year versus the US Dollar. The Canadian dollar traded around 79 cents US at the beginning of April 2009. Twelve months later the Canadian dollar was trading at over 98 cents US. Also, at the beginning of fiscal 2009, the volatility of Canadian equities remained higher than normal. Equity market risk was significant. As is often the case during a recovery, positive returns and steadily decreasing volatility were observed together through the rest of the year.
Eurozone & UK
The leading Blue-chip equity index for the Eurozone, the EURO STOXX 50 Index, was down about 1.0% last quarter but up 46.6% for fiscal 2009 beating the annual percentage gain of the S&P/TSX Equity Index by almost 6%. Yield curves are a representation of the term structure of interest rates. The yield spread between the 2-year and 10-year German government bonds was large, and got larger, increasing by 0.37% during 2009. The German measure of implied equity volatility, the VDAX Index, trended down throughout fiscal 2009 signifying an expectation of decreasing volatility in equity prices. The FTSE 100 Index is a share index of the 100 most highly capitalized UK companies listed on the London Stock Exchange. The index gained 6.0% in the final quarter of 2009. For fiscal 2009 as a whole, the FTSE 100 Index increased by 50.4%.
United States
The S&P 500 Index was up 5.4% in the final quarter of fiscal 2009 and 49.8% for the year. The S&P 500 benchmark index ended the year with an average share price of over 17 times the average annual earnings per share across the index. The US Dollar steadily lost ground, as measured against an international currency basket, trading down as much as 12% by the end of November 2009. However, in December, the US dollar began to improve steadily showing significant strength
which continued through the end of March 2010. The US dollar ended fiscal 2009 off 5.1% from where it began twelve months earlier.
Government bond yield curves in the United States and in the United Kingdom are among the steepest for developed economies around the world reflecting very low short term interest rates as compared with longer term interest rates. Asia
The Shanghai Stock Exchange Index of Chinese equity shares was up approximately 31.0% in fiscal 2009. In Japan, the Nikkei 225 Stock Average increased by 36.8%. Measured in US Dollars, the Japanese Yen rose over 14% by November 2009, then as the US dollar recovered sharply, the Yen finished fiscal 2009 up 5.9% from one year earlier. A high rate of inflation in India came hand in hand with higher nominal government bond yields. Nominal yields include the effects of inflation, while real yields do not. The nominal 10-year yield in India was approximately 7.5% at the close of fiscal 2009. After removing the effect of inflation, real yields were much lower. However, the steep front end of the sovereign yield curve, maintained throughout the year in India, was very similar to the worldwide experience of interest rate term structure.

I N V E S T M E N T M A N A G E M E N T - D I S C U S S I O N A N D A N A LY S I S
Investment Accomplishments within 2009/10
At the start of 2009 there was considerable uncertainty regarding how much further financial markets would decline. As markets seemed to find a bottom in March, the Fund began to address some of the under and over weights that had been carried as protection in the declining markets. By the end of the second quarter this rebalancing process was finished.
The effort to continue to diversify the portfolio continued throughout the declining market environment of early 2009. This effort culminated with the funding of a new emerging market equity mandate and a new small cap EAFE (Europe, Asia, Far East) equity mandate in the second and third quarter, respectively.
Given the experience of 2008/09, the Fund was reviewed to determine whether qualities such as liquidity and diversification within the portfolio could be improved upon. During the market upheaval, the Fund did not have any issues with liquidity but its continuing importance was highlighted through the experiences of others. From this perspective and from the desire to continue diversification efforts, it was decided to enhance the structure of the fixed income asset class and a new policy was approved. In the first quarter the fixed income portfolio evolved from a purely Canadian approach which was passively invested in the fixed income benchmark to an approach that allows for investments in non- Canadian securities and allows for active credit decisions. At the same time, this new approach will also retain an allocation to a highly liquid government bond portfolio. Subsequently, in the first quarter of 2009, a new fixed income mandate was funded which focuses on investment grade corporate bonds.
Work was also undertaken throughout 2009 that focused on taking advantage of some of the upheavals experienced in the capital markets in 2008/09. This led to additional allocations to investment grade bonds, high yield bonds, and a new commitment to real assets.
Additional work was also undertaken throughout 2009, to prepare for the development of strategies to improve and enhance various elements of the portfolio as discussed in the section below.
Investment Themes in 2010/11
Throughout 2010/11 emphasis will be placed on continuing to enhance the existing asset classes within the Fund. This work will help to improve the diversification of the portfolio, provide protection from inflation and reduce the expected volatility of the Fund. As these asset classes are enhanced, consideration will also be given to the historically low levels of interest rates and the concern that increasing interest rates will cause losses due to the declining market values in the fixed income portfolio and the risk of future inflation.
In the fixed income asset class, given the concern for higher interest rates and the impact of inflation on the bond portfolio, searches for new fixed income exposures and the broadening of existing mandates may be undertaken.
Within the inflation-linked asset class new strategies and policies were recently approved which may lead to several new initiatives in this area. The approval of an infrastructure policy and the subsequent commitment to an infrastructure fund were recently completed. These initiatives will be built upon throughout 2010 as the Fund looks for new opportunities and commitments in infrastructure.
Further, within the inflation-linked asset class, a new Real Return Bond (RRB) policy was recently approved. New initiatives in this area will also be examined that may broaden and enhance the existing RRB portfolio. Opportunities to broaden the existing domestic real estate portfolio may also be examined throughout 2010.
Given the anticipated investment in additional illiquid assets such as real estate and infrastructure, the Fund will continue to build upon the work that it has already completed on the liquidity of the Fund. This will ensure that, as new illiquid assets are brought into the Fund, the impact on liquidity is well anticipated and addressed through a comprehensive liquidity plan.
Beyond the work in the existing asset classes, work will also continue to move forward to directly address the volatility of the Fund. This work will focus on actions to manage Fund volatility while continuing to provide the necessary investment returns required by the Plan.
A n n u a l R e p o r t M a r c h 3 1 , 2 0 1 0 Pa g e 9

P L A N V A L U AT I O N
Funded Ratio
Unfunded Liability
Plan Valuation
Pa g e 1 0 N o v a S c o t i a P u b l i c S e r v i c e S u p e r a n n u a t i o n P l a n
85.2 88.0 89.683.5
64.1
0
20
40
60
80
100
2004 2005 2006 2007 2008 2009
% at December 31
Year
69.3
-436.4-467.4-542.7-732.7
-1,688.2-2000
-1500
-1000
-500
02004 2005 2006 2007 2008 2009
$ Millions at December 31
Year
-1,503.0
The funded ratio of the Plan on December
31, 2009 was 69.3%. The funded ratio
is equal to assets divided by liabilities,
expressed as a percentage. A funded ratio of
100% or more means that the Plan is fully
funded, i.e. the Fund’s assets are sufficient
to cover liabilities, based on current market
values and actuarial assumptions.
If liabilities are greater than assets, the Plan
has an unfunded liability. A surplus is equal
to the Plan’s assets less its liabilities.
After two challenging years in the markets,
the plan rebounded in 2009, earning a return
of 21.38%. As at December 31, 2009, the
unfunded liability was $1.503 billion, an
improvement of $185.3 million over the
previous year.
Member Profile - Public Service Superannuation Plan
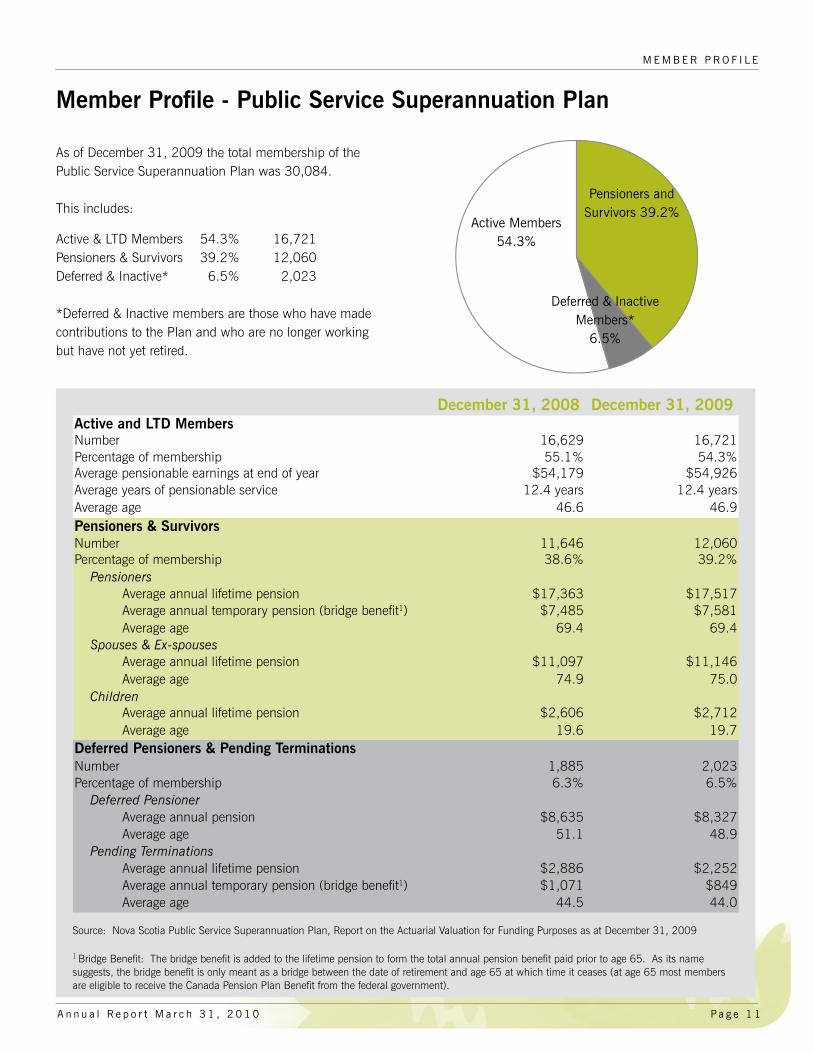
As of December 31, 2009 the total membership of the Public Service Superannuation Plan was 30,084. This includes:
Active & LTD Members 54.3% 16,721Pensioners & Survivors 39.2% 12,060Deferred & Inactive* 6.5% 2,023 *Deferred & Inactive members are those who have made contributions to the Plan and who are no longer working but have not yet retired.
M E M B E R P R O F I L E
Pensioners and Survivors 39.2%
Deferred & InactiveMembers*
6.5%
December 31, 2008 December 31, 2009Active and LTD MembersNumber 16,629 16,721Percentage of membership 55.1% 54.3%Average pensionable earnings at end of year $54,179 $54,926Average years of pensionable service 12.4 years 12.4 yearsAverage age 46.6 46.9Pensioners & SurvivorsNumber 11,646 12,060Percentage of membership 38.6% 39.2%
PensionersAverage annual lifetime pension $17,363 $17,517Average annual temporary pension (bridge benefit1) $7,485 $7,581Average age 69.4 69.4
Spouses & Ex-spousesAverage annual lifetime pension $11,097 $11,146Average age 74.9 75.0
ChildrenAverage annual lifetime pension $2,606 $2,712Average age 19.6 19.7
Deferred Pensioners & Pending TerminationsNumber 1,885 2,023Percentage of membership 6.3% 6.5%
Deferred PensionerAverage annual pension $8,635 $8,327Average age 51.1 48.9
Pending TerminationsAverage annual lifetime pension $2,886 $2,252Average annual temporary pension (bridge benefit1) $1,071 $849Average age 44.5 44.0
1 Bridge Benefit: The bridge benefit is added to the lifetime pension to form the total annual pension benefit paid prior to age 65. As its name suggests, the bridge benefit is only meant as a bridge between the date of retirement and age 65 at which time it ceases (at age 65 most members are eligible to receive the Canada Pension Plan Benefit from the federal government).
Active Members 54.3%
Source: Nova Scotia Public Service Superannuation Plan, Report on the Actuarial Valuation for Funding Purposes as at December 31, 2009
A n n u a l R e p o r t M a r c h 3 1 , 2 0 1 0 Pa g e 1 1
M E M B E R & P E N S I O N E R A D M I N I S T R AT I O N
Member and Pensioner Administration
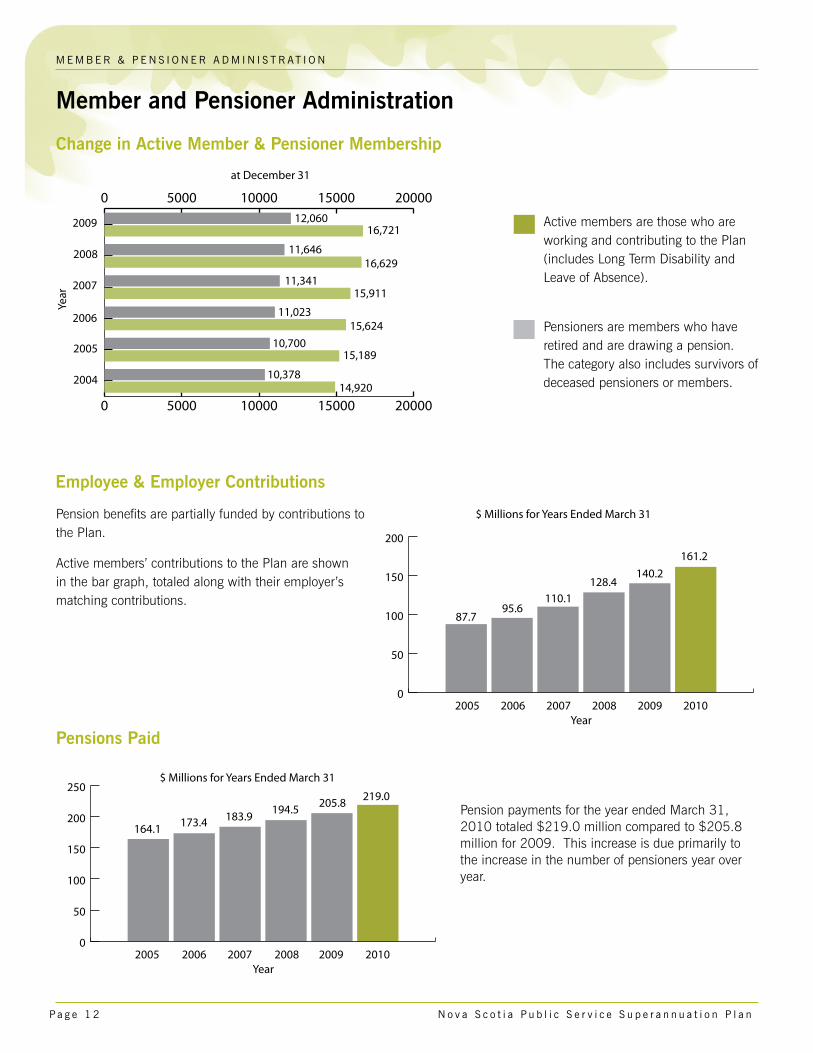
Active members are those who are working and contributing to the Plan (includes Long Term Disability and Leave of Absence).
Pensioners are members who have retired and are drawing a pension. The category also includes survivors of deceased pensioners or members.
Change in Active Member & Pensioner Membership
Employee & Employer Contributions
Pension benefits are partially funded by contributions to the Plan.
Active members’ contributions to the Plan are shown in the bar graph, totaled along with their employer’s matching contributions.
Pensions Paid
Pension payments for the year ended March 31, 2010 totaled $219.0 million compared to $205.8 million for 2009. This increase is due primarily to the increase in the number of pensioners year over year.
Pa g e 1 2 N o v a S c o t i a P u b l i c S e r v i c e S u p e r a n n u a t i o n P l a n
0 5000 10000 15000 20000
0 5000 10000 15000 20000
2004
2005
2006
2009
2008
2007
Year
14,92010,378
15,18910,700
15,62411,023
15,91111,341
at December 31
11,64616,629
12,06016,721
87.795.6
110.1128.4
140.2
0
50
100
150
200
2005 2006 2007 2008 2009 2010
$ Millions for Years Ended March 31
Year
161.2
164.1 173.4194.5 205.8
0
50
100
150
200
250
2005 2006 2007 2008 2009
$ Millions for Years Ended March 31
Year
183.9
2010
219.0

Street address Nova Scotia Pension Agency 4th Floor, Purdy’s Landing 1949 Upper Water Street Halifax, Nova Scotia B3J 3N3
Mail address Nova Scotia Pension Agency PO Box 371 Halifax, Nova Scotia B3J 2P8
Phone 424-5070 (Halifax area) 1-800-774-5070 (Toll free in NS)
Fax 902-424-0662
Email [email protected]
Web site www.novascotiapension.ca