Norwegian Air Shuttle ASA Air Shuttle ASA Q3 2012 Presentation October 25 th 2012 CEO Bjørn Kjos...
11
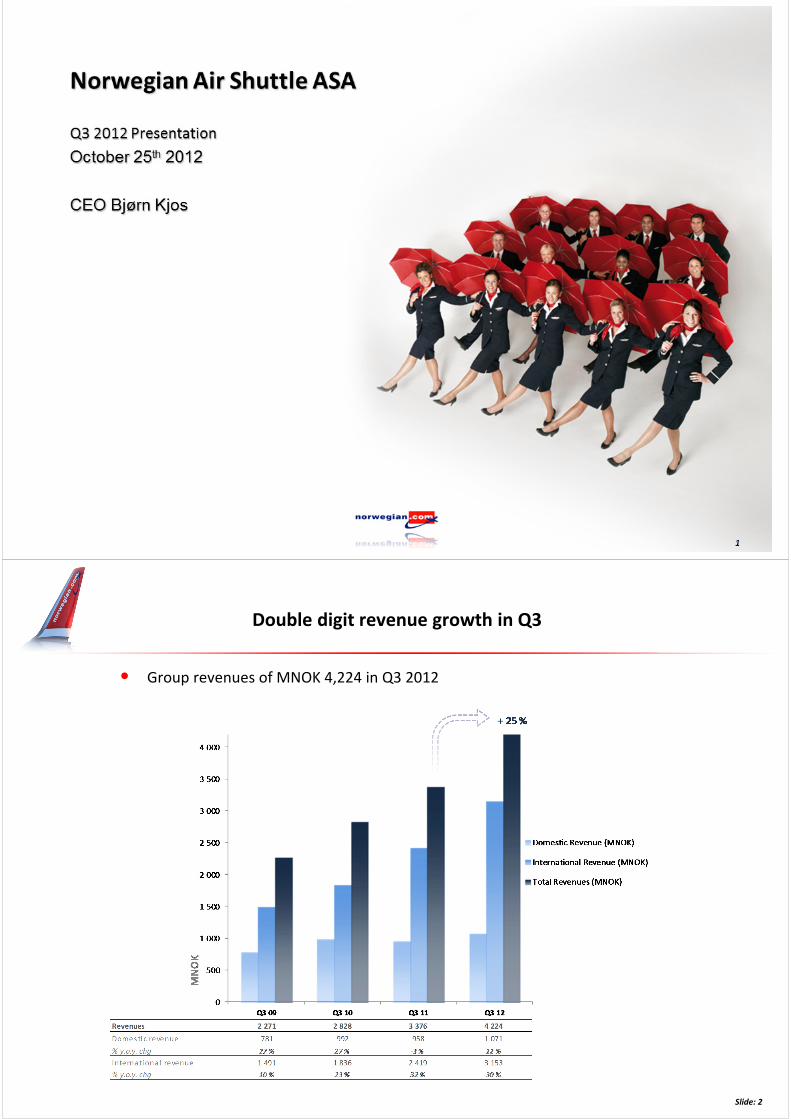
1 Norwegian Air Shuttle ASA Q3 2012 Presentation October 25 th 2012 CEO Bjørn Kjos Double digit revenue growth in Q3 • Group revenues of MNOK 4,224 in Q3 2012 Slide: 2
Transcript of Norwegian Air Shuttle ASA Air Shuttle ASA Q3 2012 Presentation October 25 th 2012 CEO Bjørn Kjos...
1
Norwegian Air Shuttle ASA
Q3 2012 Presentation
October 25th 2012
CEO Bjørn Kjos
Double digit revenue growth in Q3
• Group revenues of MNOK 4,224 in Q3 2012
Slide: 2
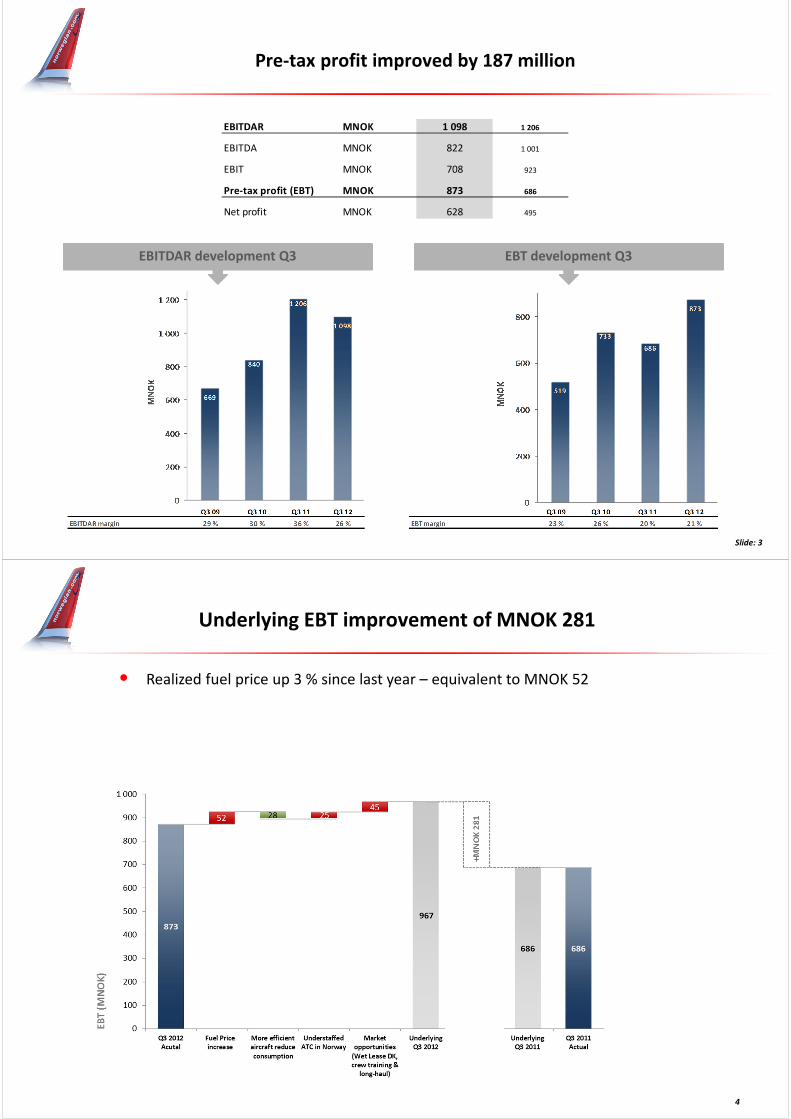
EBITDAR MNOK 1 098 1 206
EBITDA MNOK 822 1 001
EBIT MNOK 708 923
Pre-tax profit (EBT) MNOK 873 686
Net profit MNOK 628 495
Pre-tax profit improved by 187 million
Slide: 3
EBT development Q3EBITDAR development Q3
Underlying EBT improvement of MNOK 281
4
• Realized fuel price up 3 % since last year – equivalent to MNOK 52
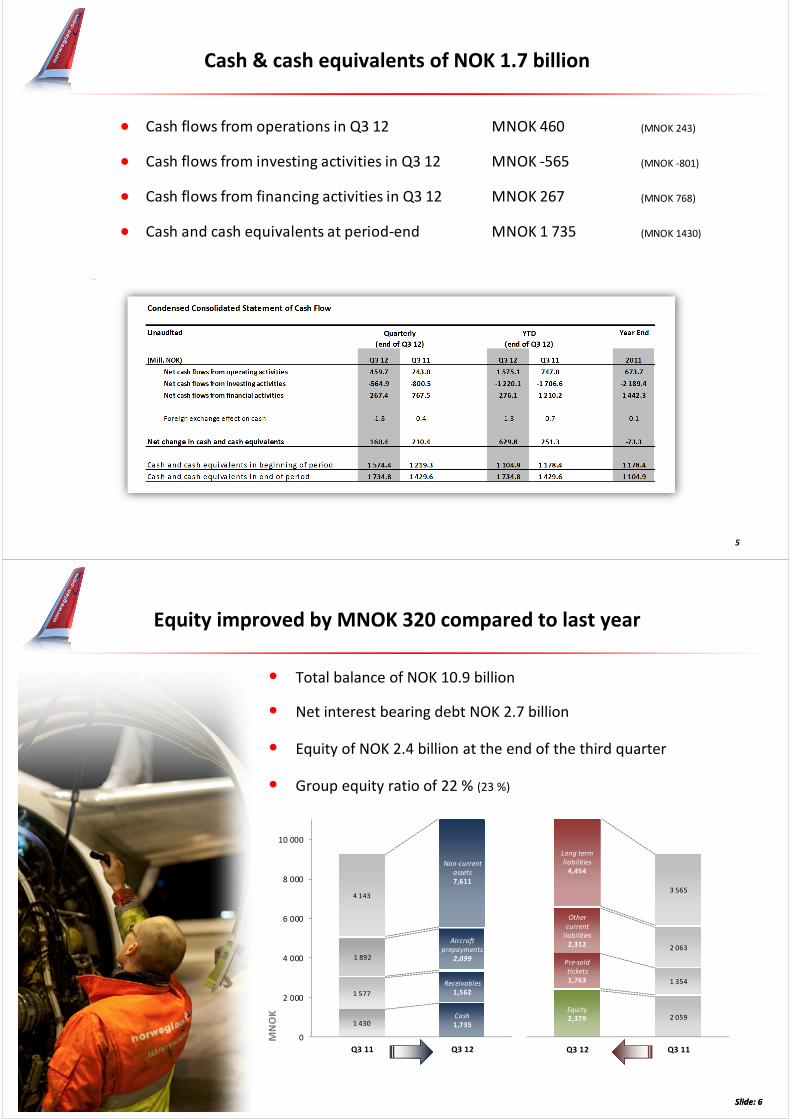
Cash flows from operations in Q3 12
Cash flows from investing activities in Q3 12
Cash flows from financing activities in Q3 12
Cash and cash equivalents at period-end MNOK 1 735
MNOK 267
MNOK -565
MNOK 460 (MNOK 243)
(MNOK -801)
(MNOK 768)
(MNOK 1430)
Cash & cash equivalents of NOK 1.7 billion
5
1 430Cash
1,735
1 577
Receivables
1,562
1 892
Aircraft
prepayments
2,099
4 143
Non-current
assets
7,611
0
2 000
4 000
6 000
8 000
10 000
Q3 11 Q3 12
MN
OK Equity
2,379 2 059
Pre-sold
tickets
1,763 1 354
Other
current
liabilities
2,3122 063
Long term
liabilities
4,454
3 565
Q3 12 Q3 11
• Total balance of NOK 10.9 billion
• Net interest bearing debt NOK 2.7 billion
• Equity of NOK 2.4 billion at the end of the third quarter
• Group equity ratio of 22 % (23 %)
Equity improved by MNOK 320 compared to last year
Slide: 6Slide: 6
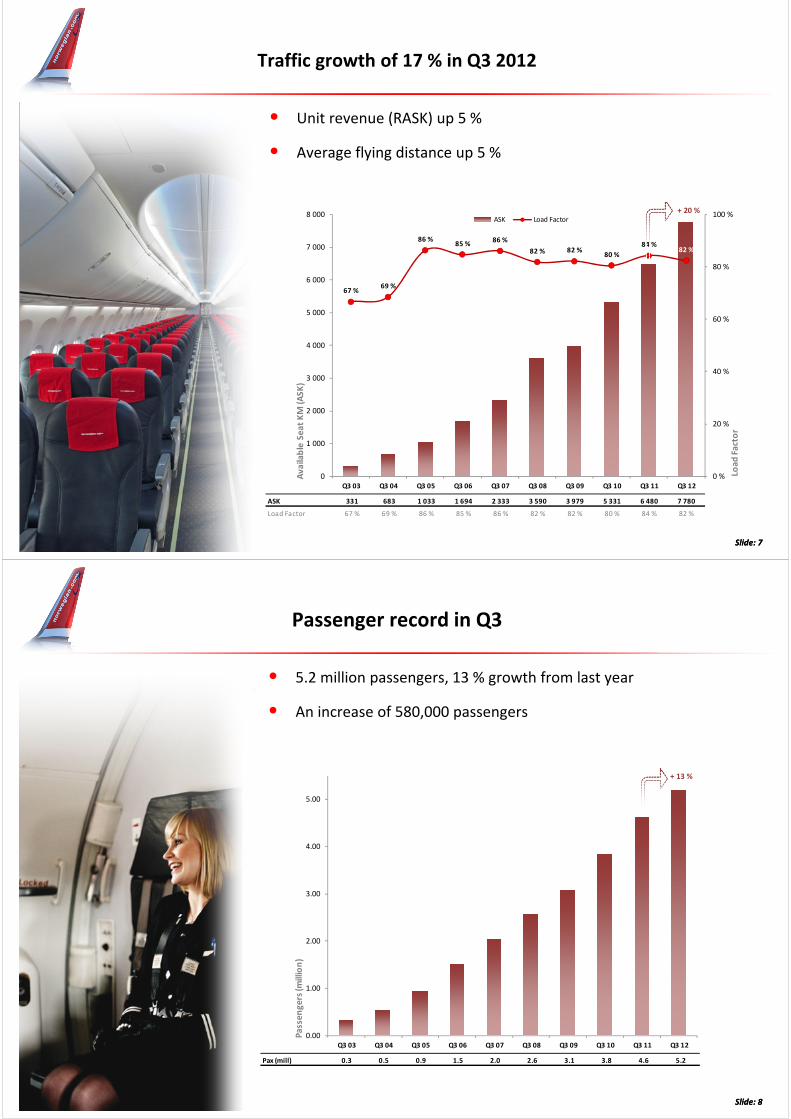
Traffic growth of 17 % in Q3 2012
• Unit revenue (RASK) up 5 %
• Average flying distance up 5 %
Slide: 7Slide: 7
ASK 331 683 1 033 1 694 2 333 3 590 3 979 5 331 6 480 7 780
Load Factor 67 % 69 % 86 % 85 % 86 % 82 % 82 % 80 % 84 % 82 %
67 %69 %
86 %85 %
86 %
82 % 82 %80 %
84 %82 %
0 %
20 %
40 %
60 %
80 %
100 %
0
1 000
2 000
3 000
4 000
5 000
6 000
7 000
8 000
Q3 03 Q3 04 Q3 05 Q3 06 Q3 07 Q3 08 Q3 09 Q3 10 Q3 11 Q3 12
Loa
d F
act
or
Av
aila
ble
Se
at
KM
(A
SK
)
ASK Load Factor
+ 20 %
Pax (mill) 0.3 0.5 0.9 1.5 2.0 2.6 3.1 3.8 4.6 5.2
0.00
1.00
2.00
3.00
4.00
5.00
Q3 03 Q3 04 Q3 05 Q3 06 Q3 07 Q3 08 Q3 09 Q3 10 Q3 11 Q3 12
Pa
sse
ng
ers
(mill
ion
)
+ 13 %
• 5.2 million passengers, 13 % growth from last year
• An increase of 580,000 passengers
Passenger record in Q3
Slide: 8Slide: 8
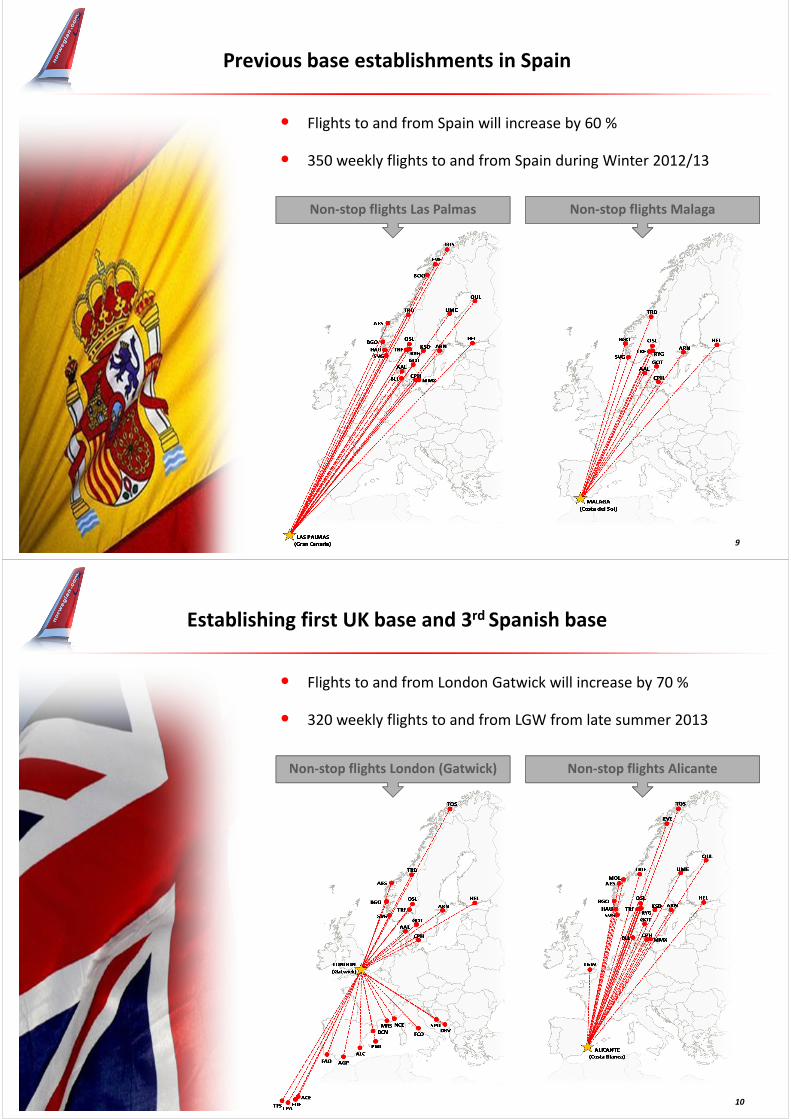
Previous base establishments in Spain
9
Non-stop flights Las PalmasNon-stop flights Las Palmas Non-stop flights MalagaNon-stop flights Malaga
• Flights to and from Spain will increase by 60 %
• 350 weekly flights to and from Spain during Winter 2012/13
Establishing first UK base and 3rd Spanish base
10
Non-stop flights London (Gatwick)Non-stop flights London (Gatwick) Non-stop flights AlicanteNon-stop flights Alicante
• Flights to and from London Gatwick will increase by 70 %
• 320 weekly flights to and from LGW from late summer 2013
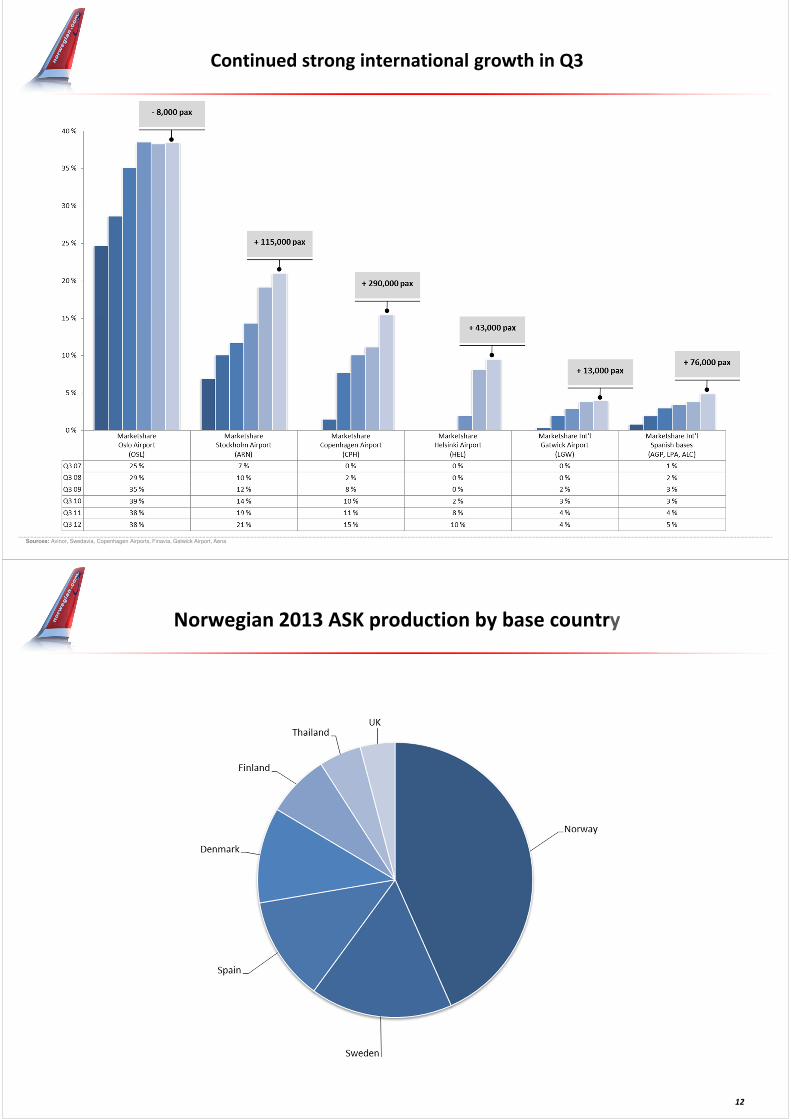
Continued strong international growth in Q3
Sources: Avinor, Swedavia, Copenhagen Airports, Finavia, Gatwick Airport, Aena
Norwegian 2013 ASK production by base country
12
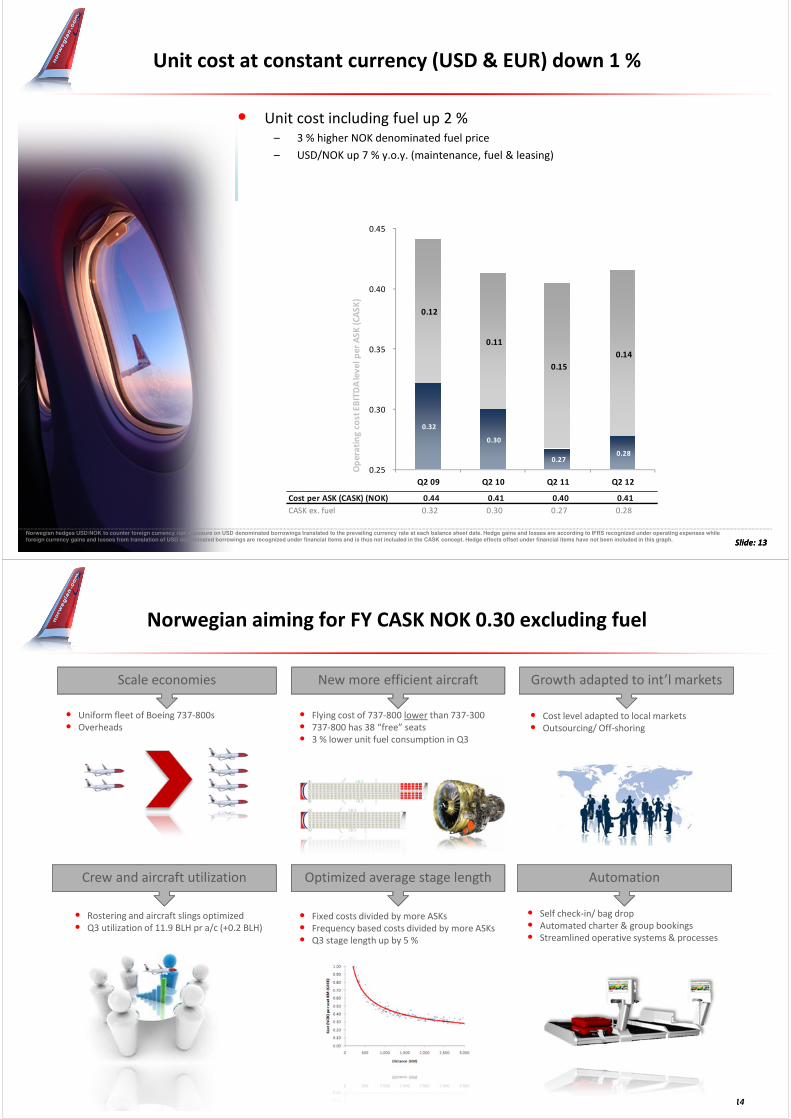
Cost per ASK (CASK) (NOK)
CASK ex. fuel 0.32
0.44 0.41
0.28
0.40
0.30
0.41
0.27
0.32
0.30
0.27 0.28
0.12
0.11
0.15
0.14
0.25
0.30
0.35
0.40
0.45
Q2 09 Q2 10 Q2 11 Q2 12
Op
era
tin
g c
ost
EB
ITD
A le
ve
l p
er
AS
K (
CA
SK
)
Unit cost at constant currency (USD & EUR) down 1 %
Slide: 13Slide: 13
• Unit cost including fuel up 2 %– 3 % higher NOK denominated fuel price
– USD/NOK up 7 % y.o.y. (maintenance, fuel & leasing)
Norwegian hedges USD/NOK to counter foreign currency risk exposure on USD denominated borrowings translated to the prevailing currency rate at each balance sheet date. Hedge gains and losses are according to IFRS recognized under operating expenses while foreign currency gains and losses from translation of USD denominated borrowings are recognized under financial items and is thus not included in the CASK concept. Hedge effects offset under financial items have not been included in this graph.
• Flying cost of 737-800 lower than 737-300
• 737-800 has 38 “free” seats
• 3 % lower unit fuel consumption in Q3
Norwegian aiming for FY CASK NOK 0.30 excluding fuel
14
Scale economiesScale economies New more efficient aircraftNew more efficient aircraft Growth adapted to int’l marketsGrowth adapted to int’l markets
Crew and aircraft utilizationCrew and aircraft utilization Optimized average stage lengthOptimized average stage length AutomationAutomation
• Uniform fleet of Boeing 737-800s
• Overheads
• Fixed costs divided by more ASKs
• Frequency based costs divided by more ASKs
• Q3 stage length up by 5 %
• Cost level adapted to local markets
• Outsourcing/ Off-shoring
• Rostering and aircraft slings optimized
• Q3 utilization of 11.9 BLH pr a/c (+0.2 BLH)
• Self check-in/ bag drop
• Automated charter & group bookings
• Streamlined operative systems & processes
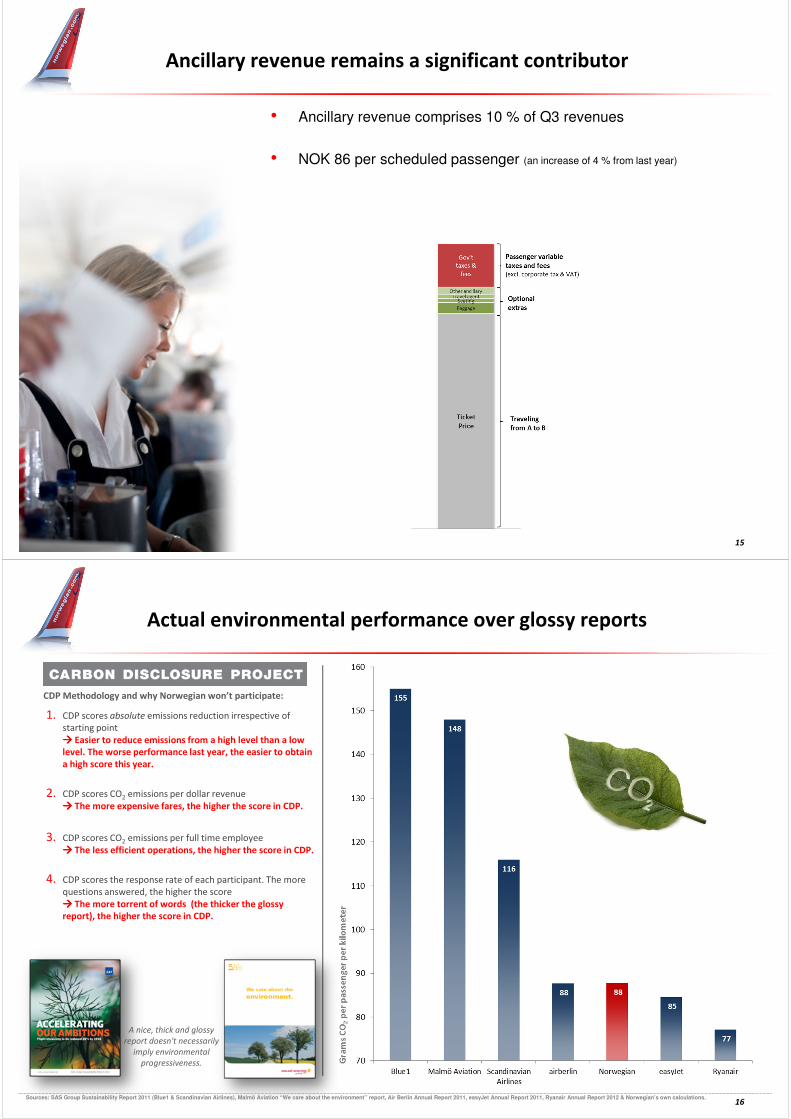
Ancillary revenue remains a significant contributor
15
• Ancillary revenue comprises 10 % of Q3 revenues
• NOK 86 per scheduled passenger (an increase of 4 % from last year)
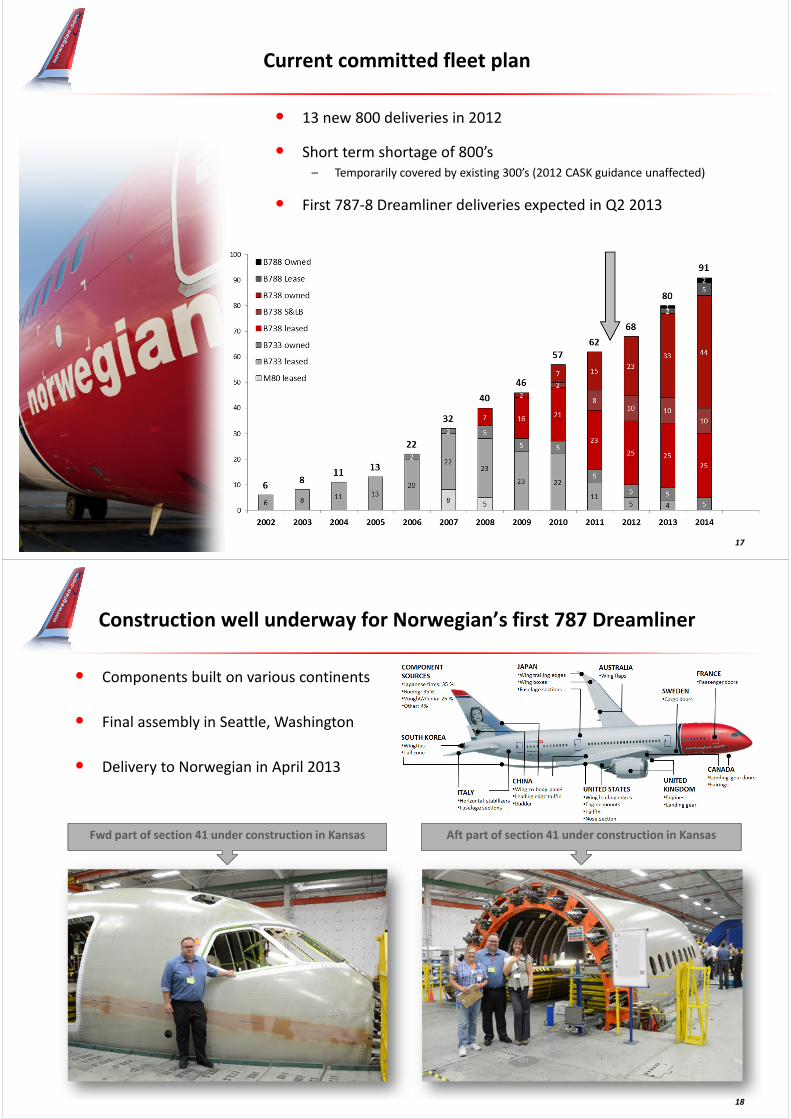
Actual environmental performance over glossy reports
16
CDP Methodology and why Norwegian won’t participate:
A nice, thick and glossy
report doesn't necessarily
imply environmental
progressiveness.
1. CDP scores absolute emissions reduction irrespective of
starting point
���� Easier to reduce emissions from a high level than a low
level. The worse performance last year, the easier to obtain
a high score this year.
2. CDP scores CO2 emissions per dollar revenue
���� The more expensive fares, the higher the score in CDP.
3. CDP scores CO2 emissions per full time employee
���� The less efficient operations, the higher the score in CDP.
4. CDP scores the response rate of each participant. The more
questions answered, the higher the score
���� The more torrent of words (the thicker the glossy
report), the higher the score in CDP.
Sources: SAS Group Sustainability Report 2011 (Blue1 & Scandinavian Airlines), Malmö Aviation “We care about the environment” report, Air Berlin Annual Report 2011, easyJet Annual Report 2011, Ryanair Annual Report 2012 & Norwegian’s own calculations.
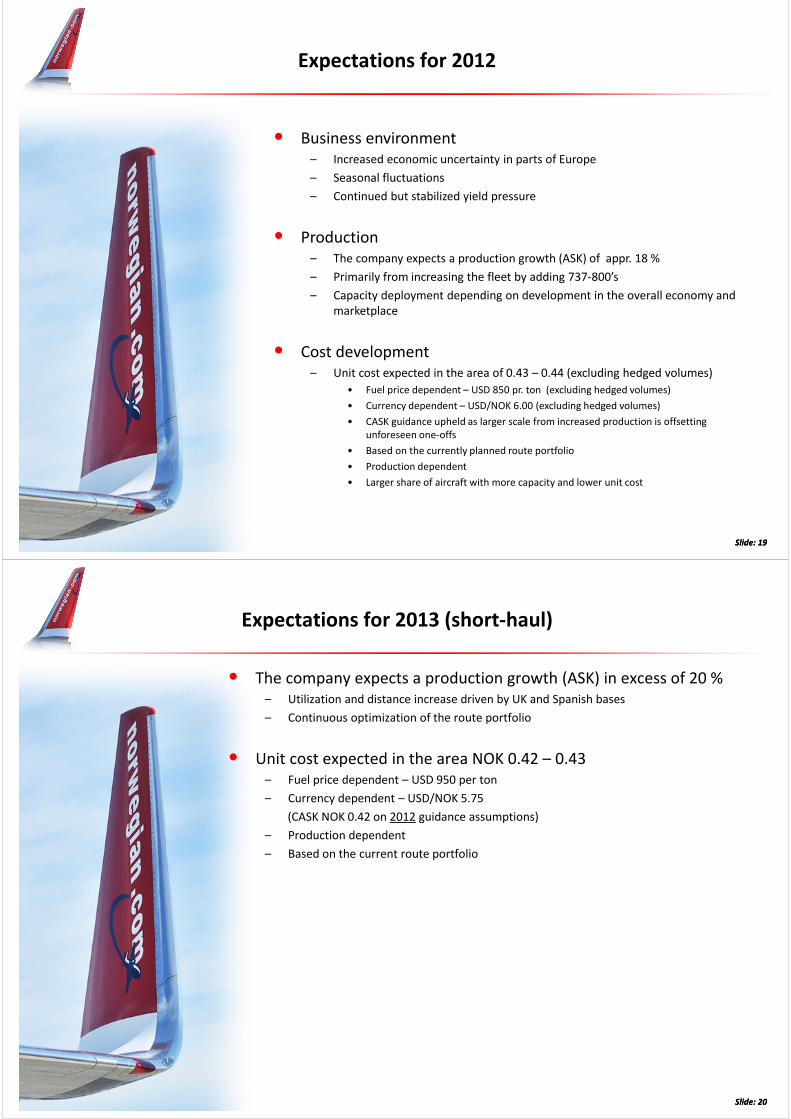
Current committed fleet plan
17
• 13 new 800 deliveries in 2012
• Short term shortage of 800’s
– Temporarily covered by existing 300’s (2012 CASK guidance unaffected)
• First 787-8 Dreamliner deliveries expected in Q2 2013
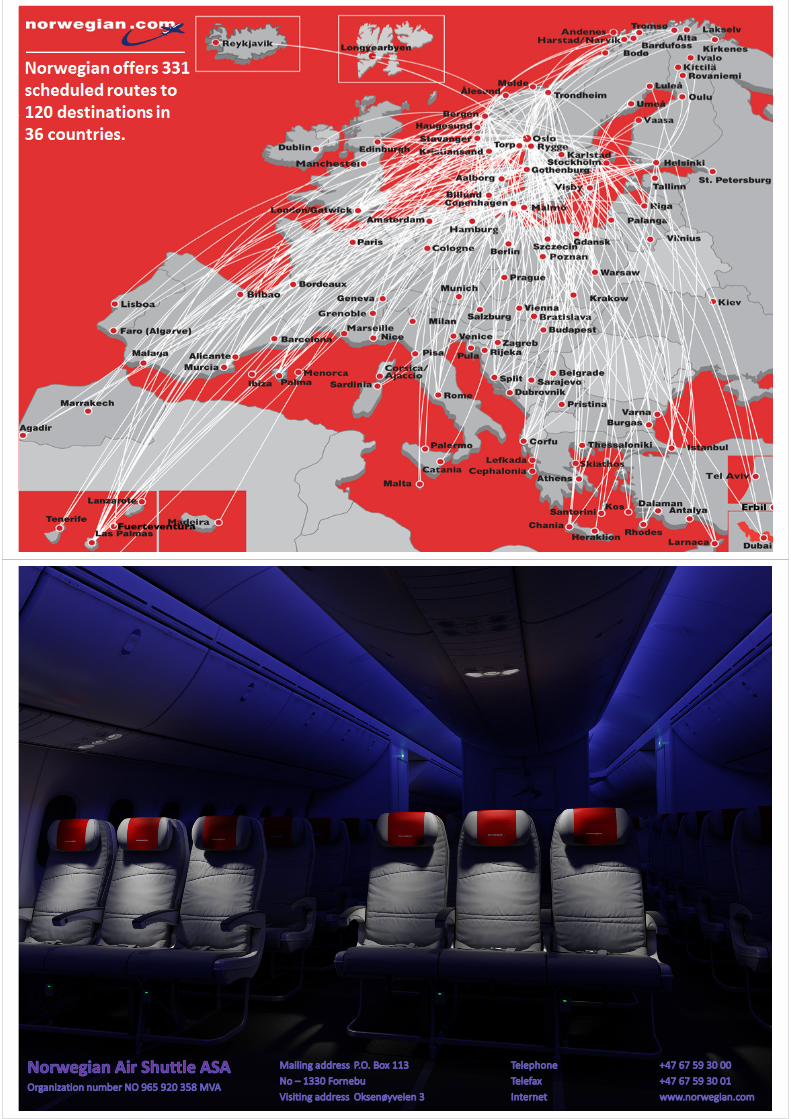
Construction well underway for Norwegian’s first 787 Dreamliner
18
Fwd part of section 41 under construction in KansasFwd part of section 41 under construction in Kansas Aft part of section 41 under construction in KansasAft part of section 41 under construction in Kansas
• Components built on various continents
• Final assembly in Seattle, Washington
• Delivery to Norwegian in April 2013
• Business environment
– Increased economic uncertainty in parts of Europe
– Seasonal fluctuations
– Continued but stabilized yield pressure
• Production
– The company expects a production growth (ASK) of appr. 18 %
– Primarily from increasing the fleet by adding 737-800’s
– Capacity deployment depending on development in the overall economy and
marketplace
• Cost development
– Unit cost expected in the area of 0.43 – 0.44 (excluding hedged volumes)
• Fuel price dependent – USD 850 pr. ton (excluding hedged volumes)
• Currency dependent – USD/NOK 6.00 (excluding hedged volumes)
• CASK guidance upheld as larger scale from increased production is offsetting
unforeseen one-offs
• Based on the currently planned route portfolio
• Production dependent
• Larger share of aircraft with more capacity and lower unit cost
Expectations for 2012
Slide: 19Slide: 19
Expectations for 2013 (short-haul)
Slide: 20Slide: 20
• The company expects a production growth (ASK) in excess of 20 %
– Utilization and distance increase driven by UK and Spanish bases
– Continuous optimization of the route portfolio
• Unit cost expected in the area NOK 0.42 – 0.43
– Fuel price dependent – USD 950 per ton
– Currency dependent – USD/NOK 5.75
(CASK NOK 0.42 on 2012 guidance assumptions)
– Production dependent
– Based on the current route portfolio
Norwegian offers 331
scheduled routes to
120 destinations in
36 countries.
22