
Rasmus Sørensen_Strategezing Norwegian Air Shuttle ASA
35
DET SAMFUNDSVIDENSKABELIGE FAKULTET Økonomisk Institut KØBENHAVNS UNIVERSITET Strategic Management Rasmus Sørensen og Ole Frederiksen MHQ236 og WRF604 Strategizing Norwegian Air Shuttle ASA Superviser: Stig Hartmann, [email protected] Opponent(s): Unknown Date for Presentation: Week 16-21, 2015
-
Upload
rasmus-sorensen -
Category
Documents
-
view
29 -
download
0
Transcript of Rasmus Sørensen_Strategezing Norwegian Air Shuttle ASA

D E T S A M F U N D S V I D E N S K A B E L I G E F A K U L T E T Ø k o n o m i s k I n s t i t u t K Ø B E N H A V N S U N I V E R S I T E T
Strategic Management Rasmus Sørensen og Ole Frederiksen MHQ236 og WRF604
Strategizing Norwegian Air Shuttle ASA
Superviser: Stig Hartmann, [email protected]
Opponent(s): Unknown
Date for Presentation: Week 16-21, 2015

CONTENTS CONTENTS
Contents
1 Introduction 1
2 Norwegian Air Shuttle ASA 22.1 Business Model . . . . . . . . . . . . . . . . . . . . . . . . . . . . . . . . . . . . . . . 22.2 Business Strategy . . . . . . . . . . . . . . . . . . . . . . . . . . . . . . . . . . . . . . 32.3 Peer Group Review . . . . . . . . . . . . . . . . . . . . . . . . . . . . . . . . . . . . . 4
3 External Analysis 53.1 Key Drivers of Change . . . . . . . . . . . . . . . . . . . . . . . . . . . . . . . . . . . 53.2 Scenario Analysis . . . . . . . . . . . . . . . . . . . . . . . . . . . . . . . . . . . . . . 53.3 Porters Five Forces . . . . . . . . . . . . . . . . . . . . . . . . . . . . . . . . . . . . . 73.4 The Industry Life Cycle . . . . . . . . . . . . . . . . . . . . . . . . . . . . . . . . . . 93.5 Peer Group Analysis . . . . . . . . . . . . . . . . . . . . . . . . . . . . . . . . . . . . 93.6 Critical Success Factors . . . . . . . . . . . . . . . . . . . . . . . . . . . . . . . . . . 12
4 Internal analysis 134.1 Value Chain Analysis . . . . . . . . . . . . . . . . . . . . . . . . . . . . . . . . . . . . 134.2 VRIO model . . . . . . . . . . . . . . . . . . . . . . . . . . . . . . . . . . . . . . . . 144.3 SWOT – Part Conclusion . . . . . . . . . . . . . . . . . . . . . . . . . . . . . . . . . 17
5 Competitive strategy 185.1 Porters Generic Strategy Framework . . . . . . . . . . . . . . . . . . . . . . . . . . . 18
5.1.1 Cost-Leadership . . . . . . . . . . . . . . . . . . . . . . . . . . . . . . . . . . 195.2 Interactive Strategies . . . . . . . . . . . . . . . . . . . . . . . . . . . . . . . . . . . . 20
6 Growth strategy 20
7 Economic Theory 22
8 Conclusion 24
9 Literature List 25
A Appendix 28
1

1 INTRODUCTION
1 Introduction
From the ‘90s and onwards there has been a liberalization in the European market for the airlineindustry which has led to an increased competition; airliners have either chosen to differentiate orgo for the cost-leading position. The liberalization process is still an on-going project why onecan expect further increase in competition, due to the fact that at this moment we have areadetermined cost-leaders and not an overall European cost-leader. Furthermore, the airliners aregradually expanding their market presence on an international level. This paper seeks to evaluatethe present strategic position of Norwegian Air Shuttle ASA (NAS) and to develop a potential futurestrategy; to do this the seminar paper will answer the following questions:
• What characterizes Norwegian’s environment?
• What characterizes Norwegian?
• How will Norwegian compete in the years ahead?
• How will Norwegian grow in the future?
To be able to analyse and evaluate relevant competitive- and growth strategies for Norwegian it isessential to determine and examine their present strategic position, why a definition of Norwegian’smarket is essential.Since Norwegian’s focus is on transporting passengers, the main scope of the subject will be passengertransportation. The paper will have a focus on flights within the European Region and on shortdistance flights. Norwegian is a Scandinavian company, why we will focus on competitors in thenear markets, i.e. Denmark, Sweden, Norway, Iceland, Germany, Finland and Great Britain.The seminar paper will use public known data to examine the subject, and will use general strategicmanagement tools to explore and analyse the present situation.
The structure of the seminar paper Section 2 gives a brief introduction to the company, whilealso presenting Norwegians current strategy. A peer group review is made in order to create abenchmark to NAS’ performance for later analytic reasons. Section 3 and 4 contains several in-debtanalyses; where the main scope are the external- and internal analysis, with a primary goal of cov-ering NAS from a macro-environmental, micro-economical and company level perspective. Thesekey findings, from the analyses, are highlighted in a SWOT-summary. In Section 5 a competitivestrategy is presented in order for NAS to compete, whereas Section 6 suggest an appropriate growthstrategy. Section 7 discusses the economic theories behind the chosen models. Section 8 concludes.
Rasmus Sørensen wrote: 1, 2, 2.2, 3, 3.2, 3.4, 3.5, 3,6, 4.1, 4.2, 4,3, 6, 7, 8, A.2Ole Bugge Frederiksen wrote: 1, 2.1, 2.3, 3.1, 3.3, 3.5, 4, 4.3, 5, 6, 7, 8, A.2
1 of 33

2 NORWEGIAN AIR SHUTTLE ASA
2 Norwegian Air Shuttle ASA
The 22nd of January 1993 was the day Norwegian Air Shuttle ASA was founded. It started as areconstruction of the company Busy Bee of Norway A/S which had filed for bankruptcy in 1992. Ini-tially NAS’s focus was on domestic airborne transportation in collaboration with Braathens S.A.F.E.However, in 2002, Braathens was acquired by SAS, implying a termination of the collaboration. Asa result, Norwegian established their own fleet of airplanes and branded themselves as a domesticlow-cost carrier. By using the characteristic red colour and national icons, such as the belovedHenrik Ibsen and Edvard Munch, they created a brand the public could relate to. Later they ex-panded into short-haul operations within the European region and have recently expanded into thelong-haul global airline industry with the modern Boeing 787-8 Dreamliner, e.g. flights to Thailandand especially the US. Today they are the second largest aviation company in Scandinavia and thethird largest low-cost carrier in Europe, with around 4500 employees.1
Norwegian has since 2007 expanded their fleet with more than 42 airplanes culminating in 2012 witha historical order of 222 new airplanes. This order was to make their fleet more modern, fuel-efficientand environmentally correct, and to increase their focus on the low-cost long-haul operation flightsin an attempt to explore this business opportunity.
2.1 Business Model
This section briefly introduces NAS’s underlying business principles, hence describing the company’svision, values, business model, and finally their current business strategy.
Business Model It is necessary to define the strategic group in which NAS belongs. The airlinetransport industry can be split into two simplified groups: 1. those who focus on superior serviceand quality flights, i.e. full-service carriers (FSC), and 2. those who focus on efficient cost-structurei.e. low-cost carriers (LCC). These will form the two strategic groups and scope of this seminarpaper.To investigate which of the two business models NAS follows we have used two of four groups thatWensveen and Leick defines in their journal from 2009, accordingly the low-cost model and thelegacy model.2 The overall model can be found in Appendix A.1.
Given information in their annual reports and website, NAS presents themselves as a low-cost carrier.The assessment of the position is in accordance with the presented in in Appendix. For instance, onesees that NAS has a high aircraft usage and frequency rate, often ticketless and automated check-in systems, point-to-point connection, online distribution, passengers have to pay for amenities,
1Norwegian.com, 2015, ”Norwegian in Brief”2Wensveen, John G., Leick, Ryan, 2009
2 of 33

2.2 Business Strategy 2 NORWEGIAN AIR SHUTTLE ASA
and finally a simplified structure. However, the company does have features that belong to thetraditional legacy model. These features, among others, are: Wi-Fi in the majority of their regionalflights within Europe, mainly operates from primary airports whereas other low-cost competitorsuse smaller and cheaper airports, their own frequent flyer program called Norwegian Reward, as wellas optional seat assignment. Despite these differences we will consistently throughout this paper bereferring to NAS as a low-cost carrier (LCC).
2.2 Business Strategy
Vision Norwegian’s vision is “Everyone should afford to fly”.3 The business idea of NAS is to giveeverybody the opportunity to travel by air, attracting customers by offering competitive, low faresand a high-quality travel experience based on operational excellence and helpful, friendly service.
Corporate Values and Operational Priorities
• All business and behaviour of NAS is affected by:
• Three corporate values: simplicity, directness, and relevance.
• Three operational priorities: safety, service, and simplicity.
Business Strategy Norwegian intends to become the preferred supplier of air travel in its selectedmarkets and to generate excellent profitability and return to its shareholders. NAS will achieve thisby following their nine main strategic principles, which are defined as:
1. NAS has to adhere to the corporate values. 2. NAS thrives to attract customers and stimulatingmarkets by offering competitive low fares and a quality travel experience based on low operatingcosts, operational excellence and helpful friendly service. 3. Offering “Freedom to choose”, customerswill have the choice to select additional products and services, providing a core low cost productto the price sensitive customer and a more comprehensive package for those who require a littleextra, ensuring a broad market reach. 4. Provide a comprehensive network of high frequencybusiness destinations to main airports and a desirable choice of destinations for leisure travellers. 5.Maximize revenues through state-of-the-art passenger revenue management. 6. Continue to develophigh quality cost efficient products and services through extensive use of industry leading technology,and continuously making it more comfortable and convenient to choose Norwegian as travel partner.7. Utilize the strong brand name and efficient distribution channels to further increase ancillaryrevenue. 8. Continuously monitor and improve the cost base where possible. 9. And lastly, obtaina lean and flat organization that makes decision-making processes simple and direct, enabling thecompany to easily adapt to changes and possibilities in market environment.
3Norwegian.com, 2015, ”Norwegian in Brief”
3 of 33

2.3 Peer Group Review 2 NORWEGIAN AIR SHUTTLE ASA
2.3 Peer Group Review
In order to review the company’s performance, relative to its main competitors, we have establisheda small peer-group. For simplicity, we have decided only to include two other airline companies;Ryanair Ltd. and SAS Group. These will serve as a benchmark to NAS’ performance in the externalstrategic analysis.
Preferably, the peer group includes companies that are similar to NAS in both scale and scope, sothey can be accurately compared. However, there are no easily comparable companies in terms ofthe same geographic market area, scale and business strategy. Instead, we have chosen to look attwo companies that we believe is suitable for comparison reasons:First, we have chosen Ryanair Ltd. due to its cost-leader business strategy as the leading Europeanlow-cost carrier. Ryanair is at the moment expanding their business massively, thereby becomingan increasing threat to NAS. Also, by choosing Ryanair we will be able to compare NAS with acompany that has a similar low-cost business strategy, on measures like CASK, load factor, etc.Second, we have chosen the SAS Group, since it is a natural choice when focusing on airlines withinthe northern part of Europe/Scandinavia. The Scandinavian airline market is characterized by alow number of companies and where each airliner has a dominant presence in their home markets.SAS has a large market share in all of the four Nordic countries and is therefore an obvious choicefor our peer group. However, SAS is perceived as a full-service carrier, and thereby differs fromthe business strategy NAS follows. It is important to mention that full-service carriers (i.e. legacyairlines according to the Wensveen and Leick method) are increasingly getting more and moreindistinguishable from their low-cost rivals in terms of the fares they charge and the service theyoffer.4 Like many other full-service carrier companies SAS has dropped some of its standard serviceproducts in order to follow the increased price competition. It is therefore relevant and fair tocompare NAS and SAS even though they belong to two different business strategic groups.
4KPMG.com, 2015, “Airline Disclosures Handbook 2013 v2”
4 of 33

3 EXTERNAL ANALYSIS
3 External Analysis
This section seeks to analyse and create an overview of theexternal factors, which can affect the present situation ofNAS. The external analysis will consist of a scenario anal-ysis and the key drivers of change based on findings froma PESTEL analysis. We have chosen to put the PESTELoutline into the appendix to apply a more comprehensivefocus on the dynamic effects in the market.
Next we will apply the Porters Five Forces template onthe NAS case and then follow it by an industry lifecycleanalysis. Finally, we have conducted a benchmark anal-ysis and created a short statement regarding the CriticalSuccess Factors of NAS. An illustrative outline for thissection is shown below.
3.1 Key Drivers of Change
Based on the PESTEL outline, conducted in Appendix A.2 we have identified the following “short-term” significant key drivers of change: business cycle development, global agreement of carbon-dioxide emission, access to “Big Data”, ageing population, low oil prices and the development of theunionization.
Looking a bit further into the future, i.e. 5+ years, we have identified the following “long-term” keydrivers of change: Automated airplanes and solar-driven airplanes.
3.2 Scenario Analysis
The PESTEL analysis is a tool showing the static picture of the macro environment’s presentsituation. To give a more dynamic picture of the future to come, we have chosen to conduct ascenario analysis, cf. Figure 1. We find that the scope of the scenario analysis is to look at short-term economic key drivers of change. When building scenarios one key component is the uncertaintyfactor, if there is no uncertainty, there is no point of making scenarios since the incident will occurwith absolute certainty. The first factor with a great potential of uncertainty is the business cycledevelopment. Exploring this will investigate the impact of a growing or declining European region.The second factor in our scenario analysis will be to look at a weak vs. strong unionization. Also,it will narrow the scope on the Scandinavian region and according to the analysis in PESTEL theoutcome of the mentioned trial with Ryanair could change the perspective of status quo in regardsto competition.
5 of 33

3.2 Scenario Analysis 3 EXTERNAL ANALYSIS
Figure 1: Scenario model
Source: Own creation
I) Fragmented growth Here the European economy begins to grow and the unionization inScandinavia prevails. The prevalence of unionization maintains status quo in Scandinavia; othercompetitors cannot compete with alternate union-agreements, often a mix of multinational unionagreements, and therefore has to adapt to the Scandinavian model for the employees working there.The growing economy, according to the PESTEL analysis, leads to increased demand for traveling.The airline companies have the possibility to grow in their own home markets, why the incentive tocompete for new market-shares will diminish.
II) Differentiated Growth Here the European economy begins to grow and the unionizationin Scandinavia falls apart, given that Ryanair succeeds making the present law EU-contradictory,cf. the Ryanair case mentioned in the PESTEL analysis. The disposable income of householdswill increase following the economic growth in the region and will lead to an increased demand fortraveling. Since we are in an economic growth phase, the higher disposable income would also implya more selective consumer pattern with higher expectations. Overall, this enables the opportunityfor adopting a CSR-focused strategy and differentiation can be explored.
III) Fragmented Protectionism The Scandinavian model prevails for outsiders to be able tocompete they have to adopt the union-agreement at least for the workers working in Scandinavia; thestatus-quo in the market will not be changed, rendering the industry to near-market competition.The declining European economy affects the number of travellers and thereby the overall bottom-lines for all airline industry. The majority of price-sensitive customers increases and cost-leaders willhave a competitive advantage.
IV) Differentiated Protectionism Here the European economy begins to decline and the union-ization in Scandinavia falls apart. The declining economy will lead consumers to be more price-sensitive and will therefore look for the cheapest tickets. Further, all kinds of European businesseswill suffer from volatility, conflict and uncertainty. The weakening unionization enables possibilitiesof new areas for cost cutting, and Scandinavian low-cost carriers may, in order to compete, haveto look into corporate strategies, cost structure and maybe move the main-seats to more beneficialareas.
6 of 33

3.3 Porters Five Forces 3 EXTERNAL ANALYSIS
3.3 Porters Five Forces
We have looked at what categorizes the macro-environmental threats of NAS in the European market,and with that we will continue and make an industry analysis to identify the attractiveness of theindustry by looking at the five market threats: Potential entrants, Substitutes, Buyers, Suppliersand Competitive rivalry.
The threat of entry In order to be able to operate successfully in the industry, an organizationmust be of significant scale and have a large amount of experience. Also, the operation is cruciallydependent on the organization having a strong and developed network of suppliers. The requirementsto an entrants scale, experience and ability to manage a large network of different operationalactivities and suppliers, as well as limited possibilities of differentiation, serves as very large barriersto entry. The recent disruptive effects of the liberalization of the industry have introduced the LCCs.We find the existing competition so fierce that we do not expect the market participants to react onfurther entries. All in all, the threat of entry is expected to be relatively low.
The threat of substitutes Given our market definition, i.e. short-distance travelling, one couldargue that cars and busses pose a threat as substitutes. The lower fuel prices as well as the flexibilityalso lead to an increased the attractiveness of travelling by car or bus. Travelling by train couldpose a threat in the future, given that the infrastructure in the European region gets updated toenable more high-speed trains. According to an analysis by BCG, passengers will be able to arrive attheir destinations faster by utilizing the high-speed and conventional train network in Europe, thanby plane on nearly 50% of the European air routes.5 A technological substitute is web conferencesystems and high-definition telepresence systems. Stated in an analysis by IATA, these technologiesalone will change the atmosphere of travellers, i.e. the segment of business travellers will fall from45% and of the world’s airline passengers in 2012 to 40% in 2017.6 However, we assess the threat ofsubstitutes to be relatively low on the short run.
The power of buyers This threat depends on which “buyer” you are looking at. One coulddivide NAS customers into two strategic buyers: private customers or leisure travellers and businesstravellers. For private customers the switching cost is low thereby making it easier for them tochoose the airline that offers the cheapest tickets. Many websites offers several “tools” for people tocompare prices between airplane companies making the whole segment of private customers strongin relation to having bargaining power over the supplier. IATA estimates that airline websites willproduce 59% of booking volume by 2017, i.e. up from 35% in 2012.7
5BCG.com, 2015, “Opportunities for Action – Planes, Trains and Automobiles”6IATA.com, 2015, “Future Airline Distribution Report”7IATA.com, 2015, “Future Airline Distribution Report”
7 of 33

3.3 Porters Five Forces 3 EXTERNAL ANALYSIS
Business travellers are often backed up by a large corporation that can afford tickets from full-servicecarriers, i.e. companies that are not only focusing on being price-leaders. Comfort, flexibility andefficiency are typically more important than just cheap tickets. We assess buyer power to be high.
The Power of Suppliers The number of aircraft manufacturers is limited to a few, where Boeingand Airbus are the industry’s largest.8 This relative low number of manufacturers indicates thattheir power is relatively high. Fuel prices are driven by the volatility of raw oil, why primarily allconsumers can be considered prices takers, and have a low bargaining power. In Europe there isa fairly limited amount of airports, and within these airports there is a limited amount of gates.Furthermore airports connected to larger cities attract more customers, which is why the primaryairports in near areas of larger cities have a large bargaining power. This is not the case withsmaller airports; they have to attract airline companies by offering lower gate prices and so on,why these have a relatively low bargaining power. The airline industry is highly labour intensive.As for Norwegian, wages accounts for about 17% of all operating costs. In addition, many of theemployees are organized in different types of unions. Given this, we assess that employees have astrong bargaining position.
Finally we have the food and drinks suppliers. Given the number of suppliers these are the oneswithout bargaining power. The overall assessment of supplier power is that it is relatively high.
Competitive Rivalry The airline industry is characterized by having a large quantity of compa-nies, high fixed costs and a low degree of differentiation.9 The liberalization process, called the “SingleEuropean Sky” has implied that European airlines may fly to any given destination within EU.10
LCC’s such as Ryanair and Norwegian have explored these opportunities by utilizing economiesof scale, efficient cost-structure, fuel-efficient fleets etc. An analysis of airlines within the differentstrategy groups indicates that the competitive rivalry in EU is increasing. The market share ofLCCs, measured by the number of departures, increased significantly from 17% in 2005 to 32% in2013.11 We assess the competitive rivalry to be high.
Summing up Porter’s Five Forces Based on the findings in the analysis we find that theattractiveness of the industry is considered relatively low due to its somewhat limited profitability.The low profitability is caused by several things but the high competitive rivalry and the powerof suppliers, which puts a lot of pressure on the companies within the airline industry, makes itexceedingly difficult to make abnormal profits.
8FT.com, 2015, “Boeing Beats Airbus”9Ec.europa.eu, 2015, “Annual Analyses of the EU Air Transport Market 2012”
10Ec.europa.eu, 2015, “Single European Sky”11Airlineprofiler.eu, 2014, “International Low-cost Airline Market Research”
8 of 33

3.4 The Industry Life Cycle 3 EXTERNAL ANALYSIS
3.4 The Industry Life Cycle
The assessment of the industry indicates that it is in the “maturity stage” of the industry life cycledue to: growth in the industry has slowed down12, entry barriers are high, economies of scale areimportant in regards of profitability and the internet has made the buyer power high.
To be able to attain profitability in the maturity stage of the industry life cycle, the company hasto have a significant market share and have economics of scale. Therefore the attractiveness ofthe industry relies on the attainable market share, which potentially could happen by acquiring ormerging with competitors.
The stage of the industry lifecycle will form some of the core foundation of the growth strategy,which will later be examined in Section 6.
3.5 Peer Group Analysis
In the following subsection we will analyse NAS relative to its competitors chosen in our peergroup review analysis. In order to do this, we will compare some industry specific key performanceindicators (KPIs) and the outcome will give an overview of which parameters, that the airlinescompete, as well as, where NAS might be threatened and/or may exploit some opportunities. Theabbreviations are explained under each KPI, and the source to all data used in the below diagramsare taken from their respective annual reports.
Figure 2: Available Seat Kilometres
Available Seat Kilometres (ASK) ASK isa way of measuring an airlines production capac-ity, i.e. the total number of available seats timesthe distance flown. Figure 2 illustrates that theLCCs have steadily increased their productioncapacity from 2009 to 2013. NAS has expandedtheir production capacity from ASK 135.550 to343.180 corresponding to an increase of 153,2%,which is a fairly large expansion relative to SASand Ryanair that respectively increased by 0,2% and 54%.NAS expects to further increase their production capacity, implied by the order of 222 new aircraftsin 2012 and also due to the order of 17 brand new “Dreamliner” aircrafts especially made for theirlong-haul operations.13
12Ec.europa.eu, 2015, “Annual Analyses of the EU Air Transport Market 2012”13Norwegian Annual reports [2009, 2010, 2011, 2012, 2013]
9 of 33

3.5 Peer Group Analysis 3 EXTERNAL ANALYSIS
Figure 3: Revenue Passenger Kilometres
Revenue Passenger Kilometres (RPK)Where ASK is the total production capacity;RPK is the actual production output that mea-sures the number of seats occupied times thedistance flown. Figure 3 and 2 have quite somesimilarities, and reveals that the airlines moreor less utilize a fixed ratio of ASK. This can beexplained, like in ASK, by the increase in pro-duction outcome.
Figure 4: Load Factor
Load Factor The load factor is the relativeratio of RPK and ASK and indicates how effec-tive the airlines are to utilize their capacity. Theload factor is also a measurement of efficiency,since it does not include the flight length, whywe can compare both short- and long-haul air-lines. Figure 4 shows that Ryanair has been themost efficient airliner in the period with an aver-age load factor of 83%. Norwegian has steadilybeen circling around 78% and SAS has had the lowest average load factor of 74%. NAS’s load factorwill be mentioned and discussed further in Section 5 about competitive strategy and ways to improvetheir current position.
Figure 5: Yield
Yield Factor The load factor only incorpo-rate how large a fraction the airline utilizes oftheir total production capacity and does nottake the revenue into account. The yield factoris defined as the relative ratio between revenueand RPK, i.e. the revenue the airliner generatesper effective kilometre.14 Figure 5 illustratesthat SAS was the airliner charging the highestticket price per flown kilometre in the peer group; SAS charged 0,115e per RPK in 2013. The yieldfactor of NAS and Ryanair was in accordance with the definition of LCCs, and was respectively0,67e and 0,5e in 2013. Yield is a common measurement in the airline industry, though it has itslimitations. Yield does not incorporate the length factor, i.e. an airline flying long-haul may havehigher yield than short-haul airlines. Furthermore, the definition of traffic revenue is not clear on
14Revenue is measured as the Traffic revenue, i.e. the revenue that can be directly linked to transporting passengers.
10 of 33

3.5 Peer Group Analysis 3 EXTERNAL ANALYSIS
an overall scale, why the comparison of the market participants might be biased.
Figure 6: CASK and RASK
CASK and RASK Yield measures the effec-tive revenue-generation per RPK, but it doesnot take the total production capacity of theairliners into consideration. To take this intoaccount analytics has created the factor RASK(revenue per ASK), i.e. revenue generated fromtransporting passengers relative to total avail-able production capacity. However, RASK aloneis a poor measure of profitability and efficiency,why the factor CASK has been created. This isRASK’s equivalent though it considers the operational cost associated with transporting passengersrelative to total production capacity. The difference in CASK and RASK indicates the profit perASK. Figure 6 illustrates that none of the airliners in our peer group have had a negative profitper ASK, further it illustrates that SAS as the only FSC has the highest RASK and CASK, thoughthey also have the lowest profit per produced seat kilometre at 0,0035e.15 NAS generated a profitper seat kilometre of 0,004e and Ryanair 0,007e. From this we find that in the air Ryanair is thebest performer measured in profit in 2013.16 Relative to industry benchmark LCC EU 2012 NASmarginally underperforms, though Ryanair lies strictly below the industry benchmark. One thingto consider here is that Ryanair is the overall cost-leader in the European region and has a marketshare of more than 20% of the total number of passengers. Their superior position has to be takeninto consideration since their low-cost strategy significantly affects the industry benchmark.17
Passengers per Employee and Employee per ASK To illustrate the productivity of the air-lines, we have chosen to look at passenger per employee and employee per million ASK.
Figure 7: Passengers per Employee
These measurements do not take the number ofwork hours into consideration or whether theirground-handlers also service other airlines, butthey are the best estimate of productivity, givenour limited access to information/data.Figure 7 and 8 shows that in both parameters,Ryanair is superior to SAS and NAS. They had8674 passengers per employee compared to NASand SAS, 5220 and 2282 passengers per em-
15Source: NAS, SAS and Ryanair annual reports 2009-201316CAPA.com, 2013, “World Aviation Yearbook 2013 – Europe”17Ryanair, Quarter 4. report 2013
11 of 33

3.6 Critical Success Factors 3 EXTERNAL ANALYSIS
ployee. Moreover, they had an employee per million ASK at 0,08 compared to NAS and SASat 0,12 and 0,33 respectively. These indicators either show that Ryanair’s employee has a greateramount of work hours, flies more short-haul destinations or they are simply more productive.In regards to SAS one has to consider that theirbusiness model is not to be price-leader but to haveto deliver on high service and convenience level fortheir customers. In addition, SAS also distributesother airliners’ ground handling etc.
Figure 8: Employee per ASK
Summing up Peer Group Analysis The peer group analysis gives an indication NAS’s opera-tional performance relative to it peers. ASK and RPK indicated that even though NAS has relativlyagressive been expanding their production capacity they have kept their load factor steady by at-tracting passengers and fill up the planes. The comparison of RASK and CASK showed that NAS isable to compete in the Scandinavian market and deliver a relatively healthy profitability, although,Ryanair can be considered as a competitor should they wish and be able to enter the Scandinavianmarket. In the final comparison we find that as it is, NAS is able to compete because they beat theirclosest competitor on productivity, though they might have to find ways of increasing productivityif Ryanair should find it attractive to enter the market. Moreover, we find the cost-structure of NASefficient and effective to handle short-term shocks to the demand curve, such as natural disastersand other drops in demand.
3.6 Critical Success Factors
Figure 9: Critical Success Factors
Source: Own creation
Critical success factors (CSF) are defined as factors that are either particularly valued by customersor provider a significant advantage in terms of cost. We have found that the airline industry circlesaround two main factors; low prices and service level. As stated, the business strategy that thecompany follows dictates which strategic group they belong to, i.e. either LCCs or FSCs. We havedefined NAS as a LCC, though they offer service features like a FSC. SAS on the other hand does notdirectly belong to the strategic group LLC, but anyhow, is seen as one of NAS’s largest competitors
12 of 33

4 INTERNAL ANALYSIS
in the Scandinavian market. The strategic groups compete internally as well as with each other,why there is no sacred ground when defining the CSF. Additionally, we have identified two strategicconsumers for NAS, the leisure traveller and the price-sensitive business traveller.
These CSFs are important for NAS’ strategic focus when they try to create competitive advantages.To assess which factors that NAS should focus on in the strategic planning, we have to considerboth the strategic position that NAS is in and what kind of competitive strategy that is the mosteffective. The critical success factors will therefore be evaluated in the Section 5 describing thecompetitive strategy.
4 Internal analysis
After having assessed, analysed and outlined the external factors the scope will now be on theinternal factors. The purpose of the internal analysis is to identify and evaluate resources andcompetences possessed by NAS. These strategic capabilities of the firm will be identified through avalue chain analysis and then applied in the VRIO framework in order to evaluate if the capabilitiesare value creating, and if so, which distinctive capabilities can form the base of a potential sustainablecompetitive advantage.
4.1 Value Chain Analysis
The value chain analysis is based on the framework presented by Michael E. Porter (1996). Theairline industry has used his theory to conduct a standard value chain template; the specific templatewill be applied throughout the analysis.18 The value chain model for NAS is shown in Figure 10and the activities we find important to mention are highlighted in the model.
Support Activities In regards to support activities we do not find any of NAS’ to be unique,therefore they are not further mentioned with regards to the value chain analysis and VRIO model.
Primary Activities Aircraft fleet (efficiency and cost structured fleet), Sales and distributionchannel (high rate of online ticket sales, low-fare calendar creates a unique overview for the cus-tomer, results in a competitive load factor), Brand name (highly recognized by the general popula-tion, unique brand within Scandinavian, Corporate Social Responsibility (green profile, partnershipwith UNICEF, etc.)), Simplicity (“Freedom to choose”, No-Frills), Free Wi-Fi service, High frequencyof business and leisure destinations.
18Higheredbcs.wiley.com, 2012, “The Airline Industry Value Chain”
13 of 33

4.2 VRIO model 4 INTERNAL ANALYSIS
Figure 10: Value Chain Analysis
Source: Own creation and used template from: Higheredbcs.wiley.com, 2012
4.2 VRIO model
The VRIO model will be applied to evaluate the potential competitive advantage of NAS. VRIO isan acronym for four criteria by which the strategic capabilities can be assessed in order to providea basis for achieving a sustainable competitive advantage (now and in the future). We have appliedthe VRIO model on each distinctive capability identified in the value chain analysis, and assessedwhether they are: Valuable, Rare, Inimitable and/or whether they are supported by the Organizationin order to capture the value created.
Figure 11: VRIO model
Source: Own creation
The VRIO is done in order to assess to what degree the different resources and competences are
14 of 33
4.2 VRIO model 4 INTERNAL ANALYSIS
contributing to building a sustainable competitive advantage. In the below section, each distinctivecapability identified in the value chain section will be discussed in relation to the four criteria.
Aircraft Fleet First, NAS has over the last years structured their aircraft fleet to the most efficientlevel possible taking cost-efficiency and environmental reasonability into account. They have only alimited number of aircraft types which lowers the complexity of their fleet. Currently, the companyhas a total fleet of 96 aircrafts; 84 are 737-800s, 5 are 737-300s and 7 are 787-8 Dreamliners. Moreover,NAS placed Europe’s largest ever-single aircraft order in January 2012, when they ordered a total of222 new aircrafts. A fleet operating a small number of aircraft types facilitates cost savings throughsynergies in areas such as maintenance and administration. The new aircraft fleet will benefit boththe short- and long-haul operations. In addition, a small number of aircraft types will improveoperational reliability and on-time performance as well as reduce maintenance and other technicalcosts. NAS aircraft fleet is therefore a very valuable part of the organization and rare given theirstatus as a LLC. In addition, NAS has managed to organize the company and its strategy so thatthe high value of their fleet is exploited.
Sales and Distribution Channel Second, the majority of NAS ticket sales are distributed online;statistics for 2013 shows that 80% of all ticket sales occurred through their website. In comparison,only 55% of SAS’ tickets was purchased online, whereas Ryanair managed to have 99%19 of allpurchased tickets through their website.20 Having a well-established online distribution channel isbeneficial for NAS as they avoid expensive commissions charged by travel agencies. Moreover, salesthrough their website imply that NAS collects payment when the ticket is purchased, which lowersworking capital requirements.
Brand Name A strong brand name has several benefits and is one of NAS’ greatest assets. A goodbrand image can affect a company’s future profits positively by further increasing ancillary revenues,create long term cash flow, and affect consumers’ willingness to choose exactly your company. Sincethe name “Norwegian” has a significant brand value we believe that this is a facet that contributeto building a sustainable competitive advantage. Arguably, since the resource is a result of historyshaping the company’s reputation over time, it becomes extremely difficult for others to imitate.
Simplicity This means that NAS enables the customers to choose what kind of service they wanton-board the flight, i.e. whether they want drinks or something to eat etc. This is a value creatingfactor for NAS, because the first price that the costumer is presented does not incorporate all pos-sible costs associated with the flight, for that reason the customer sees a lower price than they seewith e.g. SAS. The price sensitive customer, therefore, also has the opportunity to choose whether
19Though, it should be mentioned that Ryanair has a different report method compared to NAS and SAS.20Source: NAS, SAS and Ryanair annual report 2013
15 of 33
4.2 VRIO model 4 INTERNAL ANALYSIS
they want something to eat or drink on-board.
Looking at the closest competitors in Scandinavia it is a rare offer, though it is fairly common inthe rest of Europe. However, competitors can easily imitate it and therefore can the capability onlybe seen as a competitive advantage. NAS has used this capability within the organization to utilizeas much value as possible, which creates further value for the company.
Free Wi-Fi Service One trademark of NAS flights is that they offer Wi-Fi on all their flights21,but unlike many other competitors NAS has followed a strategy where they offer Wi-Fi for free, whichis somewhat unique for a LLC. Even though the majority of their customers are price sensitive, thetrend of today, is that a Wi-Fi connection is valuable both for leisure travellers as well as businesstravellers. The service is clearly valuable and rare but it is not inimitable, why it must be classifiedas a temporary competitive advantage.
High Frequency Destinations NAS has continued to improve their portfolio of flight destina-tions, hence providing a comprehensive network of high frequency business destinations to mainairports and a desirable choice of destinations for leisure travellers. This gives them a competitiveadvantage and makes them a natural choice for corporate business as well as for leisure travellers.Though, this capability is not rare on a large scale, it is rather rare for the LCCs because an LCCnormally flies to smaller less desirable airports. It is fairly easy to imitate why we classify this asbeing a temporary competitive advantage.
The value chain analysis and the VRIO model have conducted the conclusion that the brand name“Norwegian” is the single capability that can be determined as a possible sustainable competitiveadvantage. NAS as a whole, with the capabilities mentioned above, makes NAS unique in manyways. Their ability to stay competitive depends on whether or not NAS will succeed in their effortto sustain a competitive advantage in other business areas than their brand name.
21Except their long-haul flight, which are not offering this service.
16 of 33
4.3 SWOT – Part Conclusion 4 INTERNAL ANALYSIS
4.3 SWOT – Part Conclusion
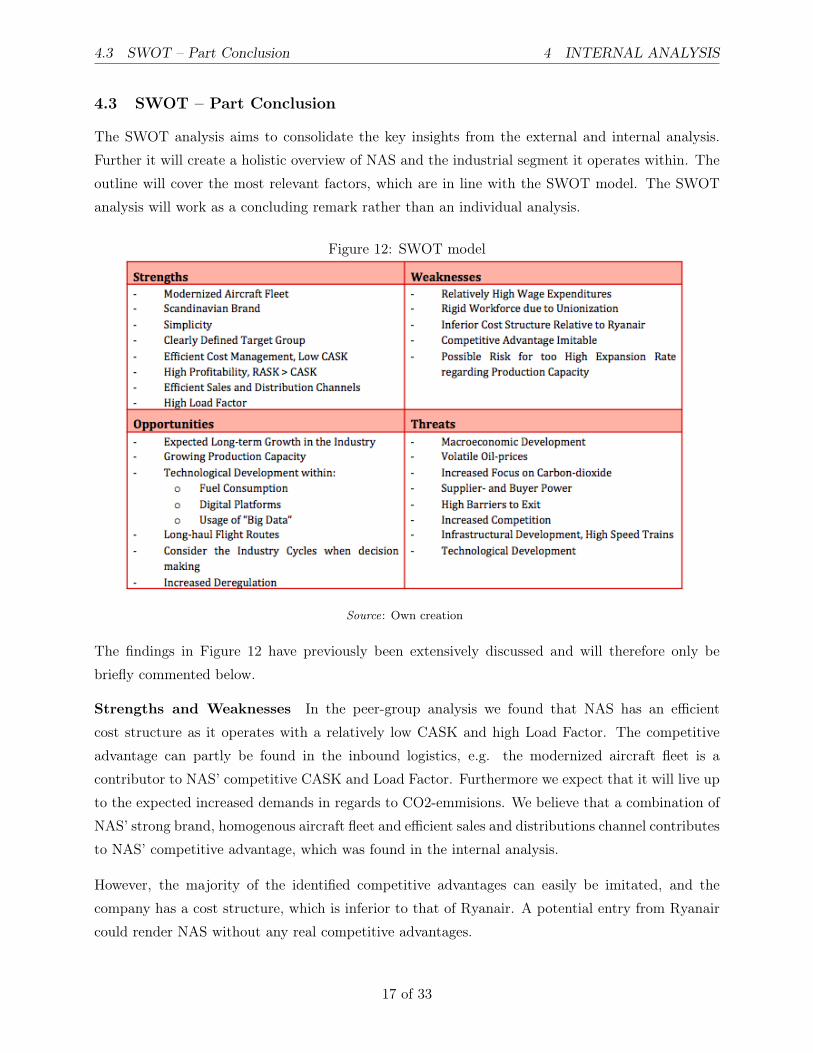
The SWOT analysis aims to consolidate the key insights from the external and internal analysis.Further it will create a holistic overview of NAS and the industrial segment it operates within. Theoutline will cover the most relevant factors, which are in line with the SWOT model. The SWOTanalysis will work as a concluding remark rather than an individual analysis.
Figure 12: SWOT model
Source: Own creation
The findings in Figure 12 have previously been extensively discussed and will therefore only bebriefly commented below.
Strengths and Weaknesses In the peer-group analysis we found that NAS has an efficientcost structure as it operates with a relatively low CASK and high Load Factor. The competitiveadvantage can partly be found in the inbound logistics, e.g. the modernized aircraft fleet is acontributor to NAS’ competitive CASK and Load Factor. Furthermore we expect that it will live upto the expected increased demands in regards to CO2-emmisions. We believe that a combination ofNAS’ strong brand, homogenous aircraft fleet and efficient sales and distributions channel contributesto NAS’ competitive advantage, which was found in the internal analysis.
However, the majority of the identified competitive advantages can easily be imitated, and thecompany has a cost structure, which is inferior to that of Ryanair. A potential entry from Ryanaircould render NAS without any real competitive advantages.
17 of 33

5 COMPETITIVE STRATEGY
Opportunities and Threats The scenario analysis and the key drivers of change indicated thatthe airline industry are highly cyclical and are mainly driven by the developments of GDP. Thiscreates both opportunities and threats to NAS. If they can time their investments as they did in2002 and in 2012, they might act faster on the market development than their competitors. Theforecasting segment also applies for their competitors, meaning that if the competitors are better atforecasting the future development this will be a weakness.
The technological development within Big Data enables NAS to direct their sales effort to where itis probable. This is an opportunity to cut marketing costs as well as to be able to focus on salesstrategies. The threat lying behind this is that the buyer power will increase because they will beexposed to more aggressive sales strategies, and are therefore more able to choose the solution thatfits their requirements, i.e. in our case the cheapest.
The liberalization of the European airline industry, both poses an opportunity to increase the market-share, though also a threat of new entrants to the home market.
5 Competitive strategy
The internal and external analysis has given an understanding of the market dynamics and NAS as awhole. This section will explore NAS’ strategic opportunities given their present strategic position,examine possible competitive strategies and finally investigate how these strategies will affect theinteractive strategies between NAS, competitors, suppliers and customers.
5.1 Porters Generic Strategy Framework
To evaluate how NAS can gain a competitive advantage it is important to analyse NAS’ ability, tocreate value for the customers that is higher than the costs they are paying, as well as doing it ata superior level relative to their peers. Looking at the present situation, NAS has a superior coststructure relative to its Scandinavian peers. An efficient cost-structure combined with an effectiveusage of operational assets has led to NAS being the cost-leader in Scandinavia, though they arestill threatened by outsiders such as Ryanair.
Given our internal and external analysis we find that NAS is the cost-leader in the broad segment.This is due to the fact that Ryanair has a more narrow target group, focusing on targeting leisuretravellers. Furthermore, they target passengers who can accept smaller airports and less beneficialinfrastructure. In all, in pursue of being the overall cost-leader, Ryanair has rendered them as beingfocused cost-leaders.
18 of 33

5.1 Porters Generic Strategy Framework 5 COMPETITIVE STRATEGY
Figure 13: Types of Generic Strategies
Source: Own creation
5.1.1 Cost-Leadership
Input Costs Overall, we found that airlines have the same underlying conditions in regards tooverall supplier power. NAS has to be seen as the price-taker, why this element is not where theycan gain a competitive advantage. We identified the airline industry as a labour-intensive industry.Scandinavia is known for its high labour costs why the strategic location of the main seat of NAS isnot beneficial. However, in terms of CASK, we found that NAS only marginally underperforms theEuropean benchmark, which aligns with the broader competitive scope that NAS wish to service.
Economies of scale Comparing Ryanair and NAS in terms of number of passenger and ASK wefind that Ryanair can exploit the economies of scale factor more than NAS. The simplification ofNAS’ fleet has implied less complexity in regards to maintenance, operational costs etc. implying alower CASK. Moreover, NAS’ production capacity has increased relatively more than e.g. Ryanairand SAS, why they to a larger extent can utilize the scale factor in the years to come.
Process design NAS’s scope is on core competences, why they have outsourced most of the workdone in the grounding process. Further they have met the demands for fast check-ins by setting upe-ticket stands in the airports. Overall we believe that the more lean structure has led to a higherload factor, which enables Norwegian to offer low-price tickets.
Potential Strategic Lock-in The frequent flyer program “Norwegian Reward” could pose theopportunity to create a lock-in situation. The frequent flyer can relatively fast obtain cashpoints themore they fly with NAS. The cashpoints can be used to acquire new tickets with a discount, travelinsurance etc. This incentivizes the customer to come back. Potentially NAS can try to create alock-in by expanding the benefits of “Norwegian Reward”. The low-cost tickets that NAS alreadyoffers, attracts younger customers. This complies with the lock-in theory; since the earlier thatNorwegian can attract a member, the greater the likelihood is that the customer’s switching costwill be so significant that a lock-in situation will occur.
19 of 33

5.2 Interactive Strategies 6 GROWTH STRATEGY
Risk of being stuck in the middle Since difference between the LCCs and FSCs are gettingsmaller and smaller, it could render NAS to be stuck in the middle. They are not as cost effectiveas Ryanair, nor are they as differentiated and flexible as SAS or the other FSCs. If customers getmore separated in their demands, i.e. 100% focus on cost and 100% focus on service, NAS could beseen as both; either as a cost competitive FSC with choices regarding service, or as an expensiveLCC with a large degree of service.
5.2 Interactive Strategies
To evaluate whether the Cost Leadership strategy can be sustained it is important to investigatethe interactive strategies from: Competitors, Suppliers and Customers. Competitors investigated inthe as the strategic groups.
The competitive strategy that we recommend is the one NAS is exploring at the present. Whystaying on this course should sustain the status quo. However, should Ryanair succeed in enteringNAS’ home market we would expect NAS to defend it. This could potentially be done by increasingthe number of departures, thereby lowering the profit rates or by a price war. If NAS choose tolower their price it will move the value line down and thereby create a price-pressure. We do notexpect that FSCs will react to NAS’ strategy.
Suppliers and customers should Ryanair choose to enter the market we expect the unions tofight for better working conditions, which is in favour of NAS. We expect that leisure customers willreact positively on a price war since they will be able to acquire tickets at a lower price, though ifRyanair are price competitive, it will lower the demand for NAS. Further we expect positive responsefrom price-sensitive frequent flyers due to lower prices, frequent flyers will not choose a company asRyanair due to the lack of service and flexibility.
Concluding remarks on competitive strategies NAS has the distinctive capabilities to pursuea role as the overall broad Cost-leader that caters to both the price-sensitive frequent flyer and theleisure traveller. The strategy should focus on capturing market shares to make a further exploitationof economies of scale. The main competitors are Ryanair and SAS, and NAS should aim at capturingSAS’s market share in Scandinavia and aim to defend the home market against/increase the entrybarriers for Ryanair.
6 Growth strategy
To assess which strategy NAS should follow in order to create further growth we have chosen toapply Ansoff’s growth matrix combined with a TOWS scenario analysis. The combination enablesthe possibility to determine what direction and method the organization should follow in order to
20 of 33

6 GROWTH STRATEGY
obtain the most profitable growth strategy, by taking different scenarios into account. To identifythe strategy one would have to look at the results from our analysis found earlier in the paper.Especially the SWOT analyse is useful in terms of consolidating the key insights and use them topredict the correct growth strategy.
TOWS model This model is a simple and a useful way to investigate different key scenarios givenexternal and internal relations. In addition, the TOWS matrix is an extension of the SWOT, whyit is a useful tool to analyse which strategic decisions should be made given different scenarios.
Figure 14: TOWS model
Source: Own creation
As pointed out, the TOWS help identify and address strategic actions needed in different situations.We have taken some of the most relevant scenarios and answered them such that NAS on a corporatestrategic level are suited for: 1. Take advantage of opportunities potentially lying in front of NAS,given their strengths, and 2. To minimize the impact the weaknesses can cause the company, thoughalso find a way to protect them against possible threats.
Suggested growth strategy To increase the likelihood for NAS to optimally utilize their strengthsand opportunities, as analysed in TOWS, we believe that the most appropriate growth strategy wouldbe to take the market development strategy, given in Ansoff’s growth matrix. This mainly involvesexpanding their business further by offering their existing product/service to new markets/regions.
21 of 33

7 ECONOMIC THEORY
The most efficient way, and in order to meet the critical success factors in the new market, wouldbe to seek the opportunity in expanding their long-haul flight routes into new markets/destinations.Also, we see a great opportunity for NAS to further increase the number of routes within theirpreferred market, i.e. Europe and especially Scandinavia. NAS has unlike other low-cost carriersmanaged to differentiate themselves from the standard business strategy group by offering tickets ata low cost but destined to primary airport within the European region. On the other hand, Ryanairare executing their strategy oppositely and follows the market penetrating strategy by focussing onlow cost tickets at the expense of choosing airports, which are seen as second to the ones NAS areoffering.
Since NAS is the broad target cost-leader, due to their unique brand and business strategy, we be-lieve they would be able to increase their market share if they enter new markets with their presentproducts. This makes market development the most appropriated growth strategy. NAS’ primarymethod of growth should come from organic growth through a further expansion in the Scandina-vian market and creation of new destinations for the long-haul operations. Organic developmentis where the strategy is pursued by building-on development and the existing capabilities. NASshould continue to take advantage of its increasing competitive power realized through continuouscost efficiency as well as exploitation of their brand value.
7 Economic Theory
In this section we will discuss some of the main economic theories behind the models used through-out the seminar paper, such as Porters Five Forces (PFF), Generic Strategies Framework (GSF),the VRIO model and Ansoff’s growth matrix (AGM).
The PFF model and the GSF model, which are used and analysed in Section 3.3 and 5, are based onneoclassical theory and take its point of departure in the Structure of Conduct Paradigm. Neoclas-sical theory is founded in the idea of perfect competition and is based on the following assumptions:Companies are identical with perfect information and technology, and only seeks to profit maximize.There are no transaction costs and companies optimize the production and outcome given marketdetermined supply and demand. The price of a product determines the supply and the demandand companies tries to create monopoly-like situations since this is where they will make abnormalprofit. Agents as well have perfect information and are capable of optimizing their utility given clearpreferences. This is referred to as the “economic man” or “homo economicus” who always behavesrationally. In PFF it is argued that companies should seek to create imperfections in the market thatcan be exploited as a monopoly-like situation; this is the same as turning neoclassical theory upsidedown, since this has the foundation in perfect competition. Critiques to the theory are that thetheory only creates a static picture of the industry, and thus do no incorporate on how companies
22 of 33

7 ECONOMIC THEORY
and industries develop over time. Further the theory lags the sequential game element and doesnot incorporate the agents’ move and counter move. This problem can be met by incorporatinginteractive competitive strategies, build around a sequential game tree. To incorporate the macro-economic environment and the institutional proportions and changes in the analysis one can use thePESTEL analysis. Further to diminish the static picture we have used scenarios trying to make amore dynamic analysis.
Porter’s GSF model also has its foundation in evolutionary theory; this theory helps to understandhow companies evolve. It is assumed that the companies are created by known and unknown rou-tines and are built around continuity and change. The theory’s scope is on the population and thedevelopment herein is based on the transmissions, variations, selections and consequences over along period’s accumulated processes. Individuals and industries develop routines to act efficiently.It is both market and organizational procedures that selects the most efficient routines. In relationto NAS they have been more cost-efficient relative to their competitors, why they could challengethe steady state and gain market shares even though they belong in an industry that are in thematurity stage.
In the internal analysis we used the VRIO model which is based on the resource-based approach(RBA) and the evolutionary approach. The RBA explains why some companies make more moneythan others, due to specialization, and the scope is therefore on the internal processes within theorganization unlike the external analysis. The theory assumes that companies possess a bundle ofresources, which in combination can be transformed into unique resources. A part of the resourcesare competences, which can develop over time. These competences can create competitive advan-tages since they are hard to acquire or develop. An important part of RBA can be explained fromthe ideas behind the theory of evolution, i.e. organizations’ routines form transmission mechanisms,innovations can be seen as variation mechanisms and that it is the market that selects the most effi-cient innovations over time. Ricardo Rate is one way of explaining differences in performance rates,i.e. either by the ability of being able to acquire resources cheaper than others, or by being moreefficient when using the resources. NAS exploits this by having a superior cost structure than itscompetitors, and by using their Scandinavian brand to gain goodwill among its potential customers.
To develop the growth strategy we used AGM, which is based on transaction cost theory (TCT).This theory identifies transactions as bearing: search and information costs, negotiation costs andenforcement costs. The assumptions behind TCT are: bounded rationality and agents acting op-portunistically. Overall this creates the need for regulating transactions. In AGM this coms to showwhen weighing whether: to chase a related diversification strategy or not, using horizontal or verticalintegration. The TCT therefore helps to understand when NAS should make related diversification,when to acquire a supplier or when they should outsource parts of its production.
23 of 33
8 CONCLUSION
8 Conclusion
In order for NAS to grow in the present market situation, we recommend them to choose a marketdeveloping strategy based on organic growth. Affectively, increasing their production capacity forlong-haul operations as well as strengthen their position in their home markets. Since NAS is thebroad target cost leader, we believe that they are able to increase their market share alone, basedon taking advantage of its increasing competitive power realized through continuous cost efficiency,as well as utilizing their brand value.
The critical success factors are in correspondence with the distinctive capabilities that NAS pos-sess, making them unique in catering both the price-sensitive frequent flyer and the leisure traveller.Their current market position is therefore considered somewhat safe, although potential threat ofentries to their home market and changes in the economic development should be well considered inthe competitive strategy. The TOWS matrix outlined that different scenarios should be counteredby different strategic actions.
The industry is characterised by a large degree of competitive rivalry, which implies high bargainingpower from buyers. The limited amount of suppliers, in regards to airports and aircraft manufactur-ers gives them the bargaining edge, lowering the profitability of the industry. NAS is significantlyexposed towards external factors such as the economic development of business cycles, political deci-sions (unionization and liberalization of the single “European Sky”) and volatility in oil prices. As abrief sum-up, NAS should keep its focus on its current capabilities, such as their lean cost structureand Scandinavian roots, and potentially consider a more aggressive growth strategy through organicgrowth in
24 of 33

9 LITERATURE LIST
9 Literature List
Books and Papers
1. Johnson, Gerry, Whittington, Richard and Scoles, Kevan, 2011, ”Exploring Strategy”, FTPrentice Hall, 9 . ed.
2. Mahoney, Joseph T., 2005, “Economic Foundations of Strategy”, Saga publications
3. Elkjær, Jørgen Ravn og Hjulsager, Kristian, 2012, “Årsrapport og Virksomhedsanalyse” KarnovGroup, 6. ed.
4. Nygaard, Claus, 2006, ”Strategizing – kontektstuel virksomheds teori”, Samfundslitteratur, 3.ed.
5. Butcher, Louise, 2010, ”Aviation: European Liberalisation, 1986-2002”, House of Commons
6. Wensveen, John G., Leick, Ryan, 2009, “The Long-haul Low-cost carrier: A unique BusinessModel”, Journal of Air Transport Management, vol. 15, issue 3.
Accounting Reports
7. Norwegian Annual reports [2008, 2009, 2010, 2011, 2012, 2013]
8. Ryanair Annual reports [2008, 2009, 2010, 2011, 2012, 2013]
9. SAS Annual Reports [2008, 2009, 2010, 2011, 2012, 2013]
10. Ryanair, Quarter 4. report 2013.
Web
11. Norwegian.com, 2015, ”Norwegian in Brief”, URL: http://www.norwegian.com/en/about-norwegian/our-company/norwegian-in-brief/, [13. March 2015]
12. KPMG.com, 2015, “Airline Disclosures Handbook 2013 v2”, URL: https://www.kpmg.com/Global/en/IssuesAndInsights/ArticlesPublications/Documents/airline-disclosures-handbook-2013-v2.pdf, [1. March 2015]
13. BCG.com, 2015, “Opportunities for Action – Planes, Trains and Automobiles”,URL: http://www.bcg.com/documents/file15463.pdf, [3. March 2015]
14. IATA.com, 2015, “Future Airline Distribution Report”,URL: http://www.iata.org/whatwedo/stb/documents/future-airline-distribution-report.pdf, [20.February 2015]
25 of 33

9 LITERATURE LIST
15. FT.com, 2015, “Boeing Beats Airbus”, URL: http://www.ft.com/intl/cms/s/0/a2f9121c-9aa0-11e4-86c2-00144feabdc0.html#axzz3VHzdLK5s [5. March 2015]
16. Ec.europa.eu, 2015, “Annual Analyses of the EU Air Transport Market 2012”,URL: http://ec.europa.eu/transport/modes/air/internal_market/observatory_market/doc/annual-2012.pdf , [15. March 2015]
17. Ec.europa.eu, 2015, “Single European Sky”,URL: http://ec.europa.eu/transport/modes/air/single_european_sky/index_en.html, [15. March2015]
18. Airlineprofiler.eu, 2014, “International Low-cost Airline Market Research”,URL: http://www.airlineprofiler.eu/2014/07/international-low-cost-airline-market-research/ [3.March 2015]
19. CAPA.com, 2013, “World Aviation Yearbook 2013 – Europe” URL: http://81.47.175.201/sky-water/attachments/article/91/2013_CAPA_Yearbook2013_Europe.pdf, [10 March 2015]
20. Higheredbcs.wiley.com, 2012, “The Airline Industry Value Chain”,URL: http://higheredbcs.wiley.com/legacy/college/turban/0471705225/web/online/ch01/w1_11.html[3. March 2014]
21. Europa.eu, 2011, “Inclusion of Aviation in the EU ETS: Commission Publishes Historical Emis-sions Dataon which Allocations will be based” URL: http://europa.eu/rapid/press-release_IP-11-259_en.htm, [4. March 2015]
22. Ec.europa.eu, 2013, “Reducing Emissions from Aviation”,URL: http://ec.europa.eu/clima/policies/transport/aviation/index_en.htm, [4. March 2015]
23. IATA.com, 2008, “IATA economic Briefing, 2008”, URL: https://www.iata.org/whatwedo/Documents/economics/IATA_Economics_Briefing_Impact_of_Recession_Dec08.pdf [15. March 2015]
24. Flightglobal.com 2013, “The pilotless Airliner is no Longer Unthinkable”URL: http://www.flightglobal.com/blogs/learmount/2013/08/how-long-to-the-pilotless-airliner/,[15. March 2015]
25. IATA.com, 2013, “Passenger survey 2013”,URL: http://www.iata.org/publications/Documents/global-passenger-survey-2013-highlights.pdf,[10.March 2015]
26. Cop21.gouv.fr, 2013, URL: http://www.cop21.gouv.fr/en [15. March 2015]
26 of 33
9 LITERATURE LIST
27. Telegraph.co.uk, 2011, “How the 2010 Ash Cloud Caused Chaos: Facts and Figures”, URL:http://www.telegraph.co.uk/finance/newsbysector/transport/8531152/How-the-2010-ash-cloud-caused-chaos-facts-and-figures.html, [20. March 2015]
28. Trafikstyrelsen.dk, 2014, “Information om Vulkanudbrud I Island”,URL: http://www.trafikstyrelsen.dk/DA/Presse/Nyhedsarkiv/Civil-luftfart/2014/08/Information-om-vulkanudbrud-i-Island-og-flytrafikken.aspx, [20. March 2015]
29. IATA.org, 2015, ”Future Airline Distribution Report”, URL: http://www.iata.org/whatwedo/stb/documents/future-airline-distribution-report.pdf, [3. March 2015]
30. Arbejdsretten.dk, 2014, “Hovedaftalen”, URL: http://www.arbejdsretten.dk/arbejdsretten/regler/hovedaftalen.aspx, [20. March 2015]
31. solar-flight.com, 2014, ”Sunseeker-i”, URL: http://www.solar-flight.com/projects/sunseeker-i/,[4. March 2015]
32. Stats.oecd.org, 2015, “DataBase”, URL: https://stats.oecd.org/Index.aspx?DataSetCode=UN_DEN,[4. March 2015]
27 of 33

A APPENDIX
A Appendix
A.1
Figure 15: Low Cost Model vs. Legacy Model
Source: Wensveen, John G., Leick, Ryan, 2009
A.2 - PESTEL Analysis
PESTEL is an environment analysis tool meant as guidelines for analysing the macro-environment.These are factors that the analysed company cannot affect, why they only have the opportunity toadapt. Changes in the external factors may inflict the company’s value-creating ability, why theseare essential to bring forth and analyse when forecasting market and the potential obstacles withinthe next 3-5 years. These are called the key drivers of change and will be analysed in the following.
Political and Legislation22
Liberalization Until 1987 the European airline market was protected and fragmented, causinga very limited and strict nationalized industry. The first step to liberalize the market, conductedin 1987, was to scale down the established rules by limiting government rights to object to theintroduction of new fares, which enabled some flexibility concerning seat capacity sharing. The
22Due to similarities, we have chosen to combine the political and the legislative factors.
28 of 33

A APPENDIX
second step, in 1990, increased the flexibility regarding capacity sharing and gave the right to carryan unlimited number of passengers between home market and another EU country. The third andlast step, in 1993, enabled “the right for an airline of one member state to operate a route withinanother member state”. This was later extended to Norway.23 The liberalization of the Europeanairline market enabled low-cost carriers to compete with the nationalized companies. NAS was oneof the first to profile them as cost leader in Scandinavian by exploiting the liberalization. The processhowever is a double-edged sword for NAS, since it enables other LCCs to compete for the positionas cost leader, e.g. Ryanair trying to get a foothold in Denmark.
CO2 quotas Since 2012 emission from all airline traffic within the European Economic Area(EEA) are included in the EU Emission Trading System. This includes non-EU airlines as well, aslong as it travels within EEA. This means “airlines receive tradable allowances covering a certainlevel of CO2 emissions from their flights per year.”24 ICAO forecasts that in 2020 emissions fromglobal international airline industry will be 70% higher than in 2005, further they forecast that thiscould grow by a further 3-700% by 2050.25 In sum up this means that in the long run the focuson CO2 emission from flights will increase, if consensus among the member states is to bring downoverall CO2 further than what is presently stated.
23Aviation: European liberalisation, 1986-200224Europa.eu, 2011, “Inclusion of Aviation in the EU ETS: Commission Publishes Historical Emissions Dataon which
Allocations will be based”25Ec.europa.eu, 2013, “Reducing Emissions from Aviation”
29 of 33

A APPENDIX
Economic
Business Cycle The airline industry is extremely sensitive towards business cycles IATA estimatesthat growth in air-travel follows the business cycle at twice the volatility rate of the macro economy.26
Low-cost carriers as Norwegian though are not as affected in down turns as full-service airlines, thisis seen in figure above where the development in the numbers of premium passengers were moreaffected than the number of economy passengers, why Norwegian was less affected by the globalfinancial crisis, than e.g. SAS. Given that air-travelling can be seen as a luxury good and can bedivided into premium and economy, this follows standard economic theory on the subject, i.e. whenincome falls demand on luxury goods fall, leading to a drop in overall demand for airline tickets.Furthermore, passengers who necessarily have to travel choose the low budget tickets due to theprice elasticity.
Oil Prices In figure below, we find that the jet fuel price is in close correspondence with the priceon crude oil. Since fuel accounted for 32,2% of Norwegians total operating expenses27, the drop inthe crude oil prices will benefit Norwegians bottom line. The significant share of the total operatingcosts implies that NAS is overall exposed toward price-fluctuations in the oil price.
26IATA.com, 2008, “IATA economic Briefing, 2008”27Norwegian Annual reports [2013]
30 of 33
A APPENDIX
Social
Oil Prices On the social factor lower oil prices affects the disposable income of households in thepositive direction. In the western hemisphere it is more common to have a car than not to haveone, why the disposable income is directly affected by the fluctuations. Given the prior definitionof a luxury good the drop implies increased demand for airplane tickets. Additionally, the economiccrisis might have affected the consumers and have therefore become more price-sensitive, which couldlead to a further increase in demand for economy-tickets rather than premium. Demography: Thedemographic development in Northern Europe implies an ageing population. According to IATAthis will negatively affect the number of business travellers, though increase the number of economytravellers. The population is trending towards a more globalized hemisphere, which implies thatmore people travel and people travel more frequently.28
Unions As discussed, the airline industry has since the ‘90s experienced liberalization, and areconverging towards a single “European Sky”. The workforce in the Scandinavian countries has ahistory of unionization and a relatively large degree of equality between rich and poor. The Union-ization has implied favourable conditions for the workers in the airline industry, compared to e.g.Ireland where the degree of unionization is fairly low.29 The unions in Scandinavia believe thatworkers should not be permitted to work under less favourable circumstances than under what isin the Union-agreement in Scandinavia, this has led to blocking for services in regard to groundhandling, boarding etc. for Ryanair.
In the court system in Denmark a union can block for services if the workers are working under theunions agreement, as long as the blockade is legally justifiable.30 Ryanair believes that the blockadeis not legally justifiable and has been appealed to High Court. If the trial does not fall out in favourof Ryanair, they will appeal it further to the European court, where they will trial the law as being incontradiction of the EU-Constitution. The final outcome of the trial may have severe consequencesin regard to cost-competition in the primary market of which Norwegian competes.
Technology
Efficient fuel consumption The technological development in the airline industry follows thesame rules as that of the automotive industry. They keep developing more fuel efficient and aerody-namic airplanes thereby bringing down the variable cost, and since fuel accounts for approximately32% of Norwegian’s total cost it is an area of interest. Lately there has been a technological break-through with solar driven airplanes where the latest test of such, has been to try to fly around the
28IATA.com, 2015, “Future Airline Distribution Report”29Stats.oecd.org, 2015, “DataBase”30Arbejdsretten.dk, 2014, “Hovedaftalen”
31 of 33

A APPENDIX
earth, in a two person aircraft, without the use of fossil fuels. If this can be blown up into a largerscale, the airline industry could lose the dependence of fossil fuels, though this is a prospect into thefar future.31
Automated airplanes Airplanes are the transportation-vehicle that has the highest degree ofautomation, the only processes that are not automated is the take-off- and the landing process.When the airplane has taken flight, the pilots are increasingly being told not to interfere with theautomation process. A further indicator of the airline industry going this way is, that unmannedremotely controlled air vehicles/drones has taken over a lot of the military’s airborne tasks. Thefirst ones who could possibly adopt this technology would be freighters, since the probability ofjeopardizing human lives are minimized in that industry. Later it is expected that the humancarriers will adopt the technology and thereby phase out the pilot segment of the aircraft.32
Trains China has chosen to build their infrastructure such that they have connected their largercities with high-speed trains; these can compete with the airline industry in matter of time, green-tech and cost, though these are not available on a mass scale in the EU. 33 Internet: The Internet hason one side lowered the administrative burden for the airline companies, though on the other sideit has also implied an increasing focus on relative prices. The price sensitive consumer looks for thebargain and thereby most often chooses the cheapest low-cost carrier. Big Data is a phenomenon,which also has come with the Internet. Small corporations gather intelligence on potential customers,this enable marketing divisions to focus their sales effort and improve the quality and relevancy oftheir offers to fit directly to each and every customer.34
Environment
CO2 emission The concern regarding carbon emissions has been somewhat ignored due to theGlobal Financial Crisis, further the present low price in oil lowers the attractiveness of investing inalternative energy and other low carbon technologies. Although, from a long-term perspective it maybe attractive to invest in low-carbon emitting technologies, due to corporate social responsibilities(CSR) and the conscious consumer. The likelihood of an increased attention towards reducing thecarbon-dioxide emission increases as long as the economic growth materializes and stabilizes. Theexpectations for a historical agreement at the UNFCCC COP 21 meeting, which is being held inParis in December 2015, are high and thereby creates an even more increased interest in loweringthe world’s CO2 emission.35
31solar-flight.com, 2014, ”Sunseeker-i”32Flightglobal.com 2013, “The pilotless Airliner is no Longer Unthinkable”33BCG.com, 2015, “Opportunities for Action – Planes, Trains and Automobiles”34IATA.com, 2013, “Passenger survey 2013”35Cop21.gouv.fr, 2013
32 of 33
A APPENDIX
Ash clouds and other natural disasters Natural disasters and especially volcanic explosionsare an environmental risk factor airline companies must take into account, e.g. the volcanic explosionon Iceland in 2010 grounded most of the North-European airliners for a longer period. This incidencecost the airlines 1,5e billion in total, more than 10 million people were affected, and 90% of all North-European flights were cancelled.36 The incident in 2010 has spawned a crisis-network to handle thesituation and do some degree of damage control.37 As before mentioned, having an aircraft groundedhits an airline’s profitability due to a lower revenue and compensation to travellers; the least affectedwill be the airlines with the best cost-structure.
36Telegraph.co.uk, 2011, “How the 2010 Ash Cloud Caused Chaos: Facts and Figures”37Trafikstyrelsen.dk, 2014, “Information om Vulkanudbrud I Island”
33 of 33


![Annual Report 2004 - Norwegian · 2015-06-29 · Annual report 2004 [Translation from the original Norwegian version] Norwegian Air Shuttle ASA 3 Norwegian’s strategy is to establish](https://static.fdocuments.net/doc/165x107/5f4ad0df100ba36d2251b0c7/annual-report-2004-norwegian-2015-06-29-annual-report-2004-translation-from.jpg)


