Northern Virginia (NOVA) Solar Proposal - catsr.vse.gmu.edu · Esri ArcMap Software Geospatial...
89
1 Northern Virginia (NOVA) Solar Proposal Michael Ham, Billy Mudd, Ramona Rubalcava, Shakib Vafaei Sponsored by: Center for Air Transportation Systems Research Copyright (CATSR/GMU) 2018
Transcript of Northern Virginia (NOVA) Solar Proposal - catsr.vse.gmu.edu · Esri ArcMap Software Geospatial...

1
Northern Virginia (NOVA) Solar Proposal
Michael Ham, Billy Mudd, Ramona Rubalcava, Shakib VafaeiSponsored by: Center for Air Transportation Systems Research
Copyright (CATSR/GMU) 2018

Agenda
1. Context Analysis
2. Concept of Operations
3. Data Collection & Modeling
4. Model Results & Data Analysis
5. Final Results of Alternatives
6. Final Recommendations
2

Context Analysis

Providing Analysis to a Utility Company
4
1. Currently buying electricity wholesalefrom coal power plants
Distributing energy to their residential customers for as low a price as possible
The energy market is moving awayfrom traditional energy sources
2. Analyze the changing energymarket
Find the effects of solar energyin their network
(Currently ~160 users or .1%)
Recommend changes to business model accordingly
from analysis

Energy Consumption Trends in the US
5
Traditional Energy (Coal) consumptions
are declining
Solar Energy consumptions are rising
Traditional Energy Solar Energy
Figure. EIA Energy Projections Figure. EIA Solar energy installations in Virginia

Energy Cost Trends in the US
6
Traditional Energy (Coal) costs are
rising (In VA +3.21% a year avg.)
Solar Energy costs are declining
Traditional Energy Cost Solar Energy Cost
Figure. EnergySage Solar costs decliningFigure. EIA Virginia Electricity costs for Residential

Solar Panel Technology and System
7
Photovoltaic Arrays
MonoCrystalline
Panels
Inverters
$
Net
Meter
Figure. Net metering
Converts energy to
Direct to Alternating
Current
Excess energy goes
back into the grid for
utility company
Home with Panels is
credited for Net
meter energy
(regulated by VA gov)

Northern Virginia Electric Cooperative
● Northern Virginia Electric Cooperative
○ Not for profit
○ 95% of customers are residential
○ 50% of Energy Demand is residential
○ Services 160,000 residential homes
● Wholesale Power from Pennsylvania Jersey Maryland (PJM) at ~$0.03/kWh
● Goal is to keep prices low for their Customers
Figure. NOVEC’s current Distribution Network
8

Gap Analysis: Risks In The Energy Market
9
NOVEC fails to identify the trends in energy and increasing amounts of customers moving to external solar energy
providers
Risk of losing revenue & failing to meet customer’s energy needs
Traditional electricity distribution with net metering
Solar Energy Integration/distribution to
customers

Stakeholder Analysis
10
● Tensions cause
trickle down cost
repercussions for the
Homeowner/Energy
User
● Government Entities
have the most
influence

Changing Federal and State Energy Policies
● Federal Investment Tax Credit (ITC)
Policies 30% investment credit on Solar
Energy
○ 26% in 2020, 22% in 2021, after
2021 residential is 0% and
commercial is 10%
● Potential for VA Carbon Tax on CO2
Emissions ($42 / ton of CO2)
○ Adds ~$0.01/kWh to Electricity
costs
● Avg. Electricity Price in the US = $
0.1213 / kWh
● Avg. Electricity Price in Virginia =
$0.1094 /kWhFigure. Electricity Prices in surround states w/o delivery
11

Concept of Operations

Problem Statement
As solar penetration levels rise in Virginia, NOVEC will begin to lose
revenue from the loss of traditional energy being distributed. NOVEC will
be forced to change pricing structures by raising electricity prices to
compensate for growing infrastructure costs.
13Current Environment in Virginia
● Solar Penetration in Virginia is currently at 0.1% for Residential solar, In 2017
approximately 2000 MW of solar energy was installed for Residential PV’s
○ On the Rise
● Average cost of Solar is estimated to be $0.12 cents per kWh
○ On the Decline
● Average cost of Electricity for NOVEC Residence is $0.13 per kWh
○ On the Rise

Need Statement
There is a need to analyze the effects of increasing amounts of solar energyusers in NOVEC’s distribution network on their current business model.
14
Furthermore, there is a need to identify the feasibility of new business models
that incorporate solar energy into their distribution network.

Mission Requirements
15
● MR 1. The system shall seek to minimize potential losses in profit and operating costs.
● MR 2. The system shall focus on regions currently serviced by the utility company.
● MR 3. The system shall seek to minimize customer costs.
● MR 4. The system shall incorporate infrastructure from the current model.
● MR 5. The system shall produce and identify feasible business models and plans of action to account for changes in energy policy and trends.

Assumed Breakdown of Business Model Costs
16
Per kWh
Distribution X<300 kWh
Distribution X>300 kWh
Local & State Taxes
Electricity Supplied
Overall Avg. Electricity
Price Panels are Sold at
Wholesale Price of Panels
Life Cycle Maintenance
Installation Costs
Misc. costs Solar Panel Profit
$15 $0.02109 $0.01609 $4 + $0.0015
$0.09731 $0.13
$22,000 $7,600 $1,200 $1,200 $1,500 ~$10,000
Always on Bill
Flat Service Charge
Per kWh Flat Fee and per kWh
Per kWh Per kWh
3x Wholesale 33 Panels per home, $230 ea
Services over lifespan
Labor and Time
Inverters, and more
Customer Bill(X = Energy Demanded)
Solar Panel Cost Breakdown

17
Alt(1): NOVEC’s Current Business Model
Figure. External Panel Supplier SolarCity

18
Alt(2): Proposal of Implementing Solar
Figure. Solar Panels from NOVEC

Method of Analysis
19

Data Collection & Modeling

Geospatial Information System (GIS): Analyze ~4,800 (~3%) of NOVEC Customer Base
● Esri ArcMap Software
○ Geospatial analysis of
datasets with
geographic locations
● Loudoun County
Geodatabase data
○ Building Polygon
○ Parcel Polygon
○ Address Points
● Loudoun Orthoimagery
○ Raster image of
Loudoun 2016Figure. ArcGis rooftop Analysis
21

Model Flow Diagram
22

NOVEC Service Region
● Designated lower right section of
Loudoun County as NOVEC Region for
Analysis
● Selected ~3% of NOVEC’s customer base
(4,800 out of 160,000)
● Removal of:
○ Commercial building points
○ No associated residential building
○ Unfinished buildings
○ Small sheds and garages
○ No matching NOVEC data point
● Extract raster data within the NOVEC
layer
Figure. Locating of Homes that fit requirements
Figure. Housing data matched with NOVEC address points 23

Visual Representation of Data Sets
= Sample 1(Medium Density)
= Sample 2 (High Density)
= Sample 3 (Low Density)
24Figure. Entirety of Loudoun with datasets highlighted
Figure. NOVEC’s servicing region in Loudoun County

X * 60 *0 .18 = kWh ProducedAccounts for panel decay with -.06% a year
(kWh/m^2 * # of panels in m^2 * panel efficiency)
Data Analysis
25
Figure. Area Solar Radiation Example Output
= X

GIS Model Results & Data Analysis

Production by Poor Solar NOVEC Homes: Solar Supply < Demand ALL Year
● Total Solar Produced = 5100 kWh/year
● % of Energy Offset by Solar System = 38%
● Net metered Energy = 0 kWh/year
Figure. Applying the Area Solar Radiation for July
27

Production by the Average NOVEC Home: Solar Supply > Demand in ONLY April
28
Figure. Applying the Area Solar Radiation for July
● Total Solar Produced = 6600 kWh/year
● Total % of Energy by Solar = 49%
● Net metered Energy = 51 kWh/year
● Net Metering Months: April

Production by Optimal Solar NOVEC Homes: Solar Supply > Demand @ April,May,June,July
29
Figure. Applying the Area Solar Radiation for July
● Total Solar Produced = 9200 kWh/year
● Total % of Energy by Solar = 69%
● Net metered Energy = 970 kWh/year
● Net Metering Months: April, May, June
Only Constitutes ~6-10% of NOVEC’s current Homes

Estimated Distribution of Solar Produced on NOVEC Homes
30● Currently very small market of customers benefiting from solar
~N(880,130)

Maryland Modern 2000 Sq ft. Solar Energy Generation: Measured Data vs. Model Prediction
31
● 20 Years Savings
for Modern 2000
Sq ft. Home is
$5,500
● Verification
Home falls
between Avg. and
Optimal for
NOVEC’s Region

Assumed Breakdown of Business Model Costs
32
Per kWh
Distribution X<300 kWh
Distribution X>300 kWh
Local & State Taxes
Electricity Supplied
Overall Avg. Electricity
Price Panels are Sold at
Wholesale Price of Panels
Life Cycle Maintenance
Installation Costs
Misc. costs Solar Panel Profit
$15 $0.02109 $0.01609 $4 + $0.0015
$0.09731 $0.13
$22,000 $7,600 $1,200 $1,200 $1,500 ~$10,000
Always on Bill
Flat Service Charge
Per kWh Flat Fee and per kWh
Per kWh Per kWh
3x Wholesale 33 Panels per home, $230 ea
Services over lifespan
Labor and Time
Inverters, and more
Customer Bill(X = Energy Demanded)
Solar Panel Cost Breakdown

Average Homeowner with Solar Predicted to Break Even in 19 Years
Total cost of Electricity = $48,000
Total cost of Electricity and Solar
Before Tax Credit = $52,000
Total cost of Electricity and Solar After
Tax Credit = $46,000
Savings for Customer (19 Yr. ROI) =
$2,000
33

Optimal Homeowner with Solar Predicted to Break Even in 14 Years● SolarCity’s research shows 82% of customers get Solar Panels for the cost benefit● After conducting a small scale survey, 50%+ of participants wanted to save at least
$10,000 over 20 years● Approximately 10% of homes produce enough to save $10,000 over 20 years
34
Total cost of Electricity = $48,000
Total cost of Electricity and Solar After Tax
Credit = $38,000
Savings for Customer (14 Yr. ROI) =
$10,000
NET LOSS FOR NOVEC

Final Results of Alternatives

NOVEC Conservative Solar Penetration Growth: Current Energy Environment
36
● At Year 10, 1% penetration or 1,600 solar energy users
● At the end of Year 10:
Alt (1) Losses = $31 mil.
Alt (2) Losses = $15 mil.
● Alt(1) because risks outweigh the cost benefits ($5.00/per customer/year)
Difference

Influential Factors of Savings for NOVEC Customers: Delivered Price of Electricity Most Critical
37
Low Base High
Electricity Cost ($/kWh)
0.08 0.09 0.17
Delivery Cost ($) 0.016 0.018 0.035
Solar Production (kWh)
5100 6600 9200
Carbon Tax ($) N/A 0 42
Solar Cost ($) 15000 16800 22000
Scenarios for NOVEC Customer
Figure. Tornado diagram of cost factors

Energy Environment in 5 Years (2023)
38
Now Cause of Increase
In 5 Years
Electricity Costs with Delivery (per kWh)
$0.133 3% Increase per year
$0.154
Carbon Tax (per kWh)
$0 Govt. Policy Changes
$0.0084
Solar Efficiency
18% Advances in Technology
20%
Cost of Panels $22,700 Decrease in Manufacture Costs
$20,000 Average Customer Saves = $13,000 LCCOptimal Customer Saves = $27,000 LCCBreak evens @ 10 Yrs. & 13 Yrs.*Does not include ITC

Aggressive Solar Penetration Growth: Energy Environment w/ Trends
39
● At Year 2033, 15%penetration or 24,000 solar energy users
● At Year 2033:
Alt(1) Losses: $570 mil.
Alt(2) Losses: $310 mil.
● Alt(2) now has a real justified cost benefit offsetting $80.3/customer/year
Difference

Final Recommendations
40
Now 3-5 Years
Proceed with Alt (1)
Conduct a Survey
Be aware of Factors
Re-Evaluate Alternatives
Continue to use current Business
Model, be ready to increase electricity
prices slightly
Conduct a survey of residences to find the
$ value of profit customers would move to solar at
Be aware of when factors reach this
value (sensitivity of electricity and solar
kWh)
In 3-5 years is when policy and factors will likely reach a turning
point in energy

Questions?

Acknowledgments&Sources

Sources
EIA, (12 May, 2016). EIA projects 48% increase in world energy consumption by 2040. Retrieved from
https://www.eia.gov/todayinenergy/detail.php?id=26212
Energy Information Administration. (2017). Electric power detailed state data. Retrieved from
https://www.eia.gov/electricity/data/state/
Rhodes, J. (2016, March 31). When Will Rooftop Solar Be Cheaper Than the Grid. US News. Retrieved from
https://www.usnews.com/news/articles/2016-03-31/when-will-rooftop-solar-be-cheaper-than-the-grid
Matasci, S. (2018, March 26). How Much Do Solar Panels Cost in the U.S. in 2018? Retrieved from
https://news.energysage.com/how-much-does-the-average-solar-panel-installation-cost-in-the-u-s/
Hobson, A., Munsell, M. (n.d.). Solar Market Insight Report 2017 Year In Review. Retrieved from
https://www.seia.org/research-resources/solar-market-insight-report-2017-year-review
Criste, L., Hoffman, J., and Grant, J. 2017. “Project Final Report for Solar Energy Generation.” White Paper, GMU SEOR
Department. http://seor.vse.gmu.edu/~klaskey/Capstone/DSGProject/downloads/DSGFinalReport.pdf
Casey. (2017, January 8). 2016 Solar Penetration By State. Retrieved from https://www.ohmhomenow.com/2016-solar-
penetration-state/
(Picture of States Surrounding Virginia). Retrieved from https://www.pinterest.com/pin/294985844318827461/
Solar Energy Industries Association.. (n.d.). Solar Industry Research Data. Retrieved from https://www.seia.org/solar-
industry-data
Richardson, L. (2018, March 1). 2018 SREC Prices: Explaining How to Sell Your RECs in the U.S. Retrieved from
https://news.energysage.com/srec-prices-explaining-u-s-srec-solar-market/43

Sources Cont.
Solar Energy Industries Association. (n.d.) Solar Investment Tax Credit (ITC).. Retrieved from
https://www.seia.org/initiatives/solar-investment-tax-credit-itc
(Picture of Solar Panel). Retrieved from http://idfabriek.com/home-solar-power-system-design.html/home-solar-power-
system-design-pleasing-inspiration
Virginia Department of Environmental Quality (n.d.). Net Metering. Retrieved from
http://www.deq.virginia.gov/Programs/PollutionPrevention/VirginiaInformationSourceforEnergy/DistributedGeneration/Net
Metering.aspx
NC Clean Energy Technology Center ( 2018). Net Metering. Retrieved from
http://programs.dsireusa.org/system/program/detail/40
DeBono, M. (2017, October 25). What Is Solar Energy and How Do Solar Panels Work? Retrieved from
https://us.sunpower.com/blog/2017/10/25/how-does-solar-energy-work/
(Picture of Solar Irradiation Map). Retrieved from https://www.nrel.gov/gis/solar.html
Solar Irradiance. (2017). Solar Electricity Handbook 2017 Edition. Retrieved from
http://solarelectricityhandbook.com/solar-irradiance.html
NOVEC. (2018). About NOVEC. Retrieved from https://www.novec.com/About_NOVEC/index.cfm
SolarCity. (2015). U.S. Homeowners on Clean Energy: A National Survey. Retrieved from
https://www.solarcity.com/sites/default/files/reports/reports-2015-homeowner-survey-clean-energy.pdf
44

Acknowledgements
George Donohue (GMU,
SEOR / CATSR)
Robert Bisson (NOVEC,
Vice President Electric
System Development)
45
Lance Sherry (GMU, SEOR
/ CATSR)
Paul Houser (GMU, GGS
Department)
We would like to Acknowledge the assistance received from…

Backup Slides

Sources (backup)https://governor.virginia.gov/media/4371/eo-36-continuing-qualified-energy-conservation-bondsada.pdf
http://news.energysage.com/solar-panel-efficiency-cost-over-time/
https://spectrum.ieee.org/energywise/energy/renewables/efficiency-of-solar-cells-continues-to-climb
https://s3.amazonaws.com/ecodirect_docs/HANWHA/Hanwha_Q_CELLS_Data_sheet_QPEAK_BLK-G4.1_290-
300_2016-09_Rev03.pdf
https://es-static-prod.s3.amazonaws.com/static/img/solar/solar-101/Net-metering-animation.388bae5d381a.gif
https://www.greentechmedia.com/articles/read/10-ways-to-solve-the-renewable-duck-curve#gs.BliT5aA
http://seor.vse.gmu.edu/~klaskey/Capstone/DSGProject/downloads/ProjectProposalDSG.pdf
https://www.novec.com/About_NOVEC/Annual-Report.cfm
https://www.solarcity.com/sites/default/files/reports/reports-2015-homeowner-survey-clean-energy.pdf
https://inhabitat.com/new-photovoltaic-solar-technology-boosts-efficiency-to-50/technion-photovoltaic-cell-efficiency-2
https://www.solarreviews.com/blog/how-much-electricity-does-a-solar-panel-produce (NOVA Logo panel photo)
http://nge.press/single-red-roof-tiles/cartoon-images-seamless-clay-terracotta-tile-beautiful-seamless-single-red-roof-tiles-
clay-terracotta-tile-beautiful-ing-texture-u-old-sc-st-jpg/ (regatta rules)
https://www.sketchuptextureclub.com/textures/architecture/wood-planks/siding-wood/blue-siding-wood-texture-seamless-
08827 (blue wood)
47
https://governor.virginia.gov/media/4371/eo-36-continuing-qualified-energy-conservation-bondsada.pdf

The Solar Panel System
● Photovoltaic array generates energy by
harnessing light
● Inverters convert solar energy from an Direct
Current (DC) to Alternating Current (AC) -
inverter used is SolarEdge#SE7600A
● Batteries not being considered
● Always need to be connected to the grid
Net Metering:
● Capabilities established by Grid Tie Inverters
● Excess solar energy generated relocates back
into the grid
● Net metering is regulated
48
Figure. Net metering

49
States Surrounding Virginia
State Electricity Price
(cents per kwh)
SREC Market
Available
Maryland 12.95 Yes
Washington
D.C.
12.30 Yes
West Virginia 11.05 No
Virginia 10.94 No
North Carolina 10.27 Yes
Tennessee 10.02 No
Kentucky 9.78 No
Figure. Neighboring StatesTable. Prices do not include delivery costs

ITC Changes over the next years
50

Assumed Breakdown of Business Model Costs
51

Environmental Impacts
With about 33 Panels, Reduce
your yearly carbon emissions by ~
10.6 Metric Tons of CO2
Equivalent of your car’s emissions
in a year x2
52

Solar Energy Generation Factors
Solar Energy is Stochastic
● Surface Area of roof
○ Square footage for Panel
Placement
● Shading
○ Shadows cast onto a roof
● Weather/Time of Year
● Solar Radiation
● Azimuth Angle
○ Pitch of roof & Slope
○ Direction of roof
■ West / South West
Facing are optimal Figure. Average Solar Radiation levels in the United States
53

Solar Penetration Levels
● In 2017, Virginia installed 2,227 MW for Residential PV
54
Figure. Solar Penetration Levels based on State
Figure. Installed MW of Solar in Virginia

Competitors
55
NOVEC Dominion BGE
# of Customers 161,000 6 million 1.25 million
# of Employees 308 employees 16,200 3,200
Revenue in 2016 $468 million $11.7 billion $3.23 billion
Investment in Solar N/A $979 million $15 million
Cap on Net Metering 1% of peak-load for the
previous year (Open EI)
1% of peak-load for the
previous year (OpenEI)
10% of peak-load
for the previous
year
Solar energy efforts -Net Metering
-Fauquier County Livestock
Exchange
-Net Metering
-Solar Partnership Program
with schools/universities
-PPA
-Goal to use 8 million panels
by 2018
-Net Metering
-Provide
estimation,
consultation,
installation, and
maintenance of
solar system for
customers

Solar Energy Trends● The efficiency of solar panels is
going up each year
● The cost of solar is going down
each year, the average cost is
around $.12 per kwh
● Single junction cell theoretical max
efficiency of around 30%
Figure. Solar Panel Efficiency Trends 56Figure. Decline Cost per kWh for Solar

Limitations of Solar Energy
*The Duck Curve for California [15] 57

NOVEC Report
58NOVEC 2012-2016 annual report [2]

NOVEC Cont.
● NOVEC has office locations located
throughout our service territory in Manassas,
Gainesville, Leesburg and Minnieville.
● NOVEC's service territory encompasses 651
square miles with more than 7,200 miles of
power lines.
● NOVEC provides reliable electric service to
more than 167,000 homes and businesses
located in Clarke, Fairfax, Fauquier, Loudoun,
Prince William and Stafford counties, the City
of Manassas Park and the Town of Clifton, all
in the state of Virginia.
● NOVEC is a not-for-profit corporation. As a
cooperative it is owned and controlled by its
customer-owners — the customers who
purchase energy from NOVEC.
● NOVEC's customer-owners elect a board of
directors which governs all Cooperative
business affairs.
● The majority of NOVEC's customers are
residential and small commercial, however we
provide electric service to numerous large
commercial retailers59

Reliability and Maintainability
● Hanwha Q Cell 4.1
● Need for maintenance is
extremely low
● Average loss in energy
panel efficiency is around
5% from weather and debris
such as dirt and dust
● Panel efficiencies degrade
over time (Year 5 = 95%,
Year 10 = 93%, Year 12 =
92%)
*Warranty graph of Q cells efficiency [10]60

Adjustments / Loss Mitigation Strategies
● Delivery cost increase helps
NOVEC’s revenue but hurts
customers
● Nevada tripled the fixed fee that
customers pay and reduced the
credit customers earn for net
metering
○ SolarCity, Sunrun, and Vivint
Solar all left state of Nevada
● Find plan to allow NOVEC to earn
tax credit but sell panels at a
discounted price
61
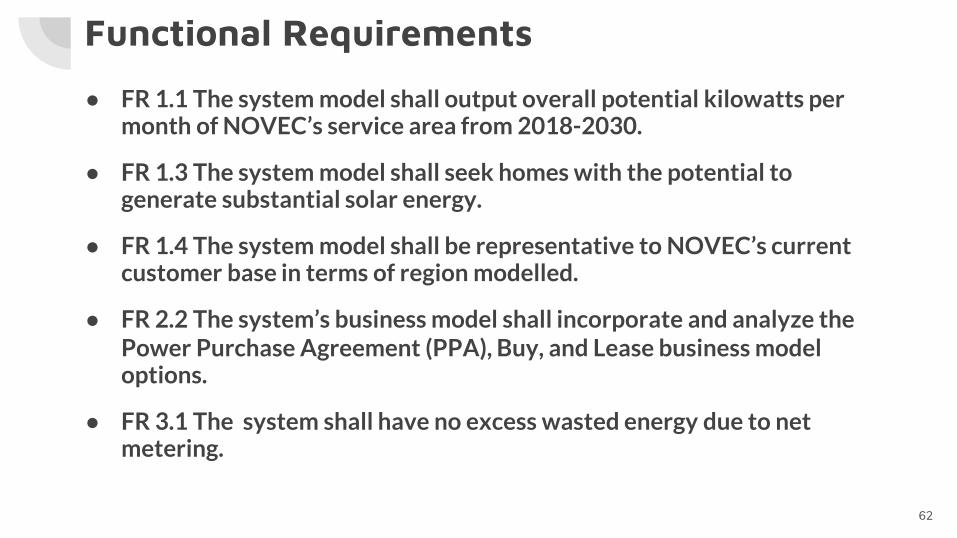
Functional Requirements
● FR 1.1 The system model shall output overall potential kilowatts per month of NOVEC’s service area from 2018-2030.
● FR 1.3 The system model shall seek homes with the potential to generate substantial solar energy.
● FR 1.4 The system model shall be representative to NOVEC’s current customer base in terms of region modelled.
● FR 2.2 The system’s business model shall incorporate and analyze the Power Purchase Agreement (PPA), Buy, and Lease business model options.
● FR 3.1 The system shall have no excess wasted energy due to net metering.
62

Design Requirements
● DR 1.1 The system shall be able to get the necessary energy from their panels without exceeding a 10 kwH system
● DR 1.3 The system shall use Hanwha Q-cells G4.1 300W panels that cost $250 per panel at wholesale in 2018 as a baseline.
● DR 1.6.1 The system’s decay shall be: Year 1 = 100% (98%), Year 5 = 95%, Year 10 = 93%, Year 12 = 92%.
● DR 2.2 The system shall account for growth in penetration (.1% ,1%,
2%, 4%, 8%, 16%, 30%)
63

Assumptions
● Maryland Data is representative of Virginia Region
● 4800 Homes is representative of NOVEC region
● Customers want to maximize potential energy from solar systems
○ Size of system installed
● Assumed Installation costs nad Misc. Costs of panels
● Assumed profit # from panels
● Assumed baseline is correct and trends will continue
64

65
Solar panel decaying efficiency

Steps of Analysis
66

*Master Student Data
GIS Spatial Analyst Tools
67

Model Information
The outputs are used to determine the best design alternative and get estimates for potential business models.
Input ParametersRandom
VariablesTransfer
FunctionsOutputs
● Address
Points
● Raster File
● Building
Parameters
● Loudoun
County
Layer
● Solar
Penetration
Level (.01%...)
● Square
Footage
● NOVEC
Serviced
Residences
● PV Array Size
● Weather
○ Counteract
the variability
by using
monthly data
● Address points that
do not represent
actual residences
● Azimuth
● Elevation
● Shading
● Time of Year
● Surface Area
of Roof
● Irradiance in
Region
● Potential
Solar Energy
by individual
residential
rooftop
systems
68

No Low Pass Filter Vs. Low Pass Filter
69

Removing Unwanted Data
70
Figure. Identifying Bad Data

Modeling Settings
71

Annual Energy Not Supplied by NOVEC vs. Solar Penetration Level
● About 10% of modeled region fall in
the optimal range of production
At 15% Penetration (Optimal & Average
Homes), Yearly Energy Amounts:
● Do Nothing Energy Demanded = 320
million kWh
● Solar Energy Produced= 200 million
kWh
● Energy Distributed offset by Solar =
~9.5% of total ~2.1 billion kWh
● Net metered Energy= 16 million kWh
72

Visualizing Net Metering for Optimal Homes
● April, May, June
73

Verifying Energy Demand Data
74
● Comparison of
NOVEC’s Energy
demand versus
Modern 2000 sq
ft. Home’s Energy
demand

Comparing Categorized Optimal Homes
75

Comparing Data Sets
Month
% Difference for
Sample 1 and 2
% Difference for
Sample 1 and 3
January 0.06 0.02
February 0.05 0.02
March 0.02 0.00
April 0.00 0.01
May 0.00 0.01
June 0.00 0.01
July 0.00 0.01
August 0.00 0.01
September 0.01 0.00
October 0.04 0.01
November 0.06 0.02
December 0.04 0.01
Estimated Annual Production (kWh)
Sample_1 6580
Sample_2 6664
Sample_3 6556
76
● 95% Confidence Interval Combing the 3 samples = 6600 +/- 13 kWh

Distribution of Homes
Use aggregate tool to find histogram/distribution of houses in 1600 data set layer
How much they produce distribution
Put how much each sigma would save $$ as customer
Do that for current status
Then make this slide again and put it after slide 42 to show how in 5 years that distribution changes and $$’s change at sigmas
Aggregate tool
Averages pixels into 4 blocks a home
Analyze Histogram to find where homes lie77

Penetration
Now only looking at homes that fit the survey criteria (x% fall within this range)
Make conclusions about what happens at 1% penetration…
Using national averages (penetration will grow more than linearly)
In two years, what % of homes would be in the 7500 range
(Z factor)
RELATE THIS TO THE PENETRATION SLIDE IN MODEL RESULTS
78

Conservative Function
79
y = 40*e(3611t) + 120where t={0:10 years},
Optimal Homes will be the ones moving to Solar Energy

Aggressive Function
80
y = 40*e(3611t) + 120where t={0:10 years},
60% are Average, 40% are Optimal Homes moving to Solar Energy

Cost Breakdown
81
Cost for Panels
Cost Per Panel $250
Panels required per house 33 panels
Initial .1% penetration (houses) 155
Total Costs for Panels ~$1.3 Million
Estimated Cost for Installation
Number of installers 4
Hours required per house 6
Initial .1% penetration (houses) 155
Rate per Installer $50
Total Cost for Installation ~$190,000

NOVEC POV and NPV
Traditional
Energy
Competitor
Sells Panel
NOVEC Sells
Panels
Traditional
Energy
48000 30000 30000
Panel 0 0 22000
Panel Costs 0 0 -10000
PJM Costs xxx xxx xxx
48000 30000 42000
82
Optimal Home NPV = -$720 w/o Net Metering
Avg Home NPV = -$6,400 w/o Net Metering

Business Model Options
83
Purchase or Loan Power Purchase Agreement (PPA)
Costs up front for NOVEC ~$12,000 per house ~$12,000 per house
Tax Incentive Customer receives tax credit NOVEC receives tax credit
Maintenance NOVEC is responsible NOVEC is responsible
Benefit for Customer - Reduce electric bill - Potential to get credit
-Lock in the price of electricity at a discounted rate for length of contract- No upfront costs
Benefit for NOVEC - Helps alleviate peak load for utility company- High profit margin on panel sales
- Helps alleviate peak load for utility company
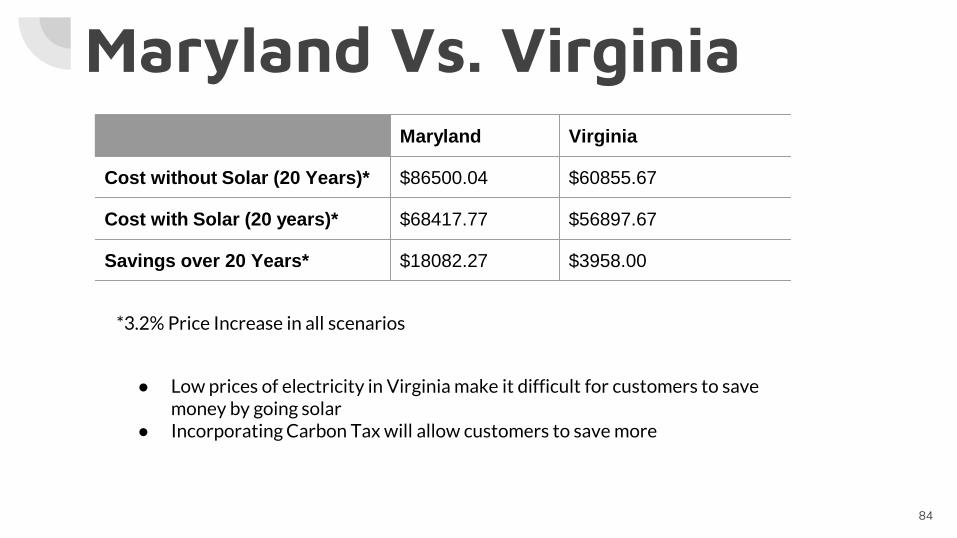
Maryland Vs. VirginiaMaryland Virginia
Cost without Solar (20 Years)* $86500.04 $60855.67
Cost with Solar (20 years)* $68417.77 $56897.67
Savings over 20 Years* $18082.27 $3958.00
*3.2% Price Increase in all scenarios
● Low prices of electricity in Virginia make it difficult for customers to save money by going solar
● Incorporating Carbon Tax will allow customers to save more
84

Comparing Growth Scenarios
2018-2028 5 Year Lossesdue to Solar(.02% Pen.)
10 YearLosses due to Solar (1% Pen.)
(1) Do Nothing $7 Million $31 Million
(2) Implement Solar
$3.4 Million $15 Million
Difference (Offset due to Panel Profits)
$3.6 Million $16.0 Million
$ Required to Recoup Losses in Difference
~$1.1 per Customer/Year
~$5 per Customer/Year
Conservative Growth’s Effect on
NOVEC
Aggressive Growth’s Effect on
NOVEC
2023-2033 5 Year Lossesdue to Solar(2.4% Pen.)
10 YearLosses due to Solar (15% Pen.)
(1) Do Nothing $93 Million $570 Million
(2) Implement Solar
$51 Million $310 Million
Difference (Offset due to Panel Profits)
$42 Million $260 Million
$ Required to Recoup Losses in Difference
~$13 per Customer/Year
~$80 per Customer/Year
85

Influential Factors for NOVEC Profit:Delivered Price of Electricity Most Critical
86
Low Base High
Solar Panel Profit ($) 8000 10000 18000
Electricity Cost ($) 0.08 0.09 0.17
Delivery Cost ($) 0.016 0.018 0.035
Solar Produced (kWh)
5100 6600 8600
Wholesale Electricity Costs ($)
0.026 0.032 0.056
Scenarios for NOVEC

Electricity Sensitivity for Customer
87

Final Recommendations
● Proceed with Alternative (1), current business model
○ Risk involved is not worth the profits from selling solar panels
currently
○ Re-evaluate in 3-5 years
● Be prepared for a large spike in Solar Energy Penetration as savings get
to $10,000 for the customer
○ Be aware of when Electricity Costs Rise to ~$.17/kWh
○ Be aware of when Solar Production Factors Reach a point where
customers ~9000 kWh a year
● Have NOVEC conduct a survey of their residential customers to see how
much they would need to save to switch to solar panel systems88

Future Studies
● Conduct a survey to residences currently serviced by NOVEC in order to
accurately find when customers will move to solar energy
● Analyze effects of solar energy on the benefits on NOVEC’s infrastructure and
peak demand costs
○ West Facing solar panels
● Investigate using batteries for solar energy into network when solar
penetration is very high
● Investigate viability of solar farms and commercial rooftops
89