Northeast Area Effective Communications Communication.
26
Northeast Area Effective Communications Communication ®
-
Upload
jessie-wiggins -
Category
Documents
-
view
221 -
download
2
Transcript of Northeast Area Effective Communications Communication.
Northeast Area Effective Communications®
Communication
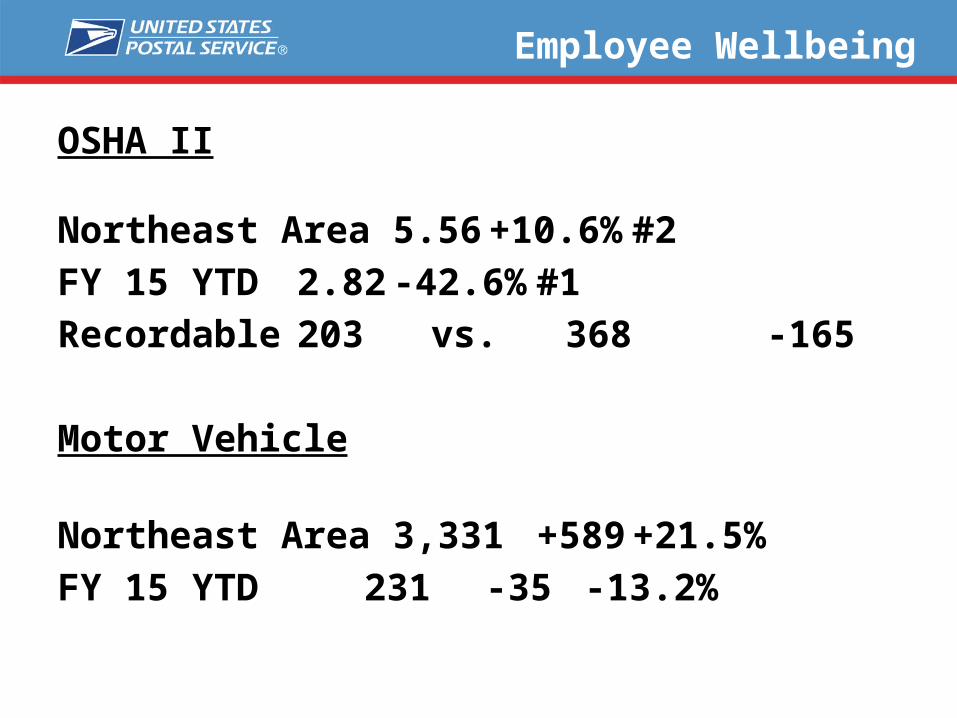
Employee Wellbeing
OSHA II
Northeast Area 5.56 +10.6% #2
FY 15 YTD 2.82 -42.6% #1
Recordable 203 vs. 368 -165
Motor Vehicle
Northeast Area 3,331+589 +21.5%
FY 15 YTD 231 -35 -13.2%
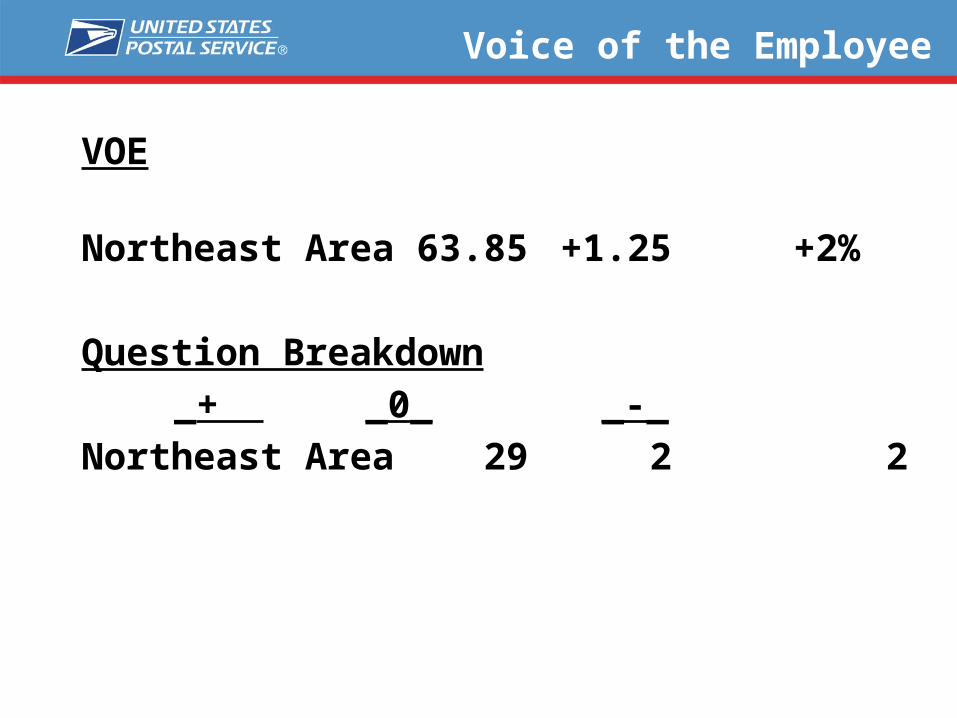
Voice of the Employee
VOE
Northeast Area 63.85+1.25 +2%
Question Breakdown
_+ _0_ _-_
Northeast Area 29 2 2
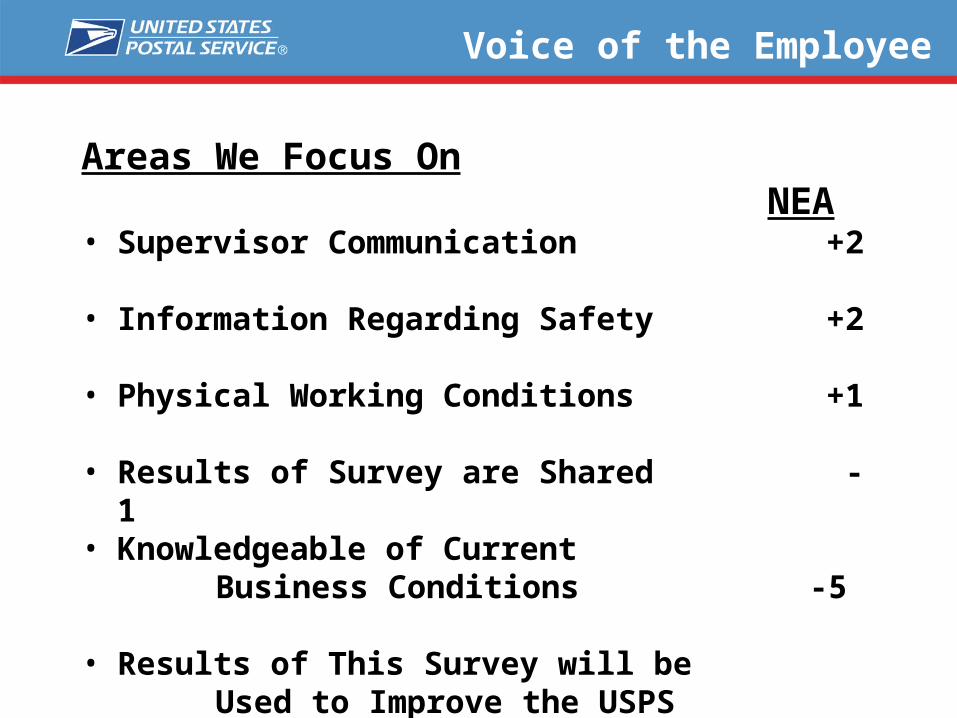
Voice of the Employee
Areas We Focus On NEA
• Supervisor Communication +2• Information Regarding Safety +2• Physical Working Conditions +1• Results of Survey are Shared -1• Knowledgeable of Current Business Conditions -5• Results of This Survey will be Used to Improve the USPS +2• Understand Products/Services +1

New VOE Questions
The Customer Experience
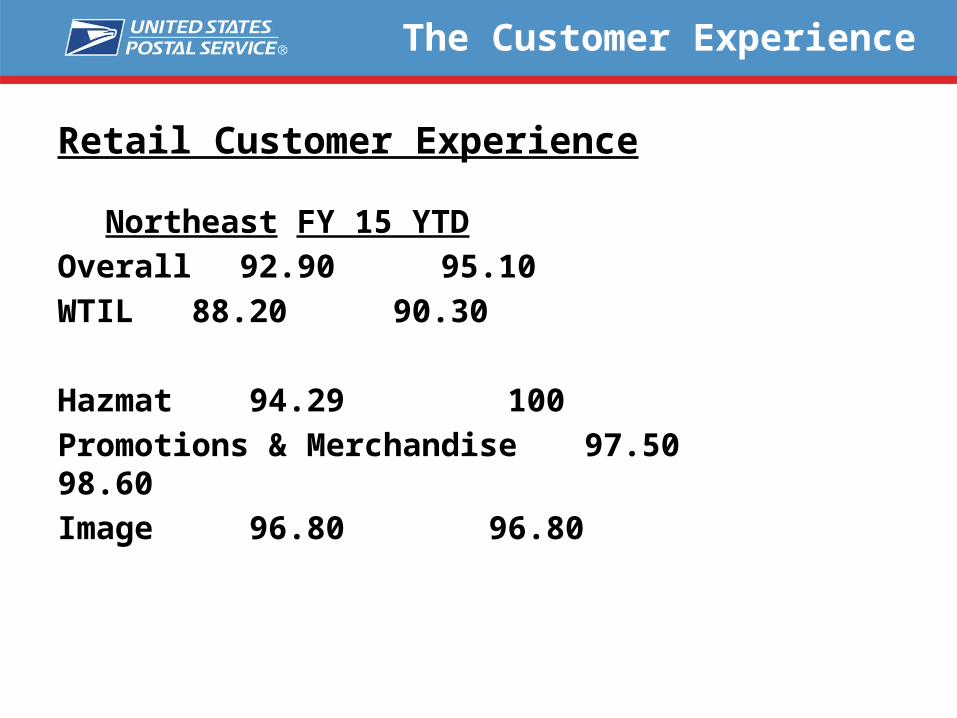
Retail Customer Experience
Northeast FY 15 YTD
Overall 92.90 95.10
WTIL 88.20 90.30
Hazmat 94.29 100
Promotions & Merchandise 97.50 98.60
Image 96.80 96.80
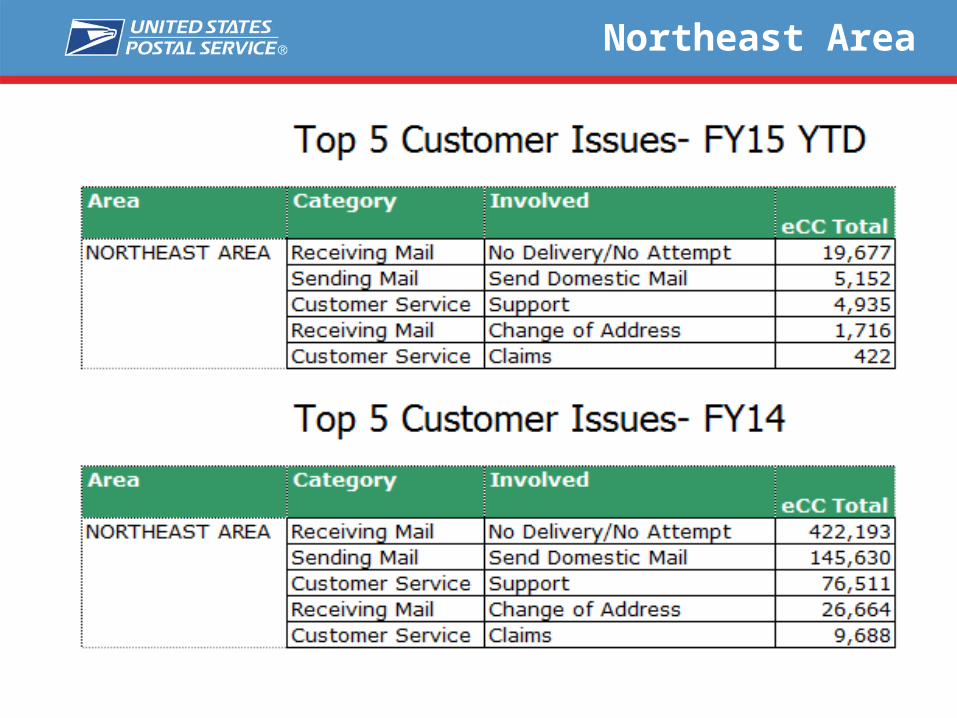
Northeast Area
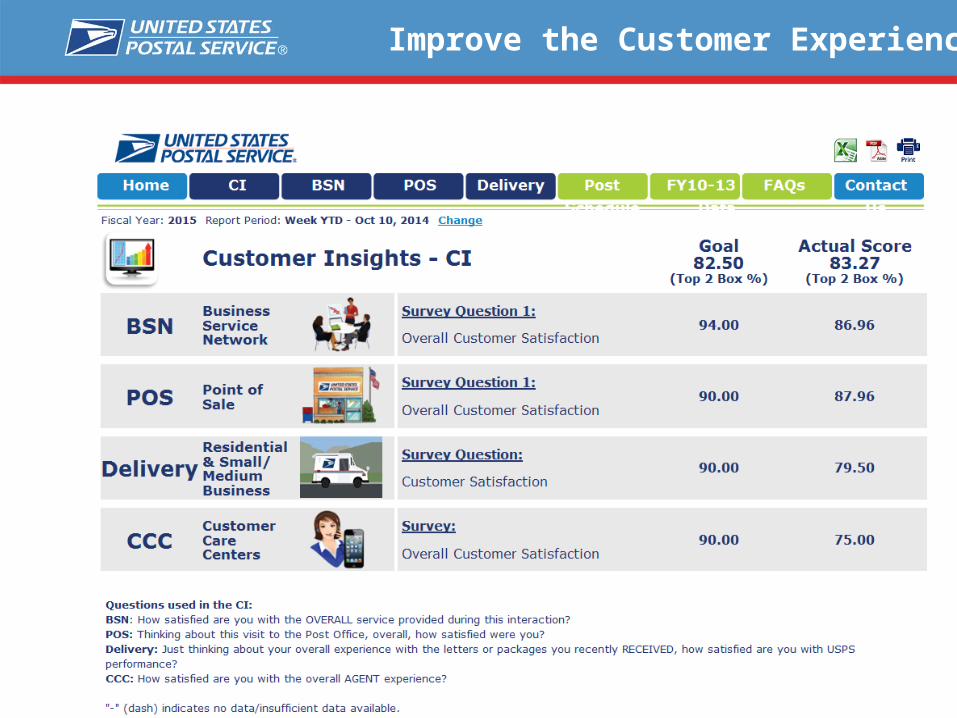
Improve the Customer Experience
Improve the Customer Experience
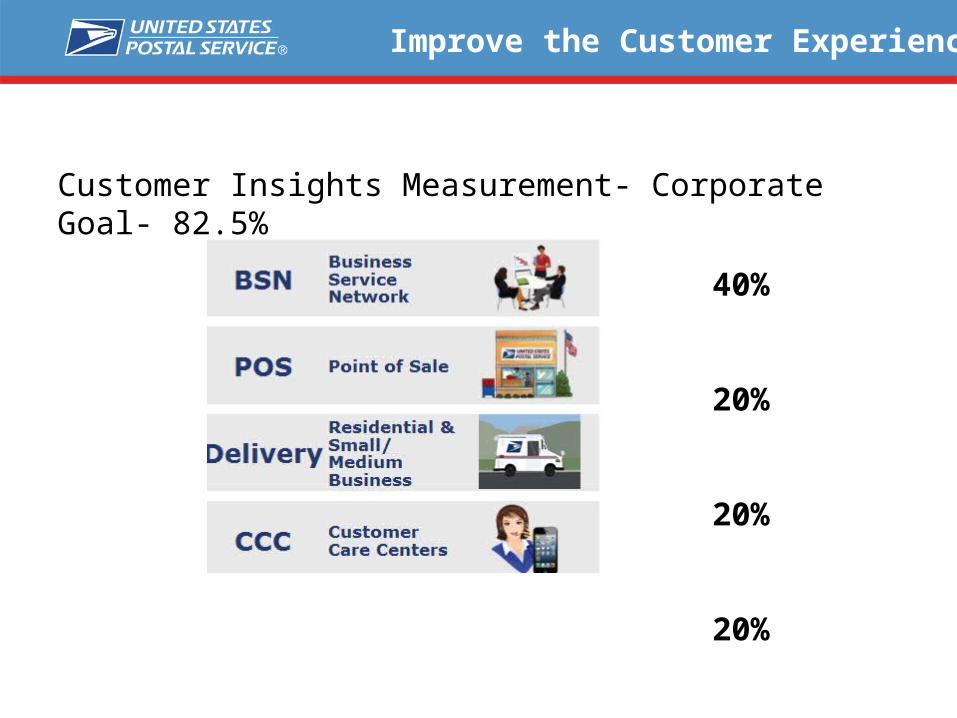
Customer Insights Measurement- Corporate Goal- 82.5%
40%
20%
20%
20%
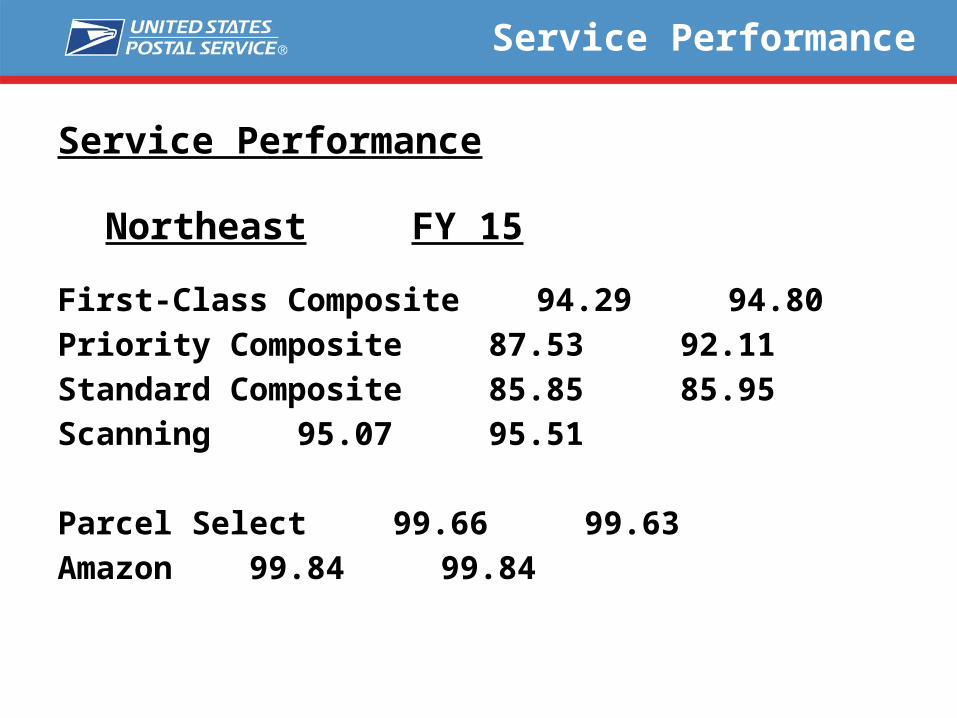
Service Performance
Service Performance
Northeast FY 15
First-Class Composite 94.29 94.80
Priority Composite 87.53 92.11
Standard Composite 85.85 85.95
Scanning 95.07 95.51
Parcel Select 99.66 99.63
Amazon 99.84 99.84
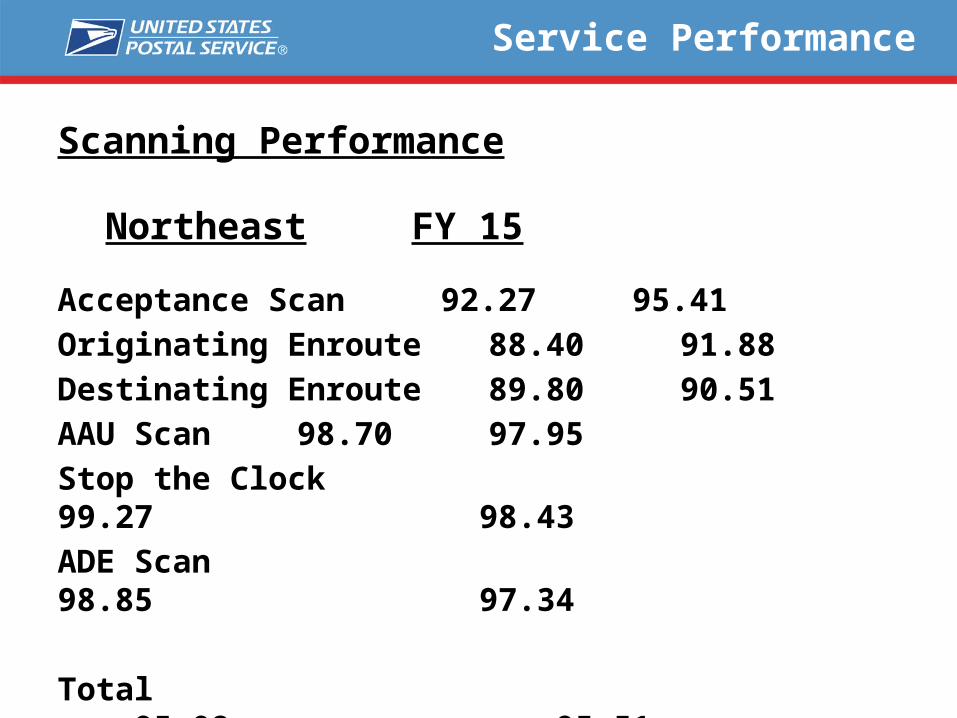
Service Performance
Scanning Performance
Northeast FY 15
Acceptance Scan 92.27 95.41
Originating Enroute 88.40 91.88
Destinating Enroute 89.80 90.51
AAU Scan 98.70 97.95
Stop the Clock 99.27 98.43
ADE Scan 98.85 97.34
Total 95.08 95.51
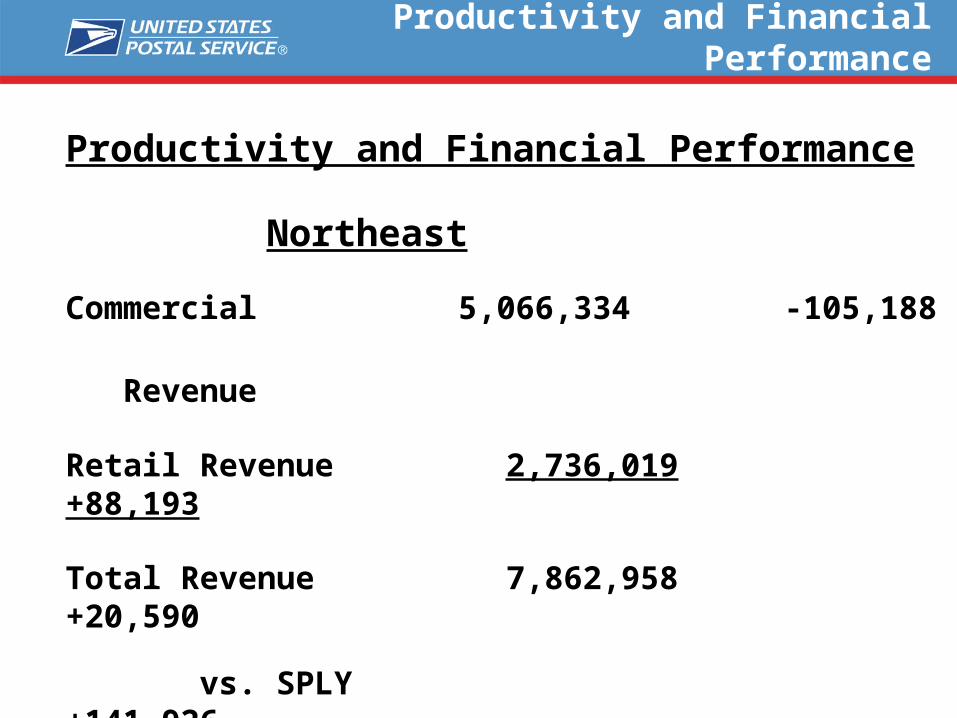
Productivity and Financial Performance
Productivity and Financial Performance
Northeast
Commercial 5,066,334 -105,188
Revenue
Retail Revenue 2,736,019 +88,193
Total Revenue 7,862,958 +20,590
vs. SPLY +141,926
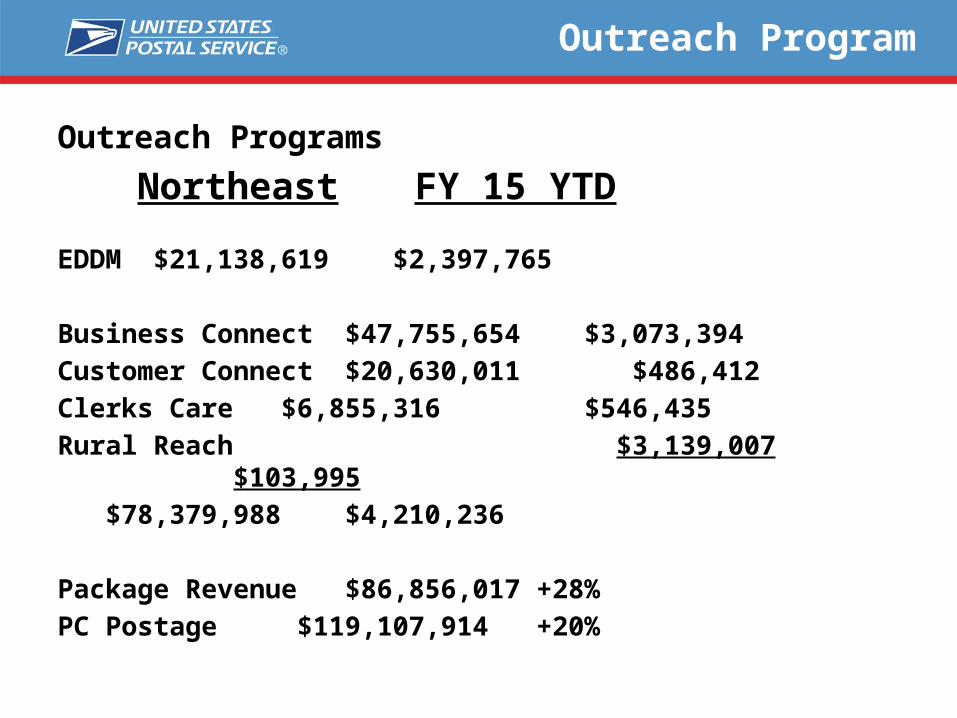
Outreach Program
Outreach Programs
Northeast FY 15 YTD
EDDM $21,138,619 $2,397,765
Business Connect $47,755,654 $3,073,394
Customer Connect $20,630,011 $486,412
Clerks Care $6,855,316 $546,435
Rural Reach $3,139,007 $103,995
$78,379,988 $4,210,236
Package Revenue $86,856,017 +28%
PC Postage $119,107,914 +20%
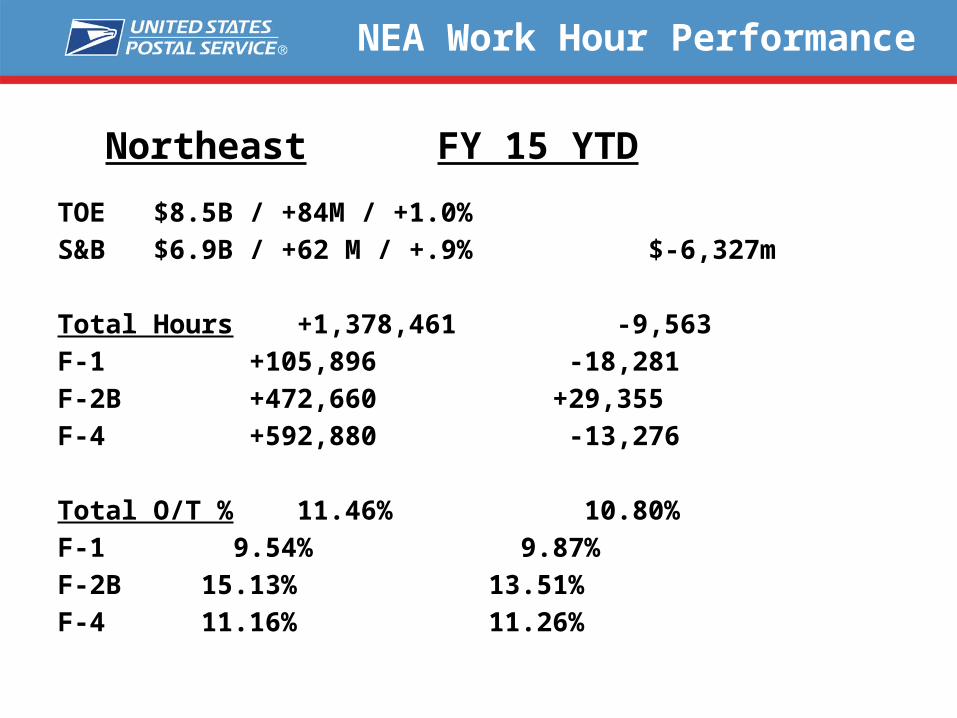
NEA Work Hour Performance
Northeast FY 15 YTD
TOE $8.5B / +84M / +1.0%
S&B $6.9B / +62 M / +.9% $-6,327m
Total Hours +1,378,461 -9,563
F-1 +105,896 -18,281
F-2B +472,660 +29,355
F-4 +592,880 -13,276
Total O/T % 11.46% 10.80%
F-1 9.54% 9.87%
F-2B 15.13% 13.51%
F-4 11.16% 11.26%
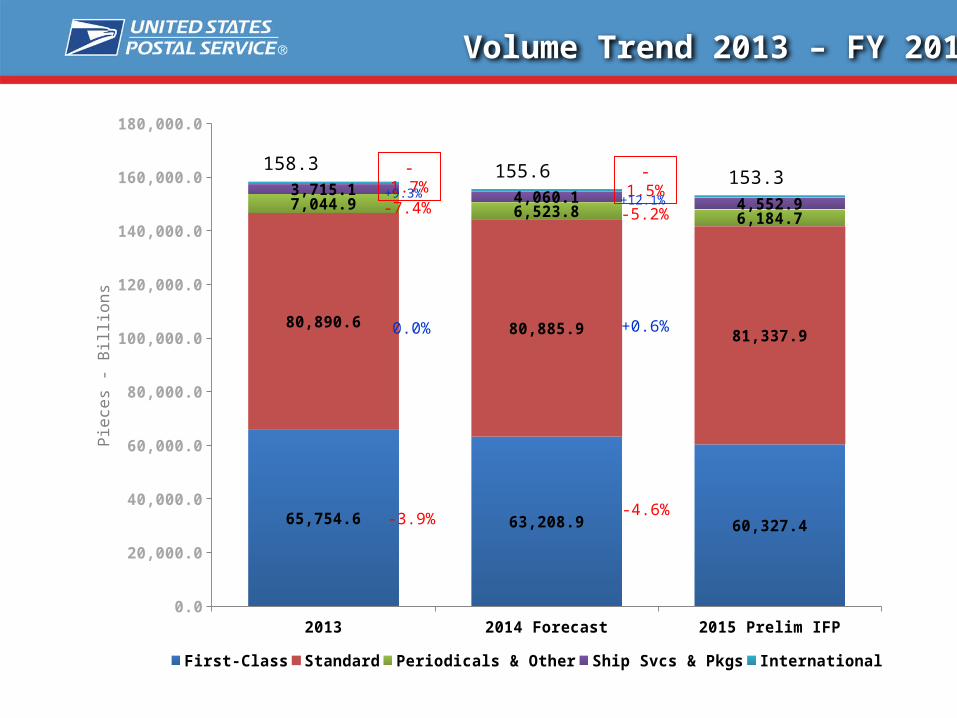
Volume Trend 2013 – FY 2015
2013 2014 Forecast 2015 Prelim IFP0.0
20,000.0
40,000.0
60,000.0
80,000.0
100,000.0
120,000.0
140,000.0
160,000.0
180,000.0
65,754.6 63,208.9 60,327.4
80,890.6 80,885.9 81,337.9
7,044.9 6,523.8 6,184.7
3,715.1 4,060.1 4,552.9
First-Class Standard Periodicals & Other Ship Svcs & Pkgs International
Pie
ces
- B
illio
ns
-1.7% -1.5%
0.0%
-3.9%
+0.6%
-4.6%
158.3 155.6 153.3 +12.1%+9.3%
-7.4% -5.2%

* FY13 total revenue excludes $1.3B reduction in Deferred Revenue – Prepaid Postage
2013 2014 Forecast 2015 Prelim IFP $-
$10,000.0
$20,000.0
$30,000.0
$40,000.0
$50,000.0
$60,000.0
$70,000.0
$28,110.7 $28,114.9 $27,320.1
$16,914.9 $17.6 $18,195.8
$5,388.1 $5.2 $5,184.1
$12,597.3 $14.0 $15,649.5
$3,015.1$2,977.9 $3,065.4
First-Class Standard Periodicals & Other Ship Svcs & Pkgs International
$ B
illio
ns
+2.9%$66.0 * $67.9 +2.1%
+4.1%
+10.8%
-1.2%
-2.9%
+3.3%
+12.1%
+2.9%
+0.0%
-2.3% -1.6%
$69.4
Revenue Trend 2013 – FY 2015

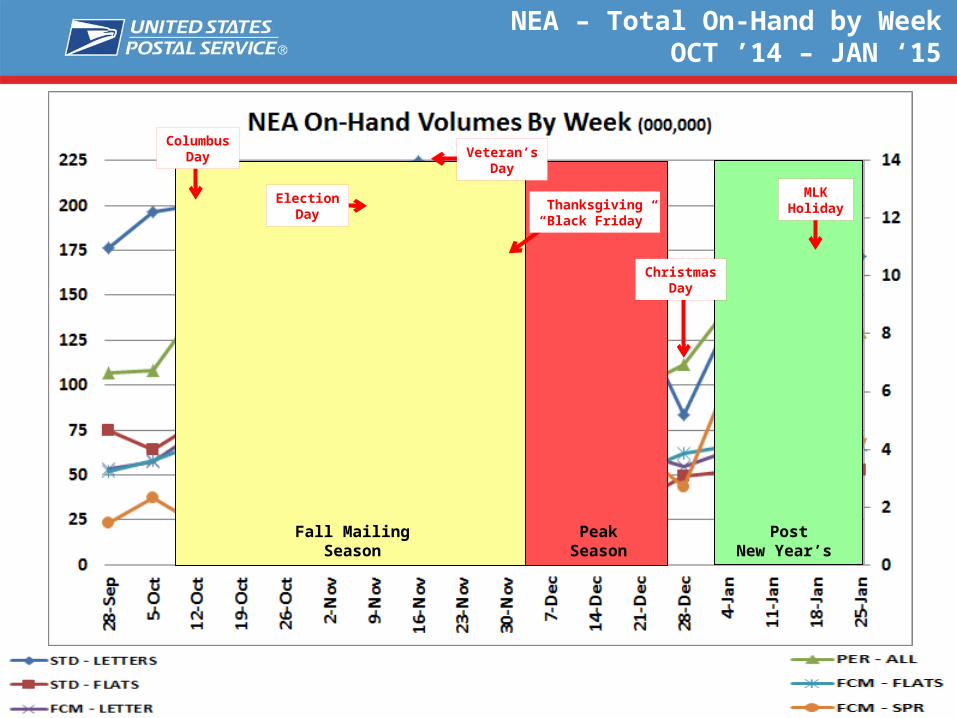
NEA – Total On-Hand by WeekOCT ’14 – JAN ‘15
PeakSeason
Fall MailingSeason
ColumbusDay Veteran’s
Day
Thanksgiving“Black Friday”
ChristmasDay
PostNew Year’s
ElectionDay
MLKHoliday
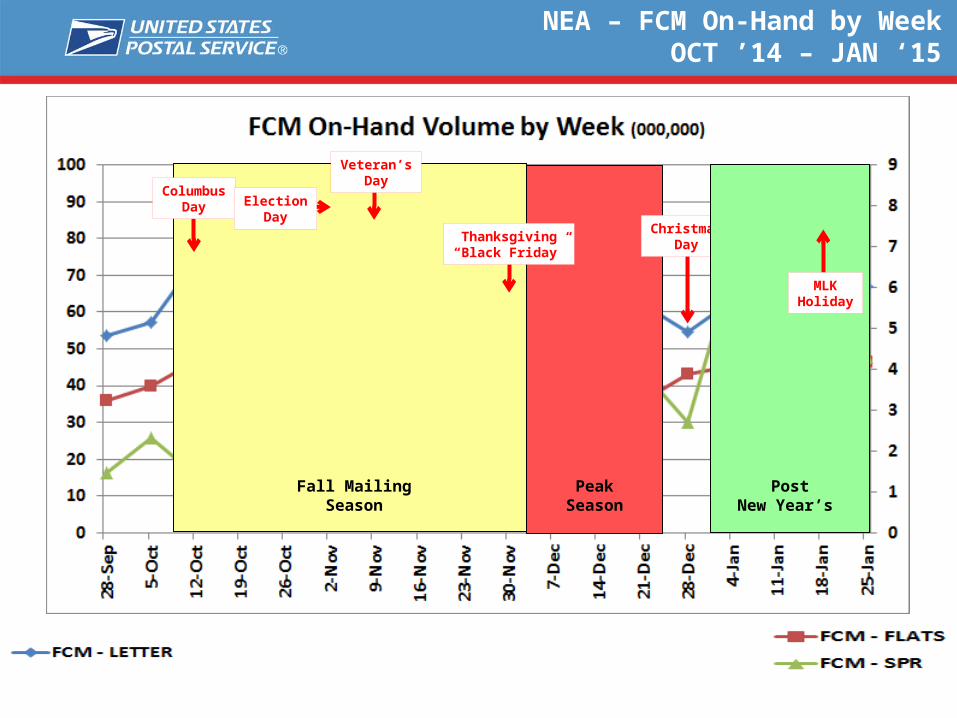
NEA – FCM On-Hand by WeekOCT ’14 – JAN ‘15
PeakSeason
Fall MailingSeason
ColumbusDay
Veteran’sDay
Thanksgiving“Black Friday”
ChristmasDay
PostNew Year’s
ElectionDay
MLKHoliday
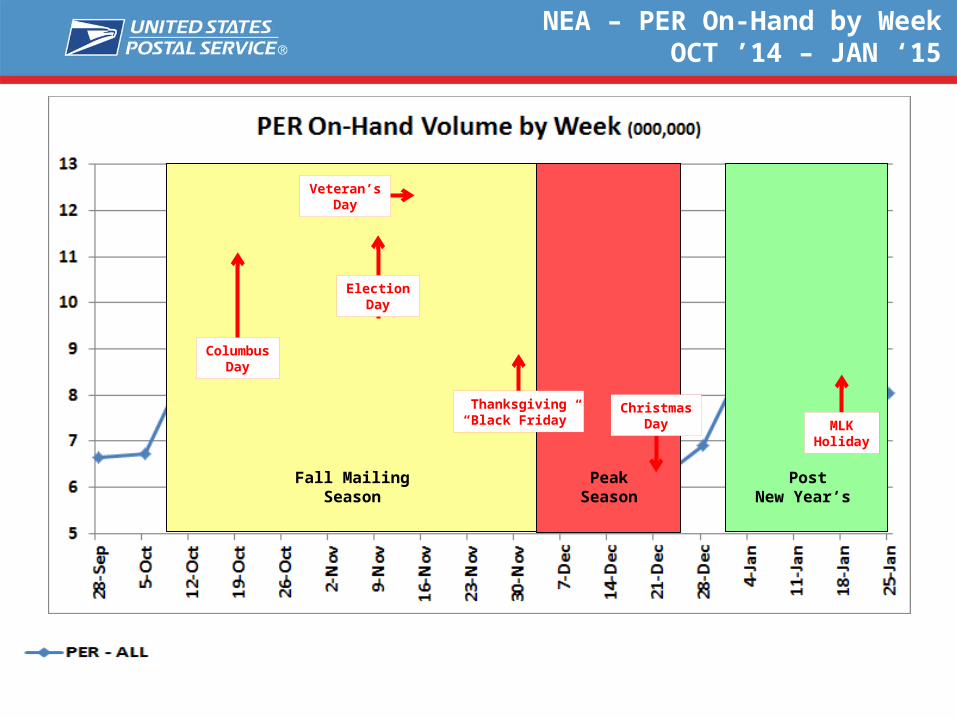
NEA – PER On-Hand by WeekOCT ’14 – JAN ‘15
PeakSeason
Fall MailingSeason
ColumbusDay
Veteran’sDay
Thanksgiving“Black Friday”
ChristmasDay
PostNew Year’s
ElectionDay
MLKHoliday
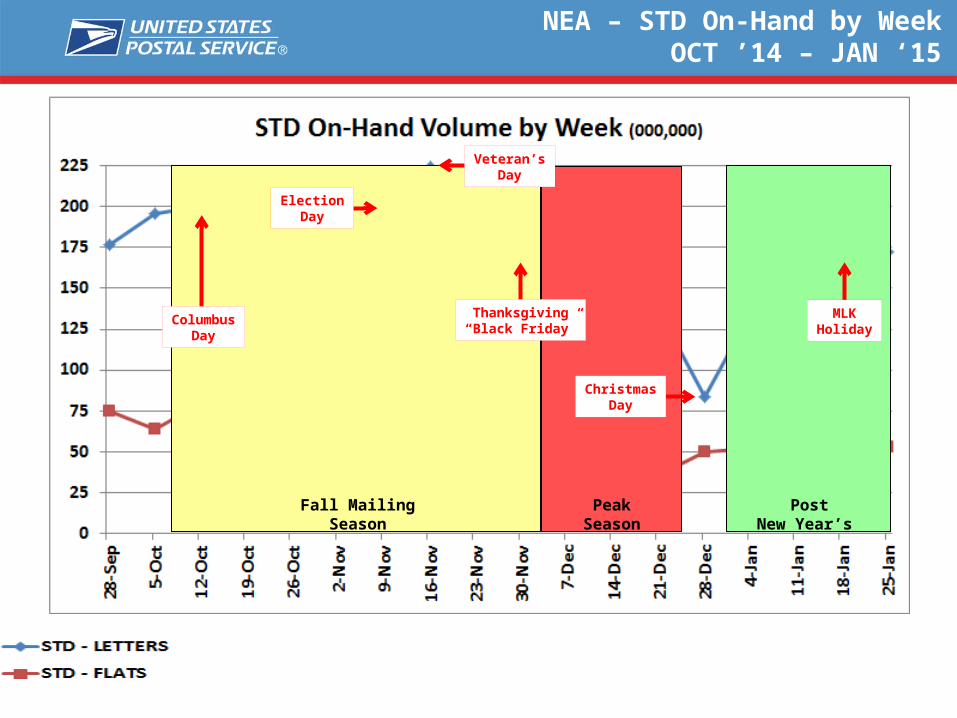
NEA – STD On-Hand by WeekOCT ’14 – JAN ‘15
PeakSeason
Fall MailingSeason
ColumbusDay
Thanksgiving“Black Friday”
ChristmasDay
PostNew Year’s
MLKHoliday
ElectionDay
Veteran’sDay
NEA – Total On-Hand by WeekOCT ’14 – JAN ‘15
PeakSeason
Fall MailingSeason
ColumbusDay Veteran’s
Day
Thanksgiving“Black Friday”
ChristmasDay
PostNew Year’s
ElectionDay
MLKHoliday
This is Our Time!
We must instill service confidence now in order to ensure future growth with our business partners
Excellence in Peak Performance will provide the impetus for growth in January around Dimensional Weight and Heavy Weight packages
Peak Season – Setting the Stage
22
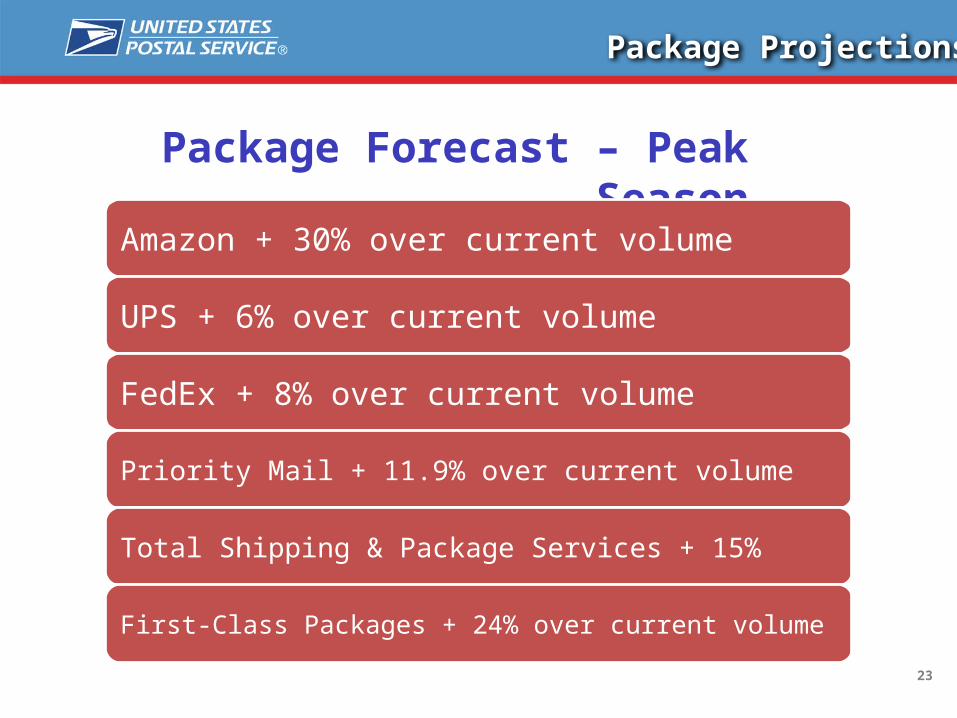
Package Forecast – Peak Season
Amazon + 30% over current volume
UPS + 6% over current volume
FedEx + 8% over current volume
Priority Mail + 11.9% over current volume
Total Shipping & Package Services + 15%
First-Class Packages + 24% over current volume
Package Projections
23
Key Customer Requirements
100% Visibility Scanning is vital to our customers Every missed scan leads to a potential call center
complaint
On-time delivery
Timely response and resolution to all customer inquiries
Consistent communication about potential national and local network issues
Peak Season
24
Summary
Peak season is the key to our future package growth success
Excellent Peak Performance = Growth
Average Peak Performance = Lost Opportunity
Peak Season
25

Northeast Area Effective Communications®
Communication