The Economic Benefits Of Offshore Drilling To South Carolina

North Carolina Should Discontinue the Economic Development Tiers System and Reexamine
Strategies to Assist Communities with Chronic Economic Distress
Final Report to the Joint Legislative Program Evaluation Oversight Committee
Report Number 2015-11
December 14, 2015

Program Evaluation Division
North Carolina General Assembly Legislative Office Building, Suite 100
300 North Salisbury Street Raleigh, NC 27603-5925
919-301-1404 www.ncleg.net/PED
75 copies of this public document were printed at a cost of $44.25 or $0.59 per copy.
A limited number of copies are available for distribution through the Legislative Library: Rooms 2126, 2226 Room 500
State Legislative Building Legislative Office Building Raleigh, NC 27601 Raleigh, NC 27603
919-733-7778 919-733-9390
The report is also available online at www.ncleg.net/PED.
Program Evaluation Division 300 N. Salisbury Street, Suite 100 Raleigh, NC 27603-5925 Tel. 919-301-1404 Fax 919-301-1406
John W. Turcotte Director
NORTH CAROLINA GENERAL ASSEMBLY Legislative Services Office
Paul Coble, Legislative Services Officer
December 14, 2015
Senator Fletcher L. Hartsell, Jr., Co-Chair, Joint Legislative Program Evaluation Oversight Committee Representative Craig Horn, Co-Chair, Joint Legislative Program Evaluation Oversight Committee North Carolina General Assembly Legislative Building 16 West Jones Street Raleigh, NC 27601 Honorable Co-Chairs: The 2015–17 Program Evaluation Division work plan directed the division to examine the effectiveness of the economic development tiers system for North Carolina counties as defined in N.C. Gen. Stat. §143B-437.08 (a)-(f). I am pleased to report that the Department of Commerce cooperated with us fully and was at all times courteous to our evaluators during the evaluation. Sincerely,
John W. Turcotte Director
AN EQUAL OPPORTUNITY/AFFIRMATIVE ACTION EMPLOYER
PROGRAM EVALUATION DIVISION
NORTH CAROLINA GENERAL ASSEMBLY
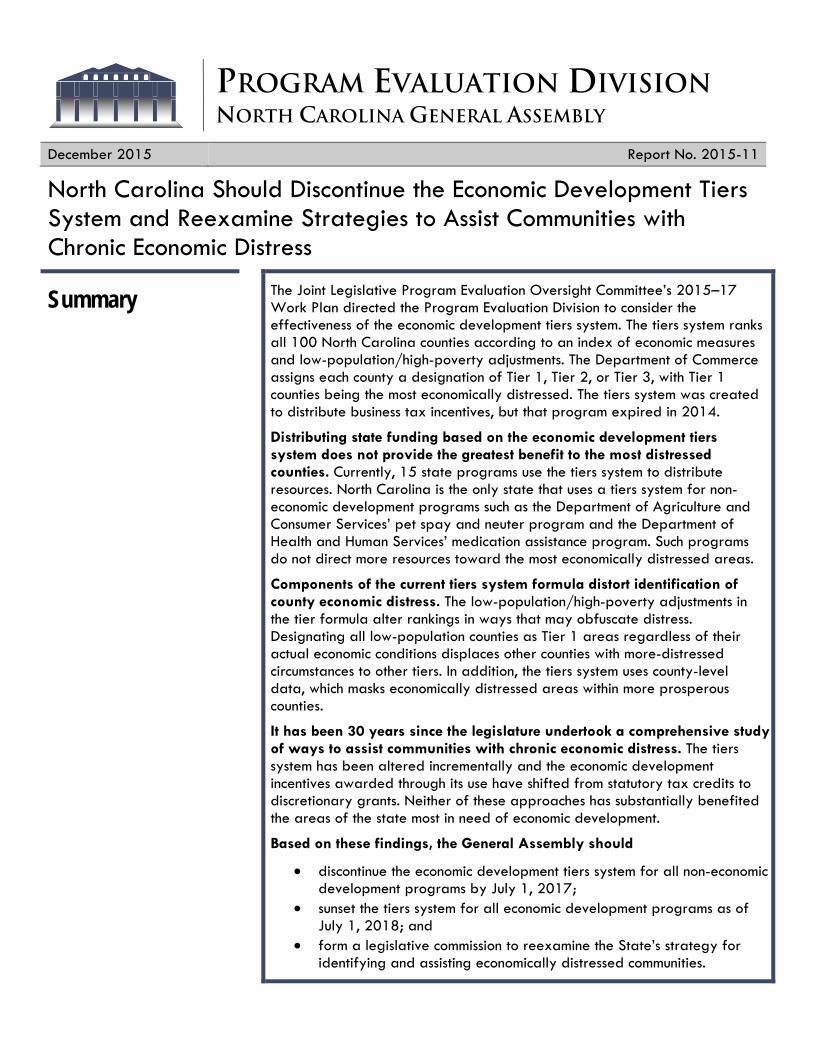
December 2015 Report No. 2015-11 North Carolina Should Discontinue the Economic Development Tiers System and Reexamine Strategies to Assist Communities with Chronic Economic Distress
Summary
The Joint Legislative Program Evaluation Oversight Committee’s 2015–17 Work Plan directed the Program Evaluation Division to consider the effectiveness of the economic development tiers system. The tiers system ranks all 100 North Carolina counties according to an index of economic measures and low-population/high-poverty adjustments. The Department of Commerce assigns each county a designation of Tier 1, Tier 2, or Tier 3, with Tier 1 counties being the most economically distressed. The tiers system was created to distribute business tax incentives, but that program expired in 2014.
Distributing state funding based on the economic development tiers system does not provide the greatest benefit to the most distressed counties. Currently, 15 state programs use the tiers system to distribute resources. North Carolina is the only state that uses a tiers system for non-economic development programs such as the Department of Agriculture and Consumer Services’ pet spay and neuter program and the Department of Health and Human Services’ medication assistance program. Such programs do not direct more resources toward the most economically distressed areas.
Components of the current tiers system formula distort identification of county economic distress. The low-population/high-poverty adjustments in the tier formula alter rankings in ways that may obfuscate distress. Designating all low-population counties as Tier 1 areas regardless of their actual economic conditions displaces other counties with more-distressed circumstances to other tiers. In addition, the tiers system uses county-level data, which masks economically distressed areas within more prosperous counties.
It has been 30 years since the legislature undertook a comprehensive study of ways to assist communities with chronic economic distress. The tiers system has been altered incrementally and the economic development incentives awarded through its use have shifted from statutory tax credits to discretionary grants. Neither of these approaches has substantially benefited the areas of the state most in need of economic development.
Based on these findings, the General Assembly should
discontinue the economic development tiers system for all non-economic development programs by July 1, 2017;
sunset the tiers system for all economic development programs as of July 1, 2018; and
form a legislative commission to reexamine the State’s strategy for identifying and assisting economically distressed communities.

Economic Development Tiers Report No. 2015-11
Page 2 of 33
Purpose and Scope
As directed by the Joint Legislative Program Evaluation Oversight Committee’s 2015-17 Work Plan, this report examines the effectiveness of the economic development tiers system for North Carolina counties as defined in N.C. Gen. Stat. §143B-437.08 (a)-(f). The scope of this report does not include the statutory exceptions for two-county industrial parks, multijurisdictional industrial parks, or eco-industrial parks.1
Specifically, this report addresses the following questions:
1. What are economic development tiers and why were they developed?
2. What are the benefits and drawbacks of the current tiers system?
3. What changes may be made to the current system to better target economic development efforts?
4. What are the ramifications of these changes to the current system?
During the course of this evaluation, stakeholders cited concerns with the current tiers system and proposed alternatives beyond modifications to the existing system. As a result of these concerns, PED also considered the State’s overall approach to assisting communities experiencing economic distress.
To conduct this review, the Program Evaluation Division collected and analyzed information from
a review of session laws and General Statutes; interviews with representatives from the Department of Commerce; a review of strategic planning documents, tier calculations, and
evaluation documents from the Department of Commerce; interviews with representatives from the North Carolina Association
of County Commissioners and the North Carolina League of Municipalities;
small group discussions held with regional and county economic development professionals from across the state;
a small group discussion held with academic and economic development professionals from local universities, rural development nonprofits, and state agencies;
a survey of all state agencies that use economic development tiers to guide programmatic decisions; and
interviews with representatives from the U.S. Department of Housing and Urban Development (HUD) and the Appalachian Regional Commission (ARC).
1 N.C. Gen. Stat. §143B-437.08(g)(h) and (j).

Economic Development Tiers Report No. 2015-11
Page 3 of 33
Background Publicly financed economic development consists of governmental intervention focused on fostering conditions for economic growth and improved quality of life. According to the U.S. Economic Development Administration, this process cultivates such conditions by expanding the capacity of individuals, firms, and communities to use their talents and skills to support innovation, lower transaction costs, and produce and trade goods and services.2 Many public policy efforts focus on economic growth, which is the creation of more goods and services through increases in employment or investment. Economic development, in contrast, constitutes a broader set of activities aimed at preparing individuals to fully participate in the economy and make better use of available resources to create competitive advantages. Specific economic development goals may include longer life expectancy, higher levels of educational attainment, better health, and higher incomes and purchasing power.
Traditional means of achieving economic development goals include activities such as
making investments in roads, telecommunications, and other infrastructure assets,
increasing skill levels of the working population, removing barriers to participation in the labor force, providing direct support for businesses and industries, and increasing community and institutional capacity to support
entrepreneurship and other development opportunities.
State law charges the Department of Commerce with the duty to promote and assist in the total economic development of North Carolina in accordance with state policy and laws.3 The declared policy of the State of North Carolina is to achieve the following:
actively encourage the expansion of existing environmentally sound North Carolina industry;
actively encourage the recruitment of environmentally sound national and international industry into North Carolina through industrial recruitment efforts and through effective advertising, with an emphasis on high-wage-paying industry;
promote the development of North Carolina's labor force to meet the State's growing industrial needs;
promote the growth and development of travel and tourism industries;
promote the development of state ports; and assure throughout state government the coordination of North
Carolina's economic development efforts.
The economic development tiers system evolved from an effort to create tax incentives for new and expanding businesses in North Carolina. For many years, tax incentives were the main instruments of state and local economic development policy. The State offered tax incentives to private
2 This definition of economic development is provided by the United States Economic Development Administration, which is a division of the United States Department of Commerce. 3 N.C. Gen. Stat. § 143B-429.

Economic Development Tiers Report No. 2015-11
Page 4 of 33
industry, often in the form of tax credits, to spur the growth of businesses and jobs.
In 1987, North Carolina created an income tax credit for employers who created jobs in the most severely distressed counties in the state. To qualify for the credit, corporations had to create at least nine new full-time jobs and be located in a severely distressed county during that year. The Department of Commerce designated the 20 most severely distressed counties based on a formula that was the sum of (1) the county’s relative rank among all state counties by rate of unemployment from lowest to highest and (2) the county’s rank in per capita income from highest to lowest for the most recent 36-month period available. Subsequently, North Carolina expanded the use of tax incentives to new and existing businesses regardless of where they choose to locate. To continue to encourage greater economic growth in distressed areas, the State based the amount of tax credits on the level of economic distress in the county. Businesses located in more distressed counties could claim a greater tax credit for meeting certain criteria for job creation and wage standards. In addition, the State set lower standards for investment in more distressed counties than in more prosperous counties.
The statewide tiers designation system began nearly 20 years ago. The Article 3A William S. Lee tax incentives established in 1996 marked the first time North Carolina grouped all 100 counties into tier designations based on each county’s level of economic distress. However, in 2006, the General Assembly replaced the William S. Lee credits with the Article 3J tax incentive program, which narrowed the focus of tax credits for job creation and business investment and made several changes to the tier designation system:
reduced the number of tier designations from five to three; changed the calculation of the development factor to determine the
county’s level of distress; and refined the adjustment factors for population and poverty.
Exhibit 1 presents a timeline of the use of and changes to the tiers system.

Economic Development Tiers Report No. 2015-11
Page 5 of 33
Exhibit 1: Timeline of Economic Development Tiers System in North Carolina
Source: Program Evaluation Division.
Economic Development Tiers Report No. 2015-11
Page 6 of 33
N.C. Gen. Stat. §143B-437.08 defines the current version of North Carolina’s economic development tier formula and includes four measures of distress:
1. Average unemployment rate for the most recent 12 months for which data are available.
2. Median household income for the most recent 12 months for which data are available.
3. Percentage growth in population for the most recent 36 months for which data are available.
4. Adjusted assessed property value per capita for the most recent taxable year.
As depicted in Exhibit 2, each county is ranked from 1 to 100 on each variable, making the highest possible score 400 and the lowest 4. After calculating scores, counties are then ranked by scores from most distressed (1) to least distressed (100).
A county automatically qualifies for Tier 1 status if it:
1. has a population of fewer than 12,000 people, or
2. has a population of fewer than 50,000 people and a poverty rate of 19 percent or greater.
A county with a population of fewer than 50,000 people automatically qualifies as a Tier 2 county. After taking these qualifiers into account, counties are assigned a designation of Tier 1 (most distressed), Tier 2, or Tier 3 (least distressed). Assuming no ties in rankings, the 40 most distressed counties are designated as Tier 1, the next 40 as Tier 2, and the 20 least distressed as Tier 3. In the event of a tie for the final position as a Tier 1 or Tier 2 county, both counties are to be placed in the most distressed tier. A Tier 1 county retains this designation for at least two years. Appendix A shows 2015 Economic Development Tier Designations by County.

Exhibit 2: Example of Economic Development Tier Formula (Alamance County)
Source: Program Evaluation Division based on 2015 tier ranking information provided by the Department of Commerce.

Economic Development Tiers Report No. 2015-11
Page 8 of 33
Exhibit 3 depicts the current economic development tier designations by county for 2015.
Exhibit 3: Economic Development Tiers by County
Source: Program Evaluation Division based on Department of Commerce 2015 County Tier Designations.
The 2014 expiration of the Article 3J tax incentive program has forced reexamination of how the State should use the tiers system in the future. The Article 3J tax incentives program contained an automatic repeal provision effective January 1, 2014. The total cost of the William S. Lee and Article 3J tax incentives cannot be calculated until all of the tax credits are claimed; however, North Carolina spent more than $1.2 billion on these programs between 1996 and 2014.
North Carolina has shifted its economic development policy to emphasize discretionary incentive programs such as the Job Development Investment Grant (JDIG) and the One North Carolina Fund. The statutory nature of the tax incentives under Article 3J lacked sufficient granularity for the State to use tax credits to selectively recruit companies compatible with North Carolina’s economic development goals. Although the discretionary grant programs JDIG and One North Carolina now constitute North Carolina’s primary strategy for business development, neither program is required to consider geographic differences or the relative economic distress in different parts of the state. As a consequence, the State has awarded most of these discretionary funds to firms expanding or locating in more prosperous areas that were already attractive to investors.
The economic development tiers system was originally tied to tax incentive programs. Now that its original purpose has been eliminated, North Carolina should examine whether the tiers system in its current form is the best way to foster economic growth for the most distressed areas of the state.

Economic Development Tiers Report No. 2015-11
Page 9 of 33
Findings Finding 1: Distributing state funding based on the economic development tiers system does not provide the greatest benefit to the most distressed counties.
North Carolina’s tax incentive programs have expired but the tiers system is still being used by law or practice to distribute state resources. In Fiscal Year 2014–5, 15 programs used the economic development tiers system as part of their criteria to award and distribute funding or other limited resources across the state.4 State law requires 10 of these programs to use the tiers system; the other 5 programs use the tiers system but are not required to do so. The state agencies operating these programs are:
Department of Commerce (5 statutory; 1 non-statutory), Department of Agriculture and Consumer Services (2 statutory), Department of Health and Human Services (2 non-statutory), Department of Environmental Quality (2 statutory), Department of Transportation (1 non-statutory), North Carolina Housing Finance Agency (1 non-statutory), and North Carolina 911 Board (1 statutory).
As shown in Exhibit 4, only six of these programs focus on economic development (ED) activities; the Department of Commerce operates all of these programs. The nine other programs provide funding for non-economic development (non-ED) activities such as spay and neuter, public safety assistance points, and medication assistance. In Fiscal Year 2014–15, ED programs distributed $50.1 million and non-ED programs distributed $21.3 million. Appendix B provides detailed information on these programs.
4 The North Carolina Arts Council does not use tier designation to make funding decisions, but the agency’s grant-making policies exempt applicants in or serving counties designated as Tier 1 by the N.C. Department of Commerce from providing a one-to-one match in certain grant categories and allows these applicants to request 75 percent to 100 percent funding of their project costs.
Economic Development Tiers Report No. 2015-11
Page 10 of 33
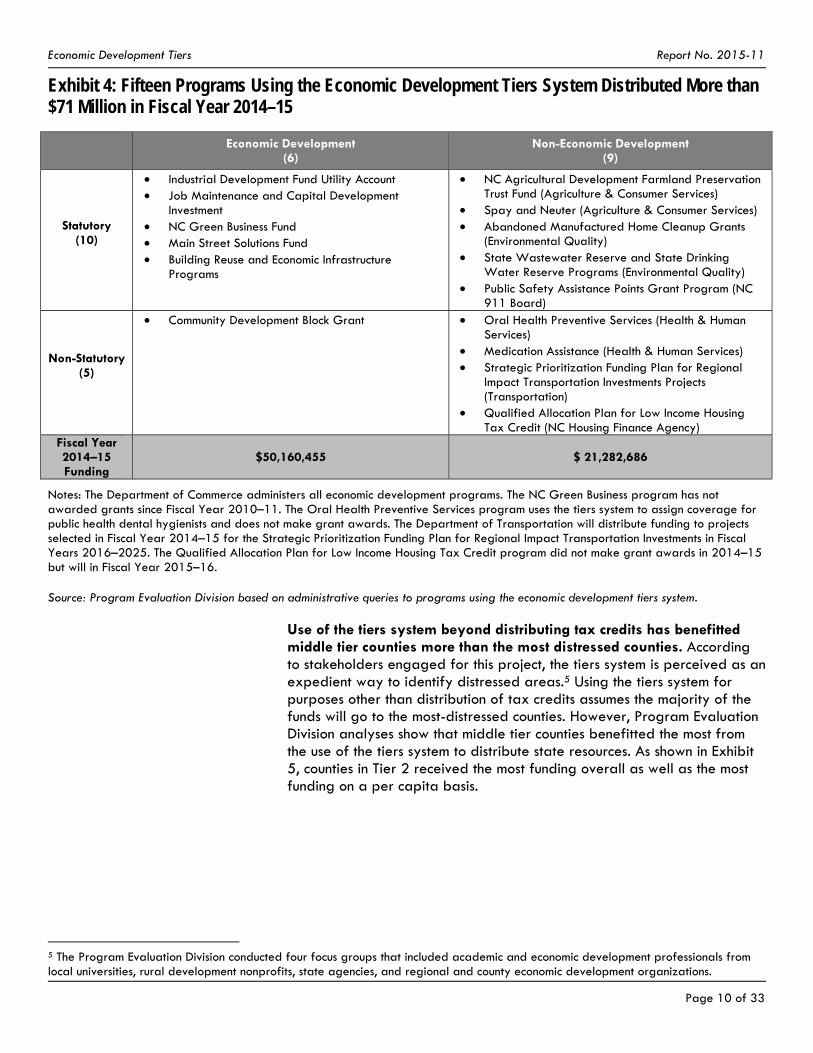
Exhibit 4: Fifteen Programs Using the Economic Development Tiers System Distributed More than $71 Million in Fiscal Year 2014–15
Economic Development (6)
Non-Economic Development (9)
Statutory (10)
Industrial Development Fund Utility Account Job Maintenance and Capital Development
Investment NC Green Business Fund Main Street Solutions Fund Building Reuse and Economic Infrastructure
Programs
NC Agricultural Development Farmland Preservation Trust Fund (Agriculture & Consumer Services)
Spay and Neuter (Agriculture & Consumer Services) Abandoned Manufactured Home Cleanup Grants
(Environmental Quality) State Wastewater Reserve and State Drinking
Water Reserve Programs (Environmental Quality) Public Safety Assistance Points Grant Program (NC
911 Board)
Non-Statutory (5)
Community Development Block Grant
Oral Health Preventive Services (Health & Human Services)
Medication Assistance (Health & Human Services) Strategic Prioritization Funding Plan for Regional
Impact Transportation Investments Projects (Transportation)
Qualified Allocation Plan for Low Income Housing Tax Credit (NC Housing Finance Agency)
Fiscal Year 2014–15 Funding
$50,160,455 $ 21,282,686
Notes: The Department of Commerce administers all economic development programs. The NC Green Business program has not awarded grants since Fiscal Year 2010–11. The Oral Health Preventive Services program uses the tiers system to assign coverage for public health dental hygienists and does not make grant awards. The Department of Transportation will distribute funding to projects selected in Fiscal Year 2014–15 for the Strategic Prioritization Funding Plan for Regional Impact Transportation Investments in Fiscal Years 2016–2025. The Qualified Allocation Plan for Low Income Housing Tax Credit program did not make grant awards in 2014–15 but will in Fiscal Year 2015–16.
Source: Program Evaluation Division based on administrative queries to programs using the economic development tiers system.
Use of the tiers system beyond distributing tax credits has benefitted middle tier counties more than the most distressed counties. According to stakeholders engaged for this project, the tiers system is perceived as an expedient way to identify distressed areas.5 Using the tiers system for purposes other than distribution of tax credits assumes the majority of the funds will go to the most-distressed counties. However, Program Evaluation Division analyses show that middle tier counties benefitted the most from the use of the tiers system to distribute state resources. As shown in Exhibit 5, counties in Tier 2 received the most funding overall as well as the most funding on a per capita basis.
5 The Program Evaluation Division conducted four focus groups that included academic and economic development professionals from local universities, rural development nonprofits, state agencies, and regional and county economic development organizations.

Economic Development Tiers Report No. 2015-11
Page 11 of 33
Exhibit 5: State Programs Using the Tiers System Distributed $71.4 million in Fiscal Year 2014-15; Middle Tier Counties Benefitted More than Other Counties
Note: The Program Evaluation Division calculated the total amount awarded per capita by dividing the total amount award received by counties in each tier by the combined population of counties in that tier receiving funding in 2014–15.
Source: Program Evaluation Division based on administrative queries to programs using the economic development tiers system.
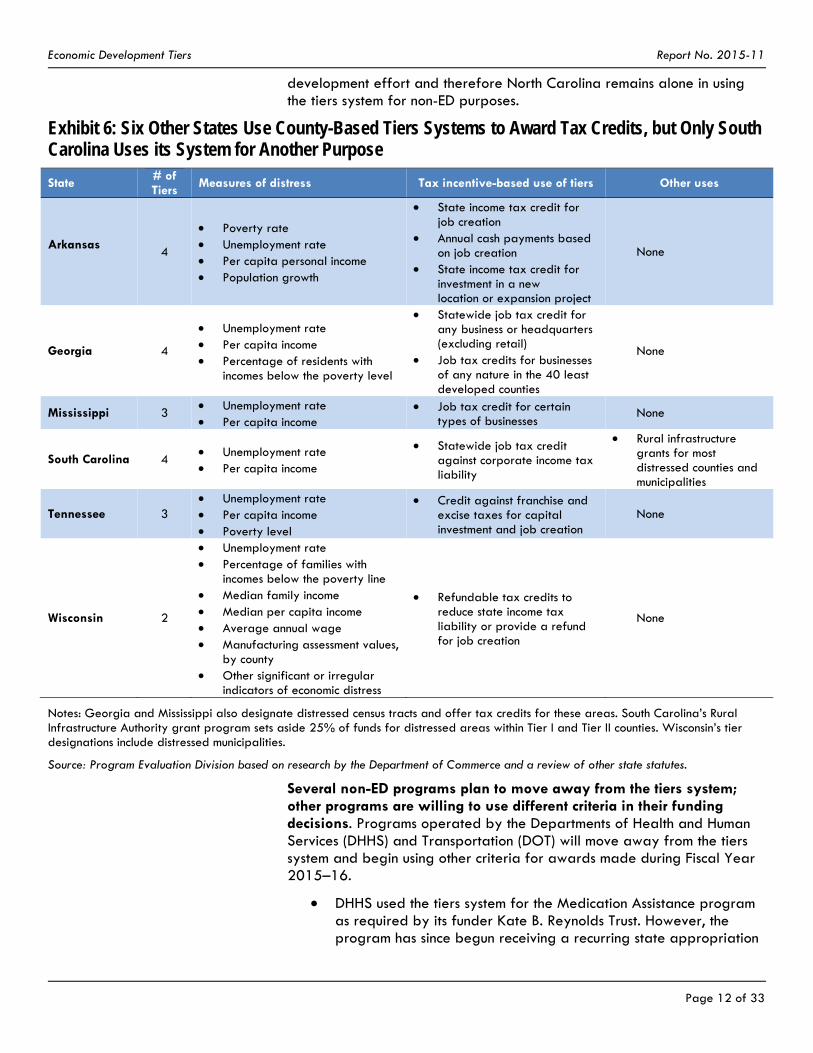
Unlike other states, North Carolina has applied its economic development tiers system beyond its original intent. At least six states have developed county-based tiers systems to award tax credits to businesses for job creation, capital investment, or expansion projects: Arkansas, Georgia, Mississippi, South Carolina, Tennessee, and Wisconsin (see Exhibit 6).6 In general, businesses in these states qualify for tax credits if they meet certain thresholds for the number of jobs created and/or the amount of annual wages offered. These states peg tax credits to the level of economic distress in each county; businesses can earn greater benefits or be required to meet lower thresholds for economic activity in more distressed counties. Of the six states identified, only South Carolina uses its tiers system for another purpose beyond distributing tax credits. South Carolina’s Rural Infrastructure Authority grant program provides financial assistance to local governments for infrastructure or other economic development activities such as utility improvements, site preparation, or relocation expenses.7 However, this program is still considered an economic
6 State laws in Georgia, Mississippi, and South Carolina have provisions affecting distressed areas within counties. 7 S.C. Code of Laws, Section 12-10-85.
$16,991,260(24%)
$51,669,269(72%)
$2,782,611(4%)
$12.72
$19.13
$0.92 $-
$5.00
$10.00
$15.00
$20.00
$25.00
$-
$10,000,000
$20,000,000
$30,000,000
$40,000,000
$50,000,000
$60,000,000
Tier 1 Tier 2 Tier 3
Total Amount Awarded Total Amount Awarded Per Capita
Aw
ard
Am
ount
Aw
ard
Per
Cap
ita
Most Distressed Least Distressed
Economic Development Tiers Report No. 2015-11
Page 12 of 33
development effort and therefore North Carolina remains alone in using the tiers system for non-ED purposes.
Exhibit 6: Six Other States Use County-Based Tiers Systems to Award Tax Credits, but Only South Carolina Uses its System for Another Purpose
State # of Tiers
Measures of distress Tax incentive-based use of tiers Other uses
Arkansas
4
Poverty rate Unemployment rate Per capita personal income Population growth
State income tax credit for job creation
Annual cash payments based on job creation
State income tax credit for investment in a new location or expansion project
None
Georgia 4
Unemployment rate Per capita income Percentage of residents with
incomes below the poverty level
Statewide job tax credit for any business or headquarters (excluding retail)
Job tax credits for businesses of any nature in the 40 least developed counties
None
Mississippi 3 Unemployment rate Per capita income
Job tax credit for certain types of businesses
None
South Carolina 4 Unemployment rate Per capita income
Statewide job tax credit against corporate income tax liability
Rural infrastructure grants for most distressed counties and municipalities
Tennessee 3 Unemployment rate Per capita income Poverty level
Credit against franchise and excise taxes for capital investment and job creation
None
Wisconsin 2
Unemployment rate Percentage of families with
incomes below the poverty line Median family income Median per capita income Average annual wage Manufacturing assessment values,
by county Other significant or irregular
indicators of economic distress
Refundable tax credits to reduce state income tax liability or provide a refund for job creation
None
Notes: Georgia and Mississippi also designate distressed census tracts and offer tax credits for these areas. South Carolina’s Rural Infrastructure Authority grant program sets aside 25% of funds for distressed areas within Tier I and Tier II counties. Wisconsin’s tier designations include distressed municipalities.
Source: Program Evaluation Division based on research by the Department of Commerce and a review of other state statutes.
Several non-ED programs plan to move away from the tiers system; other programs are willing to use different criteria in their funding decisions. Programs operated by the Departments of Health and Human Services (DHHS) and Transportation (DOT) will move away from the tiers system and begin using other criteria for awards made during Fiscal Year 2015–16.
DHHS used the tiers system for the Medication Assistance program as required by its funder Kate B. Reynolds Trust. However, the program has since begun receiving a recurring state appropriation
Economic Development Tiers Report No. 2015-11
Page 13 of 33
and plans to use a regional approach for distributing funding instead of relying on tier designation.
For the Oral Health Preventive Services program, DHHS plans to implement a regional approach that would rely less on the tiers system to allocate resources in the future.
The Department of Transportation has switched to using the actual county distress rankings rather than the three tier designations in an effort to achieve a more direct relationship in giving projects in more distressed counties more points.
The NC Housing Finance Agency started using the tiers system based on a recommendation of its stakeholders, who perceived the rankings as an established third-party source of information to identify areas of need. However, the agency stated it would go back to using its own measure of distress if the tiers system was eliminated.
Ten programs using the tiers system would require statutory changes to allow them to use different criteria to distribute funding. Repealing the statutory requirement to use the tiers system would mean these 10 programs would have to made administrative changes to their funding criteria or guidelines. For example, state law sets the amount of funding that the Industrial Development Fund Utility Account receives from Job Development Investment Grant awards.8 In moving away from using the tiers system, state law would have to be changed to allow the Department of Commerce and other agencies to modify criteria for these programs.
Commerce officials did not object to ceasing the statutory requirement to use the tiers system for economic development programs. However, the department recommended adopting a single statewide methodology for measuring distress. However, a few non-ED programs statutorily required to use the tiers system noted they would prefer to use program-specific criteria instead:
Department of Environmental Quality (DEQ) officials stated removing the statutory requirement to use the tiers system to allocate funding for the State Wastewater Reserve and State Drinking Water Reserve programs would allow the programs to reach more needy communities.9,10
The NC 911 board is required by law to consider the tiers in its funding formula. However, tier designation only represents a maximum of 10 points towards an applicant’s proposal. NC 911 officials stated the program would not be adversely affected if not required to use the tiers. Instead, the program would rely on accepted definitions of "rural" and "high cost" to identify areas of need.
In summary, North Carolina’s tax incentive programs have expired but the use of the tiers system to distribute state resources persists. Fifteen
8 G.S. § 143B-437.56(d) stipulates that 15% of Job Development Investment Grant awards in Tier 2 counties and 25% of awards in Tier 3 counties be transferred to the Industrial Development Fund Utility Account. 9 Session Law 2015-241 changed the name of the Department of Environment and Natural Resources to the Department of Environmental Quality. 10 This requirement expired June 30, 2015.
Economic Development Tiers Report No. 2015-11
Page 14 of 33
programs use the tiers systems in making their funding decisions; half of these programs do not focus on economic development. Use of the tiers system beyond awarding tax credits operates under the premise that the funds will go to the most distressed counties. However, the most distressed counties have not received the greatest benefit from these programs. Several non-economic development programs have indicated plans or interest in ceasing their use of the tiers system, but some programs require statutory changes in order to adopt different criteria.
Finding 2: Components of the current tiers system formula distort identification of county economic distress.
The Program Evaluation Division identified three major issues when examining the current formula used to calculate the tier designations:
adjustments for population and poverty may mask distress; the fixed number of counties in each tier places dissimilar counties in
the same tier; and county-level data masks areas of economic distress within
prosperous counties.
Population and poverty adjustments added to the tier formula alter the rankings in ways that may obfuscate distress. In the tier designation formula, a county automatically qualifies for Tier 1(most distressed) status if it has a population of fewer than 12,000 people, or has a population of fewer than 50,000 people and a poverty rate of 19 percent or greater. A county with a population of fewer than 50,000 people automatically qualifies as a Tier 2 county. These adjustments grant Tier 1 status to low-population counties instead of giving Tier 1 status to all of the most economically distressed counties.
Low county population is not necessarily synonymous with economic distress. Some of the state’s most prosperous counties have low populations. For instance, as Exhibit 7 illustrates, Camden County is the 81st most distressed county in the state based on 2015 data, but it is designated as a Tier 1 county because it has fewer than 12,000 residents. Stated differently, Camden County is in the top fifth of all North Carolina counties in prosperity. Designating all low-population counties as Tier 1 regardless of their actual economic conditions displaces counties with more-distressed circumstances into less-distressed tiers. The requirement that a Tier 1 county maintains that designation for at least two years also artificially affects the tier status of other counties.

Economic Development Tiers Report No. 2015-11
Page 15 of 33
Exhibit 7: Camden County Ranks Among the Least-Distressed Counties but is Placed into Tier 1 Due to Population Adjustments
279 80Haywood
Johnston 82295
290 81
County rank sum
County rank
Population < 12,000? Population < 50,000 and poverty rate ≥ 19%?
Adjustments
Population < 50,000 and poverty rate < 19%?
Automatically assigned to Tier 2
or
Automatically assigned to Tier 1
YES (10,174)
CamdenCamden
Source: Program Evaluation Division based on 2015 tier ranking information provided by the Department of Commerce.
The low-population/high-poverty adjustments affect a substantial number of counties. When the Department of Commerce calculated the 2015 tiers, eight counties fell below 12,000 in population and received automatic Tier 1 status and 21 counties had a population between 12,000 and 50,000 and a poverty rate at or above 19 percent. These counties also received automatic Tier 1 status. After these population and poverty adjustments were taken into consideration, 11 of the 40 Tier 1 positions remained for other counties. Fifteen additional counties with populations below 50,000 were granted Tier 2 status based solely on the population criterion. Exhibit 8 demonstrates how Burke County, the 27th most-distressed county in the state based on actual data, receives a Tier 2 designation after low-population/high-poverty adjustments are made.
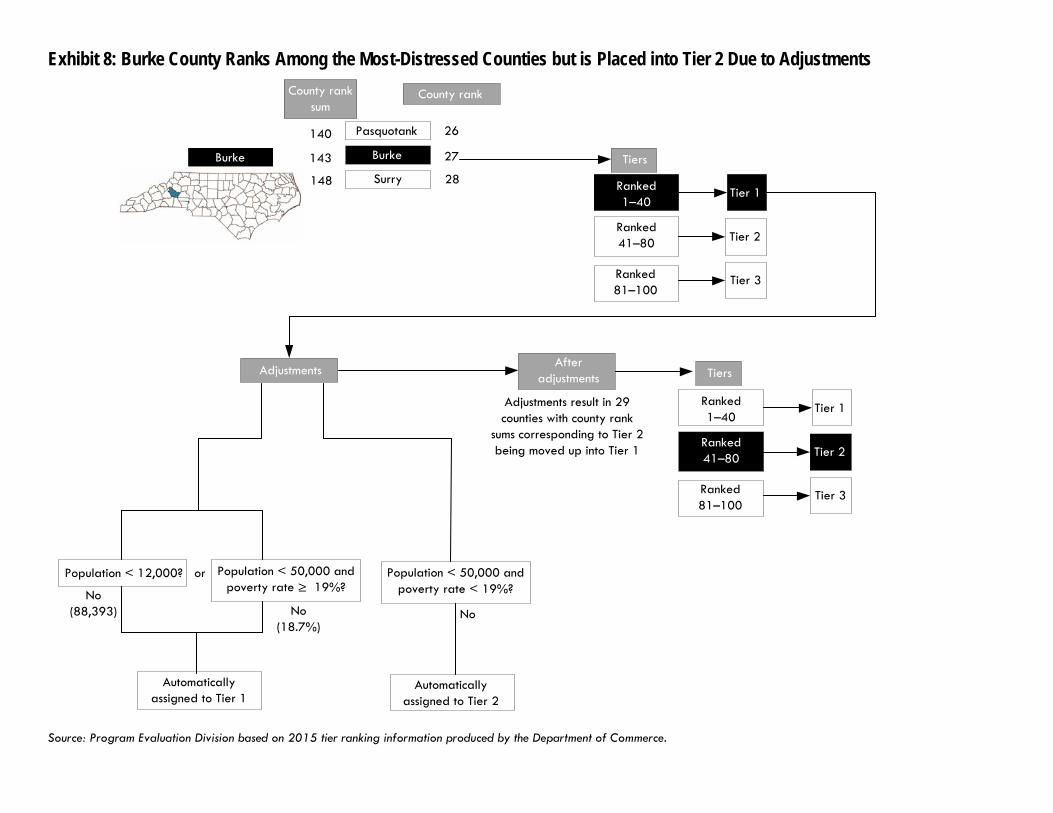
Exhibit 8: Burke County Ranks Among the Most-Distressed Counties but is Placed into Tier 2 Due to Adjustments
140 26Pasquotank
Surry 28148
143 27
County rank sum
County rank
Population < 12,000? Population < 50,000 and poverty rate ≥ 19%?
Adjustments
Population < 50,000 and poverty rate < 19%?
Automatically assigned to Tier 2
or
Automatically assigned to Tier 1
No (88,393) No
(18.7%)No
BurkeBurke
Ranked 1–40
Ranked 81–100
Tier 1
Tier 3
TiersAfter
adjustments
Ranked 41–80 Tier 2
Adjustments result in 29 counties with county rank
sums corresponding to Tier 2 being moved up into Tier 1
Ranked 81–100
Tier 3
Tiers
Ranked 41–80 Tier 2
Ranked 1–40
Tier 1
Source: Program Evaluation Division based on 2015 tier ranking information produced by the Department of Commerce.
Economic Development Tiers Report No. 2015-11
Page 17 of 33
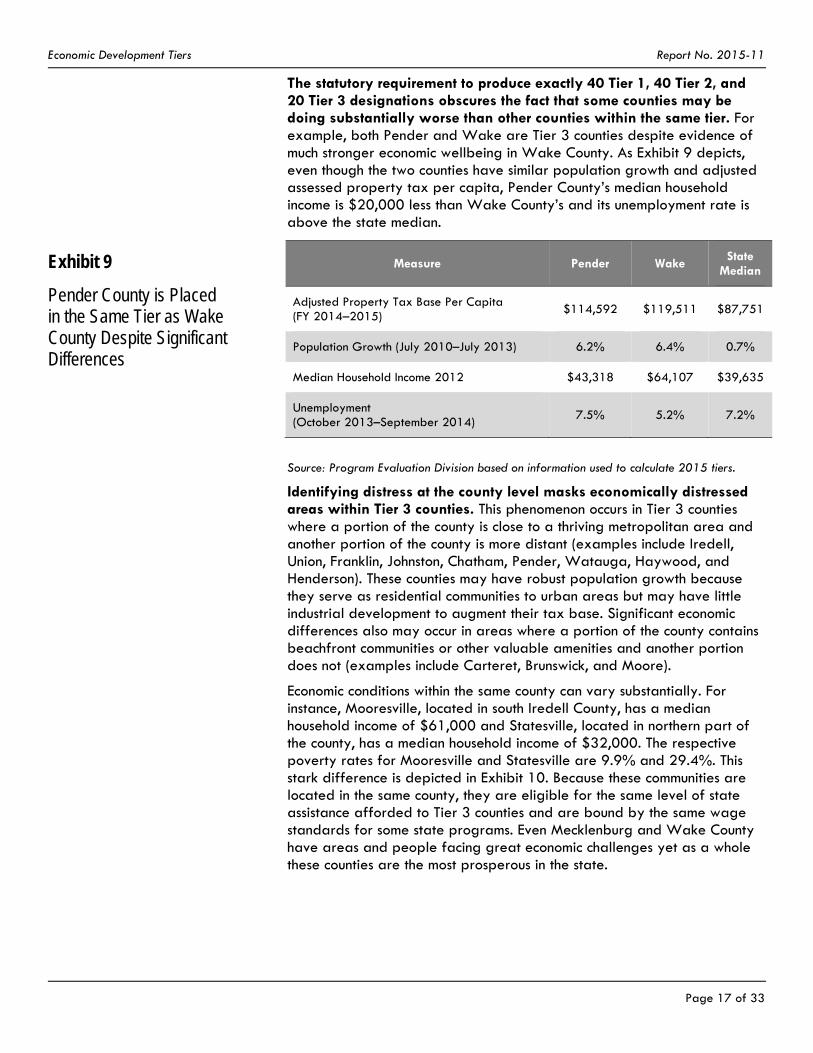
The statutory requirement to produce exactly 40 Tier 1, 40 Tier 2, and 20 Tier 3 designations obscures the fact that some counties may be doing substantially worse than other counties within the same tier. For example, both Pender and Wake are Tier 3 counties despite evidence of much stronger economic wellbeing in Wake County. As Exhibit 9 depicts, even though the two counties have similar population growth and adjusted assessed property tax per capita, Pender County’s median household income is $20,000 less than Wake County’s and its unemployment rate is above the state median.
Exhibit 9
Pender County is Placed in the Same Tier as Wake County Despite Significant Differences
Measure Pender Wake State
Median
Adjusted Property Tax Base Per Capita (FY 2014–2015)
$114,592 $119,511 $87,751
Population Growth (July 2010–July 2013) 6.2% 6.4% 0.7%
Median Household Income 2012 $43,318 $64,107 $39,635
Unemployment (October 2013–September 2014)
7.5% 5.2% 7.2%
Source: Program Evaluation Division based on information used to calculate 2015 tiers.
Identifying distress at the county level masks economically distressed areas within Tier 3 counties. This phenomenon occurs in Tier 3 counties where a portion of the county is close to a thriving metropolitan area and another portion of the county is more distant (examples include Iredell, Union, Franklin, Johnston, Chatham, Pender, Watauga, Haywood, and Henderson). These counties may have robust population growth because they serve as residential communities to urban areas but may have little industrial development to augment their tax base. Significant economic differences also may occur in areas where a portion of the county contains beachfront communities or other valuable amenities and another portion does not (examples include Carteret, Brunswick, and Moore).
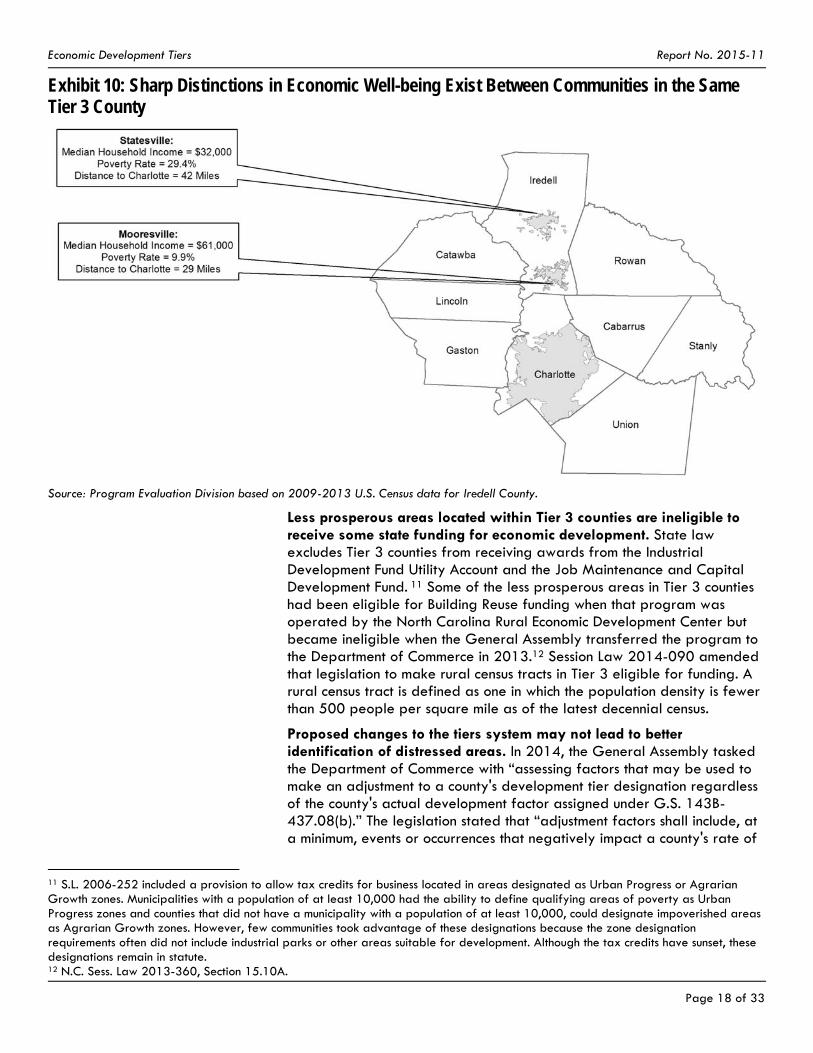
Economic conditions within the same county can vary substantially. For instance, Mooresville, located in south Iredell County, has a median household income of $61,000 and Statesville, located in northern part of the county, has a median household income of $32,000. The respective poverty rates for Mooresville and Statesville are 9.9% and 29.4%. This stark difference is depicted in Exhibit 10. Because these communities are located in the same county, they are eligible for the same level of state assistance afforded to Tier 3 counties and are bound by the same wage standards for some state programs. Even Mecklenburg and Wake County have areas and people facing great economic challenges yet as a whole these counties are the most prosperous in the state.
Economic Development Tiers Report No. 2015-11
Page 18 of 33
Exhibit 10: Sharp Distinctions in Economic Well-being Exist Between Communities in the Same Tier 3 County
Source: Program Evaluation Division based on 2009-2013 U.S. Census data for Iredell County.
Less prosperous areas located within Tier 3 counties are ineligible to receive some state funding for economic development. State law excludes Tier 3 counties from receiving awards from the Industrial Development Fund Utility Account and the Job Maintenance and Capital Development Fund. 11 Some of the less prosperous areas in Tier 3 counties had been eligible for Building Reuse funding when that program was operated by the North Carolina Rural Economic Development Center but became ineligible when the General Assembly transferred the program to the Department of Commerce in 2013.12 Session Law 2014-090 amended that legislation to make rural census tracts in Tier 3 eligible for funding. A rural census tract is defined as one in which the population density is fewer than 500 people per square mile as of the latest decennial census.
Proposed changes to the tiers system may not lead to better identification of distressed areas. In 2014, the General Assembly tasked the Department of Commerce with “assessing factors that may be used to make an adjustment to a county's development tier designation regardless of the county's actual development factor assigned under G.S. 143B-437.08(b).” The legislation stated that “adjustment factors shall include, at a minimum, events or occurrences that negatively impact a county's rate of
11 S.L. 2006-252 included a provision to allow tax credits for business located in areas designated as Urban Progress or Agrarian Growth zones. Municipalities with a population of at least 10,000 had the ability to define qualifying areas of poverty as Urban Progress zones and counties that did not have a municipality with a population of at least 10,000, could designate impoverished areas as Agrarian Growth zones. However, few communities took advantage of these designations because the zone designation requirements often did not include industrial parks or other areas suitable for development. Although the tax credits have sunset, these designations remain in statute. 12 N.C. Sess. Law 2013-360, Section 15.10A.

Economic Development Tiers Report No. 2015-11
Page 19 of 33
unemployment, median household income, percentage growth in population, and assessed value per capita. The Department shall also consider aligning the State's development tier designations with the U.S. Housing and Urban Development entitlement designations.” 13
In response to this mandate, Commerce proposed several changes to the tier formula itself, including:
removing adjusted assessed property value per capita and thepercentage growth in population factors and add average annual wages to the formula;
removing all existing small population and poverty adjustments; transitioning from a ranking system to an index in which there would
be no designated tier levels; and calculating the index every other year.
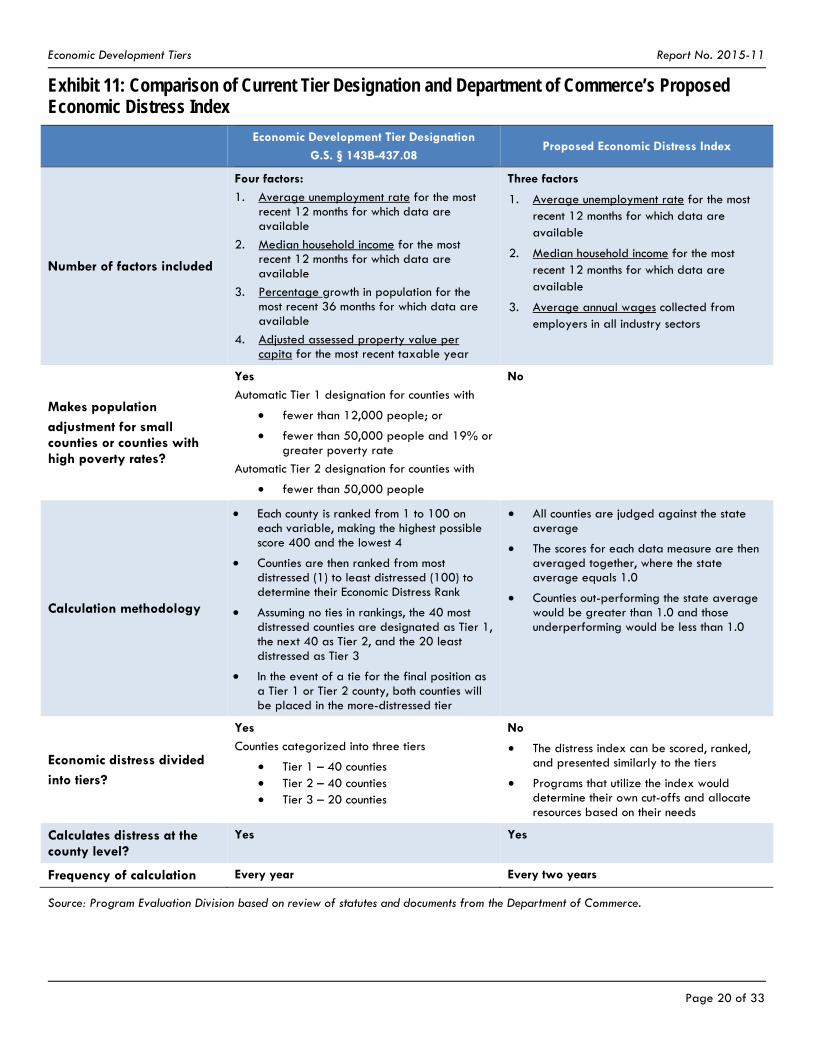
Exhibit 11 summarizes the existing tiers system and the changes proposed by the Department of Commerce in 2015.
13 N.C. Sess. Law 2014-100, Section 15.10B.
Economic Development Tiers Report No. 2015-11
Page 20 of 33
Exhibit 11: Comparison of Current Tier Designation and Department of Commerce’s Proposed Economic Distress Index
Economic Development Tier Designation
G.S. § 143B-437.08 Proposed Economic Distress Index
Number of factors included
Four factors:
1. Average unemployment rate for the most recent 12 months for which data are available
2. Median household income for the most recent 12 months for which data are available
3. Percentage growth in population for the most recent 36 months for which data are available
4. Adjusted assessed property value per capita for the most recent taxable year
Three factors
1. Average unemployment rate for the most recent 12 months for which data are available
2. Median household income for the most recent 12 months for which data are available
3. Average annual wages collected from employers in all industry sectors
Makes population
adjustment for small counties or counties with high poverty rates?
Yes
Automatic Tier 1 designation for counties with
fewer than 12,000 people; or
fewer than 50,000 people and 19% or greater poverty rate
Automatic Tier 2 designation for counties with
fewer than 50,000 people
No
Calculation methodology
Each county is ranked from 1 to 100 on each variable, making the highest possible score 400 and the lowest 4
Counties are then ranked from most distressed (1) to least distressed (100) to determine their Economic Distress Rank
Assuming no ties in rankings, the 40 most distressed counties are designated as Tier 1, the next 40 as Tier 2, and the 20 least distressed as Tier 3
In the event of a tie for the final position as a Tier 1 or Tier 2 county, both counties will be placed in the more-distressed tier
All counties are judged against the state average
The scores for each data measure are then averaged together, where the state average equals 1.0
Counties out-performing the state average would be greater than 1.0 and those underperforming would be less than 1.0
Economic distress divided
into tiers?
Yes
Counties categorized into three tiers
Tier 1 – 40 counties Tier 2 – 40 counties Tier 3 – 20 counties
No
The distress index can be scored, ranked, and presented similarly to the tiers
Programs that utilize the index would determine their own cut-offs and allocate resources based on their needs
Calculates distress at the county level?
Yes Yes
Frequency of calculation Every year Every two years
Source: Program Evaluation Division based on review of statutes and documents from the Department of Commerce.
Economic Development Tiers Report No. 2015-11
Page 21 of 33
A review by stakeholders of Commerce’s proposed changes revealed one benefit and several challenges. Overall, academic stakeholders were not convinced Commerce’s proposal would be an improvement on the existing system. Benefit
Removing the low population adjustments would create an improved ranking of distressed counties. When stakeholders reviewed the proposed changes to the tier designation system, they acknowledged this change would eliminate the potential for prosperous but low-population counties to receive Tier 1 status while pushing more-populous distressed counties into less-distressed tiers.
Challenges
Commerce’s proposed measures may not capture the complexity of economic distress. Unlike economic growth, which is fairly easy to measure through changes in output and employment, economic distress is harder to measure because it is a much more complex concept intertwined with social science variables such as well-being, quality of life, and economic status. Ideally, the measures used in an index will capture different pieces of information about economic conditions.
The proposed changes to the tiers system emphasize job creation, not economic distress. Academic stakeholders expressed concern that the proposed system was a step backward because it placed an even greater emphasis on employment and wage variables and removed the only variables—adjusted assessed property tax per capita and percentage growth in population—that quantified other aspects of economic distress.
Commerce’s proposal did not include indicators of chronic economic distress. Academic stakeholders expressed concern that the index did not include measures that could identify long-term problems such as poverty rate and educational attainment.14
Furthermore, economic developers expressed concern that the Commerce proposal would not identify economically challenged areas within prosperous counties. The department recommended measuring distress at the county level and noted concerns about data quality and timeliness for data produced at the census tract level. However, many federal organizations, including the Appalachian Regional Commission (ARC) and the U.S. Department of Housing and Urban Development (HUD), the Small Business Administration, and other states such as Georgia, use the American Community Survey’s five-year data for census tracts and have developed protocols for small area data integrity.
In summary, the Program Evaluation Division identified three major issues with the current tier ranking system that distort the level of economic distress experienced in North Carolina—population adjustments, the fixed
14 The Department of Commerce initially considered including the percentage of individuals 25 and older without a high school diploma as a possible metric for the proposed economic distress index, but excluded this measure in favor of a more simplified formula.

Economic Development Tiers Report No. 2015-11
Page 22 of 33
number of counties in each tier, and use of county-level data. The Department of Commerce’s proposed changes to the tiers system will eliminate the problems caused by population adjustments, but may not capture the full scope of economic distress and will not improve identification of distressed areas at the sub-county level.
Finding 3: It has been 30 years since the legislature undertook a comprehensive study of ways to assist communities with chronic economic distress.
In 1985, the General Assembly created the North Carolina Commission on Jobs and Economic Growth. At that time, the overall economy was fairly healthy, but a number of important economic sectors and geographic areas were experiencing serious and worsening difficulties. The Commission’s purpose was to identify the major economic challenges facing the State and to develop practical proposals for consideration by the General Assembly and the executive branch.
The Commission attempted to address the concern about North Carolina’s increasingly two-tiered economy by developing the economic development tiers system linked to tax credits for job creation. In 1987, North Carolina used the tiers system for the first time to identify the 20 counties with the highest levels of economic distress, as defined by per capita income and unemployment rates, and to award incentives to companies that made investments in job creation in these areas. The three-year measurement period for calculating the formula for the original tiers system indicates it was seen as an attempt to identify counties experiencing chronic economic distress.
For the purposes of this report, chronic economic distress is defined as the long-term persistence of factors associated with economic challenges in a community including:
high unemployment; low per capita incomes; high poverty levels; and low levels of physical, social, and human capital (educational
attainment, business investment, quality schools, housing stock and roads).
Time is an important component of economic distress. A community that experiences an acute economic shock such as the closing of a large business may experience economic distress for only a short period and then rebound. Other communities experience conditions of economic distress for years and even decades.15 Analysis of the economic development tier rankings for each county from 2007 to 2013 indicates that counties consistently at or near the bottom in rank have experienced chronic economic distress as opposed to short-term difficulties.
As time passed, the General Assembly altered the tier formula to place more emphasis on current economic conditions. These alterations have
15 Ten counties in North Carolina are classified by the Economic Research Service, a branch of the United State Department of Agriculture, as “persistent poverty” counties meaning they have had poverty rates that exceeded 20 percent in each of the last three decennial censuses. These counties are: Bertie, Bladen, Columbus, Halifax, Martin, Northampton, Pitt, Robeson, Tyrrell, and Washington.
Economic Development Tiers Report No. 2015-11
Page 23 of 33
created confusion about the purpose of the tiers system. For example, Commerce states its proposed index may be calculated every two years because it measures chronic economic distress, yet each of the index’s three factors is measured for a 12-month period of time. These short measurement periods ensure data will be highly influenced by transitory or one-time events such as a plant closing and may not reflect conditions of chronic economic distress. Furthermore, as legislative changes directed the designation of more and more counties as distressed and expanded the types of industries eligible for credits, the State’s ability to target efforts to the most distressed areas has been diluted.
Despite 30 years of policies and programs to improve economic well-being, many North Carolina communities still face substantial economic development challenges, yet there is no clear state strategy to assist these areas. A review of current North Carolina statutes reveals no overarching goals to improve economic conditions in distressed areas or a coordinated strategy to bring economic conditions in these areas up to par with state averages. As discussed earlier, the current discretionary incentives programs used for business recruitment are not required by law to consider a county’s level of economic distress when making awards and cannot, in and of themselves, control market forces that make more prosperous counties attractive to corporate locations or expansion. Currently, neither the General Assembly nor the executive branch has a commission or a committee focused specifically on the needs of the State’s most economically distressed communities.
The Program Evaluation Division has identified capacity building as a promising strategy to assist economically distressed communities. Communities experiencing economic distress generally possess a number of drawbacks negatively affecting their ability to attract industry such as low levels of physical infrastructure, educational attainment, and entrepreneurial capacity. These areas may require sustained state investments in the prerequisites for economic development including education, worker training, community development and other types of infrastructure to make them more livable and competitive. Researchers noted in 2008 that not all North Carolina counties will be big winners in attracting industry but all could improve their economic performance. Instead of focusing efforts on encouraging business relocations, the economic development strategy for economically distressed counties could focus on capacity-building programs that foster a strong business climate and build human and social capital in these areas.16
One organization that has used capacity-building programs to advance its goals is the Appalachian Regional Commission. The Appalachian Regional Commission (ARC) is a federal-state-local government partnership established by Congress in 1965 to raise Appalachia’s socioeconomic status to be on par with the rest of the nation. In addition to transportation and community development initiatives, the commission has used capacity-building programs to foster a strong business climate and build human and social capital in these areas. One such ARC program is a
16 Schweke, W. and DiSilvestro, F. (December 2008). Business Incentives and North Carolina’s Tier 1 Counties: Have They Worked? Washington, DC: Corporation for Enterprise Development.
Economic Development Tiers Report No. 2015-11
Page 24 of 33
telecommunications and information technology initiative created to stimulate economic growth in the Region through technology-related avenues. ARC has designed the capacity-building components of its program to strengthen communities and help organizations fulfill their missions in an effective manner. This program includes the following elements:
a mini-grant program to provide strategic planning and technical assistance so local communities can jump-start the process of economic development;
workshops, knowledge sharing, and other activities to encourage community learning and leadership development;
ARC outreach efforts that give local communities access to other resources, including nonprofits, foundations, and government agencies; and
an online resource center for accessing information on funding, grant writing, and best practices.
In its 2011–2016 strategic plan, the Commission cites several accomplishments resulting from efforts to eliminate disparity in Appalachia during the past 50 years, including
reducing the number of high-poverty counties in Appalachia from 295 to 116;
creating or retaining more than 7 million jobs; constructing more than 2,500 miles of new highways; providing water and sewer services to 900,000 households; and doubling the percentage of adults with a high school education.17
An evaluation of 70 ARC telecommunications projects initiated from 1994–2000 found the Commission made significant progress toward fulfilling its goals of building access to infrastructure, infusing telecommunications technology into the business sector, and cultivating the skills and knowledge of the region’s citizens to use technology effectively. ARC-supported infrastructure contributed to an increased awareness of the potential of telecommunications technologies for improving economies and individual lives, especially in areas with little or no past exposure to these technologies.18 One well-known capacity-building project in North Carolina was the ARC-funded website of North Carolina's Handmade in America, which remained an important site for the arts and crafts industry in western North Carolina for more than 22 years.19
At one time, the Department of Commerce operated a capacity-building program for North Carolina communities called 21st Century Communities. Through this program, the department, along with community leaders, would undertake a comprehensive assessment of a community's strengths and challenges, help it develop a strategic economic growth plan, and work with the community to implement the plan. Although the 21st Century Communities designation did not provide direct financial
17 Moving Appalachia Forward: Appalachian Regional Commission Strategic Plan 2011–2016 (November 2010). Washington, DC: Appalachian Regional Commission. 18 Appalachian Regional Commission (June 2003). Evaluation of the Appalachian Regional Commission’s Telecommunications Projects: 1994–2000. Rockville, MD: Westat. 19 Handmade in America closed in July 2015 due to lack of funding.

Economic Development Tiers Report No. 2015-11
Page 25 of 33
assistance, participation provided the county with priority for Commerce grants and the program assisted communities with gaining access to resources through partner organizations, such as the Golden LEAF Foundation, the U.S. Department of Agriculture, the N.C. Partnership for Children, UNC’s School of Government, and other state government agencies. In the nine years of its existence, 35 counties participated in the program. However, the 21st Century Communities program was eliminated in the 2011 budget bill.20
In summary, the General Assembly created the Commission on Jobs and Economic Growth in 1985 with the purpose of improving the economic well-being of North Carolina’s residents. Many of the programs and approaches to economic development it generated remain in existence. Although the State has experienced rapid economic advancement in the last thirty years, North Carolina still has counties and individual communities that are experiencing chronic economic distress. Existing business recruitment programs are unable to address the complex challenges faced by communities experiencing economic distress, and there is no overarching legislative goal or strategy in place to improve conditions in distressed communities. Creation of capacity-building programs specifically targeted at chronically distressed communities may help to make them more livable and economically competitive.
Recommendations Recommendation 1. The General Assembly should eliminate the use of the economic development tiers system for all non-economic development programs by July 1, 2017 and direct state agencies to develop other criteria.
In Fiscal Year 2014–15, 15 programs used the economic development tiers system as part of their criteria to award or distribute funding; nine of these programs focused on non-economic development issues. Although the tiers system is perceived as a convenient way to identify distressed areas, Program Evaluation Division analysis demonstrated that the most-distressed counties did not receive the greatest benefit from these programs. As discussed in Finding 1, the Department of Transportation no longer uses the tiers system for its program because of the perceived subjectivity of the system. Other non-economic development programs should use different criteria to make funding decisions that would be more relevant to the purposes of their programs.
Because the most distressed counties have not received the greatest benefit from programs using the tiers system, the General Assembly should repeal all state laws requiring the following five non-economic development programs to incorporate the economic development tiers system in their funding decisions:
NC Agricultural Development Farmland Preservation Trust Fund, Agriculture & Consumer Services;
Spay and Neuter, Agriculture & Consumer Services;
20 S.L. 2011-145, Sec. 14.3C.

Economic Development Tiers Report No. 2015-11
Page 26 of 33
Abandoned Manufactured Home Cleanup Grants, Environmental Quality;
State Wastewater Reserve and State Drinking Water Reserve Programs, Environmental Quality; and
Public Safety Assistance Points Grant Program, NC 911 Board.
In addition, the General Assembly should require the following four programs that voluntarily use the tiers system to cease its use by July 1, 2017:
Oral Health Preventive Services, Health & Human Services; Medication Assistance, Health & Human Services; Qualified Allocation Plan for Low Income Housing Tax Credit, NC
Housing Finance Agency; and Strategic Prioritization Funding Plan for Regional Impact
Transportation Investment Projects, Transportation.21
Lastly, the General Assembly should require these programs to develop criteria that are consistent with program objectives and report the new criteria to the Fiscal Research Division and their respective legislative oversight committees by October 1, 2016.22
Recommendation 2: The General Assembly should end the use of the tiers system for all economic development programs by July 1, 2018 and direct the Department of Commerce to develop alternate funding criteria.
From its origin, the economic development tiers system was tied to North Carolina’s strategy of awarding tax credits to companies for job creation and investment. State law ended the incentive programs associated with the tiers system on January 1, 2014, and thus the tiers system has outlived its original purpose. As discussed in Finding 2, the adjustments for population and poverty may obscure economic distress experienced by counties. In addition, the current tiers system formula does not consider economic distress at the sub-county level. As a result, the General Assembly should amend state law to phase out the use of the tiers system by economic development programs to make grant determinations, calculate award amounts, or require grant matching, effective July 1, 2018. This directive should allow sufficient time for the Department of Commerce to consider alternative ways to award these funds and determine matching fund levels and other administrative issues.
The General Assembly should direct the Department of Commerce to develop a plan to transition the following economic development programs currently relying on the tiers system to alternate funding criteria for awards and matching requirements:
21 The Department of Transportation has switched to using the actual county distress rankings in an effort to provide a more direct relationship of giving projects in more distressed counties greater points. 22 The Departments of Agriculture & Consumer Services and Environmental Quality report to the Joint Legislative Oversight Committee on Agriculture and Natural and Economic Resources. The Department of Health and Human Services reports to the Joint Legislative Oversight Committee on Health and Human Resources. The Department of Transportation reports to the Joint Legislative Transportation Oversight Committee. The NC 911 Board is administratively housed in the Department of Information Technology, which reports to the Joint Legislative Oversight Committee on Information Technology. The NC Housing Finance Agency reports to the Joint Legislative Oversight Committee on General Government.

Economic Development Tiers Report No. 2015-11
Page 27 of 33
Industrial Development Fund Utility Account, Job Maintenance and Capital Development Investment Fund, NC Green Business Fund, Main Street Solutions Fund, Building Reuse and Economic Infrastructure Programs, and Community Development Block Grant.
In addition, the General Assembly should require the department to engage stakeholders in the process by allowing local and regional economic development professionals to review and submit comments on the plan and by seeking formal approval of the plan from the Rural Infrastructure Authority.
Lastly, the General Assembly should require the Department of Commerce to present its plan detailing how these programs will replace the tiers system with alternate funding criteria to the Joint Legislative Economic Development and Global Engagement Oversight Committee and the Fiscal Research Division by July 1, 2018.
Recommendation 3: The General Assembly should establish a commission to reexamine the State’s strategy for identifying and assisting chronically distressed communities in the state.
Thirty years ago the North Carolina Commission on Jobs and Economic Growth was created by the General Assembly amid growing recognition that the state economy had come to a critical crossroads. The Commission’s purpose was to identify the major economic challenges facing the State and to develop practical proposals for meeting these challenges to be submitted to the executive and legislative branches of state government.
One portion of the commission’s recommendations focused on identifying areas of the state experiencing chronic economic distress and providing tax incentives for companies creating jobs in these areas. Although the State has experienced rapid economic advancement in the last 30 years, North Carolina still has counties and individual communities experiencing chronic economic distress. Existing business recruitment programs cannot address the complex challenges faced by communities experiencing chronic economic distress.
Reexamination of North Carolina’s strategy for identifying and assisting economically distressed communities is an opportunity to develop a comprehensive state strategy to address chronic distress and target state aid to these communities. There is strategic value in knowing which parts of the state are experiencing the most difficult economic conditions. Economic development stakeholders agreed that the State should continue identifying distressed areas and suggested limiting efforts to areas with extreme distress and assisting these counties in becoming more attractive to business. However, any efforts to address chronic economic distress in North Carolina communities should be done in context and in coordination with the overarching state plan for economic development.

Economic Development Tiers Report No. 2015-11
Page 28 of 33
To assist these communities, the General Assembly should establish a commission, the North Carolina Commission on Economic Development for Distressed Communities, focused on the development of a comprehensive strategy for meeting the needs of North Carolina communities with the greatest levels of economic distress. The North Carolina Commission on Economic Development for Distressed Communities should be directed to
determine how and at what geographic levels economic distress should be measured;
decide which measurements, data sources, and time periods should be utilized to determine which areas of the State are experiencing economic distress;
review the mission and resources of existing development programs and tools provided to assist distressed communities;
identify how state resources can be directed to alleviate distress within communities;
consider the Appalachian Regional Commission’s approach for identifying distressed areas and offering capacity-building strategies for use in North Carolina; and
recommend strategies for new economic development programs and for improving access to existing economic development tools for businesses and individuals in distressed communities.
The Program Evaluation Division recommends the Commission identify counties as economically distressed based on the sum of the county rankings of the four distress measures in the current tier formula before adjustments for low population and high poverty are made. Distressed counties must have been ranked among the 20 most distressed counties for six years or more, from 2007-2016.23 This provision will identify areas of the state that are dealing with long-term, persistent economic distress as opposed to areas that are experiencing short-term challenges.
The commission should be comprised of 22 members appointed by the Speaker of the House of Representatives and the President Pro Tempore of the Senate. The Commission would be led by two co-chairs, one from the North Carolina House of Representatives and one from the North Carolina Senate.
The Speaker of the House of Representatives would appoint 10 members as follows:
six members of the House of Representatives with one member designated as a co-chair and
four members of the general public representing local government and businesses from the counties identified as the most economically distressed using the methodology proposed above.
The President Pro Tempore of the Senate would appoint 10 members as follows: six members of the Senate with one member designated as the co-
chair appointed by the President Pro Tempore of the Senate and
23 As of 2015, 18 counties meet these criteria: Anson, Bertie, Bladen, Caswell, Columbus, Edgecombe, Halifax, Hertford, Lenoir, Martin, Northampton, Richmond, Robeson, Rockingham, Scotland, Vance, Warren, and Washington.
Economic Development Tiers Report No. 2015-11
Page 29 of 33
four members of the general public representing local government and businesses from the counties identified as the most economically distressed using the methodology proposed above.
The Secretary of Commerce and the President of the North Carolina Community College System shall serve on the commission as nonvoting ex-officio members.
To accomplish the stated objectives, the Commission should consult with subject matter experts from within state government such as the State demographer, the Assistant Secretary for Rural Economic Development, and the Assistant Secretary for Workforce Solutions among others. The Commission should also solicit input from economic development agencies, university faculty specializing in community and economic development issues, and representatives from federal development agencies.
The Commission should be directed to present a comprehensive strategy for meeting the needs of North Carolina communities with chronic economic distress to the General Assembly no later than March 1, 2018.
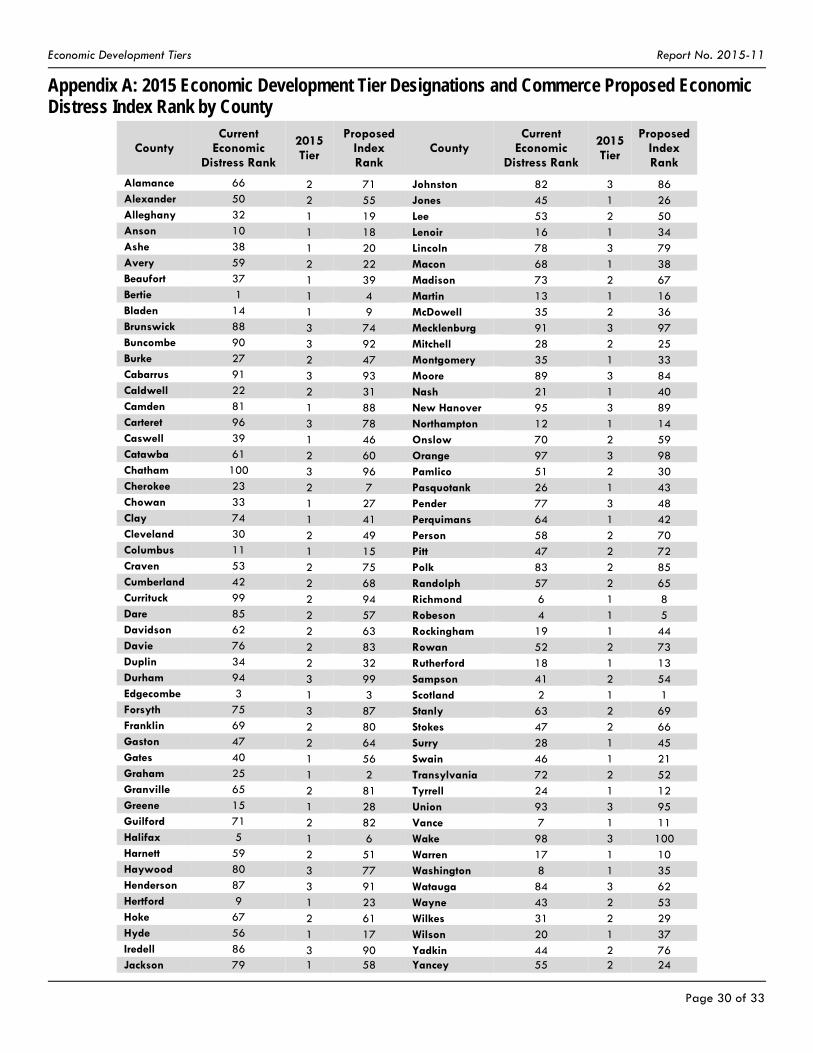
Appendices Appendix A: 2015 Economic Development Tier Designations by County
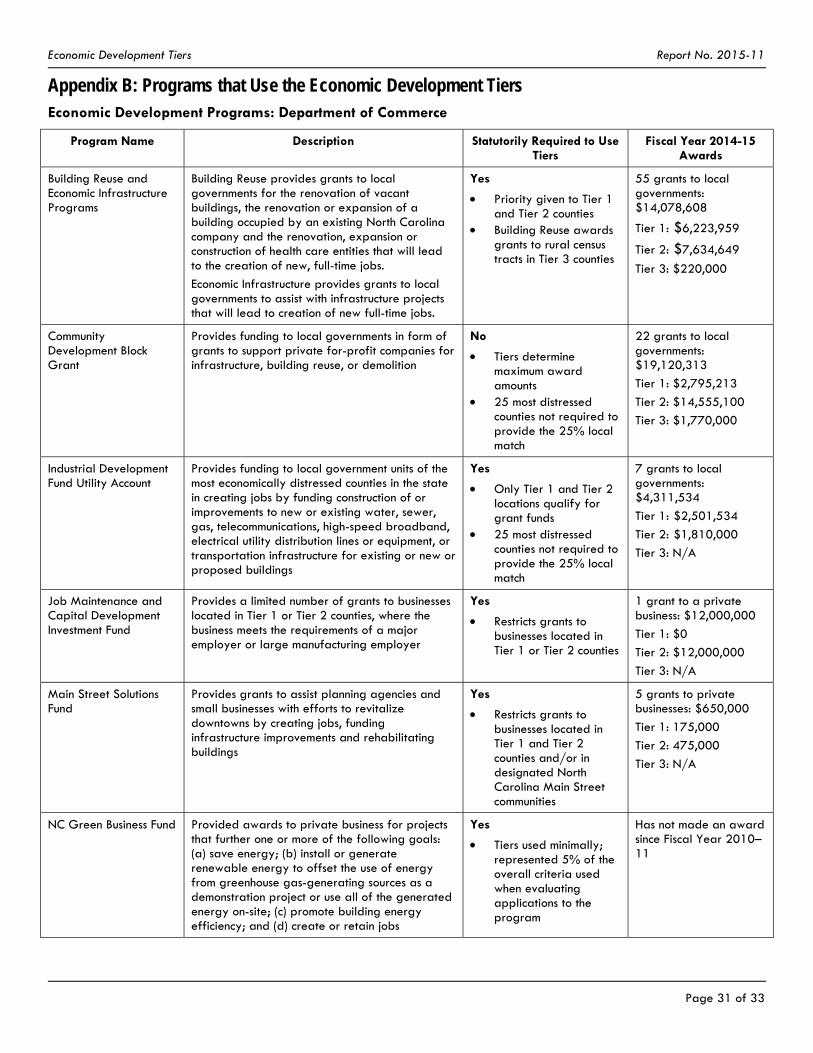
Appendix B: Programs that Use the Economic Development Tiers
Agency Response A draft of this report was submitted to the Department of Commerce to
review. Its response is provided following the report.
Program Evaluation Division Contact and Acknowledgments
For more information on this report, please contact the lead evaluator, Sara Nienow, at [email protected].
Staff members who made key contributions to this report include Pamela Taylor. John W. Turcotte is the director of the Program Evaluation Division.
Economic Development Tiers Report No. 2015-11
Page 30 of 33
Appendix A: 2015 Economic Development Tier Designations and Commerce Proposed Economic Distress Index Rank by County
County Current
Economic Distress Rank
2015 Tier
Proposed Index Rank
County Current
Economic Distress Rank
2015 Tier
Proposed Index Rank
Alamance 66 2 71 Johnston 82 3 86 Alexander 50 2 55 Jones 45 1 26 Alleghany 32 1 19 Lee 53 2 50 Anson 10 1 18 Lenoir 16 1 34 Ashe 38 1 20 Lincoln 78 3 79 Avery 59 2 22 Macon 68 1 38 Beaufort 37 1 39 Madison 73 2 67 Bertie 1 1 4 Martin 13 1 16 Bladen 14 1 9 McDowell 35 2 36 Brunswick 88 3 74 Mecklenburg 91 3 97 Buncombe 90 3 92 Mitchell 28 2 25 Burke 27 2 47 Montgomery 35 1 33 Cabarrus 91 3 93 Moore 89 3 84 Caldwell 22 2 31 Nash 21 1 40 Camden 81 1 88 New Hanover 95 3 89 Carteret 96 3 78 Northampton 12 1 14 Caswell 39 1 46 Onslow 70 2 59 Catawba 61 2 60 Orange 97 3 98 Chatham 100 3 96 Pamlico 51 2 30 Cherokee 23 2 7 Pasquotank 26 1 43 Chowan 33 1 27 Pender 77 3 48 Clay 74 1 41 Perquimans 64 1 42 Cleveland 30 2 49 Person 58 2 70 Columbus 11 1 15 Pitt 47 2 72 Craven 53 2 75 Polk 83 2 85 Cumberland 42 2 68 Randolph 57 2 65 Currituck 99 2 94 Richmond 6 1 8 Dare 85 2 57 Robeson 4 1 5 Davidson 62 2 63 Rockingham 19 1 44 Davie 76 2 83 Rowan 52 2 73 Duplin 34 2 32 Rutherford 18 1 13 Durham 94 3 99 Sampson 41 2 54 Edgecombe 3 1 3 Scotland 2 1 1 Forsyth 75 3 87 Stanly 63 2 69 Franklin 69 2 80 Stokes 47 2 66 Gaston 47 2 64 Surry 28 1 45 Gates 40 1 56 Swain 46 1 21 Graham 25 1 2 Transylvania 72 2 52 Granville 65 2 81 Tyrrell 24 1 12 Greene 15 1 28 Union 93 3 95 Guilford 71 2 82 Vance 7 1 11 Halifax 5 1 6 Wake 98 3 100 Harnett 59 2 51 Warren 17 1 10 Haywood 80 3 77 Washington 8 1 35 Henderson 87 3 91 Watauga 84 3 62 Hertford 9 1 23 Wayne 43 2 53 Hoke 67 2 61 Wilkes 31 2 29 Hyde 56 1 17 Wilson 20 1 37 Iredell 86 3 90 Yadkin 44 2 76 Jackson 79 1 58 Yancey 55 2 24
Economic Development Tiers Report No. 2015-11
Page 31 of 33
Appendix B: Programs that Use the Economic Development Tiers Economic Development Programs: Department of Commerce
Program Name Description Statutorily Required to Use Tiers
Fiscal Year 2014-15 Awards
Building Reuse and Economic Infrastructure Programs
Building Reuse provides grants to local governments for the renovation of vacant buildings, the renovation or expansion of a building occupied by an existing North Carolina company and the renovation, expansion or construction of health care entities that will lead to the creation of new, full-time jobs.
Economic Infrastructure provides grants to local governments to assist with infrastructure projects that will lead to creation of new full-time jobs.
Yes
Priority given to Tier 1 and Tier 2 counties
Building Reuse awards grants to rural census tracts in Tier 3 counties
55 grants to local governments: $14,078,608
Tier 1: $6,223,959
Tier 2: $7,634,649
Tier 3: $220,000
Community Development Block Grant
Provides funding to local governments in form of grants to support private for-profit companies for infrastructure, building reuse, or demolition
No
Tiers determine maximum award amounts
25 most distressed counties not required to provide the 25% local match
22 grants to local governments: $19,120,313
Tier 1: $2,795,213
Tier 2: $14,555,100
Tier 3: $1,770,000
Industrial Development Fund Utility Account
Provides funding to local government units of the most economically distressed counties in the state in creating jobs by funding construction of or improvements to new or existing water, sewer, gas, telecommunications, high-speed broadband, electrical utility distribution lines or equipment, or transportation infrastructure for existing or new or proposed buildings
Yes
Only Tier 1 and Tier 2 locations qualify for grant funds
25 most distressed counties not required to provide the 25% local match
7 grants to local governments: $4,311,534
Tier 1: $2,501,534
Tier 2: $1,810,000
Tier 3: N/A
Job Maintenance and Capital Development Investment Fund
Provides a limited number of grants to businesses located in Tier 1 or Tier 2 counties, where the business meets the requirements of a major employer or large manufacturing employer
Yes
Restricts grants to businesses located in Tier 1 or Tier 2 counties
1 grant to a private business: $12,000,000
Tier 1: $0
Tier 2: $12,000,000
Tier 3: N/A
Main Street Solutions Fund
Provides grants to assist planning agencies and small businesses with efforts to revitalize downtowns by creating jobs, funding infrastructure improvements and rehabilitating buildings
Yes
Restricts grants to businesses located in Tier 1 and Tier 2 counties and/or in designated North Carolina Main Street communities
5 grants to private businesses: $650,000
Tier 1: 175,000
Tier 2: 475,000
Tier 3: N/A
NC Green Business Fund Provided awards to private business for projects that further one or more of the following goals: (a) save energy; (b) install or generate renewable energy to offset the use of energy from greenhouse gas-generating sources as a demonstration project or use all of the generated energy on-site; (c) promote building energy efficiency; and (d) create or retain jobs
Yes
Tiers used minimally; represented 5% of the overall criteria used when evaluating applications to the program
Has not made an award since Fiscal Year 2010–11
Economic Development Tiers Report No. 2015-11
Page 32 of 33
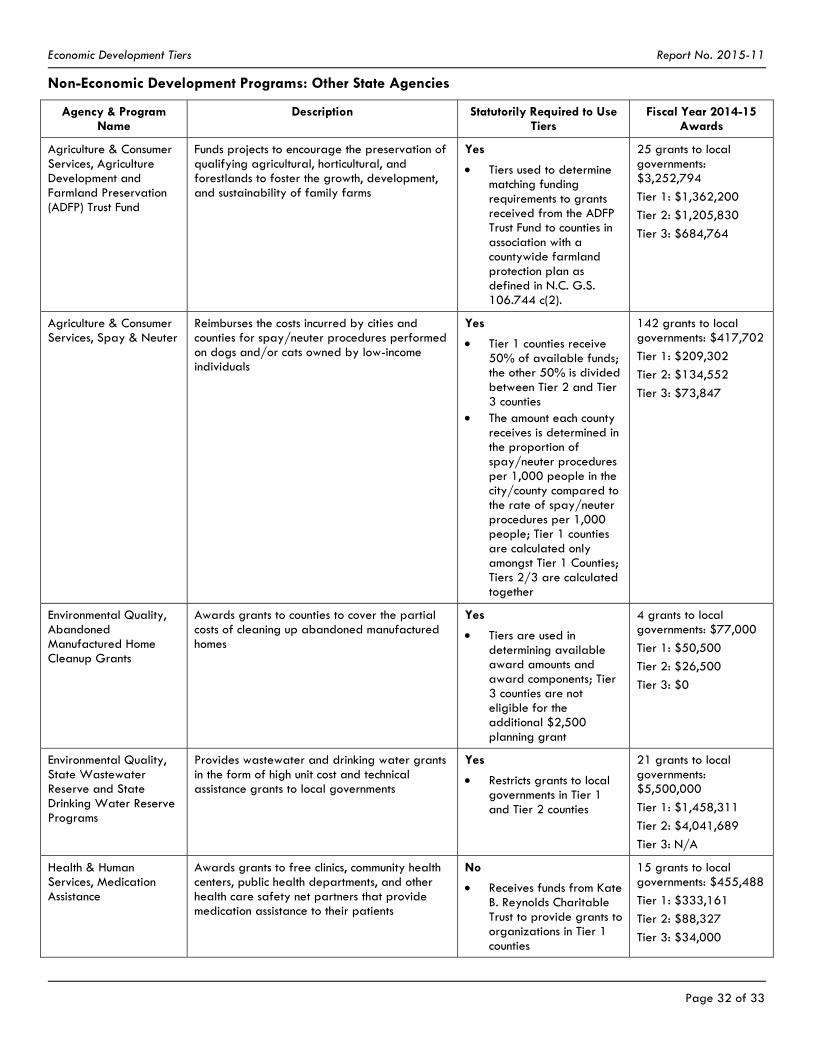
Non-Economic Development Programs: Other State Agencies
Agency & Program Name
Description Statutorily Required to Use Tiers
Fiscal Year 2014-15 Awards
Agriculture & Consumer Services, Agriculture Development and Farmland Preservation (ADFP) Trust Fund
Funds projects to encourage the preservation of qualifying agricultural, horticultural, and forestlands to foster the growth, development, and sustainability of family farms
Yes
Tiers used to determine matching funding requirements to grants received from the ADFP Trust Fund to counties in association with a countywide farmland protection plan as defined in N.C. G.S. 106.744 c(2).
25 grants to local governments: $3,252,794
Tier 1: $1,362,200
Tier 2: $1,205,830
Tier 3: $684,764
Agriculture & Consumer Services, Spay & Neuter
Reimburses the costs incurred by cities and counties for spay/neuter procedures performed on dogs and/or cats owned by low-income individuals
Yes
Tier 1 counties receive 50% of available funds; the other 50% is divided between Tier 2 and Tier 3 counties
The amount each county receives is determined in the proportion of spay/neuter procedures per 1,000 people in the city/county compared to the rate of spay/neuter procedures per 1,000 people; Tier 1 counties are calculated only amongst Tier 1 Counties; Tiers 2/3 are calculated together
142 grants to local governments: $417,702
Tier 1: $209,302
Tier 2: $134,552
Tier 3: $73,847
Environmental Quality, Abandoned Manufactured Home Cleanup Grants
Awards grants to counties to cover the partial costs of cleaning up abandoned manufactured homes
Yes
Tiers are used in determining available award amounts and award components; Tier 3 counties are not eligible for the additional $2,500 planning grant
4 grants to local governments: $77,000
Tier 1: $50,500
Tier 2: $26,500
Tier 3: $0
Environmental Quality, State Wastewater Reserve and State Drinking Water Reserve Programs
Provides wastewater and drinking water grants in the form of high unit cost and technical assistance grants to local governments
Yes
Restricts grants to local governments in Tier 1 and Tier 2 counties
21 grants to local governments: $5,500,000
Tier 1: $1,458,311
Tier 2: $4,041,689
Tier 3: N/A
Health & Human Services, Medication Assistance
Awards grants to free clinics, community health centers, public health departments, and other health care safety net partners that provide medication assistance to their patients
No
Receives funds from Kate B. Reynolds Charitable Trust to provide grants to organizations in Tier 1 counties
15 grants to local governments: $455,488
Tier 1: $333,161
Tier 2: $88,327
Tier 3: $34,000
Economic Development Tiers Report No. 2015-11
Page 33 of 33
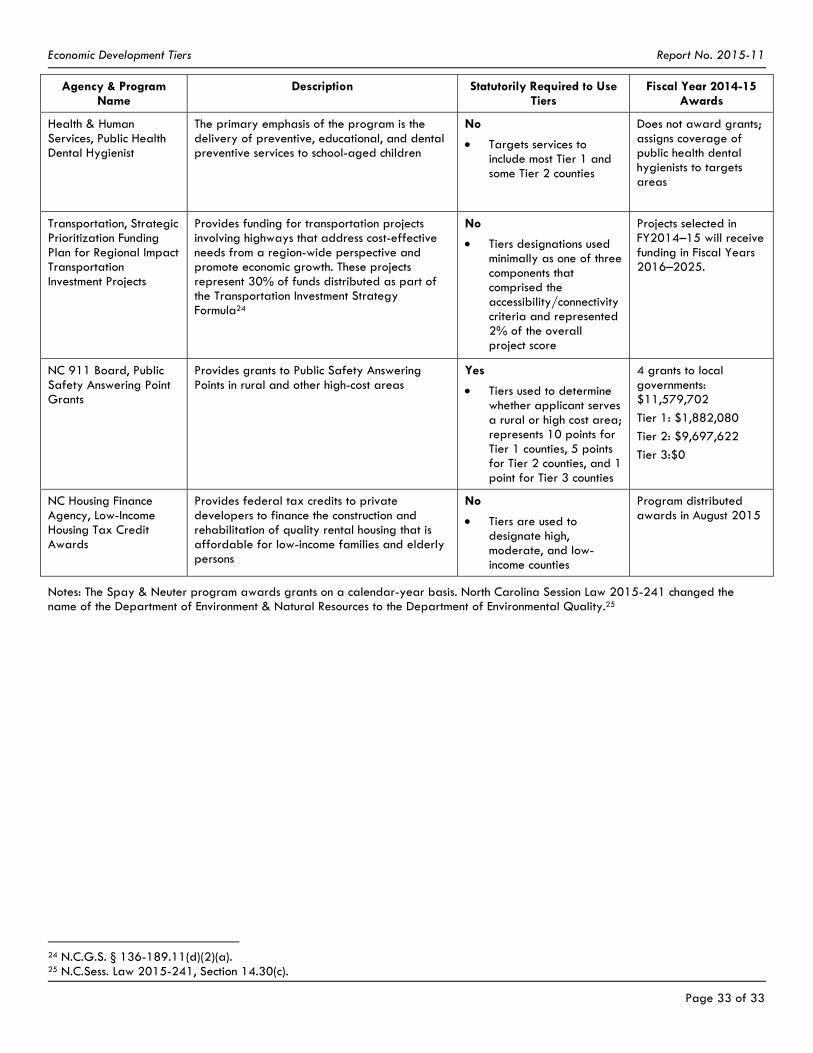
Agency & Program Name
Description Statutorily Required to Use Tiers
Fiscal Year 2014-15 Awards
Health & Human Services, Public Health Dental Hygienist
The primary emphasis of the program is the delivery of preventive, educational, and dental preventive services to school-aged children
No
Targets services to include most Tier 1 and some Tier 2 counties
Does not award grants; assigns coverage of public health dental hygienists to targets areas
Transportation, Strategic Prioritization Funding Plan for Regional Impact Transportation Investment Projects
Provides funding for transportation projects involving highways that address cost-effective needs from a region-wide perspective and promote economic growth. These projects represent 30% of funds distributed as part of the Transportation Investment Strategy Formula24
No
Tiers designations used minimally as one of three components that comprised the accessibility/connectivity criteria and represented 2% of the overall project score
Projects selected in FY2014–15 will receive funding in Fiscal Years 2016–2025.
NC 911 Board, Public Safety Answering Point Grants
Provides grants to Public Safety Answering Points in rural and other high-cost areas
Yes
Tiers used to determine whether applicant serves a rural or high cost area; represents 10 points for Tier 1 counties, 5 points for Tier 2 counties, and 1 point for Tier 3 counties
4 grants to local governments: $11,579,702
Tier 1: $1,882,080
Tier 2: $9,697,622
Tier 3:$0
NC Housing Finance Agency, Low-Income Housing Tax Credit Awards
Provides federal tax credits to private developers to finance the construction and rehabilitation of quality rental housing that is affordable for low-income families and elderly persons
No
Tiers are used to designate high, moderate, and low-income counties
Program distributed awards in August 2015
Notes: The Spay & Neuter program awards grants on a calendar-year basis. North Carolina Session Law 2015-241 changed the name of the Department of Environment & Natural Resources to the Department of Environmental Quality.25
24 N.C.G.S. § 136-189.11(d)(2)(a). 25 N.C.Sess. Law 2015-241, Section 14.30(c).

November 30, 2015 Mr. John W. Turcotte Director Program Evaluation Division North Carolina General Assembly 300 North Salisbury Street Raleigh, NC 27603-5925 Dear Mr. Turcotte, On behalf of the North Carolina Department of Commerce, thank you for the opportunity to review and respond to the Performance Evaluation Division report, The State Should Discontinue the Economic Development Tiers System and Reexamine Strategies to Assist Communities with Chronic Economic Distress. Please accept this letter as our response to this report. Recommendation 1: The General Assembly should eliminate the use of the economic development tiers system for all non-economic development programs by July 1, 2017 and direct state agencies to develop other criteria. While this recommendation does not directly apply to Commerce, the Department strongly endorses the adoption of one common set of criteria and a shared ranking of county distress for all state agencies. Having multiple measures and methodologies across agencies will add to the confusion county economic developers and others face when trying to understand the state’s policies and programs. Recommendation 2: The General Assembly should end the use of the tiers system for all economic development programs by July 1, 2018 and direct the Department of Commerce to develop alternate funding criteria. The Department agrees with replacing or eliminating the current tiers system, with preference to eliminating the tiers and moving to a statewide index. The Department believes there is a benefit to having a single, statewide model for evaluating economic distress and that Commerce is best suited to continue to calculate and disseminate its results. The Department has evaluated numerous models and approaches to measuring economic distress and has made a proposal to the General Assembly. The Department could implement this index prior to July 1, 2018, assuming necessary changes to the impacted statutes could be made in the short session. Recommendation 3: The General Assembly should establish a commission to reexamine the State’s strategy for identifying and assisting chronically distressed communities in the state. The root causes for chronic economic distress are extremely complex and include not just economic-related factors, but educational, health, mobility and other interrelated components. The Department agrees that reexamining the state’s strategy for assisting chronically distressed communities in the state is a worthwhile endeavor; however the Department believes that the best approach would be to develop both short- and long-term strategies to address this issue.
Mr. John W. Turcotte November 30, 2015 Page 2 of 2
Over the long-term, with appropriate resources, the Department of Commerce is willing to lead a thorough inter-agency review of the current strategies employed to prevent and alleviate chronic distress. In addition, opportunities and best-practices for fighting distress can be examined and appropriate solutions can be identified. Actionable recommendations, along with any investment requirements or statutory changes from the State of North Carolina could be presented to the appropriate parties in the Legislature during the 2017 long-session. In order to properly lead this analysis, the Department would need an estimated $150,000 appropriation to temporarily augment staff and align resources to engage in this important and time-intensive work. The resulting recommendations may also require additional investment by the State of North Carolina that could be considered by the North Carolina General Assembly in the 2017 session. As the State’s prime economic development agency, with a history of facilitating and leading the State’s economic development board and the State’s strategic plans, the Department of Commerce is well positioned to champion this effort. Such an approach will be more efficient and effective than appointing a 22-member commission with a directive to make recommendations by March 2018. In addition, given the importance of this issue, the Department believes there are specific strategies that could be effective in making meaningful progress in the near-term. This issue is too important to wait for the full results of an extensive analysis before action is taken. There are strategies the Department is prepared to propose that can quickly be implemented, focused on the key areas of capacity-building, strategic infrastructure development (water, sewer, roads, rail, broadband, etc.) and capital availability for start-up and small businesses. With approval during the short session, the Department could begin implementation of these strategies in the first half of 2016. We greatly appreciate the opportunity to work with your team and to provide a response the report’s recommendations. Thank you for your hard work on this important issue. Please do not hesitate to contact us if you have any questions or need any additional details about our feedback. Sincerely,
John E. Skvarla, III