The Economic Impact of Tourism in North Carolina
29
Tourism Satellite Account Calendar Year 2013 The Economic Impact of Tourism in North Carolina
Transcript of The Economic Impact of Tourism in North Carolina

Tourism Satellite Account
Calendar Year 2013
The Economic Impact of Tourism in North Carolina

2
Key results
Total tourism demand tallied $26 billion in 2013, expanding 3.9%. This
marks another new high for the North Carolina tourism sector and the
fourth consecutive year of growth.
The direct GDP of the tourism sector grew 4.1% to $10.2 billion in
2013.
Tourism demand sustained 397,714 jobs in 2013, including direct,
indirect, and induced impacts.
9.2% of all jobs* in the state are directly or indirectly sustained by
tourism activities. This marks a steady increase in share since 2008
(8.6%).
Including indirect and induced impacts, tourism in North Carolina
generated $3.0 billion in state and local taxes and $3.1 billion in
Federal taxes in 2013.
* Compared to BEA Wage and Salary Employment, SA25N
3
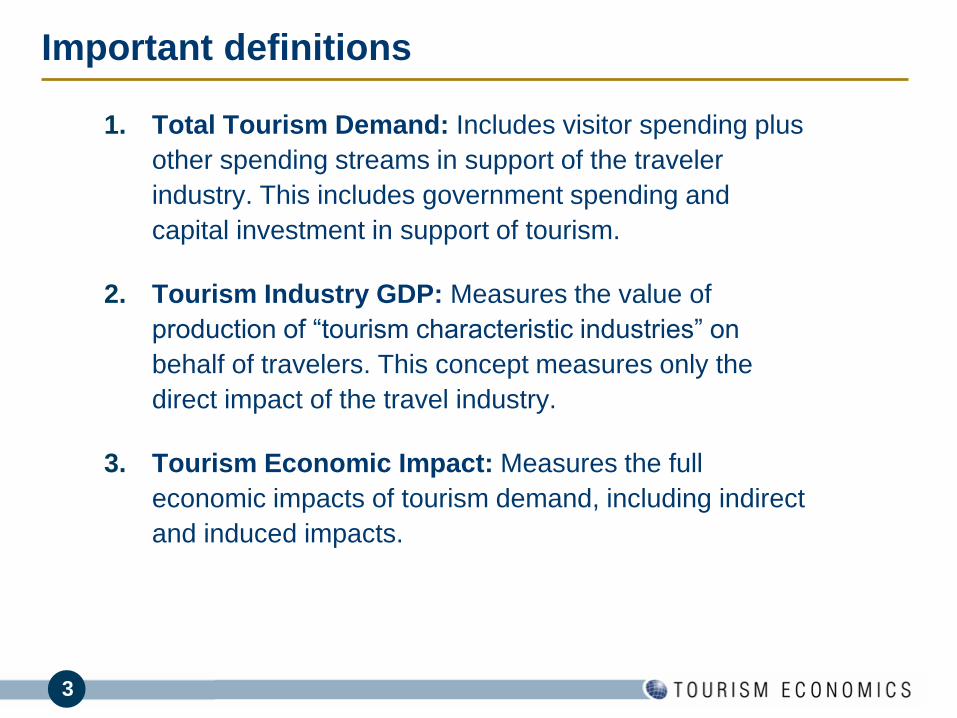
Important definitions
1. Total Tourism Demand: Includes visitor spending plus
other spending streams in support of the traveler
industry. This includes government spending and
capital investment in support of tourism.
2. Tourism Industry GDP: Measures the value of
production of “tourism characteristic industries” on
behalf of travelers. This concept measures only the
direct impact of the travel industry.
3. Tourism Economic Impact: Measures the full
economic impacts of tourism demand, including indirect
and induced impacts.

4
ACCOMODATION
CATERING, ENTERTAINMENT
RECREATION, TRANSPORTATION
&OTHER TRAVEL RELATED SERVICES
PRINTING/PUBLISHING, UTILITIES
FINANCIAL SERVICES, SANITATION SERVICES
FURNISHINGS AND EQUIPMENT SUPPLIERS,
SECURITY SERVICES, RENTAL CAR MANUFACTURING,
TRANSPORTATION ADMINISTRATION, TOURISM
PROMOTION, SHIP BUILDING, AIRCRAFT MANUFACTURING,
RESORT DEVELOPMENT, GLASS PRODUCTS, IRON/STEEL
T&
T D
IRE
CT
T&
T IN
DIR
EC
T
T&
T IN
DU
CE
D
OV
ER
ALL T
&T IM
PA
CT
FOOD & BEVERAGE SUPPLY, RETAILERS
BUSINESS SERVICES, WHOLESALERS, COMPUTERS,
UTILITIES, MANUFACTURERS, HOUSING, PERSONAL SERVICES
Illustrating the concepts
Travel & Tourism Industry
■ The direct effect of visitor spending
■ Focus of Tourism Satellite Account
■ Allows for industry rankings and
comparisons
Travel & Tourism Economic Impact
The flow-through effect of total T&T demand
across the economy
■ Expands the focus to measure the
overall impact of T&T on all sectors of
the economy

5
By monitoring tourism’s economic impact, policy makers
can make informed decisions regarding the funding and
prioritization of tourism development.
It can also carefully monitor its successes and future
needs.
In order to do this, tourism must be measured in the
same categories as other economic sectors – i.e. tax
generation, employment, wages, and gross domestic
product.
Why quantify the tourism economy?

6
What is this a challenge?
Most economic sectors such as financial services,
insurance, or construction are easily defined within a
country’s national accounts statistics.
Tourism is not so easily measured because it is not a
single industry. It is a demand-side activity which affects
multiple sectors to various degrees.
Tourism spans nearly a dozen sectors including lodging,
recreation, retail, real estate, air passenger transport, food
& beverage, car rental, taxi services, travel agents…

7
• The TSA was conceived by the UN World Tourism
Organization and has since been ratified by the UN,
Eurostat, and OECD.
• The standard has been adopted by over fifty countries
around the world.
• The TSA deals with the challenge of measuring tourism in
two important ways:
1. Defines the tourism economy
2. Provides methodology for calculating tourism GDP in
a way that is consistent with economic accounts
The Tourism Satellite Account

8
• Enables comparisons of the importance of
tourism to other sectors of the economy in terms
of GDP, employment, and income
• Allows for benchmarking to other destinations
• Tracks the economic contribution of tourism over
time
• Monitors strength by tracking capital investment
• Allows for extension analysis for of the full
impact of tourism
Benefits of a TSA

9
Detailed Results

10
Tourism demand (spending)
Total tourism demand in NC rose 3.9% in 2013, building on the strength of the prior three
years, and reaching a new peak of nearly $26 billion.
Non-visitor private consumption expenditures (PCE) represent tourism consumer durables
such as an RV, boat, or furniture for a vacation home. These rose 2.4% last year to $832
million.
International visitor spending expanded 3.5% % as NC continues to rise as a global
destination.
Government support for tourism, including the budgets for tourism promotion and visitor
centers, increased 5.9%.
Capital investment, including construction of hotels and attractions, as well as tourism
infrastructure, continued to recover in 2013 with a 4.6% increase.
Domestic
Visitor
Int'l Visitor Non-visitor
PCE
Gov't
Support
CAPEX Total % change
2009 $ 17,608 551$ 668$ 127$ 1,258$ 20,213$ -9.0%
2010 $ 19,112 591$ 724$ 140$ 1,192$ 21,758$ 7.6%
2011 $ 20,818 $ 618 $ 804 $ 152 1,330$ 23,722$ 9.0%
2012 21,925$ 720$ 812$ 138$ 1,384$ 24,978$ 5.3%
2013 22,792$ 745$ 832$ 146$ 1,447$ 25,962$ 3.9%
% change 4.0% 3.5% 2.4% 5.9% 4.6% 3.9%
Tourism Demand by Category, $ million

11
Tourism demand by source
Domestic visitor markets
comprised the majority (88%)
of tourism demand in 2013.
Capital investment in tourism-
related construction and
machinery & equipment
represents 6% of all tourism-
related demand.
International visitor markets
contributed 3% of tourism
demand in North Carolina last
year.
Domestic Visitor88%
Int'l Visitor3%
Non-visitor PCE3%
Gov't Support0.6%
CAPEX6%

12
Tourism demand growth
The North Carolina
visitor economy
reached a new
peak of $26 billion
in 2013.
Tourism demand
has grown by an
average of 6.4%
per annum since
2009. $-
$5
$10
$15
$20
$25
$30
2009 2010 2011 2012 2013
Other
CAPEX
Int'l Visitor
DomesticVisitor
Tourism Demand Trendbillions
Source: Tourism Economics

13
Translating spending into impact
The direct impacts
are quantified within
travel-related
sectors.
The indirect impacts
include the benefits
realized by the
supply chain.
The induced impacts
are generated as
wages are spend
within the state’s
economy.

14
Tourism business sales by sector
Tourism demand of $26 billion generated $39.5 billion in business sales, including
indirect and induced impacts. Total tourism-generated business sales expanded
3.6% in 2013.
Direct* Indirect Induced Total % Change
Agriculture, Fishing, Mining 124 63 186 2.9%
Construction and Utilities 352 386 166 904 3.0%
Manufacturing 1,149 833 1,982 2.9%
Wholesale Trade 1,095 389 372 1,857 4.1%
Air Transport 3,423 15 16 3,453 6.3%
Other Transport 335 479 192 1,006 3.8%
Retail Trade 5,131 187 835 6,153 3.3%
Gasoline Stations 2,400 14 56 2,470 1.5%
Communications 391 218 610 2.9%
Finance, Insurance and Real Estate** 2,212 1,265 912 4,389 2.0%
Business Services 295 1,491 402 2,188 -13.4%
Education and Health Care 7 1,170 1,177 3.1%
Recreation and Entertainment 1,961 67 97 2,125 2.7%
Lodging 3,368 55 50 3,473 4.8%
Food & Beverage 4,381 168 357 4,907 4.5%
Personal Services 864 132 286 1,282 56.3%
Government 146 150 1,023 1,319 3.4%
TOTAL (2013) 25,962 6,469 7,049 39,480 3.6%
% change 3.9% 2.8% 3.2% 3.6%
* Direct sales include cost of goods for retail sectors
**Includes seasonal second homes
Tourism Sales (Output)
US$ Million, 2013

15
Tourism sales
All sectors of the
North Carolina
economy benefit
from tourism
activity directly
and/or indirectly.
Finance, insurance
& real estate
(FIRE), business
services, and
manufacturing
sectors realize
substantial indirect
business from
tourism activities.
0
1,000
2,000
3,000
4,000
5,000
6,000
7,000
Reta
il T
rad
e
Food &
Bev
Lo
dgin
g
Air T
ransp
ort
Gaso
line
Busin
ess S
vcs.
Recre
ation
Ma
nufa
ctu
ring
Whole
sa
le T
rd
Gove
rnm
ent
Pers
onal S
vcs
Edu, H
ealth
Oth
er
Tra
nsp
ort
Constr
, U
tilit
ies
Com
munic
atio
ns
Agricultu
re
Induced
Indirect
Direct
$ million
Tourism Business Sales

16
Tourism industry GDP
Tourism GDP is the value
added of those sectors
directly interacting with
travelers.
The narrow definition of the
tourism industry counts only
tourism consumption, which
excludes capital investment
and general government
support of tourism. This
definition is consistent with
economic accounts.
On this basis, tourism
industry GDP reached $10.2
billion in 2013, accounting for
2.2% of total North Carolina
GDP.
2009 2010 2011 2012 2013 %
Air Transport 819 940 1,063 1,144 1,217 6.4%
Other Transport 147 165 176 186 197 5.7%
Retail Trade 955 1,008 1,067 1,118 1,155 3.3%
Gasoline Stations 218 265 328 336 341 1.4%
Communications
Finance, Insurance and Real Estate 1,302 1,339 1,486 1,535 1,553 1.2%
Business Services 103 108 274 283 122 -57.0%
Education and Health Care
Recreation and Entertainment 957 980 1,043 1,090 1,119 2.6%
Lodging 1,616 1,743 1,866 2,027 2,126 4.9%
Food & Beverage 1,557 1,699 1,798 1,913 2,003 4.7%
Personal Services 344 363 185 189 394 108.4%
Government 6 7 7 7 7 5.9%
TOTAL 8,023 8,617 9,294 9,828 10,233 4.1%
% change -5.9% 7.4% 7.8% 5.7% 4.1%
Tourism GDP (Value Added)
(US$ Million)

17
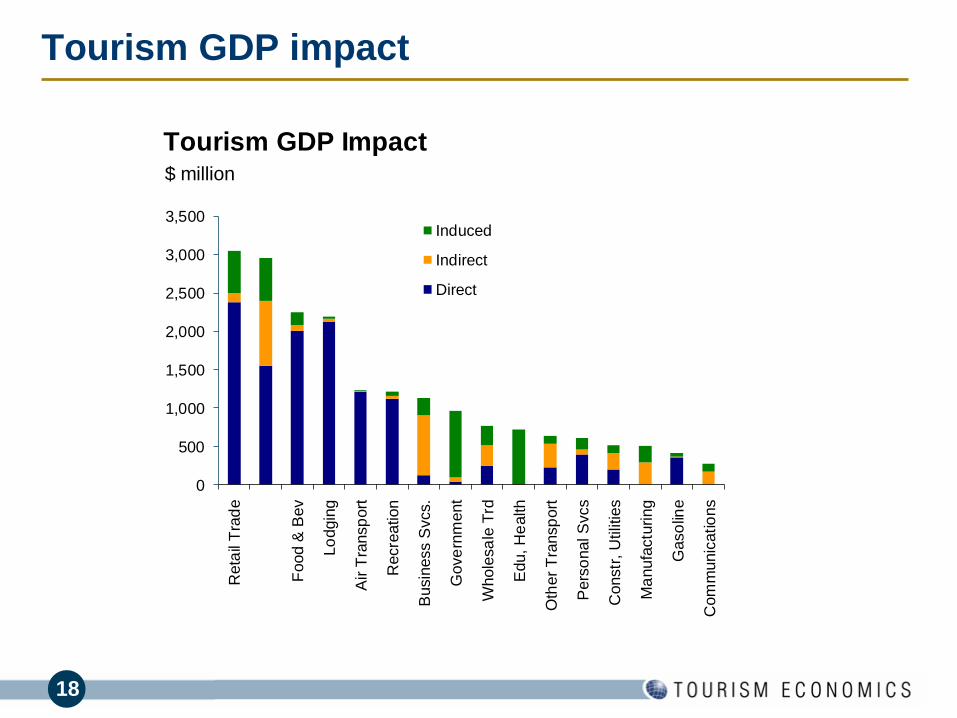
Tourism GDP impact
Including the direct, indirect and induced impacts of total tourism demand, the
tourism sector generated $19.4 billion of state GDP in 2013. This was 4.1% of
the state economy.
Direct* Indirect Induced Total % change
Agriculture, Fishing, Mining 28 18 46 2.9%
Construction and Utilities 200 214 103 518 3.0%
Manufacturing 293 215 507 2.9%
Wholesale Trade 247 264 252 763 3.6%
Air Transport 1,217 4 5 1,226 6.3%
Other Transport 226 309 103 637 3.8%
Retail Trade 2,383 122 543 3,048 3.3%
Gasoline Stations 360 9 39 408 1.6%
Communications 173 97 269 2.9%
Finance, Insurance and Real Estate 1,553 848 556 2,957 2.0%
Business Services 122 786 220 1,128 -10.6%
Education and Health Care 4 717 721 3.1%
Recreation and Entertainment 1,119 37 57 1,214 2.7%
Lodging 2,126 34 31 2,191 4.8%
Food & Beverage 2,003 77 164 2,245 4.5%
Personal Services 394 66 145 605 53.6%
Government 42 58 868 968 3.2%
TOTAL 11,992 3,325 4,133 19,450 3.6%
% change 4.1% 2.8% 3.2% 3.6%
Tourism GDP (Value Added)
(2013, US$ Million)
18
Tourism GDP impact
0
500
1,000
1,500
2,000
2,500
3,000
3,500 R
eta
il T
rad
e
Food &
Bev
Lo
dgin
g
Air T
ransp
ort
Recre
ation
Busin
ess S
vcs.
Gove
rnm
ent
Whole
sa
le T
rd
Edu, H
ealth
Oth
er
Tra
nsp
ort
Pers
onal S
vcs
Constr
, U
tilit
ies
Ma
nufa
ctu
ring
Gaso
line
Com
munic
atio
ns
Induced
Indirect
Direct
$ million
Tourism GDP Impact

19
Ranking tourism industry employment
The NC tourism industry
directly employed
289,055 in 2013. This
narrow measurement of
tourism includes only
those jobs directly
supported by visitor
activity and enables inter-
industry ranking.
On this basis, tourism is
the 4th largest private
employer in the state of
North Carolina.*
* Ranked to BLS Wage and Salary Employment, QCEW
Rank Industry Jobs
1 Health Care and Social Assistance 474,765
2 Manufacturing 442,519
3 Retail Trade* 381,914
4 Tourism (Direct Impact) 289,055
5 Administrative and Support and Waste Management 270,746
6 Accommodation and Food Services* 245,441
7 Professional, Scientific, and Technical Services 199,973
8 Wholesale Trade 173,869
9 Construction 173,485
10 Finance and Insurance 150,658
11 Other Services (except Public Administration) 99,161
12 Transportation and Warehousing 90,370
13 Management of Companies and Enterprises 77,841
14 Information 69,715
15 Educational Services 66,167
16 Real Estate and Rental and Leasing 49,410
17 Agriculture, Forestry, Fishing and Hunting 28,745
18 Arts, Entertainment, and Recreation* 27,782
19 Utilities 12,452
20 Mining, Quarrying, and Oil and Gas Extraction 2,961
* net of tourism employment
Employment Ranking
2013

20
Total tourism employment
The tourism sector
directly and indirectly
supported 397,714
jobs, or 9.2% of all
payroll employment* in
North Carolina last
year.
Tourism-related
employment grew
1.9% in 2013 as
businesses hired to
support visitor
spending increases.
Tourism is leading the
state in job creation.
Total NC employment
grew just 1.6% in
2013.* Compared to BEA Wage and Salary Employment, SA25N
Direct Indirect Induced Total %
change
Agriculture, Fishing, Mining - 1,360 713 2,073 1.9%
Construction and Utilities 5,873 1,732 378 7,983 2.1%
Manufacturing 3,750 3,635 2,123 9,507 1.2%
Wholesale Trade 2,310 2,233 2,120 6,662 2.2%
Air Transport 11,942 66 71 12,079 -2.4%
Other Transport 5,188 5,305 1,731 12,224 2.3%
Retail Trade 74,271 2,801 12,518 89,590 1.7%
Gasoline Stations 4,310 141 573 5,024 0.9%
Communications - 1,584 699 2,282 1.9%
Finance, Insurance and Real Estate 13,705 7,078 4,583 25,367 1.2%
Business Services 1,033 14,297 4,205 19,536 -0.3%
Education and Health Care - 102 14,323 14,426 2.1%
Recreation and Entertainment 32,114 1,602 1,854 35,570 3.4%
Lodging 43,529 798 704 45,031 1.3%
Food & Beverage 81,628 3,269 6,916 91,814 2.3%
Personal Services 8,698 2,126 5,657 16,482 6.5%
Government 706 786 574 2,066 2.3%
TOTAL 289,055 48,916 59,743 397,714 1.9%
% change 1.9% 1.9% 2.1% 1.9%
Tourism Employment
2013

21
The restaurant, lodging,
and retail sectors
employed the most
persons in the tourism
sector.
Secondary benefits are
realized across the entire
economy through the
supply chain and incomes
as they are spent.
For example, nearly
20,000 people are
employed in business
services as a result of
tourism activity.
Total tourism employment
0
10
20
30
40
50
60
70
80
90
100
Food &
Bev
Reta
il T
rade
Lodgin
g
Recr
eation
Fin
ance, re
al est
ate
Busi
ness
Svcs.
Pers
onal S
vcs
Edu, H
ealth
Oth
er
Tra
nsp
ort
Air T
ransport
Manufa
ctu
ring
Const
r, U
tilitie
s
Whole
sale
Tra
de
Gasolin
e
Com
munic
ations
Agriculture
Govern
ment
Th
ou
sa
nd
s
Induced
Indirect
Direct
Tourism Employment Impact

22
Tourism represents
substantial shares of the
air transport, recreation,
lodging, and food &
beverage industries.
Tourism employment shares
98%
87%
27%
23%
0% 20% 40% 60% 80% 100%
Lodging
Air Transport
Recreation and Entertainment
Food & Beverage
Tourism Employment Share of Key Industries

23
Tourism personal income
$10.8 billion in compensation was generated by tourism demand in
2013, an increase of 3.9%.
Direct Indirect Induced Total % change
Agriculture, Fishing, Mining 20 14 34 3.5%
Construction and Utilities 181 110 40 331 3.3%
Manufacturing 180 118 298 3.5%
Wholesale Trade 136 144 137 417 3.9%
Air Transport 665 4 4 673 10.6%
Other Transport 153 246 76 475 4.2%
Retail Trade 1,620 76 335 2,031 3.3%
Gasoline Stations 131 4 17 152 1.7%
Communications 98 44 142 3.5%
Finance, Insurance and Real Estate 358 288 224 870 2.5%
Business Services 48 611 174 834 -3.9%
Education and Health Care 3 602 606 3.3%
Recreation and Entertainment 636 29 38 703 3.5%
Lodging 1,171 19 17 1,206 1.8%
Food & Beverage 1,364 53 112 1,528 3.0%
Personal Services 270 50 111 431 35.0%
Government 25 33 22 80 4.2%
TOTAL 6,758 1,969 2,084 10,811 3.9%
% change 4.1% 3.6% 3.3% 3.9%
Tourism Income (Compensation)
(2013, US$ Million)

24
Tourism personal income
Tourism generated the
most personal income in
the retail trade, food &
beverage, and lodging
sectors.
The business services
sector benefits strongly
as a supplier to other
tourism sectors.
0
500
1,000
1,500
2,000
2,500
Re
tail
Tra
de
Fo
od
& B
ev
Lo
dgin
g
Bu
sin
ess S
vcs.
Re
cre
atio
n
Air
Tra
nsp
ort
Ed
u,
He
alth
Oth
er
Tra
nsp
ort
Pe
rso
nal S
vcs
Co
nstr
, U
tilit
ies
Ma
nu
factu
rin
g
Gaso
line
Induced
Indirect
Direct
$ millionTourism Income Impact

25
Tourism tax generation
Taxes of $6.1 billion were directly and indirectly generated by tourism in 2013.
State and local taxes alone tallied $3.0 billion.
Each household in North Carolina would need to be taxed an additional $816 per
year to replace the tourism taxes received by state and local governments.
2008 2009 2010 2011 2012 2013
Federal Taxes2,787 2,543 2,708 2,875 3,007 3,121
Corporate 484 444 476 515 540 560
Indirect Business 375 344 369 399 418 433
Personal Income 780 710 754 793 829 861
Social Security 1,148 1,045 1,109 1,168 1,220 1,267
State and Local Taxes 2,690 2,442 2,582 2,785 2,913 3,034
Corporate 326 300 321 347 364 377
Personal Income 321 292 292 308 321 334
Sales 1,063 975 1,045 1,131 1,186 1,229
Property 712 654 700 758 795 824
Excise and Fees 80 74 79 85 89 93
State Unemployment 22 20 20 21 22 22
Lodging Taxes 166 128 124 134 136 156
TOTAL 5,477 4,985 5,290 5,660 5,920 6,155
% change 7.7% -9.0% 6.1% 7.0% 4.6% 4.0%
Tourism-Generated Taxes
(US$ Million)

26
Government support of tourism
Government support of tourism is divided between collective (general support) and
individual (specific support) spending.
Total state government support of tourism was $11.3 million.
County government support of tourism rose nearly 10% to $120.1 million.
Municipality government support of tourism fell 5.7% to $14.9 million.
Total government support of tourism tallied $146 million in the 2013/14 fiscal year.
State and local taxes generated by tourism ($3.0 billion) surpass this funding by a rate of
21 to 1 (up from 17 to 1 in 2009).
Government Individual Collective Total % change
State 1,909,226$ 9,375,200$ 11,284,426$ -11.3%
Counties 18,015,393$ 102,087,226$ 120,102,619$ 9.6%
Municipalities 2,228,521$ 12,628,284$ 14,856,805$ -5.7%
TOTAL 22,153,140$ 124,090,710$ 146,243,850$ 5.9%
Tourism Administration and Promotion
2013/14

27
Tourism capital investment
$1.4 billion was invested by the tourism sector last year, including
hotels, recreational facilities, and related government capital outlays.
The 4.6% increase continues the recovery in tourism-related
investment though it still remains 13% below 2007 levels.
2009 2010 2011 2012 2013
Construction 348,723,507$ 236,881,875$ 336,083,006$ 340,743,963$ 351,822,738$
Recreation and Entertainment 239,565,000$ 122,779,500$ 181,782,000$ 130,659,000$ 186,363,750$
Hotels and Motels 54,529,000$ 84,690,000$ 126,119,000$ 182,335,000$ 152,263,000$
Government Capital Outlays 54,629,507$ 29,412,375$ 28,182,006$ 27,749,963$ 13,195,988$
Machinery and Equipment 909,775,654$ 955,264,436$ 993,475,014$ 1,043,148,765$ 1,095,306,203$
Total 1,258,499,161$ 1,192,146,311$ 1,329,558,020$ 1,383,892,727$ 1,447,128,940$
% change -24.6% -5.3% 11.5% 4.1% 4.6%
Total Tourism Related
Tourism Capital Investment

28
Tourism Economics is an Oxford Economics company dedicated to providing
high value, robust, and relevant analyses of the tourism sector that reflects the
dynamics of local and global economies. By combining quantitative methods with
industry knowledge, Tourism Economics designs custom market strategies,
project feasibility analysis, tourism forecasting models, tourism policy analysis,
and economic impact studies.
Our staff have worked with more than 200 destinations to quantify the economic
value of tourism, forecast demand, guide strategy, or evaluate tourism policies.
Oxford Economics is one of the world’s leading providers of economic analysis,
forecasts and consulting advice. Founded in 1981 as a joint venture with Oxford
University’s business college, Oxford Economics is founded on a reputation for
high quality, quantitative analysis and evidence-based advice. For this, it draws
on its own staff of 80 highly-experienced professional economists; a dedicated
data analysis team; global modeling tools; close links with Oxford University, and
a range of partner institutions in Europe, the US and in the United Nations
Project Link.
For more information: [email protected] / +1 610 995 9600.
About Tourism Economics

29
For more information:
Adam Sacks, President
Christopher Pike, Director of Impact Studies