North Atlantic Traffic Forecast and NAT Documents/NAT...4 Description of New Forecast Methodology...
11
North Atlantic Traffic Forecast (1 October 2016)
Transcript of North Atlantic Traffic Forecast and NAT Documents/NAT...4 Description of New Forecast Methodology...

North Atlantic Traffic Forecast (1 October 2016)

3
Table of Contents
• Description of New Forecast Methodology
• Near-Term Forecast Methodology and Results
– Data
– Simplified Algorithm
– Peak Week Historical and Forecasted FIR Operations
– North Atlantic LCC Analysis
– Middle East Carrier Analysis
• Long-Term Forecast Methodology
• 20 Year NAT Traffic Forecast (2015 – 2035)
• Conclusions

4
Description of New Forecast Methodology
• The new twenty year forecast is composed of two parts • Near-term projection for the first five years
• Long-term portion that forecasts 5 to 20 years into the future
• The near-term portion (first five years) of the forecast is • Based on carrier fleet order books
• Reflects decisions about network and fleet changes by 48 air carriers
• Reflects input from operators and key stakeholders
• Built at detail level of carrier, equipment type, city pair, and FIR crossings
• Includes airport capacity constraints (i.e., this is not an unconstrained forecast)
• The long-term portion of the forecast • Reflects traffic growth for the following 15 years
• References economic based growth-rates published by IATA, ICAO, Boeing, and Airbus
• Consists of a central, low, and high growth rate
• The composite forecast appends the long-term forecast to the last year of the near-term forecast

5
Near-Term Five-Year Forecast Methodology: Data
• FIR Set: – All NAT FIRs (except Bodø oceanic)
• Carrier Set: – Forty-eight carriers (combination of the top 80% of traffic in each FIR)
– This includes four major Middle Eastern carriers and low cost carriers with significant growth potential (study commissioned by FAA)
– About 10% of all NAT traffic are operated by LCCs
• Fleet Information – Sources for equipment inventory, orders, and retirement plans
Carrier websites Publicly available financial documents
Public news announcements Ch-Aviation.com
Planespotters.com Boeing and Airbus order books
• Fleet Utilization – Flight data obtained from ANSPs used to determine utilization per
carrier/equipment/FIR
– Focused on ANSP provided data for July 15-21, 2015

6
Five-Year Forecast Methodology: Simplified Fratar Algorithm
Mathematical formulation for the Simplified Fratar Algorithm:
where,
i identifies the ith departure airport j identifies the jth arrival airport,
k identifies the kth carrier l identifies the year
Xijkl is the number of projected NAT flights from airport i to airport j by carrier k in year l
Yijk is the number of NAT flights from airport i to airport j by carrier k in the base year data set provided by the ANSPs
The carrier-level growth projection constraint requires that each carrier match its yearly growth projections that were determined in the fleet analysis.
Min (𝑋𝑖𝑗𝑘𝑙 − 𝑌𝑖𝑗𝑘 )2
𝑖𝑗 for each kl combination
Subject to the carrier-level growth projection constraint:
𝐷𝑘𝑙 = 𝑋𝑖𝑗𝑘𝑙𝑖𝑗 , for each kl combination

7
Peak Week Historical and Near-Term Forecasted FIR Operations
Note that summing across FIRs does not provide total NAT operations for the carrier since a single flight can cross multiple FIRs.
Average Yearly Growth Rates by FIR
FIR 2013 – 2015
(actual growth rate) 5-Yr Projected Shanwick 5.4% 3.6%
Gander 6.9% 3.3% New York -1.8% 2.6%
Reykjavik 12.0% 5.1% Santa Maria -0.2% 4.0%
An annual growth of 3.6% is projected for total Trans-Atlantic operations between 2016 and 2020
0
2000
4000
6000
8000
10000
12000
14000
2013 2014 2015 2016 2017 2018 2019 2020
Peak
Wee
k Tr
affi
c
NAT Traffic by FIR
Shanwick Gander New York Reykjavik Santa Maria
Historical Forecast
8
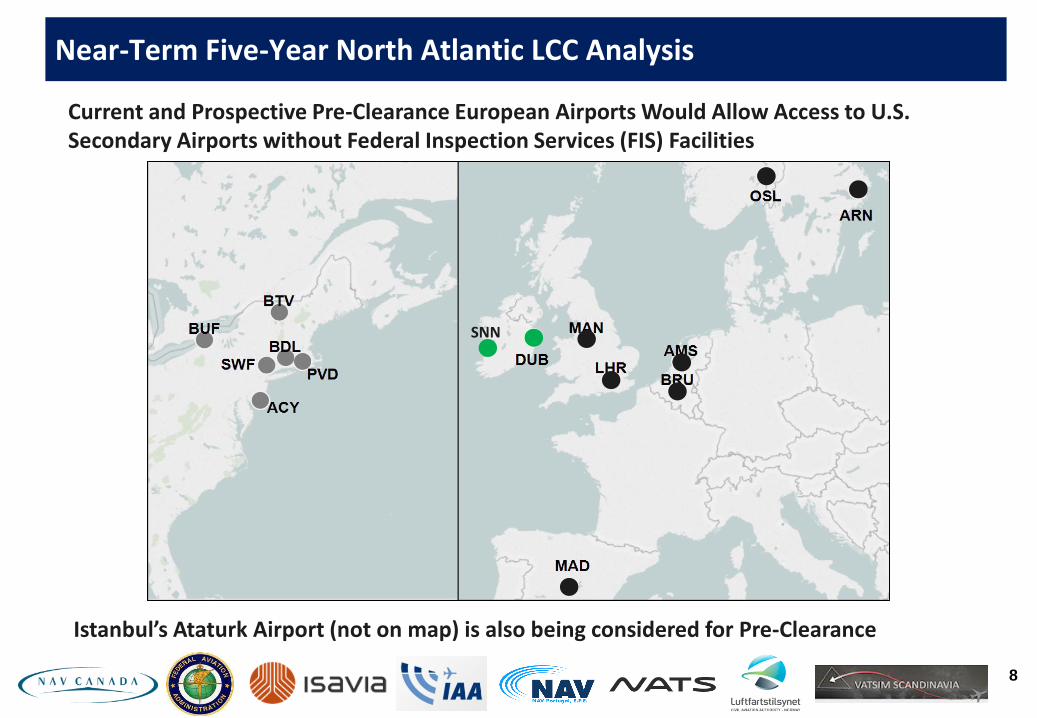
Near-Term Five-Year North Atlantic LCC Analysis
Current and Prospective Pre-Clearance European Airports Would Allow Access to U.S. Secondary Airports without Federal Inspection Services (FIS) Facilities
Istanbul’s Ataturk Airport (not on map) is also being considered for Pre-Clearance
SNN

9
Near-Term Five-Year Middle East Carrier Analysis
Current and Prospective US markets to be served by Middle East carriers

10
15-Year Long-Term Forecast (beyond Near-Term Forecast )
Summary of Long-Range (2020-2035) North Atlantic Passenger Growth Forecast
High 4.7%
Central 3.0%
Low 2.0%
The long-term forecast branches into high, central and low forecasts from the end of the near-term forecast (Average Annual Growth Rate (AAGR))
Sources AAGR from
2014 to 2034 AAGR from
2020 to 2030 AAGR from
2010 to 2030 AAGR from
2020 to 2035
IATA 2.6% 2.0% 3.0% 2.0%
Boeing 3.0%
Airbus 2.8% ICAO (FESG CAEP/9) High
Scenario 4.7% 4.7% ICAO (FESG CAEP/9)
Central forecast 3.8% 3.9% ICAO (FESG CAEP/9) Low
Scenario 3.0% 3.1%

11
20 Year NAT Traffic Forecast (2015 – 2035)
Composite Growth Rates (2015 - 2035)
High 4.4%
Central 3.2% Low 2.4%

12
Conclusions
• The 2015 – 2020 traffic forecast, based on airline fleet analysis and business plans, is projected to grow 3.6% annually
• Contributing factors to first five years in the forecast
– Rapid growth in New York due to Norwegian Air, Air Europa, and jetBlue
– Gander and Shanwick operations will grow at a rate of 3.5%.
– Santa Maria will grow due to Air Europa which has a large order book
– Reykjavik will grow due to Icelandair, Norwegian Air, and WestJet
• Large orders by middle east carriers will significantly grow NAT traffic
• LCCs will add significant growth in the North Atlantic
• Growth by legacy carriers will remain fairly flat
• The 20 year NAT traffic forecast (2015 – 2035) is projected to grow at a 3.2% average annual rate
———