Nordson Corporation2007 Annual Report
112
Nordson Corporation 2007 Annual Report Expanding from the core. Adhesive Dispensing Systems Advanced Technology Systems Industrial Coating and Automotive Systems
Transcript of Nordson Corporation2007 Annual Report

Nordson Corporation 2007 Annual Report
Expanding from the core.
Adhesive Dispensing
Systems
Advanced Technology
Systems
Industrial Coating and Automotive
Systems
0712542_cover-02.qxp 1/8/08 7:27 PM Page 2

About Nordson
Nordson Corporation is one of the world’s leading manufacturers of equipment used for precision dispensing,
testing and inspection, surface preparation and curing. Nordson’s technology-based systems can be found
in production facilities around the world. Nordson serves many diverse markets, including the appliance, auto-
motive, bookbinding, container, converting, electronics, food and beverage, furniture, life sciences, medical,
metal finishing, nonwoven, packaging and semiconductor industries.
Nordson’s strategy for long-term growth is based on a customer-driven focus and a global mindset.
Headquartered in Westlake, Ohio, Nordson markets its products through a network of direct operations in
30 countries. Consistent with this strategy, more than two-thirds of Nordson’s revenues are generated from
outside the United States.
Nordson has more than 4,000 employees worldwide. Principal manufacturing facilities are located in
the United States in California, Georgia, New Jersey, Ohio and Rhode Island, as well as in China, Germany, India,
The Netherlands and the United Kingdom.
Contents
1 Financial Highlights 2 Letter to Shareholders 5 Financial Focus 6 Year in Review 14 Business Profiles
16 Worldwide Operations 18 Corporate Philosophy 19 Board of Directors and Executive Management 20 Eleven-Year Summary
22 Shareholder Information 23 Form 10-K
0712542_cover-03.qxp 1/9/08 6:18 PM Page 3

Financial Highlights
Operations for the year
Sales
Income from continuing operations
Percent of sales
Average common shares and common-share equivalents (000s)
Diluted earnings per share from continuing operations
Dividends per share
Financial position at year-end
Working capital
Total assets
Long-term debt
Total shareholders’ equity
Ratios
Current
Long-term obligations to total invested capital
Return on average shareholders’ equity
from continuing operations
Market value per share at fiscal year-end
Other
Employees
Shareholders (registered)
Shares outstanding (000)
2006
$892,221
$ 97,667
11
34,180
$ 2.86
$ 0.67
$105,979
$822,890
$ 47,130
$430,528
1.44
0.26
26
$46.05
3,645
2,132
33,411
2005
$832,179
$ 84,510
10
36,527
$ 2.31
$ 61,642
$790,417
$101,420
$330,912
1.24
0.39
21
$37.32
3,653
2,249
32,911
(In thousands of dollars except for per-share amounts)
%
%
2007
$ 993,649
$ 90,692
9
34,182
$ 2.65
$ 0.70
$ 1,211,840
$ 22,840
$ 531,117
0.80
0.24
19
$53.50
4,089
2,049
33,710
%
%
%
%
$ 0.645
Five-Year Perspective
Sales(In Millions of Dollars)
Diluted Earnings Per Sharefrom Continuing Operations(In Dollars)
Nordson Corporation 1
$ (99,990)
Operating Profit(In Millions of Dollars)
0712542_text-04.qxp 1/9/08 12:03 PM Page 2

Fiscal year 2007 was another strong year for Nordson
Corporation. Demand for our products, systems and
services continued to grow, and the company posted record
revenue and operating income for the fourth consecutive
year. Highlights for the year included:
• Revenue grew to $993.6 million, an increase of 11.4
percent over 2006.
• Operating income grew to $152.1 million, an increase
of 3.0 percent over 2006.
• Full year diluted earnings per share were $2.65 as
compared to the prior year’s $2.86 from continuing
operations and $2.65 including discontinued operations.
Current year results were impacted by a charge for
short-term purchase accounting related to acquired
inventory while the previous year’s results benefited
from a non-recurring tax refund.
• Earnings before income tax, depreciation and amortization
(EBITDA) were $183.7 million compared to $169.9 million
a year ago, an increase of 8.1 percent. EBITDA per share
was $5.37 compared to $4.97 a year ago.
• The company completed a record four acquisitions that
added over $100 million of annual revenue, an annualized
increase of 11.5 percent.
• Cash flow from operations, less capital expenditures and
dividends, was $77.9 million or 7.8 percent of sales.
• Dividends to shareholders increased for the 44th con-
secutive year, ranking us among the top 16 U.S. publicly
traded companies with the longest-running record of
dividend increases.
Growing the Core
Nordson is committed to growing our business organically.
The company enjoys strong global market positions in
businesses that have good to excellent drivers for growth
with excellent profitability. Our strategy is to build upon
Nordson’s technological strengths, global distribution
capability and excellent cash flow by investing in the
development of new applications and the entry into new
market segments.
These growth initiatives include markets where
Nordson has historically not had a significant presence
but where we can bring value and enable productivity.
Examples range from such niche segments as bookbinding
or bottle labeling to entirely new end markets such as
medical products and flat panel displays. The leaders of
our business segments are charged to grow revenue from
new markets and applications, and compensation systems
are structured to encourage performance.
Letter to Shareholders
Adhesive Dispensing Systems Segment
• Operational ExcellenceThe Swainsboro, Georgia plant was named a finalist in Industry Week magazine’s annual Best Plant
in North America competition.
• Innovation Exciting new product introductions, such as the ProBlue® FulfillTM integrated adhesive filling system and
the MesaTM mid-tier piston pump melter, helped drive profitable organic growth.
• International GrowthStrong demand for products and services throughout Asia drove expansion of our production capabilities
in Shanghai.
2
Edward P. CampbellChairman, President and Chief Executive Officer
0712542_text-02.qxp 1/8/08 4:59 PM Page 3

In 2007, we had success in several of our new
application/market initiatives. These include:
• Integrated dispensing platforms used in the production
of LCD and organic LED displays;
• Dispensing systems used to manufacture dialysis filters;
• Electronic control systems that enable high-speed carton
manufacturing;
• High performance powder painting systems that enable
the quick changeover of paint colors during the manufac-
turing process;
• UV curing systems for digital inkjet-based commercial
printing systems;
• An expanding series of applications associated with
labeling and packaging; and
• Semiconductor packaging systems done at the wafer
level, among many others.
These growth opportunities as well as Nordson’s core
applications are supported by a steady stream of new
product introductions, and 2007 was a year of significant
progress in this area. In several businesses, important
new product lines were introduced that provide Nordson
customers with significant improvements in speed, accuracy
and productivity. These include the AltaBlueTM family of hot
melt systems aimed at the nonwovens industry, the Asymtek
S-900 series of dispensing platforms and a new generation
of our EFD brand dispensing components.
Adding to the Core
In addition to growing organically, Nordson is shaped and
supplemented by the acquisition of businesses and tech-
nologies. Because Nordson generates large amounts of
cash beyond working capital and capital expenditure needs,
we are able to invest in the acquisition of companies that
are market leaders in segments we have targeted. At the
same time, we follow disciplined criteria in terms of the
prices we are willing to pay and the returns we expect. Each
of the record four companies we acquired this year bring
Nordson strong market positions, high performance and
access to new end markets.
Dage is the global, market-leading provider of wire bond
and ball bond test equipment across both semiconductor
assembly and electronic circuit board assembly markets.
In recent years, through its innovative designs and superior
technology, Dage has rapidly become a leading provider
of x-ray inspection systems for these same markets.
YesTech broadens Nordson’s presence in x-ray inspec-
tion and adds to the Nordson portfolio a fast growing
product line of automated optical inspection systems for
electronic assembly end markets.
Picodostec brings Nordson high-performing piezo-
electronic jet dispensing technology. Piezoelectric actuation
technology takes Nordson’s jet dispensers to the next level
of demanding applications requiring improvements in speed,
precision and further reductions in droplet size.
TAH Industries expands Nordson’s position as a leading
supplier of disposable plastic dispensing components
through entry into the market for two-component mixers
and dispensers.
(continued next page)
Advanced Technology Systems Segment
• Strategic AcquisitionsFour acquisitions added more than $100 million in annualized profitable revenue and expanded our
reach into key markets.
• Customer Service Intel awarded Nordson Asymtek its prestigious Supplier Continuous Quality Improvement Award for
the fourth consecutive year.
• Market PenetrationLife science customers continued to rely on Nordson technologies in areas such as medical device
assembly as well as for newer applications such as dentistry.
Nordson Corporation 3
0712542_text-02.qxp 1/8/08 4:50 PM Page 4

These additions to the company should benefit signifi-
cantly from Nordson’s abilities to expand their distribution
networks globally, provide cross-prospecting sales opportu-
nities and provide other shared corporate services.
The Year Ahead
Our priorities for 2008 are focused upon realizing returns
on the investments we made in 2007. With major invest-
ments in new products and applications having been made
over the past two years, four acquisitions having been
completed in 2007, and the expectation for an improving
climate in Advanced Technology Systems markets, we
expect fiscal year 2008 will be a year of improved financial
performance. We will continue to look for strategic acquisi-
tion opportunities, develop new applications and markets
for our technologies, and implement Lean and other
operational initiatives.
In closing, I would like to note the retirement at the
end of calendar year 2007 of Nordson President and Chief
Financial and Administrative Officer Peter Hellman. During
the relatively short eight years Peter was with Nordson,
he had a major and lasting impact on
our strategy and performance. On
behalf of the shareholders and employ-
ees, I thank him for his leadership and
many contributions, and wish him
and his family every happiness and
success in his retirement.
As previously announced, we have ensured a smooth
transition by promoting former Corporate Controller and
Chief Accounting Officer Gregory Thaxton to the position
of Vice President, Chief Financial Officer. We have and will
continue to build and shape a strong and experienced
management team that is well prepared to lead this com-
pany into the future.
I also want to thank Nordson’s employees around the
world. Your hard work and dedication continue to be the
underlying driver of our success. You should be proud that
you have made Nordson the outstanding and successful
company it is. It is an honor to be associated with all of you.
Finally, I want to thank Nordson’s shareholders for their
continuing belief and investments in this company. I am
confident that the actions we have taken and the strategies
we are pursuing will produce continuing profitable growth
in 2008 and beyond.
Sincerely,
Edward P. CampbellChairman, President and Chief Executive Officer
Industrial Coating and Automotive Systems Segment
• LeanContinued emphasis on Lean techniques and waste removal from value streams helped drive
improved profitability.
• GlobalizationWe expanded our presence in Eastern Europe and China to capture more of these growing markets.
• Customer ServiceSelling channels were focused to better meet the specific needs of liquid, powder, container and
automotive customers.
4
Peter S. Hellman
0712542_text-02.qxp 1/8/08 4:59 PM Page 5

Financial Focus
Benefiting from our continuing focus on profitable growth
from new markets and applications, 2007 was another year
of strong financial performance for Nordson. During the
year we posted record revenues and operating profit while
completing four acquisitions. These acquisitions add over
$100 million of annual revenue and provide market leading
positions, as well as new technology to our portfolio.
Sales for the year increased 11 percent to a record
$993.6 million, as we experienced growth in every business
segment and every geographic region. This year’s financial
Gregory A. ThaxtonVice President,
Chief Financial Officer
Worldwide Sales by Segment
Adhesive Dispensing Systems(In Millions of Dollars)
Advanced Technology Systems(In Millions of Dollars)
Industrial Coating and Automotive Systems(In Millions of Dollars)
Nordson Corporation 5
performance was impacted by acquisition accounting
charges, most of which are short term and will not impact
2008 results. Inclusive of these charges, operating profit
was a record $152 million for the year.
Our ability to complete these acquisitions was made
possible by our continued strong operating cash flow. For
the year, free cash flow after capital expenditures and
dividends was $78 million. Even with these recent acquisi-
tions, our balance sheet remained strong as we ended the
year with a debt to capital ratio of 40 percent.
Our strong cash flow and capital structure also enabled
our board of directors to raise Nordson’s dividend for the
44th consecutive year, ranking us among only 16 U.S. com-
panies to have achieved such an accomplishment.
In addition to growing the company, we have continued
our efforts to manage our cost structure using Lean princi-
ples. We will continue to deploy Lean in both our core and
newly acquired businesses.
We are optimistic that 2008 will be another year of
strong financial performance. Our ability to provide customers
with highly engineered products and systems that are
supported by a global service network should continue to
generate a significant competitive advantage.
0712542_text-02.qxp 1/8/08 4:50 PM Page 6

Successful companies are built on a solid foundation – a set of core competencies that provide both internal strength
and external value to customers and shareholders alike. At Nordson Corporation, our roots are firmly planted in
technologies that dispense materials for countless industrial applications. From the high-speed needs of the packaging
and nonwovens industries to the high-precision demands of electronics and life sciences, manufacturers worldwide
rely on Nordson dispensing systems to improve productivity and profitability in their operations.
Over the years, Nordson has strategically expanded upon its dispensing capabilities – developing new products,
acquiring new technologies and breaking into new geographies that complement our core. Carefully evaluating each
opportunity, Nordson leverages common customers, adjacent technologies and familiar industry segments to build
synergies across the company that will propel growth.
Expanding from the Core
By continuing to expand our capabilitiesin ways that make sense – to our businesses, our customers and ourshareholders – Nordson becomes morethan just a step in the manufacturingprocess.
6
Nordson application
specialists work with
customers to find ways
to meet their specific
needs. Whether it’s quick
color change to meet
growing market demands
or the ability to recycle
material, our systems offer
appliance and office
furniture manufacturers
integrated coating solutions
in a Lean cell environment.
We’ve embraced this strategy since our earliest days when we expanded our first airless
liquid spray systems into technologies for dispensing adhesives. From there, Nordson
evolved its expertise into systems for dispensing powder coatings and other materials.
Since then, we have expanded our core competencies to include technologies that go
beyond material dispensing – but are in similar process streams – such as plasma surface
treatment and UV curing.
Today, Nordson uses its knowledge of manufacturing processes to offer more
than just dispensing or curing. With more than 50 years of problem solving experience,
Nordson is a valuable resource that understands its customers’ process challenges and can design entire system
solutions to overcome them. As a true production partner, Nordson enables manufacturers to continually find new ways
to run smarter, faster and more cost-effectively.
Building relationships, defining value
By continuing to expand our capabilities in ways that make sense – to our businesses, our customers and our share-
holders – Nordson becomes more than just a step in the manufacturing process. We help define the process by under-
standing ever-changing customer needs and meeting them with solutions that exceed expectations.
An excellent example of this is in the powder coating industry, where Nordson is helping appliance and office
furniture manufacturers meet market demands for color variation and Lean processing. By adapting earlier generations
of coatings technology, Nordson has developed two systems that help meet ambitious color change goals in a Lean
cell environment.
0712542_text-04.qxp 1/9/08 1:38 PM Page 7

Nordson Corporation 7
Appliance manufacturers savetime and money by switchingpaint colors in just 10 minutesusing Nordson’s powder spraybooth technology.
0712542_text-02.qxp 1/8/08 4:50 PM Page 8

8
Electronics manufacturers use Nordson’s Asymtek jettingtechnology to continually make their products smaller and lighter.
0712542_text-02.qxp 1/8/08 4:59 PM Page 9
The Prodigy® Color-on-Demand® Instant Color Selector is a spray-to-
waste system that can facilitate a 20-second color change – an industry first;
the ColorMax® System offers reclaim capability, but can still turn colors in just
10 minutes. Using patented nVision™ tools, Nordson helps customers choose the
best system for their needs, calculating the costs of downtime, material and the
number of daily color changes. On average, these advanced Nordson systems can
offer productivity increases up to 20 percent, while easily adapting to a lean cell
environment. As a result, customers achieve an integrated solution to all their
needs – fast color change, precision dispensing and minimal inventory.
By working directly with customers in their local markets – wherever they
may be – Nordson keeps close tabs on the next generation product requirements.
With key insights and expertise, we continue to develop cutting-edge products that
meet specific customer challenges as well as the future needs of entire industries.
This unique perspective allows Nordson to bring a constant stream of solutions to our customers, another core
capability that adds value at every step of the relationship.
Growing our market opportunities
Today, Nordson works with an increasingly diverse group of customers, where our systems are key to the
production of thousands of products – from circuit boards and beverage containers to windows and pacemakers.
Although we seek opportunities to expand our core capabilities in many respects, advanced technology continues
to be our fastest growing market segment.
In fiscal 2007, Nordson completed four strategic acquisitions that are highly complementary to our existing
product lines in the electronics and life sciences industries. These acquisitions will help us fill strategic gaps in our
product portfolio, augmenting our technical reach and providing new platforms for growth and increased revenue.
In the electronics industry, we pioneered the art of jetting with products that dispense fluids for the
assembly of cellular phones, laptop computers and digital cameras at speeds of 200 dots per second. We also
achieve ultra-fast speeds when dispensing adhesives and nonwovens materials during the assembly of disposable
diapers or food packaging, where line speeds can run up to 120,000 boxes per hour.
Picodostec, acquired in May 2007, complements these high-speed, precision dispensing applications by
using piezoelectric technology to achieve even faster dispense rates at the highest accuracy. As a result, Nordson
becomes even more capable to serve customers in this market, with opportunities for growth in many applications,
including surface mount adhesives and solder paste. We also see attractive opportunities to leverage Picodostec’s
high-speed technology across Nordson’s Adhesive Dispensing and Industrial Coating segments.
Another fast-growing advanced technology market is life sciences. Here, where cleanliness, quality
and precision are critical, Nordson acquired TAH Industries in August 2007 to supplement the already strong
In the electronics
industry, our Asymtek
and Picodostec
products provide
complementary high-
speed dispensing
technologies that make
Nordson one of the
strongest players in
the assembly of printed
circuit boards and
semiconductors.
In fiscal 2007, Nordson completed four strategicacquisitions that are highly complementary to our existing businesses in the electronics and life sciences industries.
Nordson Corporation 9
0712542_text-02.qxp 1/8/08 4:50 PM Page 10

presence of our Asymtek, EFD and March Plasma product lines in this market. Our systems are currently used for
the assembly of medical devices – like catheters and pacemakers – as well as to dispense diagnostic material on
diabetic test strips and to clean medical stents before they are surgically implanted.
Building on these core capabilities, TAH Industries will open opportunities for two-component dispensing
in life sciences. TAH offers a meter-mix cartridge – the u-TAH™ nano – which is used by dentists in filling crowns,
molding teeth and performing root canals. This breakthrough technology simplifies application, eliminates waste
and ensures sterility by delivering two-component material in a single-use dose. With the ability to now provide
two-component dispensing to life sciences – and to the dental industry specifically – Nordson can penetrate the
market in new ways to drive future growth.
Expanding our capabilities, strengthening our core
Nordson is also finding new ways to approach the high-growth electronics market,
capitalizing on opportunities to offer customers additional processing capabilities.
Through Dage and YesTech – acquired in December 2006 and May 2007, respectively –
Nordson is now a leading provider of test and measurement equipment used in semi-
conductor and printed circuit board manufacturing.
With experience in inspection and verification systems for high-speed packaging
and container lines, Nordson clearly understands the value of these services to customers.
During the manufacture of folding cartons that package food and beverages, for example,
Nordson’s LogiComm® Verification System sets the standard for in-line inspection.
Here, more than 100,000 boxes are produced per hour, and a single defective piece can
bring production to a halt. The LogiComm system allows manufacturers to automatically
eject faulty boxes from the production line, whether the defect is due to misplaced
adhesive, incorrect die cuts or poor printing of color.
10
Nordson is also finding new ways to approach thehigh-growth electronics market to offer customersadditional processing capabilities.
The acquisition of
TAH Industries allows
Nordson to expand its
capabilities in the life
sciences industry. With
innovative two-compo-
nent dispensing tech-
nologies in nano sizes,
TAH brings opportunities
to penetrate this growing
market in new ways.
The container industry faces similar challenges, where high-speed lines produce up to 3,000 cans per
minute. Manufacturers routinely use Nordson equipment to monitor the process of spraying a protective coating
into can interiors. Our Spray Pressure Control, CanWorks® iTrax™, Ink-Dot Identification and c-Scan™ mapping
film gauge systems all help container manufacturers identify the source of improperly coated cans, ensuring high
quality and efficient production.
The acquisition of Dage and YesTech significantly enhances Nordson’s opportunity to launch similar
applications for electronics customers. With these two product lines, Nordson can offer manufacturers a full range
of bond testing, automated optical inspection and digital x-ray inspection services. We now broaden the entire
scope of technologies we bring our customers – from surface treatment and fluid dispensing to inspection – and
can leverage relationships common among our high-tech product teams. As a result, Nordson is capitalizing on the
synergies across Asymtek, March, Dage and YesTech, further promoting our vision to be a single-source supplier
to customers in the semiconductor and printed circuit board industries.
0712542_text-02.qxp 1/8/08 4:59 PM Page 11

Nordson Corporation 11
Nordson TAH products provide dentistswith breakthrough technology thatmakes filling crowns and molding teetheasier, cleaner and more efficient.
0712542_text-02.qxp 1/8/08 4:50 PM Page 12

Nordson helps package the 65 billion noodle packsmanufactured worldwide each year.
12
0712542_text-02.qxp 1/8/08 4:59 PM Page 13

Nordson continues to expand on our corecapabilities, serving our customers andshareholders today with more technologiesin more markets than ever before.
Nordson Corporation 13
Broadening our geographic reach
Nordson acquires good companies with an eye toward making them even better. Our ability to quickly take their
technologies global – accelerating growth and revenue – is another of Nordson’s core capabilities.
Since our inception, Nordson has made international business an integral part of our strategy. With direct
operations in nearly every industrialized country, our business is truly global in scope. In fact, more than two-thirds of
Nordson’s annual revenues are generated outside the United States, reflecting an organization that develops products
responsive to a world market and supports them with international service and marketing expertise.
An excellent example of our ability to meet local needs is in China. The opportunities today in this market
are undeniable, as China continues to be the fastest-growing manufacturing area in the world. Domestic and
export business is exploding for both local manufacturers and multinational companies located in China, offering
huge growth potential for Nordson.
Established in China for nearly 15 years, Nordson holds a strong presence in the market. To stay
competitive, Nordson expanded its capabilities, offering products with feature sets that meet the unique require-
ments of the market.
• The new MesaTM adhesive melter, for example, is used by noodle manufacturers to
help package the nearly 65 billion noodle packs consumed worldwide each year.
• The AltaBlueTM adhesive melter is ideal for nonwovens manufacturers who produce
disposable diapers and feminine hygiene products.
• In powder coating, the RediCoatTM manual system provides basic finishing capabilities
for various applications, including wood cabinets and automotive parts.
These products provide the right level of durability and reliability required by the
market, all at a cost-of-ownership that is attractive to mid-tier Chinese manufacturers. As
a result, Nordson is extremely well-positioned to grow with the needs of our customers –
a strategy that is helping us achieve long-term growth objectives not only in China, but in
other emerging markets.
This is an exciting time for Nordson. We are continuing to expand on our core
capabilities, serving our customers today with more technologies in more markets than
ever before. Our proven ability to adapt and embrace new opportunities is an essential
part of our long history and positions Nordson to deliver profitable growth and global competitiveness. As a
result, Nordson has accelerated its status as a diversified manufacturing partner, while staying true to our core
competencies and making them stronger.
To stay competitive in
the explosive Chinese
market, Nordson
developed several new
products – including
the AltaBlueTM adhesive
melter and the RediCoatTM
powder spray booth –
with feature sets
that meet the unique
needs of the region’s
manufacturers.
0712542_text-03.qxp 1/8/08 9:58 PM Page 14
14
Business Profile
John J. KeaneSenior Vice President,
Adhesive Dispensing Systems
Gregory P. MerkVice President,
Pacific South Division
Douglas C. BloomfieldVice President,
Industrial Coating and
Automotive Systems
Robert A. Dunn Jr.Senior Vice President,
Advanced Technology Systems
Michael GroosVice President,
Adhesive Dispensing Systems
Peter G. LambertVice President,
Advanced Technology Systems
Pow
der C
oatin
g
Executive Officers
Robert E. VeilletteVice President,
General Counsel and Secretary
Bruce H. FieldsVice President,
Human Resources
Shelly M. PeetVice President,
Chief Information Officer
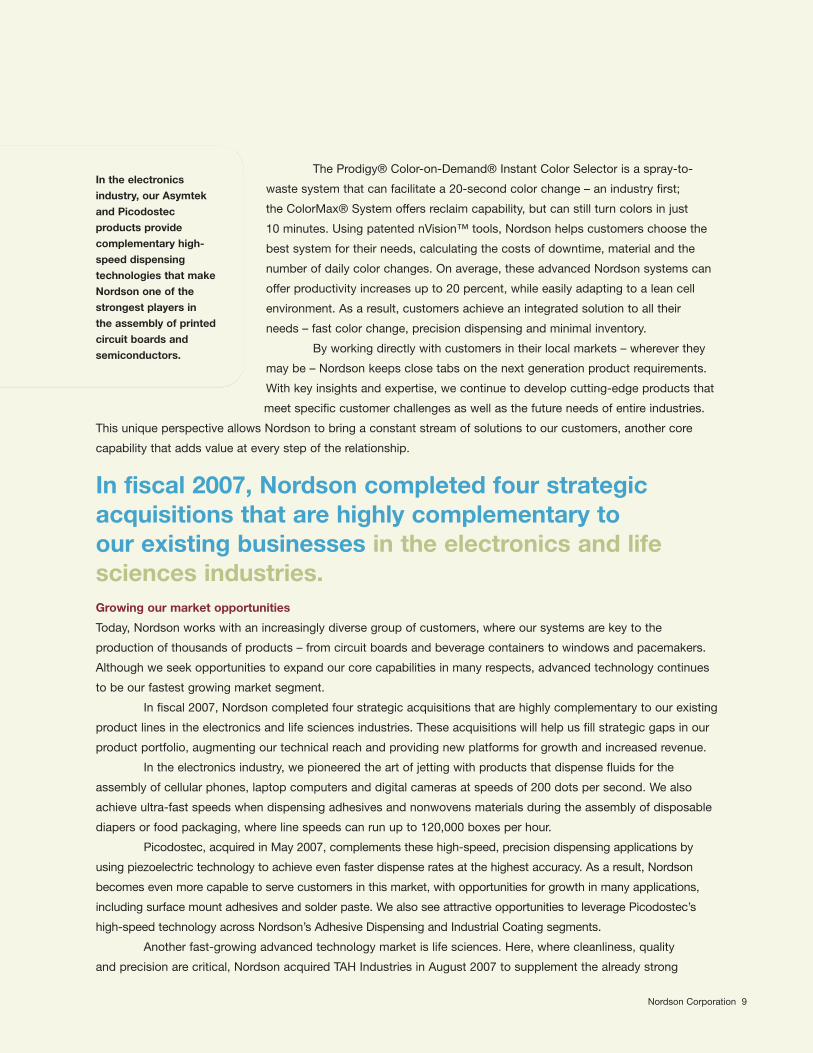
Fiscal 2007 Worldwide Salesby Business Segment
Nonw
oven
Sys
tem
sPi
codo
stec
Dage
M
arch
Pla
sma
Syst
ems
EFD
Asym
tek
Adhesive Dispensing Systems
51.3%
Advanced Technology Systems
30.3%
Industrial Coating and AutomotiveSystems
18.4%
0712542_text-02.qxp 1/8/08 5:00 PM Page 15

Nordson Corporation 15
Adhesive Dispensing Systems
Advanced TechnologySystems
Industrial Coating and Automotive Systems
Segment Product Line Solution Key Markets
Nonwoven Systems Material Application • Adult incontinence products • Feminine hygiene productsTesting and Inspection • Baby diapers and child • Surgical drapes, gowns,
training pants shoe covers and face masks
Packaging Systems Material Application • Beverage containers • Paperboard cartonsTesting and Inspection • Food containers
Paper and Paperboard Material Application • Bookbinding • Folding cartons Converting • Envelopes • Paper and plastic bags
and sacks
Product Assembly Material Application • Appliances • ElectronicsSystems • Automotive components • Furniture
• Building and construction materials
Web Coating Systems Material Application • Carpet • TapesSurface Treatment • Labels • Textiles
Asymtek Material Application • Liquid crystal displays (LCD) • Mobile phones• Micro disc hard drives • Printed circuit board assemblies• Microprocessors • RFID tags
Dage Test and Inspection • Digital music players • Printed circuit board assemblies• Electronics • Semiconductor packages• Mobile phones
EFD Material Application • Automotive • Industrial assemblies• CDs and DVDs • Life sciences• Consumer goods • Medical devices• Electronics • Photovoltaics
March Plasma Systems Surface Preparation • Contact lenses • Printed circuit boards• Electronics • Semiconductors• Medical instruments and devices
Picodostec Material Application • Automotive • Food• Chemical • Life Sciences• Electronics • Packaging
TAH Industries Material Application • Aerospace • Do It Yourself (DIY)• Automotive • Food• Construction • Marine• Dental • Life Sciences
UV Curing and Drying Surface Treatment • Electronics • Printed paper and packaging• Graphic arts • Wood and medium-density • Plastic containers fiberboard (MDF)
YesTech Test and Inspection • Digital music players • Printed circuit board assemblies• Electronics • Semiconductor packages• Mobile phones
Automotive Systems Material Application • Automotive lighting assembly • Powertrain components• Body assembly • Windshield attachment
Container Coating Material Application • Batteries • Food cansand Curing Test and Inspection • Beverage containers
Liquid Finishing Material Application • Automotive components • Wood doors and cabinets• Decorative hardware • Wood molding• Industrial drums
Powder Coating Material Application • Agriculture and construction • Home and office furnitureSystems equipment • Lawn and garden equipment
• Appliances • Wood and metal shelving• Automotive components
0712542_text-04.qxp 1/9/08 2:25 PM Page 16

With Nordson employees in 30 countries, our customers receive the same quality, service and training they’ve come to expectno matter where they are.
Worldwide Operations
16
World Headquarters
Nordson Corporation28601 Clemens RoadWestlake, Ohio 44145
Direct U.S. Operations
Nordson CorporationAutomotive Systems GroupRochester Hills, Michigan
Nordson CorporationIndustrial Coating and Automotive SystemsAmherst, Ohio
Nordson CorporationUV Systems GroupAmherst, Ohio
Nordson CorporationAdhesive Dispensing SystemsDawsonville, GeorgiaDuluth, GeorgiaNorcross, GeorgiaSwainsboro, Georgia
AsymtekCarlsbad, California
Dage Holdings, Ltd.Fremont, California
EFD, Inc.East Providence, Rhode Island
Horizon Lamps, Inc.Easton, Pennsylvania
March Plasma Systems, Inc.Concord, California
March Plasma Systems, Inc.St. Petersburg, Florida
TAH IndustriesRobbinsville, New Jersey
YesTechSan Clemente, California
0712542_text-02.qxp 1/8/08 5:00 PM Page 17

Direct International Operations
AustraliaNordson Australia Pty. Ltd.Sydney – Main OfficeAdelaideBrisbaneMelbournePerth
AustriaNordson GmbHWien, Austria
BrazilNordson do BrasilIndustria é Comercio Ltda.São Paulo
CanadaNordson Canada Ltd.Toronto, Ontario – Main OfficeLaval, Quebec
ChinaNordson (China) Co. Ltd.Shanghai – Main OfficeBeijingGuangzhou
Dage Trading (Suzhou) Co. Ltd.Suzhou
ColombiaNordson Andina Ltda.Envigado
Czech RepublicNordson CS spol.s.r.o.Brno
EFD International, Inc.Prague
DenmarkNordson Danmark A/SCopenhagen
FinlandNordson Finland OyHelsinki
FranceNordson France S.A.S.Lagny Sur Marne
Dosage 2000 s.a.r.l. (EFD)Bougival
GermanyNordson Deutschland GmbHErkrath
Nordson Engineering GmbHNordson Global UV SolutionsLüneburg
Dage Semiconductor GmbHKirchheim unter Teck
Picodostec GmbHMunich
Hong KongNordson Application Equipment Inc.New Territories
IndiaNordson India Private Ltd.BangaloreNew DelhiPune
ItalyNordson Italia S.p.A.EFD International Inc.Milan
JapanNordson K.K.Nordson Asymtek K.K.Tokyo
Nordson K.K.HiroshimaKyushuNagoyaNorth-KantoOsakaShizuokaTakamatsuTohoku
Dage ArctekChiba
MalaysiaNordson (Malaysia) Sdn. Bhd.Selangor – Main OfficePinang
EFD Inc.Pulau Pinang
MéxicoNordson de México S.A. de C.V.México City – Main OfficeGuadalajaraMonterreyQueretaro
NetherlandsNordson Benelux B.V.Udenhout
Nordson B.V.Distribution B.V.EFD International Inc.Maastricht
New ZealandNordson New ZealandAucklandChristchurchWellington
NorwayNordson Norge A/SRud
PolandNordson Polska Sp.z.o.o.Warsaw
PortugalNordson PortugalEquipamento Industrial Lda.Porto
EFD International Inc.Nogueira da Maia
RussiaNordson Deutschland GmbHRepresentative OfficeSt. Petersburg
SingaporeNordson S.E. Asia (Pte.) Ltd.Dage (SE Asia) Pte. Ltd.
EFD International Inc.Singapore
South KoreaNordson Sang San Ltd.Seoul
SpainNordson Iberica S.A.EFD International, Inc.Valencia
SwedenNordson ABMalmö
SwitzerlandNordson Schweiz A.G.Münchenstein
United KingdomNordson U.K. Ltd.Oxfordshire, EnglandStockport, England
Nordson UV Ltd.Primarc LimitedSlough, England
Dage Holdings Ltd.Aylesbury, England
EFD International, Inc.Dunstable, England
TAH Europe, Inc.Rushden, England
Nordson Corporation 17
0712542_text-02.qxp 1/8/08 4:51 PM Page 18

18
Corporate Purpose
Nordson Corporation strives to be a vital, self-renewing,
worldwide organization which, within the framework
of ethical behavior and enlightened citizenship, grows
and produces wealth for our customers, employees,
shareholders and communities.
Corporate Goals
Nordson operates for the purpose of creating balanced,
long-term benefits for all of our constituencies: customers,
employees, shareholders and communities.
Our corporate goal for growth is to double the value
of the company over a five-year period, with the primary
measure of value set by the market for company shares.
While external factors may impact value, the
achievement of this goal will rest with earnings growth,
capital and human resource efficiency and positioning
for the future.
Nordson does not expect every quarter to produce
increased sales, earnings and earnings per share, or
to exceed the comparative prior year’s quarter. We
do expect to produce long-term gains. When short-
term swings occur, we do not intend to alter our basic
objectives in efforts to mitigate the impact of these
natural occurrences.
Growth is achieved by seizing opportunities with
existing products and markets, investing in systems to
maximize productivity and pursuing growth markets. This
strategy is augmented through product line additions,
engineering, research and development, and acquisition
of companies that can serve multinational industrial
markets.
Customers
We create benefits for our customers through a Package
of Values®, which includes carefully engineered, durable
products; strong service support; the backing of a
well-established worldwide company with financial and
technical strengths; and a corporate commitment to
deliver what was promised.
We strive to provide genuine customer satisfaction;
it is the foundation upon which we continue to build our
business.
Employees
Complementing our business strategy is the objective
to provide opportunities for employee self-fulfillment,
growth, security, recognition and equitable compensation.
This goal is met through Human Resources’
facilitation of employee training and leadership training
and the creation of on-the-job growth opportunities. The
result is a highly qualified and professional management
team capable of meeting corporate objectives.
We recognize the value of employee participation
in the planning process. Strategic and operating plans
are developed by all business units and divisions, resulting
in a sense of ownership and commitment on the part of
employees in accomplishing company objectives.
Nordson Corporation is an equal opportunity employer.
Communities
Nordson is committed to contributing an average of
5 percent of domestic pretax earnings to support
charitable activities, particularly in communities where
the company has major facilities.
Since our founding, Nordson has held the belief
that business, as a corporate citizen, has a social
responsibility to share its success with the communities
in which it operates and its employees live. With this
operating philosophy, in 2007, Nordson contributed
nearly $1.75 million to nonprofit organizations operating
in the areas of education, civic affairs, human welfare
and arts and culture.
Our employees also showed their community
commitment by volunteering through Nordson’s
Time ‘n Talent program. In 2007, employees spent
nearly 6,000 hours strengthening their communities
and supporting individuals and families in need.
Corporate Philosophy
0712542_text-02.qxp 1/8/08 5:00 PM Page 19

Edward P. CampbellChairman, Presidentand Chief Executive OfficerNordson Corporation
William D. GinnRetired Partner,Thompson Hine LLP
David W. IgnatConsulting Physicist
William P. MadarRetired Chairman and Chief Executive Officer,Nordson Corporation
William L. RobinsonDistinguished Professor of Law,University of the District of Columbia’s David A. ClarkeSchool of Law
Nordson Corporation 19
Board of Directors Executive Management
William W. ColvilleLegal Consultant
Stephen R. HardisRetired Chairman and Chief Executive Officer,Eaton Corporation
Joseph P. KeithleyChairman, President and Chief Executive Officer,Keithley Instruments, Inc.
Mary G. PumaChairman and Chief Executive Officer,Axcelis Technologies, Inc.
Benedict P. RosenChairman, AVX Corporation
Eric T. NordChairman Emeritus
Executive Officers
Edward P. CampbellChairman, Presidentand Chief Executive Officer
Douglas C. BloomfieldVice President,Industrial Coating and Automotive Systems
Robert A. Dunn Jr.Senior Vice President,Advanced Technology Systems
Bruce H. FieldsVice President,Human Resources
Michael GroosVice President,Adhesive Dispensing Systems
John J. KeaneSenior Vice President, Adhesive Dispensing Systems
Peter G. LambertVice President,Advanced Technology Systems
Gregory P. MerkVice President,Pacific South Division
Shelly M. PeetVice President, Chief Information Officer
Gregory A. ThaxtonVice President, Chief Financial Officer
Robert E. VeilletteVice President, General Counsel and Secretary
Corporate Management
Beverly J. CoenChief Tax and Risk Officer
Raymond L. CushingTreasurer
John C. DillonDirector, Supply Chain Management
Indrani G. EglestonDirector, Internal Audit
James R. JayeDirector, Corporate Communications
J. Bradford LeaheeyAssistant General Counsel
John M. RatermanDirector, Corporate Development
Business Management
Adhesive Dispensing SystemsJames E. DeVriesVice President, Global Operations
Jeffrey A. PembrokeVice President, Sales and Marketing
AsymtekAlec J. BabiarzPresident, Business Development
John P. ByersPresident
DageGeraint ReesChief Executive Officer
Industrial Coating and Automotive SystemsHerman E. Turner Jr.Vice President, Engineering andOperations
Stephen M. SmithVice President, Sales
March Plasma SystemsPeter F. BierhuisPresident
Nordson UVJames W. AinsworthManaging Director
PicodostecRainer MöstManaging Director
Michael Rennefeld Managing Director
TAH IndustriesKen A. JacobsPresident
YesTechDonald MillerPresident
Europe Management
Patrice BoyerVice President, Southern and Western Regions
Andre P.M. de VeerVice President,Finishing, Europe
Axel WenzVice President, Central, Northern and Eastern Regions
Japan Management
Shigeru KobayashiPresident, Nordson K.K.
Masafumi MatsunagaSenior Executive Director, Business Development
Pacific South Management
Bradley C. DavisGroup Vice President, Asia Pacific Group
0712542_text-03.qxp 1/8/08 9:57 PM Page 20
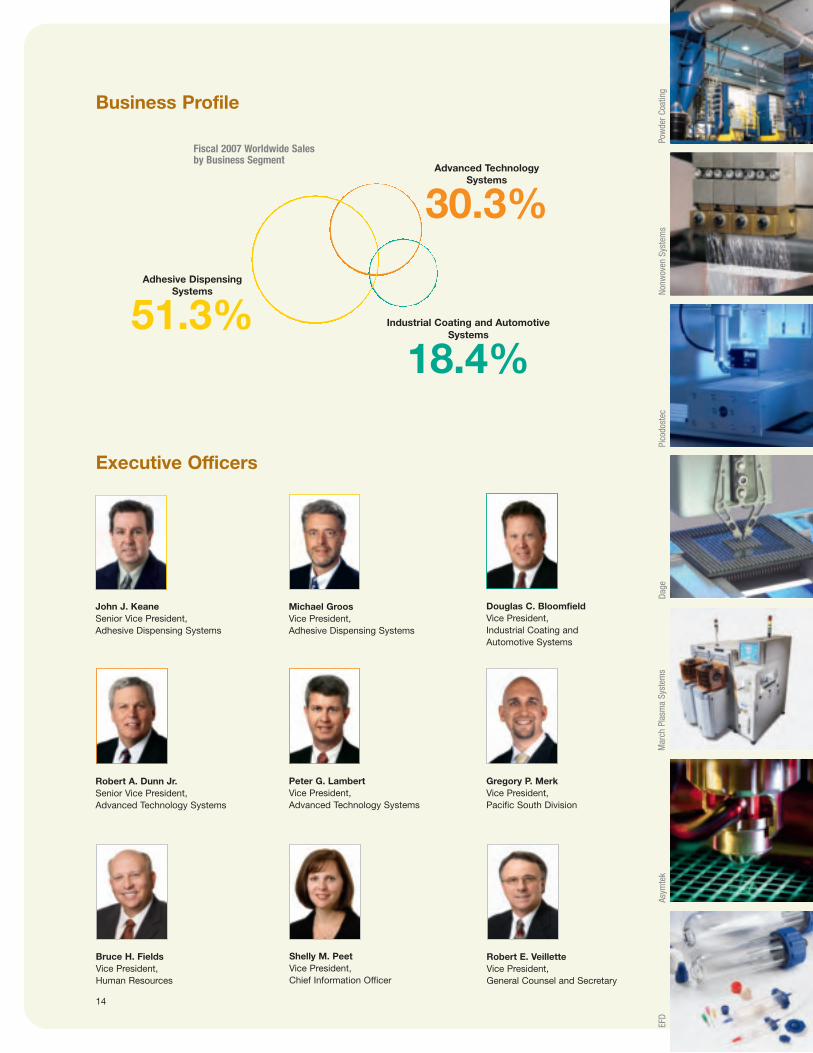
2007 2006 2005
(In thousands except for per-share amounts)
Operating Data (a)
Sales $ 993,649 892,221 832,179
Cost of sales $ 439,804 379,800 362,824
% of sales 44 43 44
Selling and administrative expenses $ 401,294 362,179 337,782
% of sales 40 41 41
Severance and restructuring costs $ 409 2,627 875
Operating profit $ 152,142 147,615 130,698
% of sales 15 17 16
Net income from continuing operations $ 90,692 97,667 84,510
% of sales 9 11 10
Net income $ 90,692 90,598 78,338
% of sales 9 10 9
Financial Data (a)
Working capital 105,979 61,642
Net property, plant and equipment and other non-current assets $ 801,916 475,586 476,810
Total invested capital $ 701,926 581,565 538,452
Total assets $1,211,840 822,890 790,417
Long-term obligations $ 170,809 151,037 207,540
Shareholders’ equity $ 531,117 430,528 330,912
Return on average invested capital - % (b) 17 20 16
Return on average shareholders’ equity - % (c) 19 26 21
Per-Share Data (a) (d)
Basic earnings per share from continuing operations $ 2.70 2.93 2.37
Diluted earnings per share from continuing operations $ 2.65 2.86 2.31
Diluted earnings per share $ 2.65 2.65 2.14
Dividends per common share $ 0.70 0.67 0.645
Book value per common share $ 15.76 12.89 10.05
Average common shares 33,547 33,365 35,718
Average common shares and common-share equivalents 34,182 34,180 36,527
20
Eleven-Year Summary
(a) See accompanying Notes to Consolidated Financial Statements.
(b) Net income from continuing operations plus interest on long-term liabilities net of income taxes, as a percentage of total assets less
current liabilities.
(c) Net income from continuing operations as a percentage of shareholders’ equity.
2006 2005
$ (99,990)
0712542_text-02.qxp 1/8/08 5:00 PM Page 21

2004 2003(f) 20e2 2001 2000 1999 1998(f) 1997
771,450 659,616 627,619 705,954 728,792 685,312 660,871 636,710
334,302 291,297 294,149 317,652 325,232 307,688 303,667 276,425
43 44 47 45 45 45 46 43
318,562 286,900 273,139 315,622 303,579 297,742 285,833 286,226
41 43 44 45 42 43 43 45
- 2,028 2,499 13,355 8,960 3,000 11,738 -
118,586 79,391 57,832 59,325 91,021 76,882 45,332 74,059
15 12 9 8 12 11 7 12
68,307 41,807 25,008 24,512 54,338 47,460 20,985 49,967
9 6 4 3 7 7 3 8
63,334 35,160 22,072 24,610 54,632 47,506 20,825 49,967
8 5 4 3 7 7 3 8
167,362 65,708 21,926 6,524 116,230 89,376 121,394 139,152
476,276 489,436 489,899 500,276 240,802 250,474 210,468 184,181
643,638 555,144 511,825 506,800 357,032 339,850 331,862 323,333
840,548 766,806 764,472 862,453 610,040 591,790 538,944 502,996
240,305 255,035 242,935 243,074 109,809 118,452 117,087 102,788
403,333 300,109 268,890 263,726 247,223 221,398 214,775 220,545
14 8 5 5 16 14 8 18
19 15 9 10 25 22 10 22
1.92 1.24 0.75 0.75 1.67 1.44 0.63 1.45
1.87 1.23 0.74 0.74 1.66 1.42 0.63 1.42
1.73 1.04 0.66 0.74 1.67 1.42 0.62 1.42
0.625 0.605 0.57 0.56 0.52 0.48 0.44 0.40
11.12 8.82 8.00 7.96 7.62 6.76 6.42 6.55
35,489 33,703 33,383 32,727 32,455 33,048 33,084 34,552
36,546 33,899 33,690 33,050 32,767 33,484 33,322 35,106
Nordson Corporation 21
(d) Amounts adjusted for 2-for-1 stock split effective September 12, 2000.
(e) 2002 includes an inventory write-down of $11.4 million, which is included in cost of sales.
(f) 1998 includes a pretax charge of $6.9 million related to inventory valuations, which is recorded in cost of sales. 1998 also includes a pretax charge
of $14.3 million for the portion of the purchase price paid for JM Laboratories Inc. attributable to in-process research and development.
2003 2002(e)2004
0712542_text-02.qxp 1/8/08 4:51 PM Page 22
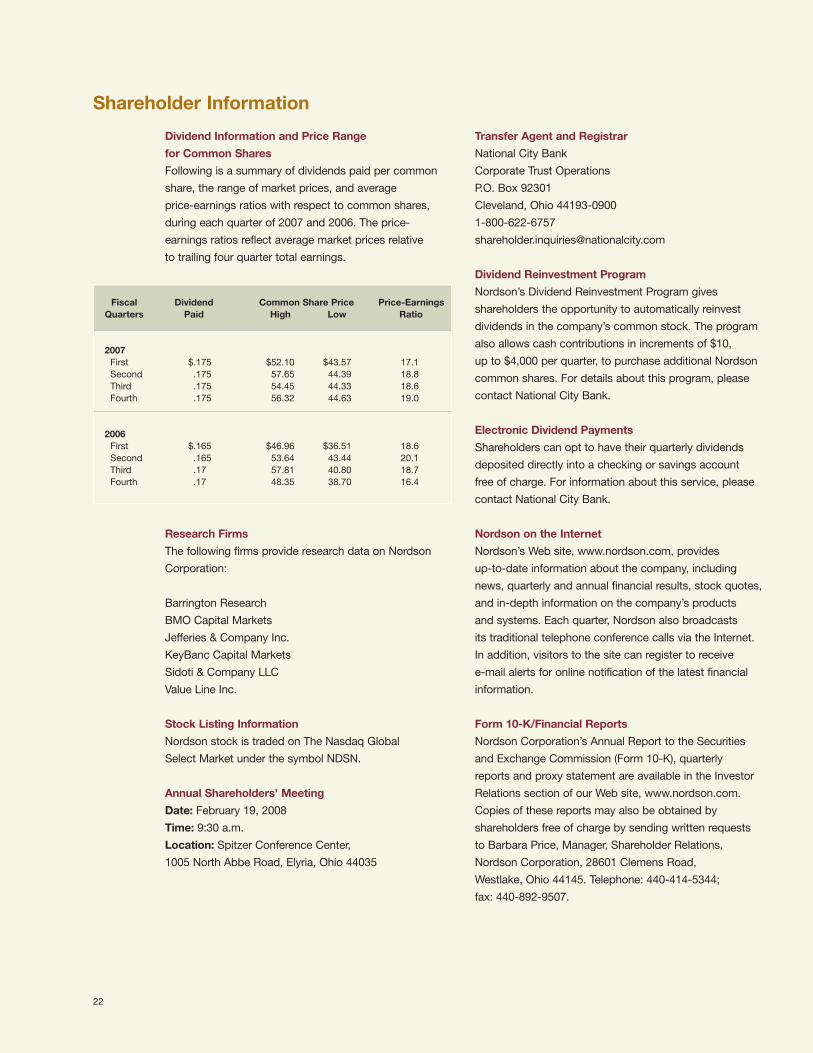
Fiscal Dividend Common Share Price Price-EarningsQuarters Paid High Low Ratio
2007First $.175 $52.10 $43.57 17.1
Second .175 57.65 44.39 18.8
Third .175 54.45 44.33 18.6
Fourth .175 56.32 44.63 19.0
2006First $.165 $46.96 $36.51 18.6
Second .165 53.64 43.44 20.1
Third .17 57.81 40.80 18.7
Fourth .17 48.35 38.70 16.4
22
Shareholder Information
Dividend Information and Price Range
for Common Shares
Following is a summary of dividends paid per common
share, the range of market prices, and average
price-earnings ratios with respect to common shares,
during each quarter of 2007 and 2006. The price-
earnings ratios reflect average market prices relative
to trailing four quarter total earnings.
Research Firms
The following firms provide research data on Nordson
Corporation:
Barrington Research
BMO Capital Markets
Jefferies & Company Inc.
KeyBanc Capital Markets
Sidoti & Company LLC
Value Line Inc.
Stock Listing Information
Nordson stock is traded on The Nasdaq Global
Select Market under the symbol NDSN.
Annual Shareholders’ Meeting
Date: February 19, 2008
Time: 9:30 a.m.
Location: Spitzer Conference Center,
1005 North Abbe Road, Elyria, Ohio 44035
Transfer Agent and Registrar
National City Bank
Corporate Trust Operations
P.O. Box 92301
Cleveland, Ohio 44193-0900
1-800-622-6757
Dividend Reinvestment Program
Nordson’s Dividend Reinvestment Program gives
shareholders the opportunity to automatically reinvest
dividends in the company’s common stock. The program
also allows cash contributions in increments of $10,
up to $4,000 per quarter, to purchase additional Nordson
common shares. For details about this program, please
contact National City Bank.
Electronic Dividend Payments
Shareholders can opt to have their quarterly dividends
deposited directly into a checking or savings account
free of charge. For information about this service, please
contact National City Bank.
Nordson on the Internet
Nordson’s Web site, www.nordson.com, provides
up-to-date information about the company, including
news, quarterly and annual financial results, stock quotes,
and in-depth information on the company’s products
and systems. Each quarter, Nordson also broadcasts
its traditional telephone conference calls via the Internet.
In addition, visitors to the site can register to receive
e-mail alerts for online notification of the latest financial
information.
Form 10-K/Financial Reports
Nordson Corporation’s Annual Report to the Securities
and Exchange Commission (Form 10-K), quarterly
reports and proxy statement are available in the Investor
Relations section of our Web site, www.nordson.com.
Copies of these reports may also be obtained by
shareholders free of charge by sending written requests
to Barbara Price, Manager, Shareholder Relations,
Nordson Corporation, 28601 Clemens Road,
Westlake, Ohio 44145. Telephone: 440-414-5344;
fax: 440-892-9507.
0712542_text-02.qxp 1/8/08 5:00 PM Page 23

UNITED STATES SECURITIES AND EXCHANGE COMMISSIONWashington, D.C. 20549
FORM 10-KANNUAL REPORT PURSUANT TO SECTIONS 13 OR 15(d) OF
THE SECURITIES EXCHANGE ACT OF 1934(Mark One)
≤ ANNUAL REPORT PURSUANT TO SECTION 13 OR 15(d) OF THE SECURITIESEXCHANGE ACT OF 1934
For the fiscal year ended October 31, 2007OR
n TRANSITION REPORT PURSUANT TO SECTION 13 OR 15(d) OF THE SECURITIESEXCHANGE ACT OF 1934
For the transition period from to
Commission file number 0-7977
NORDSON CORPORATION(Exact name of Registrant as specified in its charter)
Ohio 34-0590250(State of incorporation) (I.R.S. Employer Identification No.)28601 Clemens Road
Westlake, Ohio 44145(Address of principal executive offices) (Zip Code)
(440) 892-1580(Registrant’s Telephone Number, including area code)
Securities registered pursuant to Section 12(b) of the Act:Common Shares with no par value
Securities registered pursuant to Section 12(g) of the Act:None
Indicate by check mark if the registrant is a well-known seasoned issuer, as defined in Rule 405 of the SecuritiesAct. Yes ≤ No n
Indicate by check mark if the registrant is not required to file reports pursuant to Section 13 or Section 15(d) of theAct. Yes n No ≤
Indicate by check mark whether the Registrant (1) has filed all reports required to be filed by Section 13 or 15 (d) ofthe Securities Exchange Act of 1934 during the preceding 12 months, and (2) has been subject to such filingrequirements for the past 90 days. Yes ≤ No n
Indicate by check mark if disclosure of delinquent filers pursuant to Item 405 of Regulation S-K is not containedherein, and will not be contained, to the best of registrant’s knowledge, in definitive proxy or information statementsincorporated by reference in Part III of this Form 10-K or any amendment to this Form 10-K. ≤
Indicate by check mark whether the Registrant is a large accelerated filer, an accelerated filer, or a non-acceleratedfiler. See definition of “accelerated filer and large accelerated filer” in Rule 12b-2 of the Exchange Act. (Check one):
Large accelerated filer ≤ Accelerated filer n Non-accelerated filer n
Indicate by check mark whether the Registrant is a shell company (as defined in Rule 12b-2 of the ExchangeAct). Yes n No ≤
The aggregate market value of Common Stock, no par value per share, held by nonaffiliates (based on the closingsale price on the Nasdaq) as of April 30, 2007 was approximately $1,320,022,000.
There were 33,667,062 shares of Common Stock outstanding as of November 30, 2007.
DOCUMENTS INCORPORATED BY REFERENCE:
Portions of the Proxy Statement for the 2008 Annual Meeting — Part III

Table of Contents
PART I . . . . . . . . . . . . . . . . . . . . . . . . . . . . . . . . . . . . . . . . . . . . . . . . . . . . . . . . . . . . . . . . . . . . . . . . 2Item 1. Business . . . . . . . . . . . . . . . . . . . . . . . . . . . . . . . . . . . . . . . . . . . . . . . . . . . . . . . . . . . . . . . 2
General Description of Business . . . . . . . . . . . . . . . . . . . . . . . . . . . . . . . . . . . . . . . . . . . . . 2Corporate Purpose and Goals . . . . . . . . . . . . . . . . . . . . . . . . . . . . . . . . . . . . . . . . . . . . . . . 2Financial Information About Operating Segments, Foreign and Domestic Operations and
Export Sales . . . . . . . . . . . . . . . . . . . . . . . . . . . . . . . . . . . . . . . . . . . . . . . . . . . . . . . . . . 3Principal Products and Uses . . . . . . . . . . . . . . . . . . . . . . . . . . . . . . . . . . . . . . . . . . . . . . . . 3Manufacturing and Raw Materials . . . . . . . . . . . . . . . . . . . . . . . . . . . . . . . . . . . . . . . . . . . . 5Intellectual Property . . . . . . . . . . . . . . . . . . . . . . . . . . . . . . . . . . . . . . . . . . . . . . . . . . . . . . 5Seasonal Variation in Business . . . . . . . . . . . . . . . . . . . . . . . . . . . . . . . . . . . . . . . . . . . . . . . 5Working Capital Practices . . . . . . . . . . . . . . . . . . . . . . . . . . . . . . . . . . . . . . . . . . . . . . . . . . 5Customers . . . . . . . . . . . . . . . . . . . . . . . . . . . . . . . . . . . . . . . . . . . . . . . . . . . . . . . . . . . . . 6Backlog . . . . . . . . . . . . . . . . . . . . . . . . . . . . . . . . . . . . . . . . . . . . . . . . . . . . . . . . . . . . . . . 6Government Contracts . . . . . . . . . . . . . . . . . . . . . . . . . . . . . . . . . . . . . . . . . . . . . . . . . . . . 6Competitive Conditions . . . . . . . . . . . . . . . . . . . . . . . . . . . . . . . . . . . . . . . . . . . . . . . . . . . 6Research and Development . . . . . . . . . . . . . . . . . . . . . . . . . . . . . . . . . . . . . . . . . . . . . . . . . 6Environmental Compliance . . . . . . . . . . . . . . . . . . . . . . . . . . . . . . . . . . . . . . . . . . . . . . . . . 6Employees . . . . . . . . . . . . . . . . . . . . . . . . . . . . . . . . . . . . . . . . . . . . . . . . . . . . . . . . . . . . . 7Available Information . . . . . . . . . . . . . . . . . . . . . . . . . . . . . . . . . . . . . . . . . . . . . . . . . . . . . 7
Item 1A. Risk Factors . . . . . . . . . . . . . . . . . . . . . . . . . . . . . . . . . . . . . . . . . . . . . . . . . . . . . . . . . . . . 7Item 1B. Unresolved Staff Comments . . . . . . . . . . . . . . . . . . . . . . . . . . . . . . . . . . . . . . . . . . . . . . . . 11Item 2. Properties . . . . . . . . . . . . . . . . . . . . . . . . . . . . . . . . . . . . . . . . . . . . . . . . . . . . . . . . . . . . . . 12Item 3. Legal Proceedings . . . . . . . . . . . . . . . . . . . . . . . . . . . . . . . . . . . . . . . . . . . . . . . . . . . . . . . . 13Item 4. Submission of Matters to a Vote of Security Holders . . . . . . . . . . . . . . . . . . . . . . . . . . . . . . 13
Executive Officers of the Company . . . . . . . . . . . . . . . . . . . . . . . . . . . . . . . . . . . . . . . . . . . 14PART II . . . . . . . . . . . . . . . . . . . . . . . . . . . . . . . . . . . . . . . . . . . . . . . . . . . . . . . . . . . . . . . . . . . . . . . 15
Item 5. Market for the Company’s Common Equity, Related Stockholder Matters and IssuerPurchases of Equity Securities . . . . . . . . . . . . . . . . . . . . . . . . . . . . . . . . . . . . . . . . . . . . . 15
Market Information and Dividends . . . . . . . . . . . . . . . . . . . . . . . . . . . . . . . . . . . . . . . . . . . 15Performance Graph . . . . . . . . . . . . . . . . . . . . . . . . . . . . . . . . . . . . . . . . . . . . . . . . . . . . . . . 16
Item 6. Selected Financial Data. . . . . . . . . . . . . . . . . . . . . . . . . . . . . . . . . . . . . . . . . . . . . . . . . . . . 17Item 7. Management’s Discussion and Analysis of Financial Condition and Results of Operations . . 18
Critical Accounting Policies and Estimates . . . . . . . . . . . . . . . . . . . . . . . . . . . . . . . . . . . . . 18Item 7A. Quantitative and Qualitative Disclosures About Market Risk . . . . . . . . . . . . . . . . . . . . . . . . 28Item 8. Financial Statements and Supplementary Data. . . . . . . . . . . . . . . . . . . . . . . . . . . . . . . . . . . 30
Consolidated Statements of Income. . . . . . . . . . . . . . . . . . . . . . . . . . . . . . . . . . . . . . . . . . . 30Consolidated Balance Sheets . . . . . . . . . . . . . . . . . . . . . . . . . . . . . . . . . . . . . . . . . . . . . . . . 31Consolidated Statements of Shareholders’ Equity . . . . . . . . . . . . . . . . . . . . . . . . . . . . . . . . . 32Consolidated Statements of Cash Flows . . . . . . . . . . . . . . . . . . . . . . . . . . . . . . . . . . . . . . . 33Notes to Consolidated Financial Statements . . . . . . . . . . . . . . . . . . . . . . . . . . . . . . . . . . . . 34Management’s Report on Internal Control Over Financial Reporting . . . . . . . . . . . . . . . . . . 66Report of Independent Registered Public Accounting Firm . . . . . . . . . . . . . . . . . . . . . . . . . 67Report of Independent Registered Public Accounting Firm . . . . . . . . . . . . . . . . . . . . . . . . . 68
i

Item 9. Changes in and Disagreements With Accountants on Accounting and FinancialDisclosure . . . . . . . . . . . . . . . . . . . . . . . . . . . . . . . . . . . . . . . . . . . . . . . . . . . . . . . . . . . . 69
Item 9A. Controls and Procedures . . . . . . . . . . . . . . . . . . . . . . . . . . . . . . . . . . . . . . . . . . . . . . . . . . . 69Item 9B. Other Information . . . . . . . . . . . . . . . . . . . . . . . . . . . . . . . . . . . . . . . . . . . . . . . . . . . . . . . 69
PART III . . . . . . . . . . . . . . . . . . . . . . . . . . . . . . . . . . . . . . . . . . . . . . . . . . . . . . . . . . . . . . . . . . . . . . 69Item 10. Directors, Executive Officers and Corporate Governance . . . . . . . . . . . . . . . . . . . . . . . . . . . 69Item 11. Executive Compensation . . . . . . . . . . . . . . . . . . . . . . . . . . . . . . . . . . . . . . . . . . . . . . . . . . . 70Item 12. Security Ownership of Certain Beneficial Owners and Management and Related
Stockholder Matters . . . . . . . . . . . . . . . . . . . . . . . . . . . . . . . . . . . . . . . . . . . . . . . . . . . . 70Equity Compensation Table . . . . . . . . . . . . . . . . . . . . . . . . . . . . . . . . . . . . . . . . . . . . . . . . 70
Item 13. Certain Relationships and Related Transactions, and Director Independence . . . . . . . . . . . . 70Item 14. Principal Accounting Fees and Services . . . . . . . . . . . . . . . . . . . . . . . . . . . . . . . . . . . . . . . . 70
PART IV . . . . . . . . . . . . . . . . . . . . . . . . . . . . . . . . . . . . . . . . . . . . . . . . . . . . . . . . . . . . . . . . . . . . . . . 71Item 15. Exhibits and Financial Statement Schedules . . . . . . . . . . . . . . . . . . . . . . . . . . . . . . . . . . . . 71
(a)(1). Financial Statements. . . . . . . . . . . . . . . . . . . . . . . . . . . . . . . . . . . . . . . . . . . . . . . . . 71(a)(2) and(c). Financial Statement Schedules . . . . . . . . . . . . . . . . . . . . . . . . . . . . . . . . . . . . 71(a)(3) and(b). Exhibits. . . . . . . . . . . . . . . . . . . . . . . . . . . . . . . . . . . . . . . . . . . . . . . . . . . . . 71Signatures. . . . . . . . . . . . . . . . . . . . . . . . . . . . . . . . . . . . . . . . . . . . . . . . . . . . . . . . . . . . . . 72Schedule II — Valuation and Qualifying Accounts and Reserves. . . . . . . . . . . . . . . . . . . . . . 74Index to Exhibits . . . . . . . . . . . . . . . . . . . . . . . . . . . . . . . . . . . . . . . . . . . . . . . . . . . . . . . . 75Subsidiaries of the Registrant . . . . . . . . . . . . . . . . . . . . . . . . . . . . . . . . . . . . . . . . . . . . . . . 77Consent of Independent Registered Public Accounting Firm . . . . . . . . . . . . . . . . . . . . . . . . 79Certifications . . . . . . . . . . . . . . . . . . . . . . . . . . . . . . . . . . . . . . . . . . . . . . . . . . . . . . . . . . . 80
ii
Table of Contents

PART I
NOTE REGARDING DOLLAR AMOUNTS
In this annual report, all amounts related to U.S. and foreign currency and to the number of Nordson Corporation’sCommon Shares, except for per share earnings and dividend amounts, are expressed in thousands.
Item 1. Business
General Description of BusinessNordson Corporation is one of the world’s leading manufacturers of equipment used for precision dispensing,testing and inspection, surface preparation and curing. Nordson’s technology-based systems can be found inproduction facilities around the world. The Company serves many diverse markets, including the appliance,automotive, bookbinding, container, converting, electronics, food and beverage, furniture, life sciences, medical,metal finishing, nonwoven, packaging and semiconductor industries.
The Company’s strategy for long-term growth is based on a customer-driven focus and a global mindset.Headquartered in Westlake, Ohio, Nordson markets its products through a network of direct operations in 30countries. Consistent with this strategy, more than two-thirds of the Company’s revenues are generated outside theUnited States.
Nordson has more than 4,000 employees worldwide. Principal manufacturing facilities are located in the United Statesin California, Georgia, New Jersey, Ohio and Rhode Island, as well as in China, Germany, India, The Netherlands andthe United Kingdom.
Corporate Purpose and GoalsNordson Corporation strives to be a vital, self-renewing, worldwide organization which, within the framework ofethical behavior and enlightened citizenship, grows and produces wealth for its customers, employees, shareholdersand communities.
Nordson operates for the purpose of creating balanced, long-term benefits for all of our constituencies: customers,employees, shareholders and communities.
Our corporate goal for growth is to double the value of the Company over a five-year period, with the primarymeasure of value set by the market for the Company’s Common Shares.
While external factors may impact value, the achievement of this goal will rest with earnings growth, capital andhuman resource efficiency and positioning for the future.
Nordson does not expect every quarter to produce increased sales, earnings and earnings per share, or to exceed thecomparative prior year’s quarter. We do expect to produce long-term gains. When short-term swings occur, we donot intend to alter our basic objectives in efforts to mitigate the impact of these natural occurrences.
Growth is achieved by seizing opportunities with existing products and markets, investing in systems to maximizeproductivity and pursuing growth markets. This strategy is augmented through product line additions, engineering,research and development, and acquisition of companies that can serve multinational industrial markets.
We create benefits for our customers through a Package of Values», which includes carefully engineered, durableproducts; strong service support; the backing of a well-established worldwide company with financial and technicalstrengths; and a corporate commitment to deliver what was promised.
We strive to provide genuine customer satisfaction; it is the foundation upon which we continue to build ourbusiness.
Complementing our business strategy is the objective to provide opportunities for employee self-fulfillment,growth, security, recognition and equitable compensation. This goal is met through Human Resources’ facilitationof employee training and leadership training and the creation of on-the-job growth opportunities. The result is ahighly qualified and professional management team capable of meeting corporate objectives.
2

We recognize the value of employee participation in the planning process. Strategic and operating plans aredeveloped by all business units and divisions, resulting in a sense of ownership and commitment on the part ofemployees in accomplishing Company objectives. In addition, employees participate in Lean initiatives tocontinuously improve the Company’s processes.
Nordson Corporation is an equal opportunity employer.
Nordson is committed to contributing approximately 5 percent of domestic pretax earnings to human services,education and other charitable activities, particularly in communities where the Company has major facilities.
Financial Information About Operating Segments, Foreign and Domestic Operations and Export SalesIn accordance with Statement of Financial Accounting Standards No. 131, “Disclosure about Segments of anEnterprise and Related Information,” Nordson has reported information about the Company’s three operatingsegments. This information is contained in Note 17 of Notes to Consolidated Financial Statements, which can befound in Part II, Item 8 of this document.
Principal Products and UsesNordson Corporation is one of the world’s leading manufacturers of equipment used for precision dispensing,testing and inspection, surface preparation and curing. Nordson’s technology-based systems can be found inproduction facilities around the world. Equipment ranges from manual, stand-alone units for low-volumeoperations to microprocessor-based automated systems for high-speed, high-volume production lines.
Nordson markets its products in the United States and in more than 50 other countries, primarily through a directsales force and also through qualified distributors and sales representatives. Nordson has built a worldwidereputation for its creativity and expertise in the design and engineering of high-technology application equipmentthat meets the specific needs of its customers.
The following is a summary of the products and markets served by the Company’s business segments:
1. Adhesive Dispensing Systems
This segment delivers Nordson proprietary dispensing technology to diverse markets for applications thatcommonly reduce material consumption, increase line efficiency and enhance product brand and appearance.
• Nonwovens — Equipment for applying adhesives, lotions, liquids and fibers to disposable products. Keystrategic markets include adult incontinence products, baby diapers and child-training pants, femininehygiene products and surgical drapes, gowns, shoe covers and face masks.
• Packaging — Automated adhesive dispensing systems used in the food and beverage and packaged goodsindustries. Key strategic markets include food packages, chocolate wrappers and drink containers.
• Paper and Paperboard Converting — Hot melt and cold glue adhesive dispensing systems for the paperand paperboard converting industries. Key strategic markets include bag and sack manufacturing,bookbinding, envelope manufacturing and folding carton manufacturing.
• Product Assembly — Adhesive and sealant dispensing systems for bonding or sealing plastic, metal andwood products. Key strategic markets include appliances, automotive components, building and con-struction materials, electronics and furniture.
• Web Coating — Laminating and coating systems used to manufacture continuous-roll goods in thenonwovens, textile, paper and flexible-packaging industries. Key strategic markets include carpet, labels,tapes and textiles.
3
2. Advanced Technology Systems
This segment integrates Nordson proprietary product technologies found in progressive stages of a customer’sproduction process, such as surface preparation, precisely controlled dispensing of material onto the surface,curing of dispensed material, bond testing and X-ray inspection to ensure quality. This segment primarilyserves the specific needs of electronic and related high-tech industries.
• Surface Preparation — Automated gas plasma treatment systems used to clean and condition surfaces forthe semiconductor, medical and printed circuit board industries. Key strategic markets include contactlenses, electronics, medical instruments and devices, printed circuit boards and semiconductors.
• Dispensing Systems — Controlled manual and automated systems for applying materials in customerprocesses typically requiring extreme precision and material conservation. These systems include piezo-electric and motionless two-component mixing dispensing systems. Key strategic markets includeaerospace, electronics (cell phones, liquid crystal displays, micro hard drives, microprocessors, RadioFrequency Identification (RFID) tags, CDs and DVDs), and life sciences (dental and medical devices,including pacemakers and stents).
• Curing and Drying Systems — Ultraviolet equipment used primarily in curing and drying operations forspecialty inks, coatings, semiconductor materials and paints. Key strategic markets include electronics,graphic arts, plastic containers, printed-paper and packaging, semiconductor equipment and wood andmedium-density fiberboard (MDF).
• Bond Testing and Inspection Systems — Testing and automated optical and x-ray inspection systems usedin the semiconductor and printed circuit board industries. Key strategic markets include electronics(digital music players and cell phones), printed circuit board assemblies and semiconductor packages.
3. Industrial Coating and Automotive Systems
This segment provides both standard and highly-customized equipment used primarily for applying coatings,paint, finishes, sealants and other materials. This segment primarily serves the consumer durables market.
• Automotive — Automated and manual dispensing systems used to apply materials in the automotive,heavy truck and recreational vehicle manufacturing industries. Key strategic markets include powertraincomponents, body assembly and final trim applications.
• Container Coating and Curing — Automated and manual dispensing and curing systems used to coat andcure containers. Key strategic markets include beverage containers and food cans.
• Liquid Finishing — Automated and manual dispensing systems used to apply liquid paints and coatingsto consumer and industrial products. Key strategic markets include automotive components, construction,metal shelving and drums.
• Powder Coating — Automated and manual dispensing systems used to apply powder paints and coatingsto a variety of metal, plastic and wood products. Key strategic markets include agriculture and constructionequipment, appliances, automotive components, home and office furniture, lawn and garden equipmentand wood and metal shelving.
4

Manufacturing and Raw MaterialsNordson’s production operations include machining and assembly. The Company manufactures specially designedparts and assembles components into finished equipment. Many components are made in standard modules that canbe used in more than one product or in combination with other components for a variety of models. The Companyhas principal manufacturing operations in the United States in Amherst, Ohio; Norcross, Swainsboro andDawsonville, Georgia; Carlsbad, California; Robbinsville, New Jersey and East Providence, Rhode Island; aswell as in Shanghai and Suzhou, China; Luneburg, Germany; Bangalore, India; Maastricht, The Netherlands andin Slough and Aylesbury, United Kingdom.
Principal materials used to make Nordson products are metals and plastics, typically in sheets, bar stock, castings,forgings and tubing. Nordson also purchases many electrical and electronic components, fabricated metal parts,high-pressure fluid hoses, packings, seals and other items integral to its products. Suppliers are competitivelyselected based on cost, quality and service. All significant raw materials that Nordson uses are available throughmultiple sources.
Nordson’s senior operating executives supervise an extensive quality control program for Nordson equipment,machinery and systems.
Natural gas and other fuels are primary energy sources for Nordson. However, standby capacity for alternativesources is available if needed.
Intellectual PropertyThe Company maintains procedures to protect its intellectual property (including patents, trademarks andcopyrights) both domestically and internationally. Risk factors associated with the Company’s intellectual propertyare discussed in Item 1A Risk Factors.
Seasonal Variation in BusinessGenerally, the highest volume of sales occurs in the Company’s fourth fiscal quarter due in large part to the timing ofour customers’ capital spending programs. First-quarter sales volume is typically the lowest of the year due tocustomer holiday shutdowns.
Working Capital PracticesNo special or unusual practices affect Nordson’s working capital. However, the Company generally requires advancepayments as deposits on customized equipment and systems and, in certain cases, requires progress payments duringthe manufacturing of these products. The Company has initiated a number of new processes focused on reduction ofmanufacturing lead times. These initiatives have resulted in lower investment in inventory while maintaining thecapability to respond promptly to customer needs.
5

CustomersThe Company serves a broad customer base, both in terms of industries and geographic regions. The loss of a singleor few customers would not have a material adverse effect on the Company’s business. In fiscal 2007, no singlecustomer accounted for 5 percent or more of sales.
BacklogThe Company’s backlog of open orders from continuing operations increased to $98,135 at October 31, 2007, from$68,637 at October 31, 2006. The increase can be traced to $14,234 from fiscal 2007 acquisitions in the AdvancedTechnology Systems segment, $11,658 from base businesses (primarily the Adhesive Dispensing Systems segment)and $3,606 from the favorable effects of changes in currency rates. All orders in the fiscal 2007 year-end backlog areexpected to be shipped to customers in fiscal 2008.
Government ContractsNordson’s business neither includes nor depends upon a significant amount of governmental contracts orsubcontracts. Therefore, no material part of the Company’s business is subject to renegotiation or terminationat the option of the government.
Competitive ConditionsNordson equipment is sold in competition with a wide variety of alternative bonding, sealing, caulking, finishing,coating, testing and inspection techniques. Any production process that requires surface preparation or modifi-cation, application of material to a substrate or surface, curing or testing and inspection is a potential use forNordson equipment.
Many factors influence the Company’s competitive position, including pricing, product quality and service.Nordson enjoys a leadership position in its business segments by delivering high-quality, innovative productsand technologies, as well as after-the-sale service and technical support. Working with customers to understandtheir processes and developing the application solutions that help them meet their production requirements alsocontributes to Nordson’s leadership position. Nordson’s worldwide network of direct sales and technical resourcesalso is a competitive advantage.
Research and DevelopmentInvestments in research and development are important to Nordson’s long-term growth, enabling the Company tokeep pace with changing customer and marketplace needs through the development of new products and newapplications for existing products. The Company places strong emphasis on technology developments andimprovements through its internal engineering and research teams. Research and development expenses relatedto continuing operations were approximately $35,432 in fiscal 2007, compared with approximately $25,336 in fiscal2006 and $22,341 in fiscal 2005.
Environmental ComplianceWe are subject to extensive federal, state, local and foreign environmental, safety and health laws and regulationsconcerning, among other things, emissions to the air, discharges to land and water and the generation, handling,treatment and disposal of hazardous waste and other materials. Under certain of these laws, we can be held strictlyliable for hazardous substance contamination of any real property we have ever owned, operated or used as a disposalsite or for natural resource damages associated with such contamination. We are also required to maintain variousrelated permits and licenses, many of which require periodic modification and renewal. The operation ofmanufacturing plants unavoidably entails environmental, safety and health risks, and we could incur materialunanticipated costs or liabilities in the future if any of these risks were realized in ways or to an extent that we did notanticipate.
6
We believe that we operate in compliance, in all material respects, with applicable environmental laws andregulations. Compliance with environmental laws and regulations requires continuing management effort andexpenditures. We have incurred, and will continue to incur, costs and capital expenditures to comply with these lawsand regulations and to obtain and maintain the necessary permits and licenses. We believe that the cost of complyingwith environmental laws and regulations will not have a material affect on our earnings, liquidity or competitiveposition, but we cannot assure that material compliance-related costs and expenses may not arise in the future. Forexample, future adoption of new or amended environmental laws, regulations or requirements or newly discoveredcontamination or other circumstances that require a response on our part may require us to incur costs and expensesthat we cannot presently anticipate.
We believe that we have properly designed our policies, practices and procedures to prevent unreasonable risk ofmaterial environmental damage arising from our operations. We accrue for estimated environmental liabilities withcharges to expense. We believe our environmental accrual is adequate to provide for our portion of the costs of allsuch known environmental liabilities. Except for the disclosure in Item 3, Legal Proceedings, compliance withfederal, state and local environmental protection laws during fiscal 2007 had no material effect on the Company’scapital expenditures, earnings or competitive position. Based upon consideration of currently available information,we believe liabilities for environmental matters will not have a material adverse affect on our financial position,operating results or liquidity, but we cannot assure that material environmental liabilities may not arise in the future.
EmployeesAs of October 31, 2007, Nordson had 4,089 full- and part-time employees, including 146 at the Company’sAmherst, Ohio, facility that are represented by a collective bargaining agreement that expires on October 31, 2010.No material work stoppages have been experienced at any of the Company’s facilities during any of the periodscovered by this report.
Available InformationThe Company’s proxy statement, annual report to the Securities and Exchange Commission (Form 10-K),quarterly reports (Form 10-Q) and current reports (Form 8-K) and amendments to those reports filed or furnishedpursuant to Section 13(a) or 15(d) of the Securities Exchange Act of 1934 are available free of charge athttp://www.nordson.com/investors/SEC/ as soon as reasonably practical after the Company electronically filessuch material with, or furnishes it to, the SEC. Copies of these reports may also be obtained free of charge bysending written requests to Barbara Price, Manager, Shareholder Relations, Nordson Corporation, 28601 ClemensRoad, Westlake, Ohio 44145.
Item 1A. Risk Factors
In an enterprise as diverse and complex as Nordson’s, a wide range of factors could affect future performance. Wediscuss in this section some of the risk factors that, if they actually occurred, could materially and adversely affect theCompany’s business, financial condition, value and results of operations. You should consider these risk factors inconnection with evaluating the forward-looking statements contained in this Annual Report on Form 10-K becausethese factors could cause our actual results and financial condition to differ materially from those projected inforward-looking statements. The risks that we highlight below are not the only ones that we face. Additional risksand uncertainties that the Company does not presently know about or that the Company currently believes will beimmaterial may also affect the Company’s business.
7

The significant risk factors affecting our operations include the following:
Changes in U.S. or international economic conditions could adversely affect the profitability of any ofour businesses.In fiscal 2007, 31 percent of the Company’s revenue was derived from domestic customers while 69 percent wasderived from international customers. The Company’s largest markets include appliance, automotive, bookbinding,construction, container, converting, electronics assembly, food and beverage, furniture, life sciences, medical, metalfinishing, nonwovens, packaging and semiconductor. A slowdown in any of these specific end markets could directlyaffect the Company’s revenue stream and profitability.
A portion of our product sales is attributable to industries and markets, such as the semiconductor and metalfinishing industries, which historically have been cyclical and sensitive to relative changes in supply and demand andgeneral economic conditions. The demand for our products depends, in part, on the general economic conditions ofthe industries or national economies of our customers. Downward economic cycles in our customers’ industries orcountries may reduce sales of some of our products. It is not possible to predict accurately the factors that will affectdemand for our products in the future.
Any significant downturn in the health of the general economy, either globally, regionally or in the markets in whichwe sell products could have an adverse effect on our revenues and financial performance.
Political conditions in foreign countries in which we operate could adversely affect us.The Company conducts its manufacturing, sales and distribution operations on a worldwide basis and is subject torisks associated with doing business outside the United States. In fiscal 2007, approximately 69 percent of our totalsales were to customers outside the U.S. We expect that international operations and U.S. export sales will continueto be important to our business for the foreseeable future. Both the sales from international operations andU.S. export sales are subject in varying degrees to risks inherent in doing business outside the United States. Suchrisks include, but are not limited to, the following:
• risks of economic instability;
• unanticipated or unfavorable circumstances arising from host country laws or regulations;
• restrictions on the transfer of funds into or out of a country;
• currency exchange rate fluctuations;
• difficulties in enforcing agreements and collecting receivables through some foreign legal systems;
• international customers with longer payment cycles than customers in the United States;
• potential negative consequences from changes to taxation policies;
• the disruption of operations from foreign labor and political disturbances;
• the imposition of tariffs, import or export licensing requirements;
• exchange controls or other trade restrictions including transfer pricing restrictions when products produced inone country are sold to an affiliated entity in another country.
Any of these events could reduce the demand for our products, limit the prices at which we can sell our products, orotherwise have an adverse effect on our operating performance.
The inability to continue to develop new products could limit the Company’s revenue and profitability.Innovation is critical to the Company’s success. We believe that we must continue to enhance our existing productsand to develop and manufacture new products with improved capabilities in order to continue to be a market leader.We also believe that we must continue to make improvements in our productivity in order to maintain ourcompetitive position. Our inability to anticipate, respond to or utilize changing technologies could have a materialadverse effect on our business and our consolidated results of operations.
8
Our growth strategy includes acquisitions, and we may not be able to make acquisitions of suitable candi-dates or integrate acquisitions successfully.Our recent historical growth has also depended, and our future growth is likely to continue to depend, in large parton our acquisition strategy and the successful integration of acquired businesses into our existing operations. Weintend to continue to seek additional acquisition opportunities both to expand into new markets and to enhance ourposition in existing markets throughout the world. We cannot assure, however, that we will be able to successfullyidentify suitable candidates, prevail against competing potential acquirers, negotiate appropriate acquisition terms,obtain financing that may be needed to consummate such acquisitions, complete proposed acquisitions, successfullyintegrate acquired businesses into our existing operations or expand into new markets. In addition, we cannot assurethat any acquisition, once successfully integrated, will perform as planned, be accretive to earnings, or prove to bebeneficial to our operations and cash flow.
The success of any acquisition is subject to other risks and uncertainties, including:
• the Company’s ability to realize operating efficiencies, synergies or other benefits expected from an acquisition,and possible delays in realizing the benefits of the acquired company or products;
• diversion of management’s time and attention from other business concerns;
• difficulties in retaining key employees, customers or suppliers of the acquired business;
• difficulties in maintaining uniform standards, controls, procedures and policies throughout acquiredcompanies;
• adverse effects on existing business relationships with suppliers or customers;
• the risks associated with the assumption of contingent or undisclosed liabilities of acquisition targets;
• the ability to generate future cash flows or the availability of financing.
In addition, an acquisition could adversely impact the Company’s operating performance as a result of theincurrence of acquisition-related debt, acquisition expenses, or the amortization of acquisition-acquired assets.
We may also face liability with respect to acquired businesses for violations under environmental laws occurringprior to the date of our acquisition, and some or all of these liabilities may not be covered by environmentalinsurance secured to mitigate the risk or by indemnification from the sellers from which we acquired thesebusinesses. We could also incur significant costs, including, but not limited to, remediation costs, natural resourcesdamages, civil or criminal fines and sanctions and third-party claims, as a result of past or future violations of, orliabilities under, environmental laws.
Our inability to protect our intellectual property rights could adversely affect product sales and financialperformance.Difficulties in acquiring and maintaining our intellectual property rights could also adversely affect the Company’sbusiness and financial position. Our performance may depend in part on our ability to establish, protect and enforceintellectual property rights with respect to our patented technologies and proprietary rights and to defend againstany claims of infringement. These activities involve complex and constantly evolving legal, scientific and factualquestions and uncertainties. The Company’s ability to compete effectively with other companies depends in part onits ability to maintain and enforce the Company’s patents and other proprietary rights, which are essential to itsbusiness. These measures afford only limited protection and may not in all cases prevent our competitors fromgaining access to our intellectual property and proprietary information.
9
Litigation has been and may continue to be necessary to enforce the Company’s intellectual property rights, toprotect the Company’s trade secrets and to determine the validity and scope of the Company’s proprietary rights. Inaddition, we may face claims of infringement that could interfere with our ability to use technology or otherintellectual property rights that are material to our business operations. If litigation that we initiate is unsuccessful,we may not be able to protect the value of some of our intellectual property. If a claim of infringement against us issuccessful, we may be required to pay royalties or license fees to continue to use technology or other intellectualproperty rights that we have been using or we may be unable to obtain necessary licenses from third parties at areasonable cost or within a reasonable time. If we are unable to timely obtain licenses on reasonable terms, we maybe forced to cease selling or using any of our products that incorporate the challenged intellectual property, or toredesign or, in the case of trademark claims, rename our products to avoid infringing the intellectual property rightsof third parties. This may not always be possible or, if possible, may be time consuming and expensive. Intellectualproperty litigation, whether successful or unsuccessful, could be expensive to us and divert some of our resources.Our intellectual property rights may not be as valuable as we believe, which could result in a competitivedisadvantage or adversely affect our business and financial performance.
Significant movements in foreign currency exchange rates or change in monetary policy may harm ourfinancial results.We are exposed to fluctuations in foreign currency exchange rates, particularly with respect to the Euro, the BritishPound and the Yen. Any significant change in the value of the currencies of the countries in which we do businessagainst the U.S. dollar could affect our ability to sell products competitively and control our cost structure, whichcould have a material adverse effect on our business, financial condition and results of operations. For additionaldetail related to this risk, see Item 7A. Quantitative and Qualitative Disclosure About Market Risk.
The majority of our consolidated revenues in fiscal 2007 were generated in currencies other than the U.S. dollar,which is our reporting currency. We recognize foreign currency transaction gains and losses arising from ouroperations in the period incurred. As a result, currency fluctuations between the U.S. dollar and the currencies inwhich we do business have caused and will continue to cause foreign currency transaction and translation gains andlosses, which historically have been material and could continue to be material. We cannot predict the effects ofexchange rate fluctuations upon our future operating results because of the number of currencies involved, thevariability of currency exposures and the potential volatility of currency exchange rates. We take actions to manageour foreign currency exposure, such as entering into hedging transactions, where available, but we cannot assure thatour strategies will adequately protect our consolidated operating results from the effects of exchange ratefluctuations.
We also face risks arising from the imposition of exchange controls and currency devaluations. Exchange controlsmay limit our ability to convert foreign currencies into U.S. dollars or to remit dividends and other payments by ourforeign subsidiaries or customers located in or conducting business in a country imposing controls. Currencydevaluations diminish the U.S. dollar value of the currency of the country instituting the devaluation and, if theyoccur or continue for significant periods, could adversely affect our earnings or cash flow.
10

Inability to access capital could impede growth.The limits imposed on us by the restrictive covenants contained in our credit facilities could prevent us from makingacquisitions or capital improvements or cause us to lose access to these facilities.
Our existing credit facilities contain restrictive covenants that limit our ability to, among other things:
• borrow money or guarantee the debts of others;
• use assets as security in other transactions;
• make investments or other restricted payments or distributions;
• change our business or enter into new lines of business;
• sell or acquire assets or merge with or into other companies.
In addition, our credit facilities require us to meet financial ratios, including debt to consolidated EBITDA (both asdefined in the credit facility) and consolidated EBITDA to interest expense (as defined in the credit facility).
These restrictions could limit our ability to plan for or react to market conditions or meet extraordinary capital needsand could otherwise restrict our financing activities.
Our ability to comply with the covenants and other terms of our credit facilities will depend on our future operatingperformance. If we fail to comply with such covenants and terms, we will be in default and the maturity of therelated debt could be accelerated and become immediately due and payable. We may be required to obtain waiversfrom our lenders in order to maintain compliance under our credit facilities, including waivers with respect to ourcompliance with certain financial covenants. If we are unable to obtain any necessary waivers and the debt under ourcredit facilities is accelerated, our financial condition would be adversely affected.
We may need new or additional financing in the future to expand our business or refinance existing indebtedness. Ifwe are unable to access capital on satisfactory terms and conditions, we may not be able to expand our business ormeet our payment requirements under our existing credit facilities. Our ability to obtain new or additional financingwill depend on a variety of factors, many of which are beyond our control. We may not be able to obtain new oradditional financing because we have substantial debt or because we may not have sufficient cash flow to service orrepay our existing or future debt. In addition, depending on market conditions and our financial performance,equity financing may not be available on satisfactory terms or at all.
We could be adversely affected by rapid changes in interest rates.Any period of unexpected or rapid increase in interest rates may also adversely affect our profitability. AtOctober 31, 2007, we had $346,939 of total debt outstanding, of which approximately 86 percent was pricedat interest rates that float with the market. A 1 percent increase in the interest rate on the floating rate debt in fiscal2007 would have resulted in approximately $2,313 of additional interest expense. A higher level of floating rate debtwould increase the exposure discussed above. For additional detail related to this risk, see Item 7A. Quantitative andQualitative Disclosure About Market Risk.
The Company may, from time to time, post financial or other information on its Web site,http://www.nordson.com/Investors/. The Internet address is for informational purposes only and is not intendedfor use as a hyperlink. The Company is not incorporating any material on its Web site into this Report.
Item 1B. Unresolved Staff Comments
None.
11

Item 2. Properties
The following table summarizes the Company’s principal properties as of its fiscal 2007 year end.
Location Description of PropertyApproximateSquare Feet
Amherst, Ohio(1)(2)(3) A manufacturing, laboratory and office complex 585,000Norcross, Georgia(1) A manufacturing, laboratory and office building 150,000Dawsonville, Georgia(1) A manufacturing, laboratory and office building 134,000East Providence, Rhode Island (2)(a) A manufacturing, warehouse and office building 116,000Duluth, Georgia(1) An office and laboratory building 110,000Carlsbad, California(2) Two manufacturing and office buildings (leased) 88,000Robbinsville, New Jersey(2) A manufacturing, warehouse and office building (leased) 88,000East Providence, Rhode Island(2)(a) A manufacturing, warehouse and office complex (leased) 75,000Westlake, Ohio Corporate headquarters 68,000Swainsboro, Georgia (1) A manufacturing building 59,000Lincoln, Rhode Island(2)(a) A manufacturing building (leased) 44,000Vista, California(2) A manufacturing building (leased) 41,000Luneburg, Germany(1) A manufacturing building and laboratory 130,000Shanghai, China(1)(3) A manufacturing, warehouse and office building (leased) 92,000Erkrath, Germany(1)(2)(3) An office, laboratory and warehouse building (leased) 63,000Shanghai, China(1)(2)(3) An office and laboratory building 54,000Maastricht, The Netherlands(1)(2)(3) A manufacturing, distribution center and office building (leased) 48,000Tokyo, Japan(1)(2)(3) An office, laboratory and warehouse building (leased) 42,000Milano, Italy(1)(3) An office, laboratory and warehouse building (leased) 41,000Slough, U.K.(2) A manufacturing, warehouse and office building (leased) 33,000Aylesbury, U.K.(2) Two manufacturing, warehouse and office buildings (leased) 32,000Lagny Sur Marne, France(1)(3) An office building (leased) 29,000Mexico City, Mexico(1)(2)(3) A warehouse and office building (leased) 23,000Suzhou, China(2) A manufacturing, warehouse and office building (leased) 22,000Bangalore, India(1)(2)(3) A manufacturing, warehouse and office building 16,000Singapore(1)(2)(3) A warehouse and office building (leased) 7,000
Business Segment — Property Identification Legend
1 — Adhesive Dispensing Systems
2 — Advanced Technology Systems
3 — Industrial Coating and Automotive Systems
a — During fiscal 2007, the Company sold its 75,000 square foot complex in East Providence, Rhode Island and its44,000 square foot facility in Lincoln, Rhode Island and purchased a 116,000 square foot facility in East Providence,Rhode Island. The two sold properties are being leased back and used for production until the newly purchasedfacility is ready for use. At that time, the lease will be terminated.
The facilities listed above have adequate, suitable and sufficient capacity (production and nonproduction) to meetpresent and foreseeable demand for the Company’s products.
Other properties at international subsidiary locations and at branch locations within the United States are leased.Lease terms do not exceed 25 years and generally contain a provision for cancellation with some penalty at an earlierdate.
12

In addition, the Company leases equipment under various operating and capitalized leases. Information about leasesis reported in Note 8 of Notes to Consolidated Financial Statements that can be found in Part II, Item 8 of thisdocument.
Item 3. Legal Proceedings
Environmental — The Company has voluntarily agreed with the City of New Richmond, Wisconsin and otherPotentially Responsible Parties (“PRP”) to share costs associated with the remediation of the City ofNew Richmond municipal landfill (the “Site”) and constructing a potable water delivery system serving theimpacted area down gradient of the Site.
The Feasibility Study/Remedial Investigation for this project was completed and approved by the WisconsinDepartment of Natural Resources (“WDNR”) in September 2006. The Company accrued $2,835 of expense in thethird quarter of fiscal 2006, its best estimate of its obligation. This amount was recorded in selling and admin-istrative expenses. In the fourth quarter of fiscal 2007, the PRPs signed an Environmental Repair Contract with theWDNR. The estimated cost to the Company for Site remediation, constructing a potable water delivery system andongoing operation, maintenance and monitoring (“OM&M”) at the Site and the impacted area down gradient ofthe Site over the statutory monitoring period of 30 years is $3,008. The amount recorded in accrued liabilities is$1,858, and the remaining $1,150 of the liability is classified as long-term.
The liability for environmental remediation represents management’s best estimate of the probable and reasonablyestimable undiscounted costs related to known remediation obligations. The accuracy of the Company’s estimate ofenvironmental liability is affected by several uncertainties such as additional requirements that may be identified inconnection with remedial activities, the complexity and evolution of environmental laws and regulations, and theidentification of presently unknown remediation requirements. Consequently, the Company’s liability could begreater than its current estimate. However, the Company does not expect that the costs associated with remediationwill have a material adverse effect on its financial condition or results of operations.
In addition, the Company is involved in various other legal proceedings arising in the normal course of business.Based on current information, the Company does not expect that the ultimate resolution of pending and threatenedlegal proceedings will have a material adverse effect on its financial condition or results of operations. The Companyis not involved in any other legal proceedings that would be required to be disclosed pursuant to Item 103 ofRegulation S-K.
Item 4. Submission of Matters to a Vote of Security Holders
None.
13

Executive Officers of the Company
The executive officers of the Company as of October 31, 2007, were as follows:
Name Age Officer SincePosition or Office with The Company and Business
Experience During the Past Five (5) Year Period
Edward P. Campbell . . . . 57 1988 Chairman of the Board of Directors and Chief ExecutiveOfficer, 2004President and Chief Executive Officer, 1997
Peter S. Hellman . . . . . . . 58 2000 President, Chief Financial and Administrative Officer, 2004Executive Vice President, Chief Financial andAdministrative Officer, 2000
Robert A. Dunn Jr. . . . . . 60 1997 Senior Vice President, 2007Vice President, 1997
John J. Keane . . . . . . . . . 46 2003 Senior Vice President, 2005Vice President, 2003Vice President, Packaging and Product Assembly Systems,2000
Douglas C. Bloomfield . . 48 2005 Vice President, 2005Vice President, Automotive and UV, North AmericanDivision, 2003Vice President, Automotive, North American Division,2000
Bruce H. Fields . . . . . . . . 56 1992 Vice President, Human Resources, 1992Michael Groos . . . . . . . . 56 1995 Vice President, 1995Peter G. Lambert . . . . . . 47 2005 Vice President, 2005
Vice President, Packaging and Product Assembly, 2003Director, Corporate Development and Global BusinessInformation, 2001
Gregory P. Merk . . . . . . . 36 2006 Vice President, 2006General Manager, Latin America South, 2000
Shelly M. Peet . . . . . . . . 42 2007 Vice President, Chief Information Officer, 2007Director, Corporate Information Services and ChiefInformation Officer, 2003
Gregory A. Thaxton . . . . 46 2007 Vice President, Controller, 2007Corporate Controller and Chief Accounting Officer, 2006Group Controller, 2000
Robert E. Veillette. . . . . . 55 2007 Vice President, General Counsel and Secretary, 2007Secretary and Assistant General Counsel, 2002Assistant General Counsel and Assistant Secretary, 1995
14

PART II
Item 5. Market for the Company’s Common Equity, Related Stockholder Matters
and Issuer Purchases of Equity Securities
Market Information and Dividends(a) The Company’s Common Shares are listed on the NASDAQ Global Select Market under the symbol NDSN.As of November 30, 2007, there were approximately 2,040 registered shareholders. The table below is a summary ofdividends paid per Common Share, the range of market prices, and average price-earnings ratios with respect tocommon shares, during each quarter of fiscal years 2007 and 2006. The price-earnings ratios reflect average marketprices relative to trailing four-quarter total earnings per share from continuing operations.
Fiscal QuartersDividend
Paid High LowPrice-Earnings
Ratio
CommonShare Price
2007:First . . . . . . . . . . . . . . . . . . . . . . . . . . . . . . . . . . . $.175 $52.10 $43.57 17.1Second . . . . . . . . . . . . . . . . . . . . . . . . . . . . . . . . . .175 57.65 44.39 18.8Third . . . . . . . . . . . . . . . . . . . . . . . . . . . . . . . . . . .175 54.45 44.33 18.6Fourth . . . . . . . . . . . . . . . . . . . . . . . . . . . . . . . . . .175 56.32 44.63 19.0
2006:First . . . . . . . . . . . . . . . . . . . . . . . . . . . . . . . . . . . $.165 $46.96 $36.51 18.6Second . . . . . . . . . . . . . . . . . . . . . . . . . . . . . . . . . .165 53.64 43.44 20.1Third . . . . . . . . . . . . . . . . . . . . . . . . . . . . . . . . . . .17 57.81 40.80 18.7Fourth . . . . . . . . . . . . . . . . . . . . . . . . . . . . . . . . . .17 48.35 38.70 16.4
(b) Use of Proceeds. Not applicable.
(c) Issuer Purchases of Equity Securities
TotalNumber of
SharesRepurchased
AveragePrice Paidper Share
Total Number ofShares Repurchasedas Part of PubliclyAnnounced Plans
or Programs(1)
Maximum Numberof Shares that
May Yet bePurchased Under the
Plans or Programs
August 1, 2007 to August 31, 2007 . . . . . . . . . 4 $48.88 4 947September 1, 2007 to September 30, 2007 . . . . 53 $49.23 53 894October 1, 2007 to October 31, 2007. . . . . . . . 33 $53.08 33 861
Total . . . . . . . . . . . . . . . . . . . . . . . . . . . . . . . . 90 90
(1) In October 2006, the board of directors authorized the Company to repurchase, until October 2009, up to 1,000of the Company’s Common Shares on the open market or in privately negotiated transactions.
15

Performance GraphThe following is a graph that compares the five-year cumulative return from investing $100 on November 1, 2002 ineach of Nordson Common Shares, the MidCap 400 Index and the S&P MidCap 400 Industrial Machinery Index.Total return assumes reinvestment of dividends.
TOTAL SHAREHOLDER RETURNSINDEXED RETURNS
0
50
100
150
200
250
300
350
200720062005200420032002
DO
LL
AR
S
NORDSON CORPORATION
S&P MIDCAP 400
S&P MIDCAP 400 INDUSTRIAL MACHINERY INDEX
2002 2003 2004 2005 2006 2007
NORDSON CORPORATION 100.00 108.19 139.15 150.99 189.12 222.87
S&P MIDCAP 400 100.00 130.73 145.16 170.78 193.72 226.69
S&P MIDCAP 400INDUSTRIAL MACHINERY INDEX 100.00 129.27 155.21 166.54 207.65 269.93
16

Item 6. Selected Financial Data
Five-Year Summary
(In thousands except for per-share amounts) 2007 2006 2005 2004 2003
Operating Data(a)
Sales. . . . . . . . . . . . . . . . . . . . . . . . . . . . . . . . . . . $ 993,649 892,221 832,179 771,450 659,616Cost of sales . . . . . . . . . . . . . . . . . . . . . . . . . . . . . $ 439,804 379,800 362,824 334,302 291,297% of sales . . . . . . . . . . . . . . . . . . . . . . . . . . . . . . . 44 43 44 43 44Selling and administrative expenses . . . . . . . . . . . . $ 401,294 362,179 337,782 318,562 286,900% of sales . . . . . . . . . . . . . . . . . . . . . . . . . . . . . . . 40 41 41 41 43Severance and restructuring costs. . . . . . . . . . . . . . $ 409 2,627 875 — 2,028Operating profit . . . . . . . . . . . . . . . . . . . . . . . . . . $ 152,142 147,615 130,698 118,586 79,391% of sales . . . . . . . . . . . . . . . . . . . . . . . . . . . . . . . 15 17 16 15 12Income from continuing operations . . . . . . . . . . . . $ 90,692 97,667 84,510 68,307 41,807% of sales . . . . . . . . . . . . . . . . . . . . . . . . . . . . . . . 9 11 10 9 6Financial Data(a)
Working capital . . . . . . . . . . . . . . . . . . . . . . . . . . $ (99,990) 105,979 61,642 167,362 65,708Net property, plant and equipment and other non-
current assets . . . . . . . . . . . . . . . . . . . . . . . . . . $ 801,916 475,586 476,810 476,276 489,436Total invested capital . . . . . . . . . . . . . . . . . . . . . . $ 701,926 581,565 538,452 643,638 555,144Total assets . . . . . . . . . . . . . . . . . . . . . . . . . . . . . . $1,211,840 822,890 790,417 840,548 766,806Long-term liabilities . . . . . . . . . . . . . . . . . . . . . . . $ 170,809 151,037 207,540 240,305 255,035Shareholders’ equity . . . . . . . . . . . . . . . . . . . . . . . $ 531,117 430,528 330,912 403,333 300,109Return on average invested capital — %(b) . . . . . . . 17 20 16 14 8Return on average shareholders’ equity — %(c) . . . . 19 26 21 19 15Per-Share Data(a)
Basic earnings per share from continuingoperations . . . . . . . . . . . . . . . . . . . . . . . . . . . . . $ 2.70 2.93 2.37 1.92 1.24
Diluted earnings per share from continuingoperations . . . . . . . . . . . . . . . . . . . . . . . . . . . . . $ 2.65 2.86 2.31 1.87 1.23
Dividends per common share . . . . . . . . . . . . . . . . $ 0.70 0.67 0.645 0.625 0.605Book value per common share . . . . . . . . . . . . . . . . $ 15.76 12.89 10.05 11.12 8.82Average common shares . . . . . . . . . . . . . . . . . . . . 33,547 33,365 35,718 35,489 33,703Average common shares and common share
equivalents . . . . . . . . . . . . . . . . . . . . . . . . . . . . 34,182 34,180 36,527 36,546 33,899
(a) See accompanying Notes to Consolidated Financial Statements
(b) Income from continuing operations plus interest on long-term liabilities net of income taxes as a percentage oftotal assets less current liabilities
(c) Income from continuing operations as a percentage of shareholders’ equity
17

Item 7. Management’s Discussion and Analysis of Financial Condition and Results
of Operations
In this annual report, all amounts related to U.S. and foreign currency and to the number of shares of NordsonCorporation Common Shares, except for per share earnings and dividend amounts, are expressed in thousands.
Critical Accounting Policies and EstimatesThe Company’s consolidated financial statements and accompanying notes have been prepared in accordance withaccounting principles generally accepted in the United States. The preparation of these financial statements requiresthe Company’s management to make estimates, judgments and assumptions that affect reported amounts of assets,liabilities, revenues and expenses. On an ongoing basis, the Company evaluates the accounting policies andestimates it uses to prepare financial statements. The Company bases its estimates on historical experience andassumptions believed to be reasonable under current facts and circumstances. Actual amounts and results coulddiffer from these estimates used by management.
Certain accounting policies that require significant management estimates and are deemed critical to theCompany’s results of operations or financial position are discussed below. On a regular basis, the Companyreviews critical accounting policies with the Audit Committee of the board of directors.
Revenue Recognition — Most of the Company’s revenues are recognized upon shipment, provided that per-suasive evidence of an arrangement exists, the sales price is fixed or determinable, collectibility is reasonably assured,and title and risk of loss have passed to the customer. Revenues from contracts with multiple element arrangements,such as those including installation or other services, are recognized as each element is earned based on objectiveevidence of the relative fair value of each element. If the installation or other services are inconsequential to thefunctionality of the delivered product, the entire amount of revenue is recognized upon satisfaction of the criterianoted above. Inconsequential installation or other services are those that can generally be completed in a shortperiod of time, at insignificant cost, and the skills required to complete these installations are not unique to theCompany. If installation or other services are essential to the functionality of the delivered product, revenuesattributable to these obligations are deferred until completed. Amounts received in excess of revenue recognized areincluded as deferred revenue within accrued liabilities in the accompanying balance sheets. Revenues deferred infiscal years 2007, 2006 and 2005 were not material.
Goodwill — Goodwill represents the excess of purchase price over the fair value of tangible and identifiableintangible net assets acquired. At October 31, 2007, and October 31, 2006, goodwill represented 47 percent and40 percent, respectively, of the Company’s total assets. The majority of the goodwill resulted from the acquisition ofDage Holdings, Limited in fiscal 2007 and EFD Inc. in fiscal 2001. In accordance with FASB Statement No. 142,“Goodwill and Other Intangible Assets,” goodwill is not amortized but is tested for impairment annually at thereporting unit level, or more often if indications of impairment exist. The estimated fair value of a reporting unit isdetermined by applying appropriate discount rates to estimated future cash flows and terminal value amounts for thereporting units. The results of the Company’s analyses indicated no impairment of goodwill exists.
Inventories — Inventories are valued at the lower of cost or market. Cost has been determined using thelast-in, first-out (LIFO) method for 28 percent of the Company’s consolidated inventories at October 31, 2007,and 37 percent at October 31, 2006, with the first-in, first-out (FIFO) method used for the remaining inventory.On an ongoing basis, the Company tests its inventory for technical obsolescence, as well as for future demand andchanges in market conditions. The Company has historically maintained inventory reserves to reflect thoseconditions when the cost of inventory is not expected to be recovered. The Company also maintains inventoryreserves for inventory used for demonstration purposes. Amounts expensed related to inventory reserves were$2,725, $2,210 and $2,896 in fiscal years 2007, 2006 and 2005, respectively. The reserve balance was $11,117,$7,499 and $7,126 at the end of fiscal years 2007, 2006 and 2005, respectively. The fiscal 2007 increase is traced toacquisitions and currency changes.
Pension Plans and Postretirement Medical Plan — The measurement of liabilities related to the Company’spension plans and postretirement medical plan is based on management’s assumptions related to future factors,
18

including interest rates, return on pension plan assets, compensation increases, mortality and turnover assumptionsand health care cost trend rates.
Effective October 31, 2007, the Company adopted the recognition and disclosure provisions of Statement ofFinancial Accounting Standards No. 158, Employers Accounting for Defined Benefit Pension and Other Pos-tretirement Plans — an amendment of FASB Statements No. 87, 88, 106 and 132(R) (FAS 158). This Statementrequires employers to recognize the overfunded or underfunded status of defined benefit post-retirement plans intheir balance sheets. This amount is measured as the difference between the fair value of plan assets and the benefitobligation of the plans (the projected benefit obligation for pension plans and the accumulated post-retirementbenefit obligation for other post-retirement plans). Changes in the funded status of the plans are recognized in theyear in which the change occurs through accumulated other comprehensive income. Under FAS 158, gains andlosses, prior service costs and credits, and any remaining transition amounts under FAS No. 87, Employers’Accounting for Pensions and FAS No. 106, Employers Accounting for Postretirement Benefits Other ThanPensions, that have not yet been recognized through net periodic benefit cost are recognized in accumulated othercomprehensive income, net of tax effects.
The weighted-average discount rate used to determine the present value of the Company’s domestic pension planobligations was 6.25 percent at October 31, 2007, compared to 6.00 percent at October 31, 2006. The discount ratefor these plans, which comprised 75 percent of the worldwide pension obligations at October 31, 2007, was based onquality fixed income investments with a duration period approximately equal to the period over which pensionobligations are expected to be settled. The weighted-average discount rate used to determine the present value of theCompany’s various international pension plan obligations was 5.00 percent at October 31, 2007, compared to4.28 percent at October 31, 2006. The discount rates used for the international plans were determined by usingquality fixed income investments.
In determining the expected return on plan assets, the Company considers both historical performance and anestimate of future long-term rates of return on assets similar to those in the Company’s plans. The Companyconsults with and considers the opinions of financial and actuarial experts in developing appropriate returnassumptions. The expected rate of return (long-term investment rate) on domestic pension assets was 8.48 percentfor fiscal year 2007 8.50 percent for fiscal 2006. The average expected rate of return on international pension assetsdecreased to 4.99 percent in fiscal 2007 from 5.41 percent in fiscal 2006.
The assumed rate of compensation increases for domestic employees was 3.30 percent in fiscal 2007, the same asfiscal 2006. The assumed rate of compensation increases for international employees was 3.36 percent in fiscal 2007,compared to 3.13 percent in fiscal 2006.
Annual expense amounts are determined based on the discount rate used at the end of the prior year. Differencesbetween actual and assumed investment returns on pension plan assets result in actuarial gains or losses that areamortized into expense over a period of years.
With respect to the domestic postretirement medical plan, the discount rate used to value the benefit obligationincreased from 6.00 percent at October 31, 2006, to 6.25 percent at October 31, 2007. The annual rate of increase inthe per capita cost of covered benefits (the health care cost trend rate) is assumed to be 8.00 percent in fiscal 2008,decreasing gradually to 5.00 percent in fiscal 2011. The health care cost trend rate assumption has a significant effecton the amounts reported. For example, a one-percentage point change in the assumed health care cost trend ratewould have the following effects:
1% Point Increase 1% Point Decrease
Effect on total service and interest cost componentsin fiscal 2007 . . . . . . . . . . . . . . . . . . . . . . . . . . . . . . . . . . . . $ 622 $ (499)
Effect on postretirement obligation as of October 31, 2007 . . . . $6,173 $(5,041)
Employees hired after January 1, 2002, are not eligible to participate in the domestic postretirement medical plan.
The Company expects that pension and postretirement expenses in fiscal 2008 will be approximately $2,000 lowerthan fiscal 2007, primarily reflecting changes in actuarial assumptions.
19

Financial Instruments — Assets, liabilities and commitments that are to be settled in cash and are denominated inforeign currencies are sensitive to changes in currency exchange rates. The Company enters into foreign currencyforward contracts, which are derivative financial instruments, to reduce the risk of foreign currency exposuresresulting from the collection of receivables, payables and loans denominated in foreign currencies. The maturities ofthese contracts are usually less than 90 days. Forward contracts are marked to market each accounting period, andthe resulting gains or losses are included in “other — net” within other income (expense) on the ConsolidatedStatement of Income.
Warranties — The Company provides customers with a product warranty that requires the Company to repair orreplace defective products within a specified period of time (generally one year) from the date of delivery or first use.An accrual is recorded for expected warranty costs for products shipped through the end of each accounting period.In determining the amount of the accrual, the Company relies primarily on historical warranty claims by productsold. Amounts charged to the warranty reserve were $5,702, $6,092 and $4,090 in fiscal years 2007, 2006 and 2005,respectively. The reserve balance was $5,784, $4,917 and $3,989 at the end of fiscal years 2007, 2006 and 2005,respectively.
Long-Term Incentive Compensation Plan (LTIP) — Under the long-term incentive compensation plan,executive officers and selected other employees receive cash or stock payouts based solely on corporate performancemeasures over three-year performance periods. Payouts vary based on the degree to which corporate performanceequals or exceeds predetermined threshold, target and maximum performance levels at the end of a performanceperiod. No payout will occur unless the Company equals or exceeds certain threshold performance objectives.
For the fiscal 2005-2007 performance period, payouts will be in cash based upon the share price of the Company’sCommon Shares on October 31, 2007.
Over the three-year performance period, costs were accrued based upon current performance projections for thethree-year period and the percentage of the requisite service that has been rendered, along with changes in value ofthe Company’s Common Shares. The method of estimating accrual amounts was revised upon adoption ofFAS 123(R), however the cumulative effect of the change was not material. The accrual for this performance periodcontinues to be classified as accrued liabilities. At October 31, 2007, the liability for the plan originating in fiscal2005 was $3,590.
For the fiscal 2006-2008 and the fiscal 2007-2009 performance periods, payouts will be in Common Shares. Theamount of compensation expense is based upon current performance projections for each three-year period and thepercentage of the requisite service that has been rendered. The calculation is also based upon the weighted-averagevalue of the Company’s Common Shares at the dates of grant. These payouts are recorded as capital in excess ofstated value in shareholders’ equity. The amount recorded at October 31, 2007 for the plans originating in fiscalyears 2006 and 2007 was $4,721.
Compensation expense attributable to all LTIP performance periods for fiscal years 2007, 2006 and 2005 was$4,606, $5,456 and $4,237, respectively.
Discontinued OperationsOn October 13, 2006, the Company entered into an agreement to sell its Fiber Systems Group to Saurer Ltd. for$5,966. The Fiber Systems Group was acquired in fiscal 1998 as part of the acquisition of J&M Laboratories as ameans of expanding the Adhesive Dispensing Systems segment. However, due to the changing competitiveenvironment, the Fiber Systems Group did not meet the Company’s financial performance objectives. The saleenabled the Company to concentrate its activities on better performing or faster growing product lines. Proceeds of$5,411 were received on the closing date, with the remaining $555 to be paid over an 18-month period following theclosing date. In accordance with FASB Statement of Accounting Standards No. 144, the results of this businesshave been classified as discontinued operations. Accordingly, the revenues, costs and expenses, assets and liabilities,and cash flows of this business have been segregated in the Consolidated Statements of Income, ConsolidatedBalance Sheets and Consolidated Statements of Cash Flows.
20
Sales of the discontinued operations were $5,919 and $6,983 for fiscal years 2006 and 2005, respectively. The netloss from operations was $9,882 and $6,172 for fiscal years 2006 and 2005, respectively. Included in the fiscal 2006loss from discontinued operations was severance expense of $699 related to 27 employees of the Fiber SystemsGroup that were not hired by Saurer Ltd. Also, included in the fiscal 2006 loss from discontinued operations is therecognition of an impairment of an intangible asset of $2,630. A gain of $2,813 was recognized on the sale of theassets. The net tax benefit of $1,872 on disposal is the result of $2,867 tax expense on one-time gains resulting fromthe disposal, offset by $4,739 tax benefit resulting from an excess of tax basis over book basis in Fiber Systems Groupassets.
Fiscal Years 2007 and 2006Sales — Worldwide sales for fiscal 2007 were $993,649, an increase of 11.4 percent from fiscal 2006 sales of$892,221. Acquisitions accounted for 7.9 percentage points of the growth, while sales volume of base businessesincreased 0.1 percent. Favorable currency effects caused by the weaker U.S. dollar increased sales by an additional3.4 percent.
Historically, the Company reported its results in three operating segments: Adhesive Dispensing Systems,Advanced Technology Systems, and Finishing and Coating Systems. In the third quarter of fiscal 2007, theCompany announced an organizational restructuring in which the portion of the Adhesive Dispensing Systemssegment serving the automotive industry was combined with the Finishing and Coating Systems segment to formthe newly named Industrial Coating and Automotive Systems segment. The operations of this segment areheadquartered in Amherst, Ohio, are managed by the same executive and share certain resources (engineering, salesand factories). Prior fiscal year results have been reclassified to reflect the segment change.
All three segments reported higher sales volume in fiscal 2007 compared to fiscal 2006. Sales of the AdhesiveDispensing Systems segment were $509,568 in fiscal 2007, an increase of $30,710, or 6.4 percent, from fiscal 2006.Sales volume was up 1.7 percent, while currency effects increased reported sales by 4.7 percent. The increase in salesvolume can be traced to higher system sales in several geographic regions, most notably Asia Pacific. Sales of theAdvanced Technology Systems segment were $300,719 in fiscal 2007, an increase of $61,461, or 25.7 percent fromfiscal 2006. Acquisitions generated a volume increase of 29.3 percent, while sales volume of base product lines wasdown 5.0 percent. Favorable currency translation rates contributed 1.4 percent to sales growth within this segment.Sales within this segment were impacted by weakness in the semiconductor and electronic assembly markets.Industrial Coating and Automotive Systems segment sales in fiscal 2007 were $183,362, an increase of $9,257, or5.3 percent, from the prior year. This increase can be traced to a volume increase of 2.7 percent and favorablecurrency effects of 2.6 percent. The volume increase can be traced to higher system sales in Japan and Asia Pacific.
It is estimated that the effect of pricing on total revenue was neutral relative to the prior year.
Sales outside the United States accounted for 69.3 percent of total fiscal 2007 sales, up from 67.4 percent in fiscal2006. Sales volume in fiscal 2007 exceeded that of fiscal 2006 in all five geographic regions, largely driven byacquisitions. Sales volume was up 14.1 percent in Japan, 11.4 percent in the Americas, 11.3 percent in Asia,7.2 percent in Europe and 4.7 percent in the United States. Currency affects favorably impacted sales in theAmericas, Asia and Europe regions but negatively impacted sales in Japan.
Operating profit — Cost of sales in fiscal 2007 was $439,804, up 15.8 percent from fiscal 2006, due primarily tothe increase in sales volume. Currency effects increased cost of sales by 2.8 percent. Gross margins, expressed as apercent of sales, decreased to 55.7 percent in fiscal 2007 from 57.4 percent in fiscal 2006. The fiscal 2007 percentagewas negatively impacted by short-term inventory purchase accounting adjustments related to the acquisitions thatreduced the margin percentage by approximately 0.9 percent. These adjustments were partially offset by favorablecurrency effects that increased the gross margin rate by 0.3 percent. Changes in product mix also contributed to theoverall margin percentage decrease.
Selling and administrative expenses, excluding severance and restructuring costs, were $401,294 in fiscal 2007, anincrease of $39,115, or 10.8 percent, from fiscal 2006. Acquisitions and associated purchase accounting adjustmentsfor property, plant and equipment and intangible assets increased selling and administrative expenses by 6.9 percent,
21

and currency translation effects increased these expenses by 2.8 percent. The remainder of the increase was largelydue to higher compensation and product development costs. Selling and administrative expenses as a percentage ofsales decreased to 40.4 percent in fiscal 2007 from 40.6 percent in fiscal 2006, reflecting ongoing Lean efforts andrevenue increases that were supported by existing capacity.
Operating profit margins, expressed as a percent of sales, decreased to 15.3 percent in fiscal 2007 from 16.5 percentin fiscal 2006. Purchase accounting adjustments for inventory; property, plant and equipment; and intangible assetsassociated with fiscal 2007 acquisitions reduced operating profit margins by 1.2 percent.
Segment operating profit margins in fiscal years 2007 and 2006 were as follows:
Segment 2007 2006
Adhesive Dispensing Systems . . . . . . . . . . . . . . . . . . . . . . . . . . . . . . . . . . . . . . . . . . 23.2% 22.8%Advanced Technology Systems . . . . . . . . . . . . . . . . . . . . . . . . . . . . . . . . . . . . . . . . . . 13.5% 23.8%Industrial Coating and Automotive Systems . . . . . . . . . . . . . . . . . . . . . . . . . . . . . . . . 9.6% 5.9%
Operating capacity for each of our segments can support increases or decreases in order activity without significantchanges in operating costs. Also, currency translation affects reported operating margins. Operating margins foreach of our segments were favorably impacted from a weaker dollar during the year.
Operating profit as a percentage of sales for the Adhesive Dispensing Systems segment was 23.2 percent, up from22.8 percent in fiscal 2006. The increase can be traced to the increased sales volume and to favorable currency rates.In March 2007, the Company announced that it would close a manufacturing operation located in Talladega,Alabama and move production activities to other Nordson facilities that are closer to supplier locations. Totalseverance costs for the 36 affected employees will be approximately $541 and are being recorded over the futureservice period of April 2007 through March 2008. The expense amount recorded in fiscal 2007 was $433.
During fiscal 2006, the Company realigned the management of its Adhesive Dispensing Systems segment, whichresulted in the elimination of nine positions. These actions better positioned the segment to achieve its growthobjectives. Total costs recorded in fiscal 2006 attributable to the position eliminations were $429.
Operating profit as a percentage of sales for the Advanced Technology Systems segment decreased to 13.5 percentin fiscal 2007 from 23.8 percent in fiscal 2006. The operating profit of this segment was impacted by approximately$11,800 of purchase accounting adjustments for inventory; property, plant and equipment; and intangible assetsrelated to the fiscal 2007 acquisitions and by reduced demand in certain end markets, which resulted in lowerabsorption of fixed expenses. Sales mix also contributed to the decrease in the operating profit percentage from theprior year. In an effort to improve efficiencies in operations serving the curing and drying market, the Companyeliminated 13 positions in the Advanced Technology Systems segment second half of fiscal 2006. Total costsattributable to the position eliminations were $380.
Operating profit as a percentage of sales for the Industrial Coating and Automotive Systems segment was9.6 percent in fiscal 2007, up from 5.9 percent in fiscal 2006. The improvement in the operating profit percentage isprimarily due to sales volume increasing at a rate greater than operating costs. In addition, during the fourth quarterof fiscal 2005, the Company began a number of restructuring actions to improve performance and reduce costs inthis segment. These actions, which included operational consolidations and approximately 60 personnel reductions,were completed in the fourth quarter of fiscal 2006. As a result of these actions, this segment now operates withlower costs and improved operating performance. The fiscal 2006 results include $1,818 of severance andrestructuring costs.
Interest and other income (expense) — Interest expense in fiscal 2007 was $21,542, an increase $9,525, or79.3 percent from fiscal 2006 due to higher borrowing levels resulting from the four acquisitions made during fiscal2007. Interest and investment income in fiscal 2007 was $1,505, down from $1,867 in the prior year. The prior yearamount included income of $898 from an income tax refund. Other income was $3,617 in fiscal 2007, as opposed toother expense of $1,031 in fiscal 2006. The current year amount included a $3,038 gain on the sale-leaseback of realestate. Included in other income (expense) are currency losses of $1,028 in fiscal 2007 and $1,796 in fiscal 2006.
22

Income taxes — The Company’s effective income tax rate on continuing operations was 33.2 percent in fiscal 2007,up from 28.4 percent in fiscal 2006. The fiscal 2006 rate reflects the approval by the Joint Committee on Taxation ofan income tax refund of approximately $3,100. The increase in the effective tax rate is also due to higher tax rates onforeign income and a lower extraterritorial income exclusion.
Net income — Income from continuing operations was $90,692, or $2.65 per diluted share in fiscal 2007. Thiscompares to income from continuing operations of $97,667, or $2.86 per diluted share in fiscal 2006. Thisrepresents a 7.1 percent decrease in income from continuing operations and a 7.3 percent decrease in earnings pershare from continuing operations. Net income, including discontinued operations, was $90,598, or $2.65 perdiluted share in fiscal 2006.
Recently issued accounting standards — In May 2005, the FASB issued Statement of Financial AccountingStandards No. 154, “Accounting Changes and Error Corrections” (FAS 154). This Statement replaces AccountingPrinciples Board Opinion No. 20, “Accounting Changes,” and FASB Statement No. 3, “Reporting AccountingChanges in Interim Financial Statements,” and changes the accounting for and reporting of a change in accountingprinciple. FAS 154 applies to all voluntary changes in accounting principles and to changes required by anaccounting pronouncement when specific transition provisions are not provided. The Statement requires retro-spective application to prior periods’ financial statements for changes in accounting principle, unless it is imprac-ticable to determine the period specific or cumulative effect of the change. The Company adopted FAS 154 in fiscal2007. The adoption had no effect on the Company’s results of operations or financial position.
In June 2006, the FASB issued FASB Interpretation No. 48, “Accounting for Uncertainty in Income Taxes,”(FIN 48) an interpretation of FASB Statement No. 109, “Accounting for Income Taxes.” FIN 48 clarifies theaccounting for uncertain income tax positions that are recognized in a company’s financial statements. FIN 48 alsoprovides guidance on financial statement classification, accounting for interest and penalties, accounting for interimperiods and new disclosure requirements. The Company will adopt FIN 48 in the first quarter of fiscal 2008. TheCompany has not yet determined the impact of adoption on its results of operations or financial position.
In September 2006, the FASB issued Statement of Financial Accounting Standards No. 157, “Fair ValueMeasurements” (FAS 157). This Statement provides a common definition of fair value and establishes a frameworkto make the measurement of fair value in generally accepted accounting principles more consistent and comparable.It also requires expanded disclosures to provide information about the extent to which fair value is used to measureassets and liabilities, the methods and assumptions used to measure fair value, and the effect of fair value measureson earnings. FAS 157 is effective for the Company’s 2009 fiscal year, although early adoption is permitted. TheCompany has not yet determined the impact of adoption on its results of operations or financial position.
In September 2006, the FASB issued Statement of Financial Accounting Standards No. 158, “Employers’Accounting for Defined Benefit Pension and Other Postretirement Plans” (FAS 158) an amendment of FASBStatements No. 87, 88, 106 and 132(R). This Statement requires an entity to recognize the overfunded orunderfunded status of a defined benefit postretirement plan as an asset or liability in its statement of financialposition and to recognize changes in the funded status in the year in which the changes occur in othercomprehensive income. This Statement also requires an employer to measure the funded status of a plan as ofthe date of its year-end statement of financial position. As discussed in Note 4, the Company adopted therequirement to recognize the funded status of its defined benefit postretirement plans and the disclosurerequirements of FAS 158 as of October 31, 2007. The effect of adopting FAS 158 on individual line items ofthe Company’s balance sheet is disclosed in Note 4. The adoption did not impact the Company’s results ofoperations or cash flows. The Company previously complied with the requirement to measure plan assets andbenefit obligations as of the date its fiscal year-end statement of financial position.
In September 2006, the SEC staff issued Staff Accounting Bulletin No. 108, “Considering the Effects of Prior YearMisstatements when Quantifying Misstatements in Current Year Financial Statements” (SAB 108). SAB 108 wasissued in order to eliminate the diversity in practice surrounding how public companies quantify financial statementmisstatements. SAB 108 requires that registrants quantify errors using both a balance sheet and income statementapproach and evaluate whether either approach results in a misstated amount that, when all relevant quantitative
23

and qualitative factors are considered, is material. The Company adopted SAB 108 in fiscal 2007. The adoption hadno effect on the Company’s results of operations or financial position.
In February 2007, the FASB issued Statement of Financial Accounting Standards No. 159, “The Fair Value Optionfor Financial Assets and Financial Liabilities — Including an amendment of FASB Statement No. 115” (FAS 159).This Statement permits entities to choose to measure many financial instruments and certain other items at fairvalue and report unrealized gains and losses on these instruments in earnings. The Company must adopt FAS 159 infiscal 2009 and has not yet determined the impact of adoption on its results of operations or financial position.
In December 2007, the FASB issued Statement of Financial Accounting Standards No. 141(R), “BusinessCombinations” (FAS 141(R)). This Statement provides greater consistency in the accounting and financialreporting of business combinations. It requires the acquiring entity in a business combination to recognize allassets acquired and liabilities assumed in the transaction, establishes the acquisition-date fair value as themeasurement objective for all assets acquired and liabilities assumed, and requires the acquirer to disclose thenature and financial effect of the business combination. The Company must adopt FAS 141(R) in fiscal 2010 andhas not yet determined the impact of adoption on its results of operations or financial position.
In December 2007, the FASB issued Statement of Financial Accounting Standards No. 160, “NoncontrollingInterests in Consolidated Financial Statements” (FAS 160). This Statement amends Accounting ResearchBulletin No. 51, “Consolidated Financial Statements”, to establish accounting and reporting standards for thenoncontrolling interest in a subsidiary and for the deconsolidation of a subsidiary. The Company must adoptFAS 160 in fiscal 2010 and has not yet determined the impact of adoption on its results of operations or financialposition.
Fiscal Years 2006 and 2005Sales — Worldwide sales for fiscal 2006 were $892,221, an increase of 7.2 percent from fiscal 2005 sales of$832,179. Sales volume increased 8.5 percent, offset by unfavorable currency effects of 1.3 percent related to thestronger U.S. dollar.
The Company is organized into three business segments: Adhesive Dispensing Systems, Advanced TechnologySystems and Industrial Coating and Automotive Systems. All three reported higher sales volume in fiscal 2006compared to fiscal 2005. Sales of the Adhesive Dispensing Systems segment were $478,959 in fiscal 2006, anincrease of $19,563, or 4.3 percent, from fiscal 2005. Sales volume was up 6.3 percent, while currency effects reducedreported sales by 2.0 percent. Sales of the Advanced Technology Systems segment were $239,258 in fiscal 2006, anincrease of $39,451, or 19.7 percent from fiscal 2005. Sales volume increased 20.1 percent, while currency effectsreduced sales by 0.4 percent. Within this segment, the sales volume increase was attributable to strength in theelectronics market in Asia Pacific. Industrial Coating and Automotive Systems segment sales in fiscal 2006 were$174,105, an increase of $1,028, or 0.6 percent, from the prior year. This increase can be traced to a volume increaseof 1.4 percent offset by negative currency effects of 0.8 percent. Volume increases were seen throughout thissegment, except for automotive, with liquid system sales being particularly strong. It is estimated that the effect ofpricing on total revenue was neutral relative to the prior year.
Sales outside the United States accounted for 67.4 percent of total fiscal 2006 sales, up slightly from 66.5 percent infiscal 2005. Sales volume in fiscal 2006 exceeded that of fiscal 2005 in all five geographic regions, with the largestincrease generated in the Asia Pacific region, where sales volume increased 27.4 percent. Sales volume was up4.4 percent in the United States, 6.8 percent in the Americas, 7.6 percent in Europe and 3.8 percent in Japan. Theseincreases can be traced largely to the Advanced Technology Systems segment.
Operating profit — Cost of sales in fiscal 2006 was $379,800, up 4.7 percent from fiscal 2005, due primarily to avolume increase of 5.5 percent, offset by currency effects that reduced cost of sales by 0.8 percent. Gross margins,expressed as a percent of sales, increased to 57.4 percent in fiscal 2006 from 56.4 percent in fiscal 2005. The increasewas driven by favorable product mix and productivity improvements. Currency effects reduced the margin rate byapproximately 0.3 percent.
24

Selling and administrative expenses were $362,179 in fiscal 2006, an increase of $24,397, or 7.2 percent, from fiscal2005. The increase is primarily due to compensation increases and higher employee benefit costs. Other chargestotaling $6,510 for stock option expense and for remediation costs related to a Wisconsin landfill also impactedfiscal 2006 selling and administrative expenses. Selling and administrative expenses were 40.6 percent of sales inboth fiscal years 2006 and 2005, reflecting ongoing Lean efforts and revenue increases that were supported byexisting capacity. Currency effects reduced selling and administrative expenses by 1.0 percent.
Effective in fiscal 2006, the Company adopted the fair value recognition provisions of FAS 123(R) using themodified prospective transition method, resulting in stock option expenses of $3,675 for the year. Under themodified prospective transition method, compensation costs in fiscal 2006 include cost for options granted prior tobut not vested as of October 31, 2005, and unvested options granted in fiscal 2006. Compensation expense is beingrecognized in selling and administrative expenses on a straight-line basis over the total requisite service period ofeach option grant. Prior to fiscal 2006, the Company accounted for its stock options under the recognition andmeasurement principles of APB Opinion No. 25, “Accounting for Stock Issued to Employees.” No stock optionexpense was reflected in net income, as all options granted under these plans had an exercise price equal to the fairmarket value of the underlying Common Shares on the date of grant.
The Company has voluntarily agreed with the City of New Richmond, Wisconsin and other PotentiallyResponsible Parties (“PRP”) to share costs associated with the remediation of the City of New Richmondmunicipal landfill (the “Site”) and providing clean drinking water to the affected residential properties downgradient of the Site. The Feasibility Study / Remedial Investigation for this project was completed and approved bythe Wisconsin Department of Natural Resources (“WDNR”) in September 2006. The Company accrued $2,835 ofexpense in the third quarter of fiscal 2006, its best estimate of its obligation with respect to remediation of the Siteand constructing a potable water delivery system serving the impacted area down gradient of the Site. This amountwas recorded in selling and administrative expenses.
Operating profit margins, expressed as a percent of sales, were 16.5 percent in fiscal 2006 compared to 15.7 percentin fiscal 2005. Segment operating profit margins in fiscal years 2006 and 2005 were as follows:
Segment 2006 2005
Adhesive Dispensing Systems. . . . . . . . . . . . . . . . . . . . . . . . . . . . . . . . . . . . . . . . . . . 22.8% 22.5%Advanced Technology Systems . . . . . . . . . . . . . . . . . . . . . . . . . . . . . . . . . . . . . . . . . . 23.8% 20.8%Industrial Coating and Automotive Systems . . . . . . . . . . . . . . . . . . . . . . . . . . . . . . . . 5.9% 2.7%
Operating capacity for each of our segments can support increases or decreases in order activity without significantchanges in operating costs. Also, currency translation affects reported operating margins. Operating margins foreach of our segments were negatively impacted from a stronger dollar during the year.
During the second quarter of fiscal 2006, the Company realigned the management of its Adhesive DispensingSystems segment, which resulted in the elimination of nine positions. These actions better positioned the segmentto achieve its growth objectives. Total costs attributed to the position eliminations were $429.
Sales volume of the Advanced Technology Systems segment improved at a rate greater than operating costs,resulting in an increase in the operating profit percentage. In an effort to improve efficiencies in operations servingthe curing and drying market, the Company eliminated 13 positions in the Advanced Technology Systems segmentsecond half of fiscal 2006. Total severance costs of $380 were paid in fiscal 2006.
The improvement in the Industrial Coating and Automotive Systems segment operating profit is primarily due tosales volume increasing at a rate greater than operating costs. In addition, during the fourth quarter of fiscal 2005,the Company began a number of restructuring actions to improve performance and reduce costs in this segment.These actions, which included operational consolidations and approximately 60 personnel reductions, werecompleted in the fourth quarter of fiscal 2006. As a result of these actions, resources are more effectively alignedwith shifting patterns of global demands, enabling the segment to operate both with lower costs and bettercapability to serve customers in the faster growing emerging markets. Total restructuring costs were $2,693, ofwhich $875 was recorded in the fourth quarter of fiscal 2005, and the remainder was recorded in fiscal 2006.
25

Substantially all of the $2,693 of expense was associated with cash expenditures for severance payments toterminated employees.
Interest and other income (expense) — Interest expense in fiscal 2006 was $12,017, a decrease of 13.1 percentfrom fiscal 2005 due to lower borrowing levels. Interest and investment income in fiscal 2006 was $1,867, up from$1,826 in the prior year. Interest income of $898 on an income tax refund in fiscal 2006 was offset by lower interestincome from cash equivalents and marketable securities. Other expense was $1,031 in fiscal 2006, as opposed toother income of $1,586 in fiscal 2005. Included in these amounts were currency losses of $1,796 in fiscal 2006, and$705 in fiscal 2005.
Income taxes — The Company’s effective income tax rate on continuing operations was 28.4 percent in fiscal 2006,down from 29.7 percent in fiscal 2005. The fiscal 2006 rate reflects the approval by the Joint Committee on Taxationof an income tax refund of approximately $3,100, which was treated as a discrete event in the third quarter. Thefiscal 2005 tax rate was impacted by the reversal of a valuation allowance on foreign tax credits of $7,367, offsetsomewhat by a lower extraterritorial income exclusion and a higher state income tax provision.
Net income — Income from continuing operations was $97,667, or $2.86 per diluted share in fiscal 2006. Thiscompares to income from continuing operations of $84,510, or $2.31 per diluted share in fiscal 2005. This represents a15.6 percent increase in income from continuing operations and a 23.8 percent increase in earnings per share fromcontinuing operations. The per-share increase was impacted by the repurchase of approximately 10 percent of theCompany’s outstanding common shares in September 2005. Net income, including discontinued operations was$90,598, or $2.65 per diluted share in fiscal 2006, compared to $78,338, or $2.14 per diluted share in fiscal 2005.
Liquidity, Capital Expenditures and Sources of CapitalDuring fiscal 2007 the Company made four acquisitions that used cash of $325,245. Existing lines of credit and cashwere used for the purchases. These transactions were the primary reason for the decrease in cash and cashequivalents of $17,723 during fiscal 2007.
Cash generated by operations in fiscal 2007 was $124,248, up from $120,024 last year. The primary sources of cashwere net income and non-cash expenses offset by changes in operating assets and liabilities. The increase in year-endreceivables is traced to significantly higher sales in the fourth quarter of fiscal 2007 compared to fiscal 2006. Theinventory increase is primarily due to acquisitions. Net long-term deferred taxes decreased during fiscal 2007 largelyas a result of recording deferred tax liabilities related to acquisition purchase accounting adjustments. Othernoncurrent assets increased due to the funding of a deferred compensation obligation.
In fiscal 2007, the Company adopted FAS 158. This Statement requires an entity to recognize the overfunded orunderfunded status of a defined benefit postretirement plan as an asset or liability in its statement of financialposition and to recognize changes in the funded status in the year in which the changes occur in othercomprehensive income. The adoption of FAS 158 resulted in an increase of $25,384 in long-term pension andretirement obligations, an increase of $13,113 in postretirement obligations and a decrease of $8,895 in currentliabilities. Within long-term liabilities, other liabilities increased primarily due to higher deferred compensation.
Cash used by investing activities was $348,109 in fiscal 2007, compared to $7,195 in fiscal 2006. In addition toacquisitions, which used $325,245 of cash, capital expenditures increased from $13,610 last year to $31,017 in fiscal2007. Included in the capital expenditures are the purchase of two buildings, one in the U.S. and one in China. Thebuilding purchased in the U.S. permits the consolidation of the Company’s Rhode Island operations into onelocation. The building purchased in China replaced a leased facility also located in China. The remainder of thefiscal 2007 capital expenditures was concentrated on global information systems and on machinery and equipmentin China. In fiscal 2006, cash of $5,411 was generated from the sale of the Fiber Systems Group.
Cash provided by financing activities in fiscal 2007 was $202,224. Net proceeds of $281,293 from short-termborrowings were used for four acquisitions, capital expenditures, scheduled repayments of $54,290 of long-termdebt, dividend payments to shareholders of $23,481, and the repurchase $9,090 of the Company’s Common Shares.Total dividend payments increased $1,109 from fiscal 2006 due to an increase in the per-share amount of 4.5 percentfrom fiscal 2006. Issuance of Common Shares related to the exercise of stock options generated $9,264 of cash.
26

The following table summarizes the Company’s obligations as of October 31, 2007:
Obligations TotalLess than
1 Year 1-3 Years 4-5 YearsAfter
5 Years
Payments Due by Period
Long-term debt . . . . . . . . . . . . . . . . . . . $ 47,130 $ 24,290 $ 8,580 $14,260 $ —Capital lease obligations . . . . . . . . . . . . . 17,027 6,856 6,232 767 3,172Operating leases . . . . . . . . . . . . . . . . . . . 36,556 10,730 12,110 5,549 8,167Notes payable . . . . . . . . . . . . . . . . . . . . . 299,809 299,809 — — —Interest payments on long-term debt. . . . 6,536 2,614 3,342 580 —Contributions related to pension and
postretirement benefits*. . . . . . . . . . . . 13,000 13,000 — — —Purchase obligations . . . . . . . . . . . . . . . . 43,148 42,684 464 — —
Total obligations. . . . . . . . . . . . . . . . . . . $463,206 $399,983 $30,728 $21,156 $11,339
*Pension and postretirement plan funding amounts after fiscal 2008 will be determined based on the future fundedstatus of the plans and therefore cannot be estimated at this time.
Nordson has various lines of credit with both domestic and foreign banks. At October 31, 2007, these lines totaled$515,393, of which $215,584 was unused. Included in the total amount of $515,393 was a $400,000 unsecured,multicurrency credit facility with a group of banks that was entered into in July 2007 and expires in fiscal 2012. Thisfacility may be increased by $100,000 to $500,000 under certain conditions and replaced the Company’s existing$300,000 facility that was scheduled to expire in fiscal 2009. At the end of fiscal 2007, $280,000 was outstandingunder this facility, while there were no borrowings outstanding under the previous facility at the end of fiscal 2006.There are two primary financial covenants that the Company must meet under the new facility. The first covenantlimits the amount of additional debt the Company can incur to 3.5 times EBITDA (both debt and EBITDA asdefined in the credit agreement). At the end of fiscal 2007, this covenant would not have limited the amount theCompany could borrow under this facility. The second covenant requires EBITDA to be at least three times interestexpense (both as defined in the credit agreement). For fiscal 2007, EBITDA was 9.0 times interest expense. TheCompany was in compliance with all of its debt covenants at October 31, 2007.
The Company believes that the combination of present capital resources, internally generated funds and unusedfinancing sources are more than adequate to meet cash requirements for fiscal 2008. There are no significantrestrictions limiting the transfer of funds from international subsidiaries to the parent Company.
The board of directors authorized the Company to repurchase up to 1,000 of the Company’s Common Shares over athree-year period beginning November 2006. The board of directors amended this resolution in August 2007 topermit the Company to enter into written agreements with independent third party brokers to purchase CommonShares on the open market or in privately negotiated transactions. Uses for repurchased shares include the fundingof benefit programs, including stock options, restricted stock and 401(k) matching. Shares purchased are treated astreasury shares until used for such purposes. The repurchase program is funded using the Company’s workingcapital. During fiscal 2007, the Company repurchased 139 of the shares authorized to be repurchased under thisprogram for $6,850.
OutlookThe Company’s priorities for fiscal 2008 are focused upon realizing the returns on the investments made in fiscal2007. Economic uncertainties in the United States and other developed economies, rising energy costs and a weakhousing market may act to temper consumer demand and indirectly affect capital investments by our customers.However, with major investments in new products and applications having been made over the past two years, fouracquisitions having been completed in fiscal 2007, and the expectation for an improving climate in certain AdvancedTechnology markets, we expect fiscal year 2008 to be a year of improved financial performance. We will continue tolook for strategic acquisition opportunities, develop new applications and markets for our technologies, andimplement lean and other operational initiatives as ways to further enhance financial performance.
27
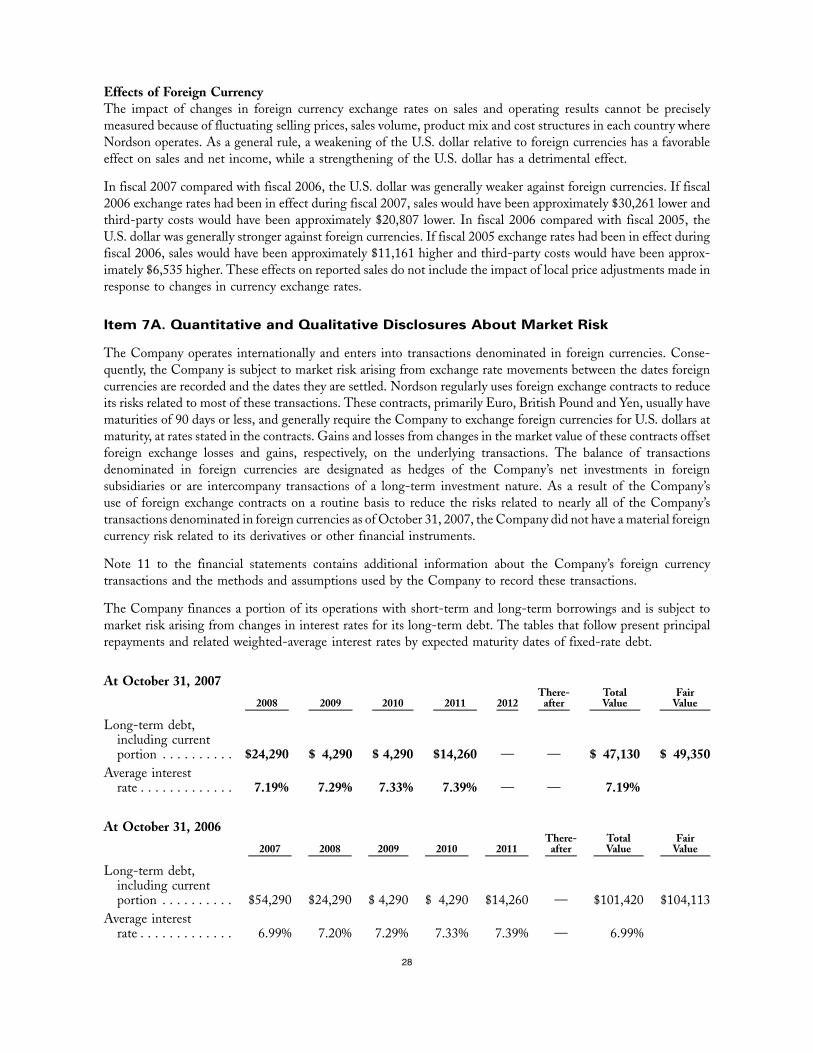
Effects of Foreign CurrencyThe impact of changes in foreign currency exchange rates on sales and operating results cannot be preciselymeasured because of fluctuating selling prices, sales volume, product mix and cost structures in each country whereNordson operates. As a general rule, a weakening of the U.S. dollar relative to foreign currencies has a favorableeffect on sales and net income, while a strengthening of the U.S. dollar has a detrimental effect.
In fiscal 2007 compared with fiscal 2006, the U.S. dollar was generally weaker against foreign currencies. If fiscal2006 exchange rates had been in effect during fiscal 2007, sales would have been approximately $30,261 lower andthird-party costs would have been approximately $20,807 lower. In fiscal 2006 compared with fiscal 2005, theU.S. dollar was generally stronger against foreign currencies. If fiscal 2005 exchange rates had been in effect duringfiscal 2006, sales would have been approximately $11,161 higher and third-party costs would have been approx-imately $6,535 higher. These effects on reported sales do not include the impact of local price adjustments made inresponse to changes in currency exchange rates.
Item 7A. Quantitative and Qualitative Disclosures About Market Risk
The Company operates internationally and enters into transactions denominated in foreign currencies. Conse-quently, the Company is subject to market risk arising from exchange rate movements between the dates foreigncurrencies are recorded and the dates they are settled. Nordson regularly uses foreign exchange contracts to reduceits risks related to most of these transactions. These contracts, primarily Euro, British Pound and Yen, usually havematurities of 90 days or less, and generally require the Company to exchange foreign currencies for U.S. dollars atmaturity, at rates stated in the contracts. Gains and losses from changes in the market value of these contracts offsetforeign exchange losses and gains, respectively, on the underlying transactions. The balance of transactionsdenominated in foreign currencies are designated as hedges of the Company’s net investments in foreignsubsidiaries or are intercompany transactions of a long-term investment nature. As a result of the Company’suse of foreign exchange contracts on a routine basis to reduce the risks related to nearly all of the Company’stransactions denominated in foreign currencies as of October 31, 2007, the Company did not have a material foreigncurrency risk related to its derivatives or other financial instruments.
Note 11 to the financial statements contains additional information about the Company’s foreign currencytransactions and the methods and assumptions used by the Company to record these transactions.
The Company finances a portion of its operations with short-term and long-term borrowings and is subject tomarket risk arising from changes in interest rates for its long-term debt. The tables that follow present principalrepayments and related weighted-average interest rates by expected maturity dates of fixed-rate debt.
At October 31, 2007
2008 2009 2010 2011 2012There-
afterTotalValue
FairValue
Long-term debt,including currentportion . . . . . . . . . . $24,290 $ 4,290 $ 4,290 $14,260 — — $ 47,130 $ 49,350
Average interestrate . . . . . . . . . . . . . 7.19% 7.29% 7.33% 7.39% — — 7.19%
At October 31, 2006
2007 2008 2009 2010 2011There-
afterTotalValue
FairValue
Long-term debt,including currentportion . . . . . . . . . . $54,290 $24,290 $ 4,290 $ 4,290 $14,260 — $101,420 $104,113
Average interestrate . . . . . . . . . . . . . 6.99% 7.20% 7.29% 7.33% 7.39% — 6.99%
28

The Company also has variable-rate notes payable. The weighted average interest rate of this debt was 5.3 percent atOctober 31, 2007 and 3.1 percent at October 31, 2006. A 1 percent increase in interest rates would have resulted inadditional interest expense of approximately $2,313 on the notes payable in fiscal 2007.
InflationInflation affects profit margins because the ability to pass cost increases on to customers is restricted by the need forcompetitive pricing. Although inflation has been modest in recent years and has had no material effect on the yearscovered by these financial statements, Nordson continues to seek ways to minimize the impact of inflation. It doesso through focused efforts to raise its productivity.
TrendsThe Five-Year Summary in Item 6 documents Nordson’s historical financial trends. Over this period, the world’seconomic conditions fluctuated significantly. Nordson’s solid performance is attributed to the Company’s partic-ipation in diverse geographic and industrial markets and its long-term commitment to develop and provide qualityproducts and worldwide service to meet customers’ changing needs.
Safe Harbor Statements Under the Private Securities Litigation Reform Act of 1995This Form 10-K, particularly “Management’s Discussion and Analysis,” contains forward-looking statementswithin the meaning of the Securities Act of 1933, as amended, the Securities Exchange Act of 1934, as amended,and the Private Securities Litigation Reform Act of 1995. Such statements relate to, among other things, income,earnings, cash flows, changes in operations, operating improvements, businesses in which Nordson Corporationoperates and the U.S. and global economies. Statements in this 10-K that are not historical are hereby identified as“forward-looking statements” and may be indicated by words or phrases such as “anticipates,” “supports,” “plans,”“projects,” “expects,” “believes,” “should,” “would,” “could,” “hope,” “forecast,” “management is of the opinion,” useof the future tense and similar words or phrases.
In light of these risks and uncertainties, actual events and results may vary significantly from those included in orcontemplated or implied by such statements. Readers are cautioned not to place undue reliance on such forward-looking statements. These forward-looking statements speak only as of the date made. The Company undertakesno obligation to publicly update or revise any forward-looking statements, whether as a result of new information,future events or otherwise, except as required by law. Factors that could cause the Company’s actual results to differmaterially from the expected results are discussed in Item 1A, Risk Factors.
29

Item 8. Financial Statements and Supplementary Data
Consolidated Statements of Income
Years ended October 31, 2007, October 31, 2006 and October 30, 20052007 2006 2005
(In thousands except for per-share amounts)
Sales . . . . . . . . . . . . . . . . . . . . . . . . . . . . . . . . . . . . . . . . . . . . . . . . . . . $993,649 $892,221 $832,179Operating costs and expenses:
Cost of sales . . . . . . . . . . . . . . . . . . . . . . . . . . . . . . . . . . . . . . . . . . . . 439,804 379,800 362,824Selling and administrative expenses . . . . . . . . . . . . . . . . . . . . . . . . . . . 401,294 362,179 337,782Severance and restructuring costs . . . . . . . . . . . . . . . . . . . . . . . . . . . . . 409 2,627 875
841,507 744,606 701,481
Operating profit . . . . . . . . . . . . . . . . . . . . . . . . . . . . . . . . . . . . . . . . . . 152,142 147,615 130,698Other income (expense):
Interest expense . . . . . . . . . . . . . . . . . . . . . . . . . . . . . . . . . . . . . . . . . (21,542) (12,017) (13,825)Interest and investment income . . . . . . . . . . . . . . . . . . . . . . . . . . . . . . 1,505 1,867 1,826Other — net . . . . . . . . . . . . . . . . . . . . . . . . . . . . . . . . . . . . . . . . . . . . 3,617 (1,031) 1,586
(16,420) (11,181) (10,413)
Income before income taxes and discontinued operations . . . . . . . . . . . . . 135,722 136,434 120,285Income tax provision:
Current . . . . . . . . . . . . . . . . . . . . . . . . . . . . . . . . . . . . . . . . . . . . . . . 44,613 39,719 27,671Deferred . . . . . . . . . . . . . . . . . . . . . . . . . . . . . . . . . . . . . . . . . . . . . . . 417 (952) 8,104
45,030 38,767 35,775
Income from continuing operations . . . . . . . . . . . . . . . . . . . . . . . . . . . 90,692 97,667 84,510Loss from discontinued operations, net of income tax benefits
of $6,418 and $2,837 for the years ended October 31, 2006 andOctober 30, 2005 . . . . . . . . . . . . . . . . . . . . . . . . . . . . . . . . . . . . . . . . — (7,069) (6,172)
Net income . . . . . . . . . . . . . . . . . . . . . . . . . . . . . . . . . . . . . . . . . . . . . . $ 90,692 $ 90,598 $ 78,338
Average common shares . . . . . . . . . . . . . . . . . . . . . . . . . . . . . . . . . . . . 33,547 33,365 35,718Incremental common shares attributable to outstanding stock options,
nonvested stock and deferred stock-based compensation . . . . . . . . . . . . 635 815 809
Average common shares and common share equivalents . . . . . . . . . . . . 34,182 34,180 36,527
Basic earnings per share from continuing operations . . . . . . . . . . . . . . $ 2.70 $ 2.93 $ 2.37Basic loss per share from discontinued operations . . . . . . . . . . . . . . . . — (0.21) (0.18)
Total . . . . . . . . . . . . . . . . . . . . . . . . . . . . . . . . . . . . . . . . . . . . . . . . . . . $ 2.70 $ 2.72 $ 2.19
Diluted earnings per share from continuing operations . . . . . . . . . . . . $ 2.65 $ 2.86 $ 2.31Diluted loss per share from discontinued operations . . . . . . . . . . . . . . — (0.21) (0.17)
Total . . . . . . . . . . . . . . . . . . . . . . . . . . . . . . . . . . . . . . . . . . . . . . . . . . . $ 2.65 $ 2.65 $ 2.14
The accompanying notes are an integral part of the consolidated financial statements.
30

Consolidated Balance Sheets
October 31, 2007 and October 31, 20062007 2006
(In thousands)
AssetsCurrent assets:
Cash and cash equivalents . . . . . . . . . . . . . . . . . . . . . . . . . . . . . . . . . . . . . . . . . $ 31,136 $ 48,859Marketable securities . . . . . . . . . . . . . . . . . . . . . . . . . . . . . . . . . . . . . . . . . . . . . 9 9Receivables — net . . . . . . . . . . . . . . . . . . . . . . . . . . . . . . . . . . . . . . . . . . . . . . . 229,993 190,459Inventories — net . . . . . . . . . . . . . . . . . . . . . . . . . . . . . . . . . . . . . . . . . . . . . . . 119,650 83,688Deferred income taxes . . . . . . . . . . . . . . . . . . . . . . . . . . . . . . . . . . . . . . . . . . . . 21,068 19,287Prepaid expenses . . . . . . . . . . . . . . . . . . . . . . . . . . . . . . . . . . . . . . . . . . . . . . . . 8,068 5,002
Total current assets . . . . . . . . . . . . . . . . . . . . . . . . . . . . . . . . . . . . . . . . . . . . . . . 409,924 347,304Property, plant and equipment — net . . . . . . . . . . . . . . . . . . . . . . . . . . . . . . . . . . . 132,917 105,415Goodwill . . . . . . . . . . . . . . . . . . . . . . . . . . . . . . . . . . . . . . . . . . . . . . . . . . . . . . . . 571,976 331,915Intangible assets — net . . . . . . . . . . . . . . . . . . . . . . . . . . . . . . . . . . . . . . . . . . . . . 66,766 8,806Deferred income taxes . . . . . . . . . . . . . . . . . . . . . . . . . . . . . . . . . . . . . . . . . . . . . . 861 9,961Other assets . . . . . . . . . . . . . . . . . . . . . . . . . . . . . . . . . . . . . . . . . . . . . . . . . . . . . 29,396 19,489
$1,211,840 $ 822,890
Liabilities and shareholders’ equityCurrent liabilities:
Notes payable . . . . . . . . . . . . . . . . . . . . . . . . . . . . . . . . . . . . . . . . . . . . . . . . . . $ 299,809 $ 15,898Accounts payable . . . . . . . . . . . . . . . . . . . . . . . . . . . . . . . . . . . . . . . . . . . . . . . . 51,939 38,680Income taxes payable . . . . . . . . . . . . . . . . . . . . . . . . . . . . . . . . . . . . . . . . . . . . . 15,012 10,951Accrued liabilities . . . . . . . . . . . . . . . . . . . . . . . . . . . . . . . . . . . . . . . . . . . . . . . 102,995 106,842Customer advance payments . . . . . . . . . . . . . . . . . . . . . . . . . . . . . . . . . . . . . . . . 10,564 10,015Current maturities of long-term debt . . . . . . . . . . . . . . . . . . . . . . . . . . . . . . . . . 24,290 54,290Current obligations under capital leases . . . . . . . . . . . . . . . . . . . . . . . . . . . . . . . 5,305 4,649
Total current liabilities . . . . . . . . . . . . . . . . . . . . . . . . . . . . . . . . . . . . . . . . . . . . . 509,914 241,325Long-term debt . . . . . . . . . . . . . . . . . . . . . . . . . . . . . . . . . . . . . . . . . . . . . . . . . . . 22,840 47,130Obligations under capital leases . . . . . . . . . . . . . . . . . . . . . . . . . . . . . . . . . . . . . . . 7,038 5,071Pension and retirement obligations . . . . . . . . . . . . . . . . . . . . . . . . . . . . . . . . . . . . . 59,762 43,022Postretirement obligations . . . . . . . . . . . . . . . . . . . . . . . . . . . . . . . . . . . . . . . . . . . 39,781 23,798Other liabilities . . . . . . . . . . . . . . . . . . . . . . . . . . . . . . . . . . . . . . . . . . . . . . . . . . . 41,388 32,016Shareholders’ equity:
Preferred shares, no par value; 10,000 shares authorized; none issued. . . . . . . . . . — —Common shares, no par value; 80,000 shares authorized; 49,011 shares issued . . . 12,253 12,253Capital in excess of stated value . . . . . . . . . . . . . . . . . . . . . . . . . . . . . . . . . . . . . 224,411 210,690Retained earnings . . . . . . . . . . . . . . . . . . . . . . . . . . . . . . . . . . . . . . . . . . . . . . . 748,229 681,018Accumulated other comprehensive income (loss) . . . . . . . . . . . . . . . . . . . . . . . . . 8,200 (12,518)Common shares in treasury, at cost. . . . . . . . . . . . . . . . . . . . . . . . . . . . . . . . . . . (461,976) (460,915)
Total shareholders’ equity . . . . . . . . . . . . . . . . . . . . . . . . . . . . . . . . . . . . . . . . . . . 531,117 430,528
$1,211,840 $ 822,890
The accompanying notes are an integral part of the consolidated financial statements.
31

Consolidated Statements of Shareholders’ Equity
Years ended October 31, 2007, October 31, 2006 and October 30, 20052007 2006 2005
(In thousands)
Number of common shares in treasuryBalance at beginning of year . . . . . . . . . . . . . . . . . . . . . . . . . . . . . . . . . . . . 15,600 16,100 12,733Shares issued under company stock and employee benefit plans . . . . . . . . . . . (604) (1,171) (662)Purchase of treasury shares . . . . . . . . . . . . . . . . . . . . . . . . . . . . . . . . . . . . . 305 671 4,029
Balance at end of year . . . . . . . . . . . . . . . . . . . . . . . . . . . . . . . . . . . . . . . . 15,301 15,600 16,100
Common sharesBalance at beginning and ending of year . . . . . . . . . . . . . . . . . . . . . . . . . . . $ 12,253 $ 12,253 $ 12,253
Capital in excess of stated valueBalance at beginning of year . . . . . . . . . . . . . . . . . . . . . . . . . . . . . . . . . . . . $ 210,690 $ 188,132 $ 174,440Shares issued under company stock and employee benefit plans . . . . . . . . . . . 1,234 5,565 10,359Tax benefit from stock option and restricted stock transactions . . . . . . . . . . . . 4,269 9,074 3,333Stock-based compensation . . . . . . . . . . . . . . . . . . . . . . . . . . . . . . . . . . . . . 8,218 7,121 —Adoption of FAS 123(R) . . . . . . . . . . . . . . . . . . . . . . . . . . . . . . . . . . . . . . — 798 —
Balance at end of year . . . . . . . . . . . . . . . . . . . . . . . . . . . . . . . . . . . . . . . . $ 224,411 $ 210,690 $ 188,132
Retained earningsBalance at beginning of year . . . . . . . . . . . . . . . . . . . . . . . . . . . . . . . . . . . . $ 681,018 $ 613,580 $ 558,620Elimination of reporting lag for certain international subsidiaries . . . . . . . . . . — (788) —Net income . . . . . . . . . . . . . . . . . . . . . . . . . . . . . . . . . . . . . . . . . . . . . . . . 90,692 90,598 78,338Dividends paid ($.70 per share in 2007, $.67 per share in 2006 and $.645
per share in 2005) . . . . . . . . . . . . . . . . . . . . . . . . . . . . . . . . . . . . . . . . . (23,481) (22,372) (23,378)
Balance at end of year . . . . . . . . . . . . . . . . . . . . . . . . . . . . . . . . . . . . . . . . $ 748,229 $ 681,018 $ 613,580
Accumulated other comprehensive income (loss)Balance at beginning of year . . . . . . . . . . . . . . . . . . . . . . . . . . . . . . . . . . . . $ (12,518) $ (25,883) $ (16,471)Translation adjustments . . . . . . . . . . . . . . . . . . . . . . . . . . . . . . . . . . . . . . . 27,490 8,693 (2,902)Minimum pension liability adjustment, net of tax of $(6,014) in 2007,
$(2,671) in 2006 and $3,949 in 2005 . . . . . . . . . . . . . . . . . . . . . . . . . . . . 10,320 4,672 (6,510)Effect of adoption of FAS 158, net of tax of $15,270 . . . . . . . . . . . . . . . . . . (17,092) — —
Balance at end of year . . . . . . . . . . . . . . . . . . . . . . . . . . . . . . . . . . . . . . . . $ 8,200 $ (12,518) $ (25,883)
Common shares in treasury, at costBalance at beginning of year . . . . . . . . . . . . . . . . . . . . . . . . . . . . . . . . . . . . $(460,915) $(454,365) $(323,531)Shares issued under company stock and employee benefit plans . . . . . . . . . . . 14,222 22,248 6,797Purchase of treasury shares . . . . . . . . . . . . . . . . . . . . . . . . . . . . . . . . . . . . . (15,283) (28,798) (137,631)
Balance at end of year . . . . . . . . . . . . . . . . . . . . . . . . . . . . . . . . . . . . . . . . $(461,976) $(460,915) $(454,365)
Deferred stock based compensationBalance at beginning of year . . . . . . . . . . . . . . . . . . . . . . . . . . . . . . . . . . . . $ — $ (2,805) $ (1,978)Shares issued under company stock and employee benefit plans . . . . . . . . . . . — — (2,246)Amortization of deferred stock based compensation . . . . . . . . . . . . . . . . . . . — — 1,419Adoption of FAS 123(R) . . . . . . . . . . . . . . . . . . . . . . . . . . . . . . . . . . . . . . 2,805 —
Balance at end of year . . . . . . . . . . . . . . . . . . . . . . . . . . . . . . . . . . . . . . . . $ — $ — $ (2,805)
Total shareholders’ equity . . . . . . . . . . . . . . . . . . . . . . . . . . . . . . . . . . . . . . . $ 531,117 $ 430,528 $ 330,912
Comprehensive incomeNet income . . . . . . . . . . . . . . . . . . . . . . . . . . . . . . . . . . . . . . . . . . . . . . . . $ 90,692 $ 90,598 $ 78,338Translation adjustments . . . . . . . . . . . . . . . . . . . . . . . . . . . . . . . . . . . . . . . 27,490 8,693 (2,902)Minimum pension liability adjustment, net of tax of $(6,014) in 2007,
$(2,671) in 2006 and $3,949 in 2005 . . . . . . . . . . . . . . . . . . . . . . . . . . . . 10,320 4,672 (6,510)
Total comprehensive income . . . . . . . . . . . . . . . . . . . . . . . . . . . . . . . . . . . . $ 128,502 $ 103,963 $ 68,926
The accompanying notes are an integral part of the consolidated financial statements.
32

Consolidated Statements of Cash Flows
Years ended October 31, 2007, October 31, 2006 and October 30, 20052007 2006 2005
(In thousands)
Cash flows from operating activities:Net income . . . . . . . . . . . . . . . . . . . . . . . . . . . . . . . . . . . . . . . . . . . . . . . . . . . . . . . . $ 90,692 $ 90,598 $ 78,338Less: Loss from discontinued operations . . . . . . . . . . . . . . . . . . . . . . . . . . . . . . . . . . . . . . — (7,069) (6,172)
Income from continuing operations . . . . . . . . . . . . . . . . . . . . . . . . . . . . . . . . . . . . . . . 90,692 97,667 84,510Adjustments to reconcile net income to net cash provided by operating activities:
Depreciation . . . . . . . . . . . . . . . . . . . . . . . . . . . . . . . . . . . . . . . . . . . . . . . . . . . . 23,784 22,284 21,049Amortization . . . . . . . . . . . . . . . . . . . . . . . . . . . . . . . . . . . . . . . . . . . . . . . . . . . . 4,149 1,026 2,410Provision for losses on receivables . . . . . . . . . . . . . . . . . . . . . . . . . . . . . . . . . . . . . . . 1,147 277 1,596Deferred income taxes . . . . . . . . . . . . . . . . . . . . . . . . . . . . . . . . . . . . . . . . . . . . . . 417 61 8,362Tax benefit from the exercise of stock options . . . . . . . . . . . . . . . . . . . . . . . . . . . . . . . (4,269) (9,074) 3,333Non-cash stock compensation . . . . . . . . . . . . . . . . . . . . . . . . . . . . . . . . . . . . . . . . . 8,217 7,121 —(Gain)/loss on sale of property, plant and equipment . . . . . . . . . . . . . . . . . . . . . . . . . . (3,470) 58 298Other . . . . . . . . . . . . . . . . . . . . . . . . . . . . . . . . . . . . . . . . . . . . . . . . . . . . . . . . . 10,593 8,213 (3,589)Changes in operating assets and liabilities:
Receivables . . . . . . . . . . . . . . . . . . . . . . . . . . . . . . . . . . . . . . . . . . . . . . . . . . . . (3,983) (25,069) (16,047)Inventories . . . . . . . . . . . . . . . . . . . . . . . . . . . . . . . . . . . . . . . . . . . . . . . . . . . . (1,075) (1,769) 4,511Other current assets . . . . . . . . . . . . . . . . . . . . . . . . . . . . . . . . . . . . . . . . . . . . . . (2,052) 771 641Other noncurrent assets . . . . . . . . . . . . . . . . . . . . . . . . . . . . . . . . . . . . . . . . . . . . (9,807) (2,502) (3,599)Accounts payable . . . . . . . . . . . . . . . . . . . . . . . . . . . . . . . . . . . . . . . . . . . . . . . . 5,090 (1,190) (9,241)Income taxes payable . . . . . . . . . . . . . . . . . . . . . . . . . . . . . . . . . . . . . . . . . . . . . 4,928 17,737 8,591Accrued liabilities . . . . . . . . . . . . . . . . . . . . . . . . . . . . . . . . . . . . . . . . . . . . . . . . (14,212) 6,801 7,227Customer advance payments . . . . . . . . . . . . . . . . . . . . . . . . . . . . . . . . . . . . . . . . . (195) (347) 877Other noncurrent liabilities . . . . . . . . . . . . . . . . . . . . . . . . . . . . . . . . . . . . . . . . . 14,294 6,536 8,621
Net cash used by discontinued operations . . . . . . . . . . . . . . . . . . . . . . . . . . . . . . . . . . . — (8,577) (1,092)
Net cash provided by operating activities . . . . . . . . . . . . . . . . . . . . . . . . . . . . . . . . . . 124,248 120,024 118,458Cash flows from investing activities:
Additions to property, plant and equipment . . . . . . . . . . . . . . . . . . . . . . . . . . . . . . . . . . . (31,017) (13,610) (15,379)Proceeds from sale of property, plant and equipment . . . . . . . . . . . . . . . . . . . . . . . . . . . . . . 8,153 913 322Acquisition of businesses, net of cash acquired . . . . . . . . . . . . . . . . . . . . . . . . . . . . . . . . . . (325,245) — (557)Proceeds from sale of business . . . . . . . . . . . . . . . . . . . . . . . . . . . . . . . . . . . . . . . . . . . . — 5,411 —Proceeds from sale of marketable securities . . . . . . . . . . . . . . . . . . . . . . . . . . . . . . . . . . . . — 206 154,265Purchases of marketable securities . . . . . . . . . . . . . . . . . . . . . . . . . . . . . . . . . . . . . . . . . . — — (105,076)Net cash used by discontinued operations . . . . . . . . . . . . . . . . . . . . . . . . . . . . . . . . . . . . . — (115) (10)
Net cash provided by (used in) investing activities . . . . . . . . . . . . . . . . . . . . . . . . . . . . (348,109) (7,195) 33,565Cash flows from financing activities:
Proceeds from short-term borrowings . . . . . . . . . . . . . . . . . . . . . . . . . . . . . . . . . . . . . . . 387,131 16,190 33,429Repayment of short-term borrowings . . . . . . . . . . . . . . . . . . . . . . . . . . . . . . . . . . . . . . . . (105,838) (20,299) (29,746)Repayment of long-term debt . . . . . . . . . . . . . . . . . . . . . . . . . . . . . . . . . . . . . . . . . . . . . (54,290) (54,004) (4,290)Repayment of capital lease obligations . . . . . . . . . . . . . . . . . . . . . . . . . . . . . . . . . . . . . . . (5,741) (5,571) (5,471)Issuance of common shares . . . . . . . . . . . . . . . . . . . . . . . . . . . . . . . . . . . . . . . . . . . . . . 9,264 21,535 9,575Purchase of treasury shares . . . . . . . . . . . . . . . . . . . . . . . . . . . . . . . . . . . . . . . . . . . . . . (9,090) (22,521) (132,159)Tax benefit from the exercise of stock options . . . . . . . . . . . . . . . . . . . . . . . . . . . . . . . . . . 4,269 9,074 —Dividends paid . . . . . . . . . . . . . . . . . . . . . . . . . . . . . . . . . . . . . . . . . . . . . . . . . . . . . . (23,481) (22,372) (23,378)
Net cash provided by (used in) financing activities . . . . . . . . . . . . . . . . . . . . . . . . . . . . 202,224 (77,968) (152,040)Effect of exchange rate changes on cash . . . . . . . . . . . . . . . . . . . . . . . . . . . . . . . . . . . . . . 3,914 1,428 (263)Effect of change in fiscal year-end for certaininternational subsidiaries . . . . . . . . . . . . . . . . . . . . . . . . . . . . . . . . . . . . . . . . . . . . . . . . — 1,252 —
Increase (decrease) in cash and cash equivalents . . . . . . . . . . . . . . . . . . . . . . . . . . . . . . . . . (17,723) 37,541 (280)Cash and cash equivalents at beginning of year . . . . . . . . . . . . . . . . . . . . . . . . . . . . . . . . . 48,859 11,318 11,598
Cash and cash equivalents at end of year . . . . . . . . . . . . . . . . . . . . . . . . . . . . . . . . . . . . . $ 31,136 $ 48,859 $ 11,318
The accompanying notes are an integral part of the consolidated financial statements.
33

Notes to Consolidated Financial Statements
In this annual report, all amounts related to U.S. and foreign currency and to the number of Nordson Corporation’sCommon Shares, except for per share earnings and dividend amounts, are expressed in thousands.
Note 1 — Significant accounting policies
Consolidation — The consolidated financial statements include the accounts of the Company and its majority-owned and controlled subsidiaries. All significant intercompany accounts and transactions have been eliminated inconsolidation. Other investments are recorded at cost.
As discussed in Note 3, the Company sold its Fiber Systems Group on October 13, 2006, and its results ofoperations have been included in discontinued operations for all periods presented. Unless noted otherwise,disclosures reported in these financial statement and notes pertain to the Company’s continuing operations.
Use of estimates — The preparation of financial statements in conformity with generally accepted accountingprinciples in the United States requires management to make estimates and assumptions that affect the amountsreported in the consolidated financial statements and notes. Actual amounts could differ from these estimates.
Fiscal year — In 2007 and 2006, the Company’s fiscal year ended on October 31. Previously, the fiscal year for theCompany’s domestic operations ended on the Sunday closest to October 31 and contained 52 weeks in fiscal 2005.
Prior to fiscal 2006, the majority of the Company’s international operations reported their results on a one-monthlag, in order to facilitate reporting of consolidated accounts. Effective in fiscal 2006, the reporting lag waseliminated. As a result, the October 2005 results of operations for these subsidiaries, which amounted to a net loss of$788, were recorded directly to retained earnings at the beginning of fiscal 2006. Accordingly, certain tablesshowing balance sheet activity presented in these Notes to Consolidated Financial Statements contain 13 months ofchange when reconciling beginning balances to ending balances.
Revenue recognition — Most of the Company’s revenues are recognized upon shipment, provided that persuasiveevidence of an arrangement exists, the sales price is fixed or determinable, collectibility is reasonably assured, andtitle and risk of loss have passed to the customer. Revenues from contracts with multiple element arrangements, suchas those including installation or other services, are recognized as each element is earned based on objective evidenceof the relative fair value of each element. If the installation or other services are inconsequential to the functionalityof the delivered product, the entire amount of revenue is recognized upon satisfaction of the criteria noted above.Inconsequential installation or other services are those that can generally be completed in a short period of time, atinsignificant cost, and the skills required to complete these installations are not unique to the Company. Ifinstallation or other services are essential to the functionality of the delivered product, revenues attributable to theseobligations are deferred until completed. Amounts received in excess of revenue recognized are included as deferredrevenue within accrued liabilities in the accompanying balance sheets. Revenues deferred in fiscal years 2007, 2006and 2005 were not material.
Shipping and handling costs — The Company records amounts billed to customers for shipping and handling asrevenue. Shipping and handling expenses are included in cost of sales.
Advertising costs — Advertising costs are expensed as incurred and were $8,358, $7,044 and $8,137 in fiscal years2007, 2006 and 2005, respectively.
Research and development — Research and development costs are expensed as incurred and were $35,432,$25,336 and $22,341 in fiscal years 2007, 2006 and 2005, respectively.
Earnings per share — Basic earnings per share are computed based on the weighted-average number of commonshares outstanding during each year, while diluted earnings per share are based on the weighted-average number ofcommon shares and common share equivalents outstanding. Common share equivalents consist of shares issuableupon exercise of the Company’s stock options, computed using the treasury stock method, as well as nonvested stockand deferred stock-based compensation. Options whose exercise price is higher than the average market price areexcluded from the calculation of diluted earnings per share because the effect would be anti-dilutive.
34

Cash and cash equivalents — Highly liquid instruments with maturities of 90 days or less at date of purchase areconsidered to be cash equivalents. Cash and cash equivalents are carried at cost.
Marketable securities — Marketable securities consist primarily of certificates of deposit and other short-termnotes with maturities greater than 90 days at date of purchase, and all contractual maturities were within one year orcould be callable within one year.
The Company’s marketable securities are classified as available for sale and are recorded at quoted market prices thatapproximate cost.
Allowance for doubtful accounts — The Company maintains an allowance for doubtful accounts for estimatedlosses resulting from the inability of its customers to make required payments. The amount of the allowance isdetermined principally on the basis of past collection experience and known factors regarding specific customers.Accounts are written off against the allowance when it becomes evident that collection will not occur.
Inventories — Inventories are valued at the lower of cost or market. Cost has been determined using the last-in,first-out (LIFO) method for 28 percent of consolidated inventories at October 31, 2007, and 37 percent atOctober 31, 2006. The first-in, first-out (FIFO) method is used for all other inventories. Liquidations decreasedcost of goods sold by $7 in fiscal 2005. There were no such liquidations in fiscal years 2007 or 2006. Consolidatedinventories would have been $7,582 and $8,866 higher than reported at October 31, 2007 and October 31, 2006,respectively, had the Company used the FIFO method, which approximates current cost, for valuation of allinventories.
Property, plant and equipment and depreciation — Property, plant and equipment are carried at cost. Additionsand improvements that extend the lives of assets are capitalized, while expenditures for repairs and maintenance areexpensed as incurred. Plant and equipment are depreciated for financial reporting purposes using the straight-linemethod over the estimated useful lives of the assets or, in the case of property under capital leases, over the terms ofthe leases. Leasehold improvements are depreciated over shorter of the lease term or their useful lives. Useful livesare as follows:
Land improvements . . . . . . . . . . . . . . . . . . . . . . . . . . . . . . . . . . . . . . . . . . . . . . . . . . 15-25 yearsBuildings . . . . . . . . . . . . . . . . . . . . . . . . . . . . . . . . . . . . . . . . . . . . . . . . . . . . . . . . . . 20-40 yearsMachinery and equipment. . . . . . . . . . . . . . . . . . . . . . . . . . . . . . . . . . . . . . . . . . . . . . 3-12 yearsEnterprise management systems . . . . . . . . . . . . . . . . . . . . . . . . . . . . . . . . . . . . . . . . . 5-10 years
The Company capitalizes costs associated with the development and installation of internal use software inaccordance with Statement of Position 98-1, “Accounting for the Costs of Computer Software Developed orObtained for Internal Use.” Accordingly, internal use software costs are expensed or capitalized depending onwhether they are incurred in the preliminary project stage, application development stage or the post-implemen-tation stage. Amounts capitalized are amortized over the estimated useful lives of the software beginning with theproject’s completion. All re-engineering costs are expensed as incurred. The Company capitalizes interest costs onsignificant capital projects. No interest was capitalized in fiscal years 2007 or 2006.
Goodwill and intangible assets — Goodwill is the excess of cost of an acquired entity over the amounts assigned toassets acquired and liabilities assumed in a business combination. Goodwill and indefinite-lived intangible assets arenot amortized but are subject to annual impairment testing at the reporting unit level. Testing is done morefrequently if an event occurs or circumstances change that would indicate the fair value of a reporting unit is lessthan the carrying amount of goodwill. The majority of goodwill relates to and is assigned directly to specificreporting units.
Other intangible assets, which consist primarily of patent costs, customer relationships, noncompete agreementsand core/developed technology, are amortized over their useful lives. At present, these lives range from four to19 years.
35
Notes to Consolidated Financial Statements — (Continued)

Environmental remediation costs — The Company accrues for losses associated with environmental remediationobligations when such losses are probable and reasonably estimable. Accruals for estimated losses from environ-mental remediation obligations generally are recognized no later than completion of the remedial feasibility study.Such accruals are adjusted as further information develops or circumstances change. Costs for future expendituresfor environmental remediation obligations are not discounted to their present value.
Foreign currency translation — The financial statements of the Company’s subsidiaries outside the United Statesare generally measured using the local currency as the functional currency. Assets and liabilities of these subsidiariesare translated at the rates of exchange at the balance sheet dates. Income and expense items are translated at averagemonthly rates of exchange. The resulting translation adjustments are included in accumulated other comprehensiveincome (loss), a separate component of shareholders’ equity. Generally, gains and losses from foreign currencytransactions, including forward contracts, of these subsidiaries and the United States parent are included in netincome. Premiums and discounts on forward contracts are amortized over the lives of the contracts. Gains and lossesfrom foreign currency transactions, which hedge a net investment in a foreign subsidiary and from intercompanyforeign currency transactions of a long-term investment nature, are included in accumulated other comprehensiveincome (loss).
Comprehensive income (loss) — Accumulated other comprehensive income (loss) at October 31, 2007 and 2006,consisted of:
2007 2006
Translation adjustments . . . . . . . . . . . . . . . . . . . . . . . . . . . . . . . . . . . . . . . . $ 42,264 $ 14,774Minimum pension liability adjustments, net of tax. . . . . . . . . . . . . . . . . . . . . (16,972) (27,292)Effect of adopting FAS 158, net of tax . . . . . . . . . . . . . . . . . . . . . . . . . . . . . (17,092) —
$ 8,200 $(12,518)
Warranties — The Company offers warranties to its customers depending on the specific product and terms of thecustomer purchase agreement. Most of the Company’s product warranties are customer specific. A typical warrantyprogram requires that the Company repair or replace defective products within a specified time period (generallyone year) from the date of delivery or first use. The Company records an estimate for future warranty-related costsbased on actual historical return rates. Based on analysis of return rates and other factors, the adequacy of theCompany’s warranty provisions are adjusted as necessary. The liability for warranty costs is included in otheraccrued liabilities in the Consolidated Balance Sheet.
Following is a reconciliation of the product warranty liability for fiscal years 2007 and 2006:
2007 2006
Balance at beginning of year . . . . . . . . . . . . . . . . . . . . . . . . . . . . . . . . . . . . . . . $ 4,917 $ 3,989Warranties assumed from acquisitions . . . . . . . . . . . . . . . . . . . . . . . . . . . . . . . . 603 —Accruals for warranties . . . . . . . . . . . . . . . . . . . . . . . . . . . . . . . . . . . . . . . . . . . 5,702 6,226Warranty payments . . . . . . . . . . . . . . . . . . . . . . . . . . . . . . . . . . . . . . . . . . . . . (5,845) (5,480)Currency adjustments . . . . . . . . . . . . . . . . . . . . . . . . . . . . . . . . . . . . . . . . . . . . 407 182
Balance at end of year . . . . . . . . . . . . . . . . . . . . . . . . . . . . . . . . . . . . . . . . . . . $ 5,784 $ 4,917
Presentation — Certain fiscal years 2006 and 2005 amounts have been reclassified to conform to fiscal 2007presentation.
36
Notes to Consolidated Financial Statements — (Continued)

Note 2 — Recently issued accounting standards
In May 2005, the FASB issued Statement of Financial Accounting Standards No. 154, “Accounting Changes andError Corrections” (FAS 154). This Statement replaces Accounting Principles Board Opinion No. 20, “AccountingChanges,” and FASB Statement No. 3, “Reporting Accounting Changes in Interim Financial Statements,” andchanges the accounting for and reporting of a change in accounting principle. FAS 154 applies to all voluntarychanges in accounting principles and to changes required by an accounting pronouncement when specific transitionprovisions are not provided. The Statement requires retrospective application to prior periods’ financial statementsfor changes in accounting principle, unless it is impracticable to determine the period specific or cumulative effect ofthe change. The Company adopted FAS 154 in fiscal 2007. The adoption had no effect on the Company’s results ofoperations or financial position.
In June 2006, the FASB issued FASB Interpretation No. 48, “Accounting for Uncertainty in Income Taxes,”(FIN 48) an interpretation of FASB Statement No. 109, “Accounting for Income Taxes.” FIN 48 clarifies theaccounting for uncertain income tax positions that are recognized in a company’s financial statements. FIN 48 alsoprovides guidance on financial statement classification, accounting for interest and penalties, accounting for interimperiods and new disclosure requirements. The Company will adopt FIN 48 in the first quarter of fiscal 2008. TheCompany has not yet determined the impact of adoption on its results of operations or financial position.
In September 2006, the FASB issued Statement of Financial Accounting Standards No. 157, “Fair ValueMeasurements” (FAS 157). This Statement provides a common definition of fair value and establishes a frameworkto make the measurement of fair value in generally accepted accounting principles more consistent and comparable.It also requires expanded disclosures to provide information about the extent to which fair value is used to measureassets and liabilities, the methods and assumptions used to measure fair value, and the effect of fair value measureson earnings. FAS 157 is effective for the Company’s 2009 fiscal year, although early adoption is permitted. TheCompany has not yet determined the impact of adoption on its results of operations or financial position.
In September 2006, the FASB issued Statement of Financial Accounting Standards No. 158, “Employers’Accounting for Defined Benefit Pension and Other Postretirement Plans” (FAS 158) an amendment of FASBStatements No. 87, 88, 106 and 132(R). This Statement requires an entity to recognize the overfunded orunderfunded status of a defined benefit postretirement plan as an asset or liability in its statement of financialposition and to recognize changes in the funded status in the year in which the changes occur in othercomprehensive income. This Statement also requires an employer to measure the funded status of a plan as ofthe date of its year-end statement of financial position. As discussed in Note 4, the Company adopted therequirement to recognize the funded status of its defined benefit postretirement plans and the disclosurerequirements of FAS 158 as of October 31, 2007. The effect of adopting FAS 158 on individual line items ofthe Company’s balance sheet is disclosed in Note 4. The adoption did not impact the Company’s results ofoperations or cash flows. The Company previously complied with the requirement to measure plan assets andbenefit obligations as of the date of its fiscal year-end statement of financial position.
In September 2006, the SEC staff issued Staff Accounting Bulletin No. 108, “Considering the Effects of Prior YearMisstatements when Quantifying Misstatements in Current Year Financial Statements” (SAB 108). SAB 108 wasissued in order to eliminate the diversity in practice surrounding how public companies quantify financial statementmisstatements. SAB 108 requires that registrants quantify errors using both a balance sheet and income statementapproach and evaluate whether either approach results in a misstated amount that, when all relevant quantitativeand qualitative factors are considered, is material. The Company adopted SAB 108 in fiscal 2007. The adoption hadno effect on the Company’s results of operations or financial position.
In February 2007, the FASB issued Statement of Financial Accounting Standards No. 159, “The Fair Value Optionfor Financial Assets and Financial Liabilities — Including an amendment of FASB Statement No. 115” (FAS 159).This Statement permits entities to choose to measure many financial instruments and certain other items at fairvalue and report unrealized gains and losses on these instruments in earnings. The Company must adopt FAS 159 infiscal 2009 and has not yet determined the impact of adoption on its results of operations or financial position.
37
Notes to Consolidated Financial Statements — (Continued)

In December 2007, the FASB issued Statement of Financial Accounting Standards No. 141(R), “BusinessCombinations” (FAS 141(R). This Statement provides greater consistency in the accounting and financialreporting of business combinations. It requires the acquiring entity in a business combination to recognize allassets acquired and liabilities assumed in the transaction, establishes the acquisition-date fair value as themeasurement objective for all assets acquired and liabilities assumed, and requires the acquirer to disclose thenature and financial effect of the business combination. The Company must adopt FAS 141(R) in fiscal 2010 andhas not yet determined the impact of adoption on its results of operations or financial position.
In December 2007, the FASB issued Statement of Financial Accounting Standards No. 160, “NoncontrollingInterests in Consolidated Financial Statements” (FAS 160). This Statement amends Accounting ResearchBulletin No. 51, “Consolidated Financial Statements”, to establish accounting and reporting standards for thenoncontrolling interest in a subsidiary and for the deconsolidation of a subsidiary. The Company must adoptFAS 160 in fiscal 2010 and has not yet determined the impact of adoption on its results of operations or financialposition.
Note 3 — Discontinued Operations
On October 13, 2006, the Company entered into an agreement to sell its Fiber Systems Group to Saurer Inc. for$5,966. The Fiber Systems Group was acquired in 1998 as part of the acquisition of J&M Laboratories as a means ofexpanding the Adhesive Dispensing Systems segment. However, due to the changing competitive environment, theFiber Systems Group did not meet the Company’s financial performance objectives. The sale enabled the Companyto concentrate its activities on better performing or faster growing product lines. Proceeds of $5,411 were receivedon the closing date, with the remaining $555 to be paid over an 18-month period following the closing date. Inaccordance with FASB Statement of Accounting Standards No. 144, the results of this business have been classifiedas discontinued operations. Accordingly, the revenues, costs and expenses, assets and liabilities, and cash flows ofthis business have been segregated in the Consolidated Statements of Income, Consolidated Balance Sheets andConsolidated Statements of Cash Flows.
The terms of the agreement require the Company to indemnify Saurer Inc. for losses incurred in excess of $100 forbreach of representations and warranties made by the Company in the Asset Purchase Agreement. The maximumamount the Company would be required to pay is $1,500, except with respect to the Company’s pre-sale violation ofenvironmental laws and regulations. This provision expires in April 2008. No amount has been recorded by theCompany related to this indemnification.
Operating results of the Fiber Systems Group prior to its sale in October 2006 are as follows:
2006 2005
Sales . . . . . . . . . . . . . . . . . . . . . . . . . . . . . . . . . . . . . . . . . . . . . . . . . . . . . . . $ 5,919 $ 6,983
Loss from discontinued operations before income taxes . . . . . . . . . . . . . . . . . . $(14,428) $(9,009)Income tax benefit . . . . . . . . . . . . . . . . . . . . . . . . . . . . . . . . . . . . . . . . . . . . . (4,546) (2,837)
Net loss from discontinued operations before gain on disposal . . . . . . . . . . . . . (9,882) (6,172)Gain on disposal of discontinued operations, including tax benefit of $1,872 . . 2,813 —
$ (7,069) $(6,172)
Included in the fiscal 2006 loss from discontinued operations is severance expense of $699 related to 27 employees ofthe Fiber Systems Group that were not hired by Saurer Inc. Cash disbursements were made during fiscal 2007. Also,included in the fiscal 2006 loss from discontinued operations is the recognition of an impairment of an intangibleasset of $2,630.
38
Notes to Consolidated Financial Statements — (Continued)

Included in the gain on disposal of discontinued operations above is a $107 write-off of goodwill, which was basedon the relative fair value of the disposed group. There was no goodwill impairment impact resulting from the sale ofthe Fiber Systems Group. The net tax benefit of $1,872 on disposal is the result of $2,867 tax expense on one-timegains resulting from the disposal, offset by $4,739 tax benefit resulting from an excess of tax basis over book basis inFiber Systems Group assets.
Note 4 — Retirement, pension and other postretirement plans
Retirement plans — The parent company and certain subsidiaries have funded contributory retirement planscovering certain employees. The Company’s contributions are primarily determined by the terms of the plans,subject to the limitation that they shall not exceed the amounts deductible for income tax purposes. The Companyalso sponsors unfunded contributory supplemental retirement plans for certain employees. Generally, benefits underthese plans vest gradually over a period of approximately five years from date of employment, and are based on theemployee’s contribution. The expense applicable to retirement plans for fiscal years 2007, 2006 and 2005 wasapproximately $7,753, $5,857 and $5,477, respectively.
Pension and other postretirement plans — Effective October 31, 2007, the Company adopted the recognitionand disclosure provisions of Statement of Financial Accounting Standards No. 158, Employers Accounting forDefined Benefit Pension and Other Postretirement Plans — an amendment of FASB Statements No. 87, 88, 106and 132(R) (FAS 158). This Statement requires employers to recognize the overfunded or underfunded status ofdefined benefit post-retirement plans in their balance sheets. The over- or under-funded status is measured as thedifference between the fair value of plan assets and the benefit obligation of the plans (the projected benefitobligation for pension plans and the accumulated post-retirement benefit obligation for other post-retirementplans). Changes in the funded status of the plans are recognized in the year in which the change occurs throughaccumulated other comprehensive income. Under FAS 158, gains and losses, prior service costs and credits, and anyremaining transition amounts under FAS 87, Employers’ Accounting for Pensions and FAS 106, EmployersAccounting for Postretirement Benefits Other Than Pensions, that have not yet been recognized through netperiodic benefit cost are recognized in accumulated other comprehensive income, net of tax effects.
FAS 158 also requires plan assets and obligations to be measured as of the employer’s balance sheet date. TheCompany already measures the plan assets and obligations as of the fiscal year-end date. As a result, this provisiondid not have an effect on the consolidated financial statements.
The following table illustrates the incremental effect of adopting FAS 158 as of October 31, 2007:Effect ofAdoptingFAS 158
Deferred income taxes — non-current . . . . . . . . . . . . . . . . . . . . . . . . . . . . . . . . . . . . . . . . $15,270Intangible assets . . . . . . . . . . . . . . . . . . . . . . . . . . . . . . . . . . . . . . . . . . . . . . . . . . . . . . . . (3,111)Other assets . . . . . . . . . . . . . . . . . . . . . . . . . . . . . . . . . . . . . . . . . . . . . . . . . . . . . . . . . . . 234Accrued liabilities. . . . . . . . . . . . . . . . . . . . . . . . . . . . . . . . . . . . . . . . . . . . . . . . . . . . . . . (8,895)Pension and retirement liabilities . . . . . . . . . . . . . . . . . . . . . . . . . . . . . . . . . . . . . . . . . . . 25,384Postretirement obligations . . . . . . . . . . . . . . . . . . . . . . . . . . . . . . . . . . . . . . . . . . . . . . . . 13,113Other liabilities . . . . . . . . . . . . . . . . . . . . . . . . . . . . . . . . . . . . . . . . . . . . . . . . . . . . . . . . (117)Accumulated other comprehensive loss . . . . . . . . . . . . . . . . . . . . . . . . . . . . . . . . . . . . . . . 17,092
39
Notes to Consolidated Financial Statements — (Continued)

Pension plans — The Company has various pension plans covering a portion of the Company’s U.S. andinternational employees. Pension plan benefits are generally based on years of employment and, for salariedemployees, the level of compensation. The Company contributes actuarially determined amounts to U.S. plans toprovide sufficient assets to meet future benefit payment requirements. The Company also sponsors an unfundedsupplemental pension plan for certain employees. The Company’s international subsidiaries fund their pensionplans according to local requirements. A reconciliation of the benefit obligations, plan assets, accrued benefit costand the amount recognized in financial statements for these plans is as follows:
2007 2006 2007 2006U.S. International
Change in benefit obligation:Benefit obligation at beginning of year . . . . . . . . . . . . . . . . . $165,927 $159,206 $ 44,811 $ 38,781
Service cost. . . . . . . . . . . . . . . . . . . . . . . . . . . . . . . . . . . . 5,273 5,543 1,961 1,890Interest cost . . . . . . . . . . . . . . . . . . . . . . . . . . . . . . . . . . . 9,964 9,294 2,519 1,902Participant contributions . . . . . . . . . . . . . . . . . . . . . . . . . . — — 224 163Special termination benefits. . . . . . . . . . . . . . . . . . . . . . . . — — 46 —Acquisitions . . . . . . . . . . . . . . . . . . . . . . . . . . . . . . . . . . . 1,629 — 7,441 —Addition of plan . . . . . . . . . . . . . . . . . . . . . . . . . . . . . . . . — — 3,541 2,445Foreign currency exchange rate change . . . . . . . . . . . . . . . — — 4,791 2,294Actuarial gain . . . . . . . . . . . . . . . . . . . . . . . . . . . . . . . . . . (5,772) (2,609) (3,755) (1,489)Benefits paid. . . . . . . . . . . . . . . . . . . . . . . . . . . . . . . . . . . (4,877) (5,507) (2,961) (1,175)
Benefit obligation at end of year . . . . . . . . . . . . . . . . . . . . . . $172,144 $165,927 $ 58,618 $ 44,811
Change in plan assets:Beginning fair value of plan assets . . . . . . . . . . . . . . . . . . . . . $118,632 $ 97,954 $ 17,799 $ 14,885
Actual return on plan assets. . . . . . . . . . . . . . . . . . . . . . . . 15,435 9,405 1,579 1,203Company contributions . . . . . . . . . . . . . . . . . . . . . . . . . . . 8,333 16,780 2,431 1,636Addition of plan . . . . . . . . . . . . . . . . . . . . . . . . . . . . . . . . — — 3,235 —Participant contributions . . . . . . . . . . . . . . . . . . . . . . . . . . — — 224 163Acquisitions . . . . . . . . . . . . . . . . . . . . . . . . . . . . . . . . . . . 1,127 — 5,855 —Foreign currency exchange rate change . . . . . . . . . . . . . . . — — 2,210 1,087Benefits paid. . . . . . . . . . . . . . . . . . . . . . . . . . . . . . . . . . . (4,877) (5,507) (2,961) (1,175)
Ending fair value of plan assets . . . . . . . . . . . . . . . . . . . . . . . $138,650 $118,632 $ 30,372 $ 17,799
Reconciliation of accrued cost:Funded status of the plan . . . . . . . . . . . . . . . . . . . . . . . . . . . $ (33,494) $ (47,295) $(28,246) $(27,012)Unrecognized actuarial loss . . . . . . . . . . . . . . . . . . . . . . . . . . — 51,806 — 10,678Unamortized prior service cost . . . . . . . . . . . . . . . . . . . . . . . — 3,581 — 210
Prepaid (accrued) benefit cost . . . . . . . . . . . . . . . . . . . . . . . . $ (33,494) $ 8,092 $(28,246) $(16,124)
Reconciliation of amount recognized in financial statements:Intangible asset. . . . . . . . . . . . . . . . . . . . . . . . . . . . . . . . . . . $ — $ 3,727 $ — $ 210Noncurrent asset. . . . . . . . . . . . . . . . . . . . . . . . . . . . . . . . . . 132 — 407 —Accrued benefit liability . . . . . . . . . . . . . . . . . . . . . . . . . . . . (1,880) (12,401) (637) (1,536)Pension and retirement obligations . . . . . . . . . . . . . . . . . . . . (31,746) (25,691) (28,016) (17,330)Accumulated other comprehensive income. . . . . . . . . . . . . . . — 42,457 — 2,532
Total amount recognized in financial statements . . . . . . . . . . $ (33,494) $ 8,092 $(28,246) $(16,124)
40
Notes to Consolidated Financial Statements — (Continued)
2007 2006 2007 2006U.S. International
Amounts recognized in accumulated other comprehensive loss:Net actuarial loss . . . . . . . . . . . . . . . . . . . . . . . . . . . . . . . . . . . . $37,742 $ — $7,059 $ —Prior service cost . . . . . . . . . . . . . . . . . . . . . . . . . . . . . . . . . . . . 3,038 — 182 —
Accumulated other comprehensive loss . . . . . . . . . . . . . . . . . . . . . . $40,780 $ — $7,241 $ —
Amounts expected to be recognized during next fiscal year:Amortization of net actuarial loss . . . . . . . . . . . . . . . . . . . . . . . . $ 1,979 $ — $ 228 $ —Amortization of prior service cost . . . . . . . . . . . . . . . . . . . . . . . . 543 — 54 —
Total . . . . . . . . . . . . . . . . . . . . . . . . . . . . . . . . . . . . . . . . . . . . . . . $ 2,522 $ — $ 282 $ —
Information about the accumulated benefit obligation is as follows:
2007 2006 2007 2006U.S. International
For all plans:Accumulated benefit obligation . . . . . . . . . . . . . . . $162,702 $156,724 $47,284 $35,203
For plans with benefit obligations in excess of planassets:Projected benefit obligation . . . . . . . . . . . . . . . . . . 170,465 165,927 53,171 44,811Accumulated benefit obligation . . . . . . . . . . . . . . . 161,023 156,724 44,983 35,203Fair value of plan assets . . . . . . . . . . . . . . . . . . . . 136,839 118,632 27,647 17,799
Net pension benefit costs include the following components:
2007 2006 2005 2007 2006 2005U.S. International
Service cost . . . . . . . . . . . . . . . . . . . . . . . . . $ 5,273 $ 5,543 $ 4,120 $ 1,961 $1,890 $1,686Interest cost . . . . . . . . . . . . . . . . . . . . . . . . . 9,964 9,294 8,102 2,519 1,902 1,594Expected return on plan assets . . . . . . . . . . . (10,163) (8,941) (8,403) (1,361) (960) (868)Amortization of prior service cost. . . . . . . . . 544 508 535 50 46 48Special termination benefits . . . . . . . . . . . . . — — — 46 — —Amortization of net actuarial loss . . . . . . . . . 3,019 3,742 2,046 424 556 248
Total benefit cost . . . . . . . . . . . . . . . . . . . . . $ 8,637 $10,146 $ 6,400 $ 3,639 $3,434 $2,708
The weighted average assumptions in the following table represent the rates used to develop the actuarial presentvalue of projected benefit obligation for the year listed and also the net periodic benefit cost for the following year.
2007 2006 2005 2007 2006 2005U.S. International
Discount rate . . . . . . . . . . . . . . . . . . . . . . . . . . . . . . . . . . . . . . 6.25% 6.00% 5.75% 5.00% 4.28% 4.18%Expected return on plan assets . . . . . . . . . . . . . . . . . . . . . . . . . 8.48 8.50 8.50 4.99 5.41 5.66Rate of compensation increase . . . . . . . . . . . . . . . . . . . . . . . . . . 3.30 3.30 3.30 3.36 3.13 3.13
The amortization of prior service cost is determined using a straight-line amortization of the cost over the averageremaining service period of employees expected to receive benefits under the plans.
41
Notes to Consolidated Financial Statements — (Continued)

In determining the expected return on plan assets, the Company considers both historical performance and anestimate of future long-term rates of return on assets similar to those in the Company’s plans. The Companyconsults with and considers the opinions of financial and other professionals in developing appropriate returnassumptions.
The allocation of pension plan assets as of October 31, 2007, and October 31, 2006, is as follows:
2007 2006 2007 2006U.S. International
Asset CategoryEquity securities . . . . . . . . . . . . . . . . . . . . . . . . . . . . . . . . . . 71% 70% 17% 17%Debt securities . . . . . . . . . . . . . . . . . . . . . . . . . . . . . . . . . . . 27 29 10 46Real estate . . . . . . . . . . . . . . . . . . . . . . . . . . . . . . . . . . . . . . — — 4 5Insurance contracts . . . . . . . . . . . . . . . . . . . . . . . . . . . . . . . . — — 66 31Other . . . . . . . . . . . . . . . . . . . . . . . . . . . . . . . . . . . . . . . . . . 2 1 3 1
Total . . . . . . . . . . . . . . . . . . . . . . . . . . . . . . . . . . . . . . . . . 100% 100% 100% 100%
The Company’s investment objective for defined benefit plan assets is to meet the plans’ benefit obligations, whileminimizing the potential for future required Company plan contributions.
U.S. plans comprise 82 percent of the worldwide pension assets. The investment strategies focus on asset classdiversification, liquidity to meet benefit payments and an appropriate balance of long-term investment return andrisk. Target ranges for asset allocations are determined by matching the actuarial projections of the plans’ futureliabilities and benefit payments with expected long-term rates of return on the assets, taking into accountinvestment return volatility and correlations across asset classes. The target allocation is 50 to 70 percent equitysecurities and 30 to 50 percent debt securities. Plan assets are diversified across several investment managers and aregenerally invested in liquid funds that are selected to track broad market equity and bond indices. Investment risk iscarefully controlled with plan assets rebalanced to target allocations on a periodic basis and continual monitoring ofinvestment managers’ performance relative to the investment guidelines established with each investment manager.
International plans comprise 18 percent of the worldwide pension assets. Asset allocations are developed on acountry-specific basis. The Company’s investment strategy is to cover pension obligations with insurance contractsor to employ independent managers to invest the assets.
At October 31, 2007 and October 31, 2006, the pension plans did not have any investment in the Company’sCommon Shares.
The Company’s contributions to the pension plans in fiscal 2008 are estimated to be approximately $11,000.
Retiree pension benefit payments, which reflect expected future service, are anticipated to be paid as follows:
Fiscal Year U.S. International
2008 . . . . . . . . . . . . . . . . . . . . . . . . . . . . . . . . . . . . . . . . . . . . . . . . . . . . . $ 8,494 $ 2,8662009 . . . . . . . . . . . . . . . . . . . . . . . . . . . . . . . . . . . . . . . . . . . . . . . . . . . . . 6,201 2,2092010 . . . . . . . . . . . . . . . . . . . . . . . . . . . . . . . . . . . . . . . . . . . . . . . . . . . . . 7,437 1,8332011 . . . . . . . . . . . . . . . . . . . . . . . . . . . . . . . . . . . . . . . . . . . . . . . . . . . . . 7,712 1,6072012 . . . . . . . . . . . . . . . . . . . . . . . . . . . . . . . . . . . . . . . . . . . . . . . . . . . . . 10,209 2,0592013-2017 . . . . . . . . . . . . . . . . . . . . . . . . . . . . . . . . . . . . . . . . . . . . . . . . . 57,525 11,188
Total . . . . . . . . . . . . . . . . . . . . . . . . . . . . . . . . . . . . . . . . . . . . . . . . . . . $97,578 $21,762
42
Notes to Consolidated Financial Statements — (Continued)
Other postretirement plans — The Company has an unfunded postretirement benefit plan covering most of itsU.S. employees. Employees hired after January 1, 2002, are not eligible to participate in this plan. The plan providesmedical and life insurance benefits. The plan is contributory, with retiree contributions in the form of premiumsadjusted annually, and contains other cost-sharing features, such as deductibles and coinsurance. The Company alsosponsors an unfunded, non-contributory postretirement benefit plan that provides medical and life insurancebenefits for certain international employees. The Company uses a measurement date of October 31 for allpostretirement plans.
In May 2004, the Financial Accounting Standards Board (“FASB”) issued Staff Position No. FSP 106-2,“Accounting and Disclosure Requirements Related to the Medicare Prescription Drug, Improvement and Mod-ernization Act of 2003,” in response to a new law that provides prescription drug benefits under Medicare(“Medicare Part D”) as well as a federal subsidy to sponsors of retiree health care benefit plans that provide a benefitthat is at least actuarially equivalent to Medicare Part D. Currently, Statement of Financial Accounting StandardNo. 106, “Employers’ Accounting for Postretirement Benefits Other Than Pensions,” (FAS 106) requires thatchanges in relevant law be considered in current measurement of postretirement benefit costs. In fiscal 2005, theCompany’s actuary determined that the prescription drug benefit provided by the Company’s postretirement plan isconsidered to be actuarially equivalent to the benefit provided under the Medicare Prescription Drug, Improvementand Modernization Act of 2003. The Company accounted for this benefit under the provisions of FAS 106. As aresult, the Company’s accumulated postretirement benefit obligation was reduced by $10,456, with an expensereduction of approximately $1,651 in fiscal 2005.
43
Notes to Consolidated Financial Statements — (Continued)
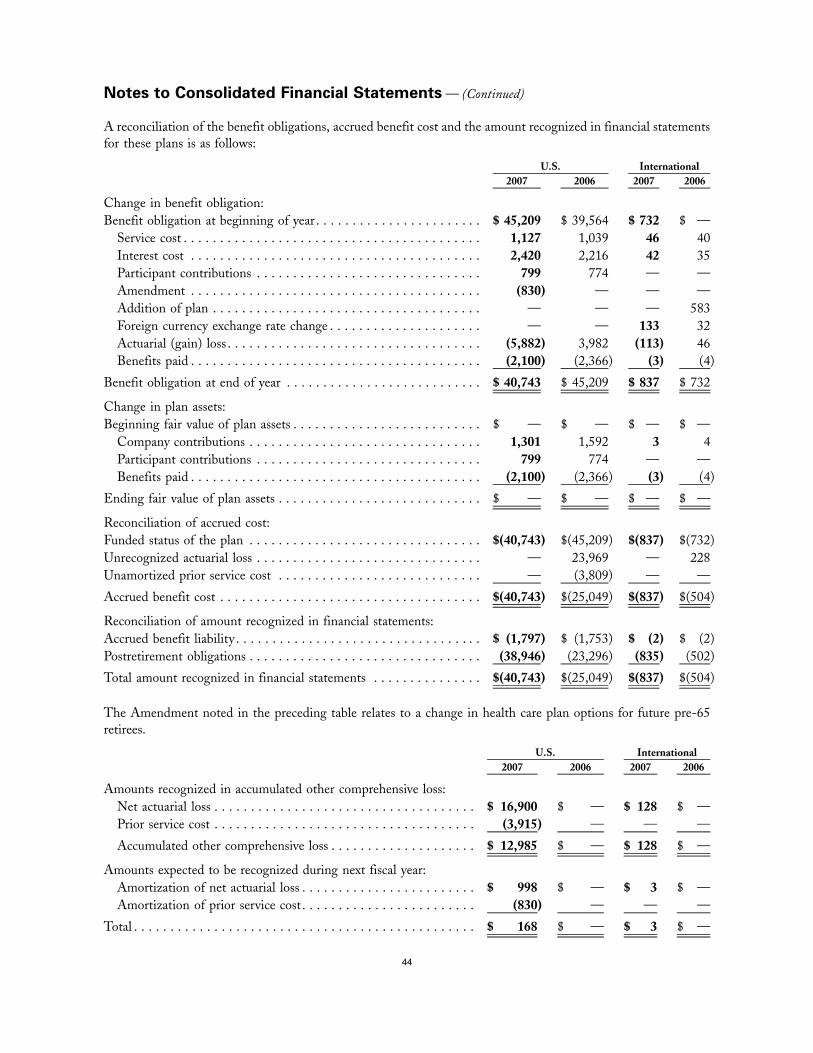
A reconciliation of the benefit obligations, accrued benefit cost and the amount recognized in financial statementsfor these plans is as follows:
2007 2006 2007 2006U.S. International
Change in benefit obligation:Benefit obligation at beginning of year . . . . . . . . . . . . . . . . . . . . . . . $ 45,209 $ 39,564 $ 732 $ —
Service cost . . . . . . . . . . . . . . . . . . . . . . . . . . . . . . . . . . . . . . . . . 1,127 1,039 46 40Interest cost . . . . . . . . . . . . . . . . . . . . . . . . . . . . . . . . . . . . . . . . 2,420 2,216 42 35Participant contributions . . . . . . . . . . . . . . . . . . . . . . . . . . . . . . . 799 774 — —Amendment . . . . . . . . . . . . . . . . . . . . . . . . . . . . . . . . . . . . . . . . (830) — — —Addition of plan . . . . . . . . . . . . . . . . . . . . . . . . . . . . . . . . . . . . . — — — 583Foreign currency exchange rate change . . . . . . . . . . . . . . . . . . . . . — — 133 32Actuarial (gain) loss . . . . . . . . . . . . . . . . . . . . . . . . . . . . . . . . . . . (5,882) 3,982 (113) 46Benefits paid . . . . . . . . . . . . . . . . . . . . . . . . . . . . . . . . . . . . . . . . (2,100) (2,366) (3) (4)
Benefit obligation at end of year . . . . . . . . . . . . . . . . . . . . . . . . . . . $ 40,743 $ 45,209 $ 837 $ 732
Change in plan assets:Beginning fair value of plan assets . . . . . . . . . . . . . . . . . . . . . . . . . . $ — $ — $ — $ —
Company contributions . . . . . . . . . . . . . . . . . . . . . . . . . . . . . . . . 1,301 1,592 3 4Participant contributions . . . . . . . . . . . . . . . . . . . . . . . . . . . . . . . 799 774 — —Benefits paid . . . . . . . . . . . . . . . . . . . . . . . . . . . . . . . . . . . . . . . . (2,100) (2,366) (3) (4)
Ending fair value of plan assets . . . . . . . . . . . . . . . . . . . . . . . . . . . . $ — $ — $ — $ —
Reconciliation of accrued cost:Funded status of the plan . . . . . . . . . . . . . . . . . . . . . . . . . . . . . . . . $(40,743) $(45,209) $(837) $(732)Unrecognized actuarial loss . . . . . . . . . . . . . . . . . . . . . . . . . . . . . . . — 23,969 — 228Unamortized prior service cost . . . . . . . . . . . . . . . . . . . . . . . . . . . . — (3,809) — —
Accrued benefit cost . . . . . . . . . . . . . . . . . . . . . . . . . . . . . . . . . . . . $(40,743) $(25,049) $(837) $(504)
Reconciliation of amount recognized in financial statements:Accrued benefit liability . . . . . . . . . . . . . . . . . . . . . . . . . . . . . . . . . . $ (1,797) $ (1,753) $ (2) $ (2)Postretirement obligations . . . . . . . . . . . . . . . . . . . . . . . . . . . . . . . . (38,946) (23,296) (835) (502)
Total amount recognized in financial statements . . . . . . . . . . . . . . . $(40,743) $(25,049) $(837) $(504)
The Amendment noted in the preceding table relates to a change in health care plan options for future pre-65retirees.
2007 2006 2007 2006U.S. International
Amounts recognized in accumulated other comprehensive loss:Net actuarial loss . . . . . . . . . . . . . . . . . . . . . . . . . . . . . . . . . . . . $ 16,900 $ — $ 128 $ —Prior service cost . . . . . . . . . . . . . . . . . . . . . . . . . . . . . . . . . . . . (3,915) — — —
Accumulated other comprehensive loss . . . . . . . . . . . . . . . . . . . . $ 12,985 $ — $ 128 $ —
Amounts expected to be recognized during next fiscal year:Amortization of net actuarial loss . . . . . . . . . . . . . . . . . . . . . . . . $ 998 $ — $ 3 $ —Amortization of prior service cost . . . . . . . . . . . . . . . . . . . . . . . . (830) — — —
Total . . . . . . . . . . . . . . . . . . . . . . . . . . . . . . . . . . . . . . . . . . . . . . . $ 168 $ — $ 3 $ —
44
Notes to Consolidated Financial Statements — (Continued)
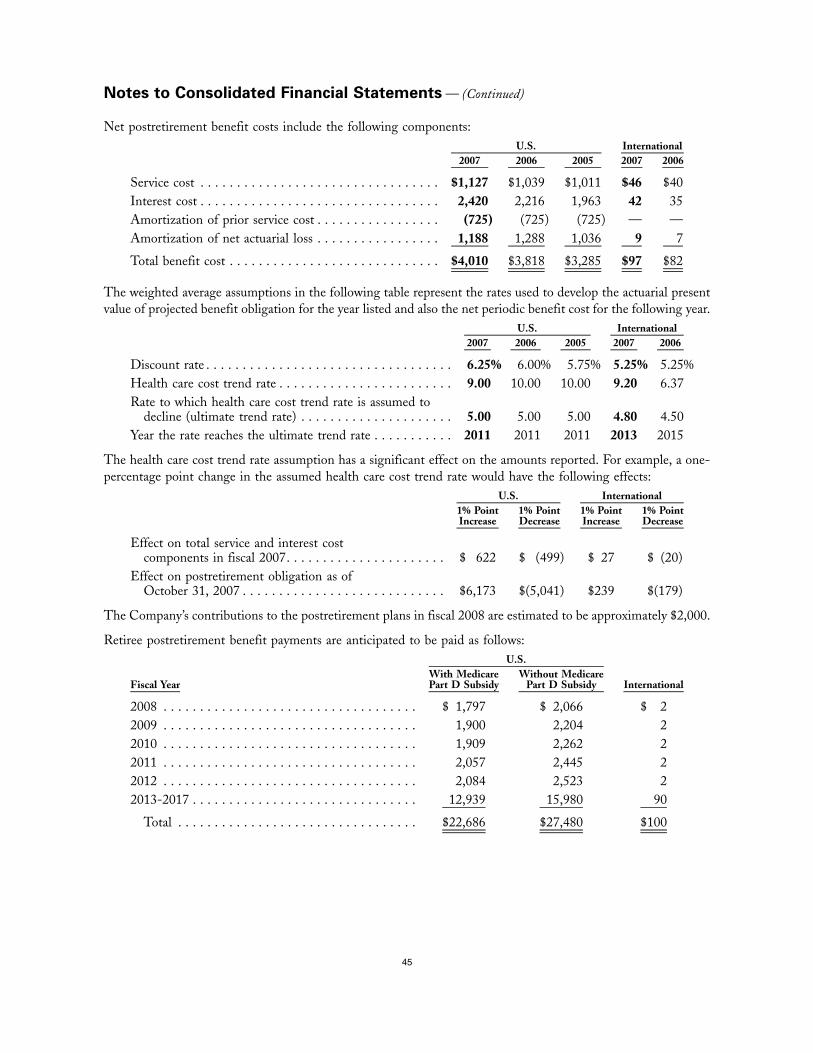
Net postretirement benefit costs include the following components:
2007 2006 2005 2007 2006U.S. International
Service cost . . . . . . . . . . . . . . . . . . . . . . . . . . . . . . . . . $1,127 $1,039 $1,011 $46 $40Interest cost . . . . . . . . . . . . . . . . . . . . . . . . . . . . . . . . . 2,420 2,216 1,963 42 35Amortization of prior service cost . . . . . . . . . . . . . . . . . (725) (725) (725) — —Amortization of net actuarial loss . . . . . . . . . . . . . . . . . 1,188 1,288 1,036 9 7
Total benefit cost . . . . . . . . . . . . . . . . . . . . . . . . . . . . . $4,010 $3,818 $3,285 $97 $82
The weighted average assumptions in the following table represent the rates used to develop the actuarial presentvalue of projected benefit obligation for the year listed and also the net periodic benefit cost for the following year.
2007 2006 2005 2007 2006U.S. International
Discount rate . . . . . . . . . . . . . . . . . . . . . . . . . . . . . . . . . . 6.25% 6.00% 5.75% 5.25% 5.25%Health care cost trend rate . . . . . . . . . . . . . . . . . . . . . . . . 9.00 10.00 10.00 9.20 6.37Rate to which health care cost trend rate is assumed to
decline (ultimate trend rate) . . . . . . . . . . . . . . . . . . . . . 5.00 5.00 5.00 4.80 4.50Year the rate reaches the ultimate trend rate . . . . . . . . . . . 2011 2011 2011 2013 2015
The health care cost trend rate assumption has a significant effect on the amounts reported. For example, a one-percentage point change in the assumed health care cost trend rate would have the following effects:
1% PointIncrease
1% PointDecrease
1% PointIncrease
1% PointDecrease
U.S. International
Effect on total service and interest costcomponents in fiscal 2007. . . . . . . . . . . . . . . . . . . . . . $ 622 $ (499) $ 27 $ (20)
Effect on postretirement obligation as ofOctober 31, 2007 . . . . . . . . . . . . . . . . . . . . . . . . . . . . $6,173 $(5,041) $239 $(179)
The Company’s contributions to the postretirement plans in fiscal 2008 are estimated to be approximately $2,000.
Retiree postretirement benefit payments are anticipated to be paid as follows:
Fiscal YearWith MedicarePart D Subsidy
Without MedicarePart D Subsidy International
U.S.
2008 . . . . . . . . . . . . . . . . . . . . . . . . . . . . . . . . . . . $ 1,797 $ 2,066 $ 22009 . . . . . . . . . . . . . . . . . . . . . . . . . . . . . . . . . . . 1,900 2,204 22010 . . . . . . . . . . . . . . . . . . . . . . . . . . . . . . . . . . . 1,909 2,262 22011 . . . . . . . . . . . . . . . . . . . . . . . . . . . . . . . . . . . 2,057 2,445 22012 . . . . . . . . . . . . . . . . . . . . . . . . . . . . . . . . . . . 2,084 2,523 22013-2017 . . . . . . . . . . . . . . . . . . . . . . . . . . . . . . . 12,939 15,980 90
Total . . . . . . . . . . . . . . . . . . . . . . . . . . . . . . . . . $22,686 $27,480 $100
45
Notes to Consolidated Financial Statements — (Continued)

Note 5 — Income taxes
Income tax expense from continuing operations includes the following:
2007 2006 2005
Current:U.S. federal . . . . . . . . . . . . . . . . . . . . . . . . . . . . . . . . . . . . . . . . $23,832 $22,112 $12,129State and local . . . . . . . . . . . . . . . . . . . . . . . . . . . . . . . . . . . . . . 375 991 815Foreign . . . . . . . . . . . . . . . . . . . . . . . . . . . . . . . . . . . . . . . . . . . 20,406 16,616 14,727
Total current . . . . . . . . . . . . . . . . . . . . . . . . . . . . . . . . . . . . . 44,613 39,719 27,671Deferred:
U.S. federal . . . . . . . . . . . . . . . . . . . . . . . . . . . . . . . . . . . . . . . . 418 (793) 5,418State and local . . . . . . . . . . . . . . . . . . . . . . . . . . . . . . . . . . . . . . 1,811 566 3,209Foreign . . . . . . . . . . . . . . . . . . . . . . . . . . . . . . . . . . . . . . . . . . . (1,812) (725) (523)
Total deferred . . . . . . . . . . . . . . . . . . . . . . . . . . . . . . . . . . . . 417 (952) 8,104
$45,030 $38,767 $35,775
Foreign income tax expense includes a benefit related to the utilization of loss carryforwards of $451, $1,126 and$578 in fiscal years 2007, 2006 and 2005, respectively. The fiscal 2007 expense amount includes a benefit of $900related to settlement of tax issues from prior years.
The reconciliation of the U.S. statutory federal income tax rate to the worldwide-consolidated effective tax ratefollows:
2007 2006 2005
Statutory federal income tax rate . . . . . . . . . . . . . . . . . . . . . . . . . . 35.00% 35.00% 35.00%Extraterritorial income exclusion. . . . . . . . . . . . . . . . . . . . . . . . . (0.48) (2.46) (2.65)Domestic Production Deduction. . . . . . . . . . . . . . . . . . . . . . . . . (0.59) (0.51) —Foreign tax rate variances, net of foreign tax credits . . . . . . . . . . 0.81 (1.70) (4.50)State and local taxes, net of federal income tax benefit . . . . . . . . 1.08 0.72 2.17Amounts related to prior years . . . . . . . . . . . . . . . . . . . . . . . . . . (1.66) (2.99) (0.02)Other — net . . . . . . . . . . . . . . . . . . . . . . . . . . . . . . . . . . . . . . . (0.98) 0.35 (0.26)
Effective tax rate . . . . . . . . . . . . . . . . . . . . . . . . . . . . . . . . . . . . . . 33.18% 28.41% 29.74%
Included in foreign tax rate variances, net of foreign tax credits for fiscal years 2006 and 2005, are benefits of $1,010and $7,367, respectively, related to foreign tax credit carryforwards that were utilized. These carryforwards werepreviously offset with a valuation allowance, because the Company was uncertain they would be utilized beforeexpiration. The extraterritorial income exclusion allows a portion of certain income from export sales of goodsmanufactured in the United States to be excluded from taxable income. The extraterritorial income exclusion wasrepealed after December 31, 2006 by the American Jobs Creation Act of 2004 (the “AJCA”). The DomesticProduction Deduction, enacted by the AJCA, is effective for the Company in fiscal 2006 and allows a deductionwith respect to income from certain U.S. manufacturing activities.
In December 2006, Congress passed and the President signed the Tax Relief and Health Care Act, which providedretroactive reinstatement of a research credit. The fiscal 2007 impact on the Company from this Act was anadditional tax benefit of $500, of which $300 was recorded in the first quarter and the balance recorded in the thirdquarter, in accordance with FAS No. 109.
46
Notes to Consolidated Financial Statements — (Continued)

The Joint Committee on Taxation approved an income tax refund of approximately $3,100 during fiscal 2006. Thisitem was treated as a discrete event in the third quarter of fiscal 2006 and is included in amounts related to prioryears in the table above.
Earnings before income taxes of international operations, which are calculated before intercompany profitelimination entries, were $52,125, $45,211 and $37,009 in fiscal years 2007, 2006 and 2005, respectively. Deferredincome taxes are not provided on undistributed earnings of international subsidiaries that are intended to bepermanently invested in those operations. These undistributed earnings aggregated approximately $159,041 and$100,763 at October 31, 2007 and 2006, respectively. Should these earnings be distributed, applicable foreign taxcredits would substantially offset U.S. taxes due upon the distribution.
Significant components of the Company’s deferred tax assets and liabilities are as follows:
2007 2006
Deferred tax assets:Sales to international subsidiaries and related consolidation adjustments . . . . . . . . . . . $ 7,867 $ 5,508Employee benefits . . . . . . . . . . . . . . . . . . . . . . . . . . . . . . . . . . . . . . . . . . . . . . . . . . . 58,948 43,469Other accruals not currently deductible for taxes . . . . . . . . . . . . . . . . . . . . . . . . . . . . . 10,835 11,648Tax credit and loss carryforwards . . . . . . . . . . . . . . . . . . . . . . . . . . . . . . . . . . . . . . . . 5,508 4,136Inventory adjustments . . . . . . . . . . . . . . . . . . . . . . . . . . . . . . . . . . . . . . . . . . . . . . . . 3,526 3,725Other — net . . . . . . . . . . . . . . . . . . . . . . . . . . . . . . . . . . . . . . . . . . . . . . . . . . . . . . . 9 133
Total deferred tax assets . . . . . . . . . . . . . . . . . . . . . . . . . . . . . . . . . . . . . . . . . . . . . 86,693 68,619Valuation allowance . . . . . . . . . . . . . . . . . . . . . . . . . . . . . . . . . . . . . . . . . . . . . . . . (5,462) (4,136)
Total deferred tax assets . . . . . . . . . . . . . . . . . . . . . . . . . . . . . . . . . . . . . . . . . . . . . 81,231 64,483Deferred tax liabilities:
Depreciation . . . . . . . . . . . . . . . . . . . . . . . . . . . . . . . . . . . . . . . . . . . . . . . . . . . . . . . 57,682 34,728Translation of foreign currency accounts . . . . . . . . . . . . . . . . . . . . . . . . . . . . . . . . . . . 151 299Other — net . . . . . . . . . . . . . . . . . . . . . . . . . . . . . . . . . . . . . . . . . . . . . . . . . . . . . . . 1,469 208
Total deferred tax liabilities . . . . . . . . . . . . . . . . . . . . . . . . . . . . . . . . . . . . . . . . . . 59,302 35,235
Net deferred tax assets . . . . . . . . . . . . . . . . . . . . . . . . . . . . . . . . . . . . . . . . . . . . . . . . $21,929 $29,248
At October 31, 2007, the Company had $515 of tax credit carryforwards that will expire in fiscal years 2009 through2017. At October 31, 2007, the Company had $1,576 Federal, $32,627 state and $7,945 foreign operating losscarryforwards, of which $34,489 will expire in fiscal years 2008 through 2027, and $7,660 of which has an indefinitecarryforward period. The net change in the valuation allowance was an increase of $1,326 in fiscal 2007 and adecrease of $2,285 in fiscal 2006. The valuation allowance of $5,462 at October 31, 2007, relates to tax credits andloss carryforwards that may expire before being realized.
Note 6 — Incentive compensation plans
The Company has two incentive compensation plans for executive officers. The Compensation Committee of theboard of directors, composed of independent directors, approves participants in the plans and payments under theplans.
The annual payouts under the management incentive compensation plan are based upon corporate and individualperformance and are calculated as a percentage of base salary for each executive officer. Compensation expenseattributable to this plan was $3,621, $4,711 and $4,432 in fiscal years 2007, 2006 and 2005, respectively.
47
Notes to Consolidated Financial Statements — (Continued)

Under the long-term incentive compensation plan, executive officers receive cash or stock payouts based solely oncorporate performance measures over three-year performance periods. Payouts vary based on the degree to whichcorporate performance equals or exceeds predetermined threshold, target and maximum performance levels at theend of a performance period. No payout will occur unless the Company achieves certain pre-determined perfor-mance objectives. The Committee may, however, choose to modify measures, change payment levels or otherwiseexercise discretion to reflect the external economic environment and individual or Company performance.Compensation expense attributable to this plan was $4,606, $5,238 and $4,237 in fiscal years 2007, 2006 and2005, respectively.
Note 7 — Details of balance sheet
2007 2006
Receivables:Accounts . . . . . . . . . . . . . . . . . . . . . . . . . . . . . . . . . . . . . . . . . . . . . . . $ 215,478 $ 176,422Notes . . . . . . . . . . . . . . . . . . . . . . . . . . . . . . . . . . . . . . . . . . . . . . . . . . 9,582 8,511Other . . . . . . . . . . . . . . . . . . . . . . . . . . . . . . . . . . . . . . . . . . . . . . . . . . 9,235 9,191
234,295 194,124Allowance for doubtful accounts . . . . . . . . . . . . . . . . . . . . . . . . . . . . . . (4,302) (3,665)
$ 229,993 $ 190,459
Inventories:Finished goods . . . . . . . . . . . . . . . . . . . . . . . . . . . . . . . . . . . . . . . . . . . $ 70,649 $ 41,757Work-in-process . . . . . . . . . . . . . . . . . . . . . . . . . . . . . . . . . . . . . . . . . . 14,874 10,904Raw materials and finished parts . . . . . . . . . . . . . . . . . . . . . . . . . . . . . . 52,826 47,392
138,349 100,053Obsolescence and other reserves . . . . . . . . . . . . . . . . . . . . . . . . . . . . . . (11,117) (7,499)LIFO reserve . . . . . . . . . . . . . . . . . . . . . . . . . . . . . . . . . . . . . . . . . . . . (7,582) (8,866)
$ 119,650 $ 83,688
Property, plant and equipment:Land . . . . . . . . . . . . . . . . . . . . . . . . . . . . . . . . . . . . . . . . . . . . . . . . . . $ 8,482 $ 6,879Land improvements . . . . . . . . . . . . . . . . . . . . . . . . . . . . . . . . . . . . . . . 3,018 2,925Buildings . . . . . . . . . . . . . . . . . . . . . . . . . . . . . . . . . . . . . . . . . . . . . . . 107,394 100,106Machinery and equipment . . . . . . . . . . . . . . . . . . . . . . . . . . . . . . . . . . . 201,876 166,097Enterprise management system . . . . . . . . . . . . . . . . . . . . . . . . . . . . . . . 33,727 31,162Construction-in-progress . . . . . . . . . . . . . . . . . . . . . . . . . . . . . . . . . . . . 6,737 4,859Leased property under capitalized leases . . . . . . . . . . . . . . . . . . . . . . . . 21,751 17,868
382,985 329,896Accumulated depreciation and amortization . . . . . . . . . . . . . . . . . . . . . . (250,068) (224,481)
$ 132,917 $ 105,415
Accrued liabilities:Salaries and other compensation . . . . . . . . . . . . . . . . . . . . . . . . . . . . . . $ 46,340 $ 44,462Pension and retirement . . . . . . . . . . . . . . . . . . . . . . . . . . . . . . . . . . . . . 3,566 15,601Taxes other than income taxes . . . . . . . . . . . . . . . . . . . . . . . . . . . . . . . . 8,028 6,132Other . . . . . . . . . . . . . . . . . . . . . . . . . . . . . . . . . . . . . . . . . . . . . . . . . . 45,061 40,647
$ 102,995 $ 106,842
48
Notes to Consolidated Financial Statements — (Continued)

Note 8 — Leases
The Company has lease commitments expiring at various dates, principally for manufacturing, warehouse and officespace, automobiles and office equipment. Many leases contain renewal options and some contain purchase optionsand residual guarantees.
Rent expense for all operating leases was approximately $10,815, $9,299 and $10,121 in fiscal years 2007, 2006 and2005, respectively.
Amortization of assets recorded under capital leases is recorded in depreciation expense.
Assets held under capitalized leases and included in property, plant and equipment are as follows:2007 2006
Transportation equipment . . . . . . . . . . . . . . . . . . . . . . . . . . . . . . . . . . . . . . . . $17,378 $16,127Other . . . . . . . . . . . . . . . . . . . . . . . . . . . . . . . . . . . . . . . . . . . . . . . . . . . . . . . 4,373 1,741
Total capitalized leases . . . . . . . . . . . . . . . . . . . . . . . . . . . . . . . . . . . . . . . . . . 21,751 17,868Accumulated amortization . . . . . . . . . . . . . . . . . . . . . . . . . . . . . . . . . . . . . . . (9,409) (8,148)
Net capitalized leases . . . . . . . . . . . . . . . . . . . . . . . . . . . . . . . . . . . . . . . . . $12,342 $ 9,720
At October 31, 2007, future minimum lease payments under noncancelable capitalized and operating leases are asfollows:
Capitalized Operating
Fiscal year ending:2008 . . . . . . . . . . . . . . . . . . . . . . . . . . . . . . . . . . . . . . . . . . . . . . . . . . . . $ 6,856 $10,7302009 . . . . . . . . . . . . . . . . . . . . . . . . . . . . . . . . . . . . . . . . . . . . . . . . . . . . 4,386 6,9512010 . . . . . . . . . . . . . . . . . . . . . . . . . . . . . . . . . . . . . . . . . . . . . . . . . . . . 1,846 5,1592011 . . . . . . . . . . . . . . . . . . . . . . . . . . . . . . . . . . . . . . . . . . . . . . . . . . . . 483 3,7692012 . . . . . . . . . . . . . . . . . . . . . . . . . . . . . . . . . . . . . . . . . . . . . . . . . . . . 284 1,780Later years. . . . . . . . . . . . . . . . . . . . . . . . . . . . . . . . . . . . . . . . . . . . . . . . 3,172 8,167
Total minimum lease payments . . . . . . . . . . . . . . . . . . . . . . . . . . . . . . . . . . 17,027 $36,556
Less amount representing executory costs . . . . . . . . . . . . . . . . . . . . . . . . . . . 2,796
Net minimum lease payments . . . . . . . . . . . . . . . . . . . . . . . . . . . . . . . . . . . 14,231Less amount representing interest . . . . . . . . . . . . . . . . . . . . . . . . . . . . . . . . 1,888
Present value of net minimum lease payments . . . . . . . . . . . . . . . . . . . . . . . 12,343Less current portion . . . . . . . . . . . . . . . . . . . . . . . . . . . . . . . . . . . . . . . . . . 5,305
Long-term obligations at October 31, 2007 . . . . . . . . . . . . . . . . . . . . . . . . . $ 7,038
49
Notes to Consolidated Financial Statements — (Continued)

Note 9 — Notes payable
Bank lines of credit and notes payable are summarized as follows:2007 2006
Available bank lines of credit:Domestic banks . . . . . . . . . . . . . . . . . . . . . . . . . . . . . . . . . . . . . . . . . . . . $445,000 $215,000Foreign banks . . . . . . . . . . . . . . . . . . . . . . . . . . . . . . . . . . . . . . . . . . . . . 70,393 53,157
Total . . . . . . . . . . . . . . . . . . . . . . . . . . . . . . . . . . . . . . . . . . . . . . . . . . $515,393 $268,157
Outstanding notes payable:Domestic bank debt. . . . . . . . . . . . . . . . . . . . . . . . . . . . . . . . . . . . . . . . . $280,000 $ —Foreign bank debt . . . . . . . . . . . . . . . . . . . . . . . . . . . . . . . . . . . . . . . . . . 19,809 15,898
Total . . . . . . . . . . . . . . . . . . . . . . . . . . . . . . . . . . . . . . . . . . . . . . . . . . $299,809 $ 15,898
Weighted-average interest rate on notes payable . . . . . . . . . . . . . . . . . . . . . . 5.3% 3.1%Unused bank lines of credit . . . . . . . . . . . . . . . . . . . . . . . . . . . . . . . . . . . . . $215,584 $252,259
Included in the domestic available amount above is a $400,000 revolving credit agreement with a group of banksthat expires in 2012. Payment of quarterly commitment fees is required. Other lines of credit obtained by theCompany can generally be withdrawn at the option of the banks and do not require material compensating balancesor commitment fees.
Note 10 — Long-term debt
The long-term debt of the Company is as follows:2007 2006
Senior notes, due 2005-2011 . . . . . . . . . . . . . . . . . . . . . . . . . . . . . . . . . . . . . $47,130 $ 51,420Senior notes, due 2007 . . . . . . . . . . . . . . . . . . . . . . . . . . . . . . . . . . . . . . . . . — 50,000
47,130 101,420Less current maturities . . . . . . . . . . . . . . . . . . . . . . . . . . . . . . . . . . . . . . . . . 24,290 54,290
Long-term maturities . . . . . . . . . . . . . . . . . . . . . . . . . . . . . . . . . . . . . . . . . . $22,840 $ 47,130
Senior notes, due 2005-2011 — These notes, with a group of insurance companies, have a weighted-average,fixed-interest rate of 7.19 percent and had an original weighted-average life of 6.5 years at the time of issuance in2001.
Senior note, due 2007 — This note was payable in one installment and had a fixed interest rate of 6.78 percent.
Annual maturities — The annual maturities of long-term debt for the five fiscal years subsequent to October 31, 2007,are as follows: $24,290 in 2008; $4,290 in 2009; $4,290 in 2010; $14,260 in 2011. There are no long-term debt maturitiesafter 2011.
Note 11 — Financial instruments
The Company enters into foreign currency forward contracts, which are derivative financial instruments, to reducethe risk of foreign currency exposures resulting from receivables, payables, intercompany receivables, intercompanypayables and loans denominated in foreign currencies. The maturities of these contracts are usually less than 90 days.Forward contracts are marked to market each accounting period, and the resulting gains or losses are included inother income (expense) in the Consolidated Statement of Income. A gain of $862 was recognized from changes infair value of these contracts in fiscal year 2007. A gain of $2,524 was recognized from changes in fair value of thesecontracts in fiscal year 2006, and a loss of $2,573 was recognized from changes in fair value of these contracts infiscal year 2005.
50
Notes to Consolidated Financial Statements — (Continued)

At October 31, 2007, the Company had outstanding forward exchange contracts that mature at various datesthrough December 2007. The following table summarizes, by currency, the Company’s forward exchange contracts:
NotionalAmounts
Fair MarketValue
NotionalAmounts
Fair MarketValue
Sell Buy
October 31, 2007 contract amounts:Euro . . . . . . . . . . . . . . . . . . . . . . . . . . . . . . $ 7,045 $ 7,243 $ 84,371 $ 86,057British pound . . . . . . . . . . . . . . . . . . . . . . . . 4,075 4,173 12,684 12,987Japanese yen . . . . . . . . . . . . . . . . . . . . . . . . . 5,116 5,071 10,763 10,599Others . . . . . . . . . . . . . . . . . . . . . . . . . . . . . 3,398 3,536 15,025 15,488
Total . . . . . . . . . . . . . . . . . . . . . . . . . . . . . . $19,634 $20,023 $122,843 $125,131
October 31, 2006 contract amounts:Euro . . . . . . . . . . . . . . . . . . . . . . . . . . . . . . $ 7,835 $ 7,877 $ 77,824 $ 78,500British pound . . . . . . . . . . . . . . . . . . . . . . . . 755 763 9,987 10,132Japanese yen . . . . . . . . . . . . . . . . . . . . . . . . . 2,573 2,565 18,204 18,313Others . . . . . . . . . . . . . . . . . . . . . . . . . . . . . 3,419 3,429 12,285 12,444
Total . . . . . . . . . . . . . . . . . . . . . . . . . . . . . . $14,582 $14,634 $118,300 $119,389
The Company also uses foreign denominated fixed-rate debt and intercompany foreign currency transactions of along-term investment nature to hedge the value of its investment in its wholly owned subsidiaries. For hedges of thenet investment in foreign operations, realized and unrealized gains and losses are shown in the cumulativetranslation adjustment account included in total comprehensive income. For fiscal years 2007 and 2006, net gains of$1,718 and $1,489, respectively, were included in the cumulative translation adjustment account related to foreigndenominated fixed-rate debt designated as a hedge of net investment in foreign operations.
The Company is exposed to credit-related losses in the event of nonperformance by counterparties to financialinstruments. The Company uses major banks throughout the world for cash deposits, forward exchange contractsand interest rate swaps. The Company’s customers represent a wide variety of industries and geographic regions. Asof October 31, 2007, there were no significant concentrations of credit risk. The Company does not use financialinstruments for trading or speculative purposes.
51
Notes to Consolidated Financial Statements — (Continued)

The carrying amounts and fair values of the Company’s financial instruments, other than receivables and accountspayable, are as follows:
CarryingAmount Fair Value
CarryingAmount Fair Value
20062007
Cash and cash equivalents . . . . . . . . . . . . . . . . $ 31,136 $ 31,136 $ 48,859 $ 48,859Marketable securities . . . . . . . . . . . . . . . . . . . . 9 9 9 9Notes payable . . . . . . . . . . . . . . . . . . . . . . . . . (299,809) (299,809) (15,898) (15,898)Long-term debt . . . . . . . . . . . . . . . . . . . . . . . . (47,130) (49,350) (101,420) (104,113)Forward exchange contracts . . . . . . . . . . . . . . . 1,899 1,899 1,037 1,037
The Company used the following methods and assumptions in estimating the fair value of financial instruments:
• Cash, cash equivalents and notes payable are valued at their carrying amounts due to the relatively short periodto maturity of the instruments.
• Marketable securities are valued at quoted market prices.
• Long-term debt is valued by discounting future cash flows at currently available rates for borrowingarrangements with similar terms and conditions.
• Forward exchange contracts are estimated using quoted exchange rates of comparable contracts.
Note 12 — Capital shares
Preferred — The Company has authorized 10,000 Series A convertible preferred shares without par value. Nopreferred shares were outstanding in fiscal years 2007, 2006 or 2005.
Common — The Company has 80,000 authorized Common Shares without par value. In March 1992, theshareholders adopted an amendment to the Company’s articles of incorporation, which, when filed with theSecretary of State for the State of Ohio, would increase the number of authorized Common Shares to 160,000. AtOctober 31, 2007 and 2006, there were 49,011 Common Shares issued. At October 31, 2007 and 2006, the numberof outstanding Common Shares, net of treasury shares, was 33,710 and 33,411, respectively.
Note 13 — Stock-based compensation
The Company’s long-term performance plan, approved by the Company’s shareholders in 2004, provides for thegranting of stock options, stock appreciation rights, nonvested stock, stock purchase rights, stock equivalent units,restricted stock units, cash awards and other stock- or performance-based incentives. The number of CommonShares available for grant is 3 percent of the number of Common Shares outstanding as of the first day of each fiscalyear, plus up to an additional 0.5 percent, consisting of shares available, but not granted, in prior years. At the end offiscal 2007, there were 1,180 shares available for grant in fiscal 2008.
Stock options — Nonqualified or incentive stock options may be granted to employees and directors of theCompany. Generally, options granted to employees may be exercised beginning one year from the date of grant at arate not exceeding 25 percent per year for executive officers and 20 percent per year for other employees and expire10 years from the date of grant. Vesting accelerates upon the occurrence of events that involve or may result in achange of control of the Company. Option exercises are satisfied through the issuance of treasury shares on a first-infirst-out basis.
52
Notes to Consolidated Financial Statements — (Continued)

Prior to fiscal 2006, the Company accounted for its stock options under the recognition and measurement principlesof APB Opinion No. 25, “Accounting for Stock Issued to Employees.” No stock option expense was reflected in netincome, as all options granted under these plans had an exercise price equal to the fair market value of the underlyingCommon Shares on the date of grant. Effective at the beginning of fiscal 2006, the Company adopted the fair valuerecognition provisions of FAS 123 (R) using the modified prospective transition method. Under this methodcompensation cost in fiscal 2006 includes cost for options granted prior to but not vested as of October 31, 2005, andoptions granted in fiscal 2006. Compensation expense is being recognized on a straight-line basis over the totalrequisite service period of each option grant. Results for prior periods have not been restated.
The following table shows pro forma information regarding net income and earnings per share for fiscal 2005 as ifthe Company had accounted for stock options granted since fiscal 1996 under the fair value method.
2005
Net income, as reported . . . . . . . . . . . . . . . . . . . . . . . . . . . . . . . . . . . . . . . . . . . . . . . . $ 78,338Deduct: Total stock-based employee compensation expense determined under fair value
based method for all awards, net of tax . . . . . . . . . . . . . . . . . . . . . . . . . . . . . . . . . . . (3,777)
Pro forma net income . . . . . . . . . . . . . . . . . . . . . . . . . . . . . . . . . . . . . . . . . . . . . . . . . $ 74,561
Earnings per share:Basic — as reported . . . . . . . . . . . . . . . . . . . . . . . . . . . . . . . . . . . . . . . . . . . . . . . . . $ 2.19Basic — pro forma . . . . . . . . . . . . . . . . . . . . . . . . . . . . . . . . . . . . . . . . . . . . . . . . . . $ 2.09Diluted — as reported . . . . . . . . . . . . . . . . . . . . . . . . . . . . . . . . . . . . . . . . . . . . . . . $ 2.14Diluted — pro forma . . . . . . . . . . . . . . . . . . . . . . . . . . . . . . . . . . . . . . . . . . . . . . . . $ 2.04
Weighted-average fair value of options granted during the year . . . . . . . . . . . . . . . . . . . $ 12.08Risk-free interest rate . . . . . . . . . . . . . . . . . . . . . . . . . . . . . . . . . . . . . . . . . . . . . . . . . . 3.87-3.88%Expected life of option, in years . . . . . . . . . . . . . . . . . . . . . . . . . . . . . . . . . . . . . . . . . . 7Expected dividend yield . . . . . . . . . . . . . . . . . . . . . . . . . . . . . . . . . . . . . . . . . . . . . . . . 1.71%Expected volatility . . . . . . . . . . . . . . . . . . . . . . . . . . . . . . . . . . . . . . . . . . . . . . . . . . . . 0.30
As a result of adopting FAS 123(R), the Company recognized compensation expense of $3,259 and $3,675 for fiscalyears 2007 and 2006, respectively.
Prior to the adoption of FAS 123(R), the Company presented the tax benefit of deductions resulting from theexercise of stock options as operating cash flows in the Statement of Cash Flows. FAS 123(R) requires these benefitsto be classified as financing cash flows. The excess tax benefit of $4,269 and $9,074 fiscal years 2007 and 2006,respectively, were classified as financing cash inflows and would have been classified as operating cash flows prior toadoption of FAS 123(R).
53
Notes to Consolidated Financial Statements — (Continued)

Following is a summary of the Company’s stock options for the three years ended October 31, 2007:
Number ofOptions
Weighted-AverageExercise Price Per
Share
AggregateIntrinsic
ValueWeighted-AverageRemaining Term
Outstanding at October 31, 2004 . . . . 3,823 $25.33Granted . . . . . . . . . . . . . . . . . . . . . 343 $37.04Exercised. . . . . . . . . . . . . . . . . . . . . (592) $24.86Forfeited or expired . . . . . . . . . . . . . (85) $28.73
Outstanding at October 30, 2005 . . . . 3,489 $26.48Granted . . . . . . . . . . . . . . . . . . . . . 331 $38.81Exercised. . . . . . . . . . . . . . . . . . . . . (1,136) $24.49Forfeited or expired . . . . . . . . . . . . . (61) $30.66
Outstanding at October 31, 2006 . . . . 2,623 $28.80Granted . . . . . . . . . . . . . . . . . . . . . 252 $49.16Exercised. . . . . . . . . . . . . . . . . . . . . (579) $26.68Forfeited or expired . . . . . . . . . . . . . (48) $33.04
Outstanding at October 31, 2007 . . . . 2,248 $31.54 $49,387 5.6 years
Vested at October 31, 2007 orexpected to vest . . . . . . . . . . . . . . . . 2,209 $31.37 $48,895 5.6 years
Exercisable at October 31, 2007 . . . . . 1,496 $27.36 $39,098 4.5 years
Summarized information on currently outstanding options follows:
$20 — $25 $26 — $30 $31 — $39 $40 — $56Range of Exercise Price
Number outstanding . . . . . . . . . . . . . . . . . . . . . . . . 607 798 593 250Weighted-average remaining contractual life, in
years . . . . . . . . . . . . . . . . . . . . . . . . . . . . . . . . . . 3.3 4.8 7.6 9.1Weighted-average exercise price . . . . . . . . . . . . . . . . $22.84 $27.86 $37.99 $49.16Number exercisable . . . . . . . . . . . . . . . . . . . . . . . . . 607 663 226 NAWeighted-average exercise price . . . . . . . . . . . . . . . . $22.84 $27.95 $37.80 NA
As of October 31, 2007, there was $6,212 of total unrecognized compensation cost related to nonvested stockoptions. That cost is expected to be amortized over a weighted average period of approximately 1.9 years.
The Black-Scholes option valuation model was developed for use in estimating the fair value of traded options thathave no vesting restrictions and are fully transferable. In addition, option valuation models require the input ofhighly subjective assumptions, including the expected stock price volatility. The fair value of each option grant wasestimated at the date of grant using the Black-Scholes option-pricing model with the following assumptions:
2007 2006
Expected volatility . . . . . . . . . . . . . . . . . . . . . . . . . . . . . . . . . . . . . . . . . . . .280-.285 .276-.282Expected dividend yield . . . . . . . . . . . . . . . . . . . . . . . . . . . . . . . . . . . . . . . 1.48-1.64% 1.88-2.00%Risk-free interest rate. . . . . . . . . . . . . . . . . . . . . . . . . . . . . . . . . . . . . . . . . 4.44-4.67% 4.44-4.59%Expected life of the option (in years) . . . . . . . . . . . . . . . . . . . . . . . . . . . . . 5.5-7.8 5.6-8.8
54
Notes to Consolidated Financial Statements — (Continued)

The weighted-average expected volatility and weighted-average expected dividend yield used to value the fiscal2007 options were .283 and 1.60 percent, respectively. The weighted-average expected volatility and weighted-average expected dividend yield used to value the fiscal 2006 options were .278 and 1.92 percent, respectively.
Historical information was the primary basis for the selection of the expected volatility, expected dividend yield andthe expected lives of the options. The risk-free interest rate was selected based upon yields of U.S. Treasury issueswith a term equal to the expected life of the option being valued.
The weighted average grant date fair value of stock options granted during fiscal years 2007, 2006 and 2005 was$15.83, $11.81 and $12.08, respectively. The total intrinsic value of options exercised during fiscal years 2007, 2006and 2005 was $13,892, $22,930 and $7,661, respectively.
Cash received from the exercise of stock options for fiscal years 2007, 2006 and 2005 was $9,264, $21,535 and$9,575, respectively. The tax benefit realized from tax deductions from exercises for fiscal years 2007, 2006 and 2005was $4,269, $9,074 and $3,333, respectively.
Stock appreciation rights — The Company may grant stock appreciation rights to employees. A stock appre-ciation right provides for a payment equal to the excess of the fair market value of a common share when the right isexercised over its value when the right was granted. There were no stock appreciation rights outstanding duringfiscal years 2007, 2006 and 2005.
Limited stock appreciation rights that become exercisable upon the occurrence of events that involve or may resultin a change of control of the Company have been granted with respect to 2,248 shares.
Nonvested stock — The Company may grant nonvested stock to employees and directors of the Company. Theseshares may not be disposed of for a designated period of time (generally six months to five years) defined at the dateof grant. For employee recipients, shares are forfeited on a pro-rata basis in the event employment is terminated as aconsequence of the employee recipient’s retirement, disability or death. Termination for any other reason results inforfeiture of the shares. For non-employee directors, restrictions lapse upon the retirement, disability or death of thenon-employee director. Termination of service as a director for any other reason results in a pro-rata forfeiture ofshares.
As shares are issued, deferred stock-based compensation equivalent to the fair market value on the date of grant ischarged to shareholders’ equity and subsequently amortized over the restriction period. Tax benefits arising from thelapse of restrictions on the stock are recognized when realized and credited to capital in excess of stated value. Uponadoption of FAS 123 (R) at the beginning of fiscal 2006, the unamortized balance of the deferred stock-basedcompensation was reclassified to capital in excess of stated value.
55
Notes to Consolidated Financial Statements — (Continued)

The following table summarizes activity related to nonvested stock:
Number ofShares
Weighted-AverageGrant Date
Fair Value Per Share
Nonvested at October 31, 2004 . . . . . . . . . . . . . . . . . . . . . . . . . . . . 119 $26.13Granted . . . . . . . . . . . . . . . . . . . . . . . . . . . . . . . . . . . . . . . . . . . 66 $36.82Vested . . . . . . . . . . . . . . . . . . . . . . . . . . . . . . . . . . . . . . . . . . . . . (13) $27.73Forfeited . . . . . . . . . . . . . . . . . . . . . . . . . . . . . . . . . . . . . . . . . . . (11) $29.25
Nonvested at October 30, 2005 . . . . . . . . . . . . . . . . . . . . . . . . . . . . 161 $30.17Granted . . . . . . . . . . . . . . . . . . . . . . . . . . . . . . . . . . . . . . . . . . . 20 $43.67Vested . . . . . . . . . . . . . . . . . . . . . . . . . . . . . . . . . . . . . . . . . . . . . (54) $25.45Forfeited . . . . . . . . . . . . . . . . . . . . . . . . . . . . . . . . . . . . . . . . . . . (3) $32.58
Nonvested at October 31, 2006 . . . . . . . . . . . . . . . . . . . . . . . . . . . . 124 $34.38Granted . . . . . . . . . . . . . . . . . . . . . . . . . . . . . . . . . . . . . . . . . . . 8 $48.82Vested . . . . . . . . . . . . . . . . . . . . . . . . . . . . . . . . . . . . . . . . . . . . . (14) $33.35Forfeited . . . . . . . . . . . . . . . . . . . . . . . . . . . . . . . . . . . . . . . . . . . (3) $33.43
Nonvested at October 31, 2007 . . . . . . . . . . . . . . . . . . . . . . . . . . . . 115 $35.60
As of October 31, 2007, there was $1,054 of unrecognized compensation cost related to nonvested stock. The cost isexpected to be amortized over a weighted average period of 0.8 years. The amount charged to expense related tononvested stock was $1,403, $1,634 and $1,523 in fiscal years 2007, 2006 and 2005, respectively.
Employee stock purchase rights — The Company may grant stock purchase rights to employees. These rightspermit eligible employees to purchase a limited number of Common Shares at a discount from fair market value. Nostock purchase rights were outstanding during fiscal years 2007, 2006 and 2005.
Deferred directors compensation — Non-employee directors may defer all or part of their compensation untilretirement. Compensation may be deferred as cash or as stock equivalent units. Deferred cash amounts are recordedas liabilities. Upon adoption of FAS 123 (R) at the beginning of fiscal 2006, deferred amounts of $3,471 in stockequivalent units were reclassified from liabilities to capital in excess of stated value. Additional stock equivalent unitsare earned when common stock dividends are declared.
The following is a summary of the activity related to deferred director compensation during fiscal years 2007 and 2006:
Number ofShares
Weighted-AverageGrant Date FairValue Per Share
Outstanding at October 30, 2005 . . . . . . . . . . . . . . . . . . . . . . . . . . . . 151 $22.74Deferrals . . . . . . . . . . . . . . . . . . . . . . . . . . . . . . . . . . . . . . . . . . . . 6 $44.88Dividend equivalents . . . . . . . . . . . . . . . . . . . . . . . . . . . . . . . . . . . 2 $43.65Distributions . . . . . . . . . . . . . . . . . . . . . . . . . . . . . . . . . . . . . . . . . (18) $19.95
Outstanding at October 31, 2006 . . . . . . . . . . . . . . . . . . . . . . . . . . . . 141 $24.35Deferrals . . . . . . . . . . . . . . . . . . . . . . . . . . . . . . . . . . . . . . . . . . . . 6 $48.96Dividend equivalents . . . . . . . . . . . . . . . . . . . . . . . . . . . . . . . . . . . 2 $49.16Distributions . . . . . . . . . . . . . . . . . . . . . . . . . . . . . . . . . . . . . . . . . (18) $20.34
Outstanding at October 31, 2007 . . . . . . . . . . . . . . . . . . . . . . . . . . . . 131 $26.31
The amount charged to expense related to this plan was $365 in fiscal 2007 and $328 in fiscal 2006.
56
Notes to Consolidated Financial Statements — (Continued)

Long-Term Incentive Compensation Plan — Under the long-term incentive compensation plan, executiveofficers and selected other key employees receive cash or stock awards based solely on corporate performancemeasures over three-year performance periods. Awards vary based on the degree to which corporate performanceexceeds predetermined threshold, target and maximum performance levels at the end of a performance period. Nopayout will occur unless the Company exceeds certain threshold performance objectives.
For the fiscal year 2005-2007 performance period, payouts will be in cash based upon the share price of theCompany’s Common Shares on October 31, 2007. Over the three-year performance period, costs were accruedbased upon current performance projections for the three-year period and the percentage of the requisite service thatwas rendered, along with changes in value of the Company’s Common Shares. The method of estimating accrualamounts was revised upon adoption of FAS 123(R), however the cumulative effect of the change was not material.The accrual for this performance period continues to be classified as liabilities.
For the fiscal year 2006-2008 and the fiscal year 2007-2009 performance periods, payouts will be in CommonShares. The amount of compensation expense is based upon current performance projections for each three-yearperiod and the percentage of the requisite service that has been rendered. The calculations are also based upon thevalue of the Company’s Common Shares at the dates of grant. These values for fiscal 2007 were $46.74 and $53.77for the executive officer group and $46.88 per share for the selected other employees. The values for fiscal year 2006were $37.05 per share for the executive officer group and $36.56 per share for the selected other employees. Theseperformance-based equity grants are recorded in shareholders’ equity. Amounts recorded at October 31, 2007 and2006 were $4,721 and $1,590, respectively. Compensation expense related these performance periods was $3,131 infiscal 2007.
Shares reserved for future issuance — At October 31, 2007, there were 76,933 of the Company’s Common Sharesreserved for future issuance through the exercise of outstanding options or rights.
Note 14 — Severance and restructuring costs
In March 2007, the Company announced that it would close an Adhesive Dispensing Systems manufacturingoperation located in Talladega, Alabama and move production activities to other Nordson facilities that are closer tosupplier locations. Total severance costs for the 36 affected employees will be approximately $541 and are beingrecorded over the future service period of April 2007 through March 2008. The expense amount recorded in fiscal2007 was $433 and cash disbursements in 2007 were $30.
During the second quarter of fiscal 2006, the Company realigned the management of its Adhesive DispensingSystems segment, which resulted in the elimination of nine positions. These actions better positioned the segmentto achieve its growth objectives. Total costs attributable to the position eliminations were $429.
In an effort to improve efficiencies in operations serving the curing and drying market, the Company eliminated 13positions in the Advanced Technology Systems segment second half of fiscal 2006. Total costs attributable to theposition eliminations were $380.
During the fourth quarter of fiscal 2005, the Company began a number of restructuring actions to improveperformance and reduce costs in its Industrial Coating and Automotive Systems segment. These actions, whichincluded operational consolidations and approximately 60 personnel reductions, were completed in the fourthquarter of fiscal 2006. As a result of these actions, resources are more effectively aligned with shifting patterns ofglobal demands, enabling the segment to operate both with lower costs and better capability to serve customers inthe faster growing emerging markets. Total restructuring costs were $2,693, of which $875 was recorded in 2005,and the remainder was recorded in fiscal 2006. Substantially all of the $2,693 of expense was associated with cashexpenditures for severance payments to terminated employees. Cash of $2,640 was paid in fiscal 2006, and $4 waspaid during fiscal 2005.
57
Notes to Consolidated Financial Statements — (Continued)
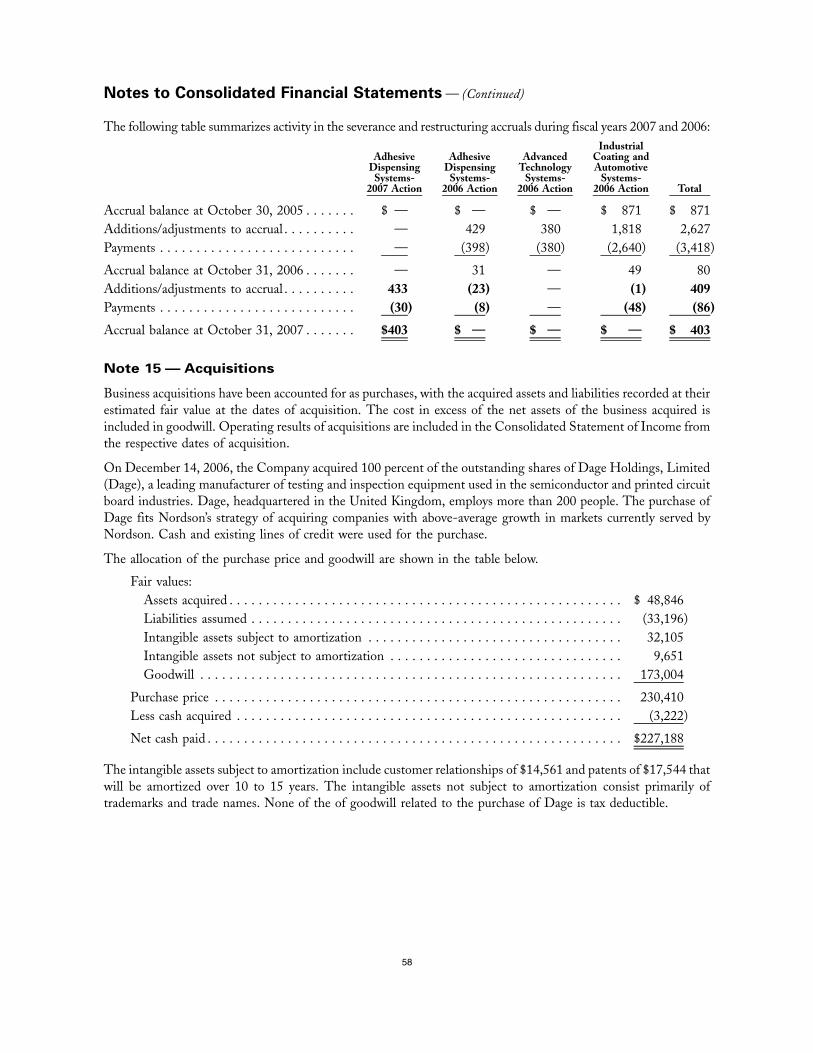
The following table summarizes activity in the severance and restructuring accruals during fiscal years 2007 and 2006:
AdhesiveDispensing
Systems-2007 Action
AdhesiveDispensing
Systems-2006 Action
AdvancedTechnology
Systems-2006 Action
IndustrialCoating andAutomotive
Systems-2006 Action Total
Accrual balance at October 30, 2005 . . . . . . . $ — $ — $ — $ 871 $ 871Additions/adjustments to accrual . . . . . . . . . . — 429 380 1,818 2,627Payments . . . . . . . . . . . . . . . . . . . . . . . . . . . — (398) (380) (2,640) (3,418)
Accrual balance at October 31, 2006 . . . . . . . — 31 — 49 80Additions/adjustments to accrual . . . . . . . . . . 433 (23) — (1) 409Payments . . . . . . . . . . . . . . . . . . . . . . . . . . . (30) (8) — (48) (86)
Accrual balance at October 31, 2007 . . . . . . . $403 $ — $ — $ — $ 403
Note 15 — Acquisitions
Business acquisitions have been accounted for as purchases, with the acquired assets and liabilities recorded at theirestimated fair value at the dates of acquisition. The cost in excess of the net assets of the business acquired isincluded in goodwill. Operating results of acquisitions are included in the Consolidated Statement of Income fromthe respective dates of acquisition.
On December 14, 2006, the Company acquired 100 percent of the outstanding shares of Dage Holdings, Limited(Dage), a leading manufacturer of testing and inspection equipment used in the semiconductor and printed circuitboard industries. Dage, headquartered in the United Kingdom, employs more than 200 people. The purchase ofDage fits Nordson’s strategy of acquiring companies with above-average growth in markets currently served byNordson. Cash and existing lines of credit were used for the purchase.
The allocation of the purchase price and goodwill are shown in the table below.
Fair values:Assets acquired . . . . . . . . . . . . . . . . . . . . . . . . . . . . . . . . . . . . . . . . . . . . . . . . . . . . . . $ 48,846Liabilities assumed . . . . . . . . . . . . . . . . . . . . . . . . . . . . . . . . . . . . . . . . . . . . . . . . . . . (33,196)Intangible assets subject to amortization . . . . . . . . . . . . . . . . . . . . . . . . . . . . . . . . . . . 32,105Intangible assets not subject to amortization . . . . . . . . . . . . . . . . . . . . . . . . . . . . . . . . 9,651Goodwill . . . . . . . . . . . . . . . . . . . . . . . . . . . . . . . . . . . . . . . . . . . . . . . . . . . . . . . . . . 173,004
Purchase price . . . . . . . . . . . . . . . . . . . . . . . . . . . . . . . . . . . . . . . . . . . . . . . . . . . . . . . . 230,410Less cash acquired . . . . . . . . . . . . . . . . . . . . . . . . . . . . . . . . . . . . . . . . . . . . . . . . . . . . . (3,222)
Net cash paid . . . . . . . . . . . . . . . . . . . . . . . . . . . . . . . . . . . . . . . . . . . . . . . . . . . . . . . . . $227,188
The intangible assets subject to amortization include customer relationships of $14,561 and patents of $17,544 thatwill be amortized over 10 to 15 years. The intangible assets not subject to amortization consist primarily oftrademarks and trade names. None of the of goodwill related to the purchase of Dage is tax deductible.
58
Notes to Consolidated Financial Statements — (Continued)

Pro Forma Financial Information
The following unaudited pro forma financial information for fiscal years 2007 and 2006 assumes the acquisitionoccurred as of the beginning of the respective periods, after giving effect to certain adjustments, includingamortization of intangible assets, interest expense on acquisition debt and income tax effects. The pro forma resultshave been prepared for comparative purposes only and are not necessarily indicative of the results of operationswhich may occur in the future or that would have occurred had the acquisition of Dage been effected on the dateindicated, nor are they necessarily indicative of the Company’s future results of operations.
2007 2006
Sales . . . . . . . . . . . . . . . . . . . . . . . . . . . . . . . . . . . . . . . . . . . . . . . . . . . . . . $999,601 $949,773Net income from continuing operations . . . . . . . . . . . . . . . . . . . . . . . . . . . . $ 88,781 $ 93,434Basic earnings per share from continuing operations . . . . . . . . . . . . . . . . . . . $ 2.65 $ 2.80Diluted earnings per share from continuing operations . . . . . . . . . . . . . . . . . $ 2.60 $ 2.73
Other Fiscal 2007 Acquisitions
On April 1, 2007, the Company acquired 100 percent of the partnership interest of PICO Dosiertechnik GmbH &Co. KG and 100 percent of the outstanding shares of PICO Dostec GmbH (Picodostec), a leading manufacturer ofpiezoelectric technology dispensing systems, which dispense adhesives and other performance materials at very highspeeds in an extremely accurate manner. Picodostec’s products are used predominately in the electronics, medicaldevice, packaging, pharmaceutical, food, chemical and automotive industries. Picodostec, headquartered nearMunich, Germany, employs 11 people.
On April 30, 2007, the Company acquired 100 percent of the outstanding shares of YesTech, Inc., a leadingprovider of Automated Optical Inspection (AOI) and X-Ray inspection systems used in the production of printedcircuit board assemblies and semiconductor packages. The addition of AOI systems will expand Nordson’s test andinspection capabilities. YesTech, headquartered in San Clemente, California, employs 23 people.
On August 23, 2007, the Company acquired 100 percent ownership in TAH Industries, a manufacturer ofmotionless mixer dispensing systems for two component adhesives and sealants. The company is headquartered inRobbinsville, New Jersey and employs approximately 180 people. TAH specializes in the design and production ofdisposable plastic mixers and cartridge dispense systems, meter mix dispense valves and accessories. Their productsare used primarily in the dental, construction, automotive, life science, food, DIY, marine and aerospace industries.
The combined purchase price was $100,079 ($98,057 net of cash acquired). The purchase price allocation and thegoodwill are shown in the table below. The TAH allocation is based on a preliminary independent appraisal of thefair value of certain acquired assets and may be revised at a later date. The Picodostec and YesTech valuations arefinal.
Fair values:Assets acquired . . . . . . . . . . . . . . . . . . . . . . . . . . . . . . . . . . . . . . . . . . . . . . . . . . . . . . $ 28,464Liabilities assumed . . . . . . . . . . . . . . . . . . . . . . . . . . . . . . . . . . . . . . . . . . . . . . . . . . . (14,566)Intangible assets subject to amortization . . . . . . . . . . . . . . . . . . . . . . . . . . . . . . . . . . . 17,140Intangible assets not subject toamortization . . . . . . . . . . . . . . . . . . . . . . . . . . . . . . . . . . . . . . . . . . . . . . . . . . . . . . . . 4,040Goodwill . . . . . . . . . . . . . . . . . . . . . . . . . . . . . . . . . . . . . . . . . . . . . . . . . . . . . . . . . . 65,001
Purchase price . . . . . . . . . . . . . . . . . . . . . . . . . . . . . . . . . . . . . . . . . . . . . . . . . . . . . . . . 100,079Less cash acquired . . . . . . . . . . . . . . . . . . . . . . . . . . . . . . . . . . . . . . . . . . . . . . . . . . . . . (2,022)
Net cash paid . . . . . . . . . . . . . . . . . . . . . . . . . . . . . . . . . . . . . . . . . . . . . . . . . . . . . . . . . $ 98,057
59
Notes to Consolidated Financial Statements — (Continued)
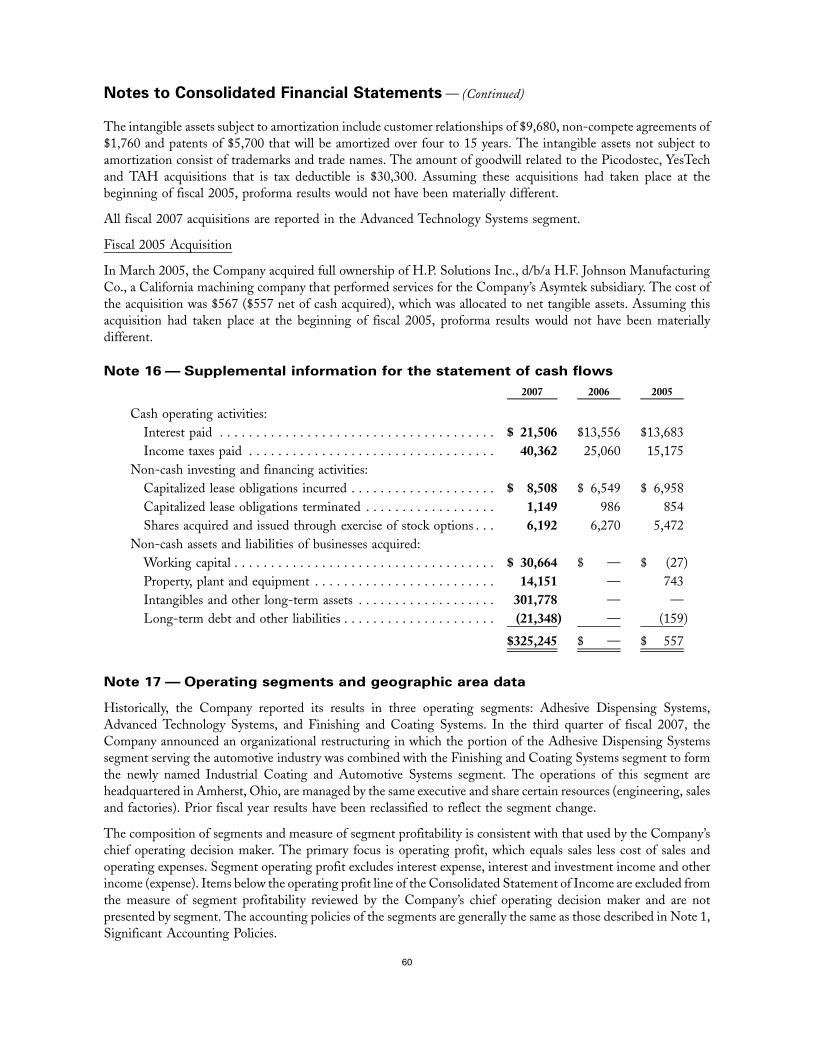
The intangible assets subject to amortization include customer relationships of $9,680, non-compete agreements of$1,760 and patents of $5,700 that will be amortized over four to 15 years. The intangible assets not subject toamortization consist of trademarks and trade names. The amount of goodwill related to the Picodostec, YesTechand TAH acquisitions that is tax deductible is $30,300. Assuming these acquisitions had taken place at thebeginning of fiscal 2005, proforma results would not have been materially different.
All fiscal 2007 acquisitions are reported in the Advanced Technology Systems segment.
Fiscal 2005 Acquisition
In March 2005, the Company acquired full ownership of H.P. Solutions Inc., d/b/a H.F. Johnson ManufacturingCo., a California machining company that performed services for the Company’s Asymtek subsidiary. The cost ofthe acquisition was $567 ($557 net of cash acquired), which was allocated to net tangible assets. Assuming thisacquisition had taken place at the beginning of fiscal 2005, proforma results would not have been materiallydifferent.
Note 16 — Supplemental information for the statement of cash flows
2007 2006 2005
Cash operating activities:Interest paid . . . . . . . . . . . . . . . . . . . . . . . . . . . . . . . . . . . . . . $ 21,506 $13,556 $13,683Income taxes paid . . . . . . . . . . . . . . . . . . . . . . . . . . . . . . . . . . 40,362 25,060 15,175
Non-cash investing and financing activities:Capitalized lease obligations incurred . . . . . . . . . . . . . . . . . . . . $ 8,508 $ 6,549 $ 6,958Capitalized lease obligations terminated . . . . . . . . . . . . . . . . . . 1,149 986 854Shares acquired and issued through exercise of stock options . . . 6,192 6,270 5,472
Non-cash assets and liabilities of businesses acquired:Working capital . . . . . . . . . . . . . . . . . . . . . . . . . . . . . . . . . . . . $ 30,664 $ — $ (27)Property, plant and equipment . . . . . . . . . . . . . . . . . . . . . . . . . 14,151 — 743Intangibles and other long-term assets . . . . . . . . . . . . . . . . . . . 301,778 — —Long-term debt and other liabilities . . . . . . . . . . . . . . . . . . . . . (21,348) — (159)
$325,245 $ — $ 557
Note 17 — Operating segments and geographic area data
Historically, the Company reported its results in three operating segments: Adhesive Dispensing Systems,Advanced Technology Systems, and Finishing and Coating Systems. In the third quarter of fiscal 2007, theCompany announced an organizational restructuring in which the portion of the Adhesive Dispensing Systemssegment serving the automotive industry was combined with the Finishing and Coating Systems segment to formthe newly named Industrial Coating and Automotive Systems segment. The operations of this segment areheadquartered in Amherst, Ohio, are managed by the same executive and share certain resources (engineering, salesand factories). Prior fiscal year results have been reclassified to reflect the segment change.
The composition of segments and measure of segment profitability is consistent with that used by the Company’schief operating decision maker. The primary focus is operating profit, which equals sales less cost of sales andoperating expenses. Segment operating profit excludes interest expense, interest and investment income and otherincome (expense). Items below the operating profit line of the Consolidated Statement of Income are excluded fromthe measure of segment profitability reviewed by the Company’s chief operating decision maker and are notpresented by segment. The accounting policies of the segments are generally the same as those described in Note 1,Significant Accounting Policies.
60
Notes to Consolidated Financial Statements — (Continued)

Nordson products are used around the world in the appliance, automotive, bookbinding, construction, container,converting, electronics assembly, food and beverage, furniture, life sciences, medical, metal finishing, nonwovens,packaging, semiconductor and other diverse industries. Nordson sells its products primarily through a direct,geographically dispersed sales force.
No single customer accounted for more than 5 percent of the Company’s sales in fiscal years 2007, 2006 or 2005.
The following table presents information about Nordson’s reportable segments:
AdhesiveDispensing
AdvancedTechnology
IndustrialCoating andAutomotive Corporate Total
Year ended October 31, 2007Net external sales . . . . . . . . . . . . . . . . . . $509,568 $300,719 $183,362 $ — $ 993,649Depreciation . . . . . . . . . . . . . . . . . . . . . . 8,890 5,737 3,986 5,170 23,784Operating profit . . . . . . . . . . . . . . . . . . . 118,206(a) 40,480 17,615 (24,159) 152,142Identifiable assets(d) . . . . . . . . . . . . . . . . 257,121 685,381 73,061 196,772(e) 1,212,335Expenditures for long-lived assets(f ) . . . . . 13,548 9,097 3,669 4,703 31,017
Year ended October 31, 2006Net external sales . . . . . . . . . . . . . . . . . . $478,858 $239,258 $174,105 $ — $ 892,221Depreciation . . . . . . . . . . . . . . . . . . . . . . 9,415 4,039 4,139 4,691 22,284Operating profit . . . . . . . . . . . . . . . . . . . 109,018(a) 56,976(b) 10,351(c) (28,730) 147,615Identifiable assets(d) . . . . . . . . . . . . . . . . 220,932 383,964 68,930 147,367(e) 821,193Expenditures for long-lived assets(f ) . . . . . 4,128 4,991 2,104 2,387 13,610
Year ended October 30, 2005Net external sales . . . . . . . . . . . . . . . . . . $459,295 $199,807 $173,077 $ — $ 832,179Depreciation . . . . . . . . . . . . . . . . . . . . . . 9,199 3,427 4,286 4,137 21,049Operating profit . . . . . . . . . . . . . . . . . . . 103,332 41,523 4,659(c) (18,816) 130,698Identifiable assets(d) . . . . . . . . . . . . . . . . 218,714 367,340 73,563 107,838(e) 767,455Expenditures for long-lived assets(f ) . . . . . 7,492 2,453 2,526 2,908 15,379
(a) Includes $410 of severance and restructuring charges in fiscal 2007 and $429 in fiscal 2006.(b) Includes $380 of severance and restructuring charges in fiscal 2006.
(c) Includes $1,818 of severance and restructuring charges in fiscal 2006 and $875 in fiscal 2005.(d) Includes notes and accounts receivable net of customer advance payments and allowance for doubtful
accounts, inventories net of reserves, property, plant and equipment net of accumulated depreciation andgoodwill.
(e) Corporate assets are principally cash and cash equivalents, deferred income taxes, investments, capital leases,headquarter facilities, the major portion of the Company’s domestic enterprise management system, andintangible assets.
(f ) Long-lived assets consist of property, plant and equipment and capital lease assets.
61
Notes to Consolidated Financial Statements — (Continued)

The Company has significant sales and long-lived assets in the following geographic areas:2007 2006 2005
Net external salesUnited States . . . . . . . . . . . . . . . . . . . . . . . . . . . . . . . . . . . . $304,834 $291,242 $279,074Americas . . . . . . . . . . . . . . . . . . . . . . . . . . . . . . . . . . . . . . . 73,564 64,928 59,400Europe. . . . . . . . . . . . . . . . . . . . . . . . . . . . . . . . . . . . . . . . . 363,385 314,287 298,692Japan . . . . . . . . . . . . . . . . . . . . . . . . . . . . . . . . . . . . . . . . . . 98,233 86,982 89,757Asia Pacific . . . . . . . . . . . . . . . . . . . . . . . . . . . . . . . . . . . . . 153,633 134,782 105,256
Total net external sales . . . . . . . . . . . . . . . . . . . . . . . . . . . . . . . $993,649 $892,221 $832,179
Long-lived assetsUnited States . . . . . . . . . . . . . . . . . . . . . . . . . . . . . . . . . . . . $ 87,076 $ 78,368 $ 82,208Americas . . . . . . . . . . . . . . . . . . . . . . . . . . . . . . . . . . . . . . . 1,936 1,627 1,615Europe. . . . . . . . . . . . . . . . . . . . . . . . . . . . . . . . . . . . . . . . . 22,824 15,699 15,398Japan . . . . . . . . . . . . . . . . . . . . . . . . . . . . . . . . . . . . . . . . . . 3,085 2,635 3,079Asia Pacific . . . . . . . . . . . . . . . . . . . . . . . . . . . . . . . . . . . . . 17,996 7,086 6,006
Total long-lived assets . . . . . . . . . . . . . . . . . . . . . . . . . . . . . . . $132,917 $105,415 $108,306
A reconciliation of total segment operating income to total consolidated income before income taxes anddiscontinued operations is as follows:
2007 2006 2005
Total profit for reportable segments . . . . . . . . . . . . . . . . . . . . . $152,142 $147,615 $130,698Interest expense . . . . . . . . . . . . . . . . . . . . . . . . . . . . . . . . . . . . (21,542) (12,017) (13,825)Interest and investment income . . . . . . . . . . . . . . . . . . . . . . . . 1,505 1,867 1,826Other-net . . . . . . . . . . . . . . . . . . . . . . . . . . . . . . . . . . . . . . . . 3,617 (1,031) 1,586
Income before income taxes and discontinued operations . . . . . . $135,722 $136,434 $120,285
A reconciliation of total assets for reportable segments to total consolidated assets is as follows:2007 2006 2005
Total assets for reportable segments . . . . . . . . . . . . . . . . . . . . $1,212,335 $821,193 $767,455Customer advance payments . . . . . . . . . . . . . . . . . . . . . . . . . 10,564 10,015 9,740Net assets of discontinued operations . . . . . . . . . . . . . . . . . . . — — 14,628Eliminations . . . . . . . . . . . . . . . . . . . . . . . . . . . . . . . . . . . . . (11,059) (8,318) (1,406)
Total consolidated assets . . . . . . . . . . . . . . . . . . . . . . . . . . . . $1,211,840 $822,890 $790,417
62
Notes to Consolidated Financial Statements — (Continued)

Note 18 — Goodwill and other intangible assets
Goodwill is tested for impairment on an annual basis and more often if indications of impairment exist. Estimates offuture cash flows, discount rates and terminal value amounts are used to determine the estimated fair value of thereporting units. The results of the Company’s analyses indicated that no reduction of goodwill is required.
Changes in the carrying amount of goodwill during fiscal 2007 by operating segment are as follows:
AdhesiveDispensing
AdvancedTechnology
Industrial Coatingand Automotive Total
Balance at October 31, 2006. . . . . . . . . . . . $30,771 $297,698 $3,446 $331,915Acquisitions . . . . . . . . . . . . . . . . . . . . . . . . — 238,005 — 238,005Currency effect . . . . . . . . . . . . . . . . . . . . . 746 1,206 104 2,056
Balance at October 31, 2007. . . . . . . . . . . . $31,517 $536,909 $3,550 $571,976
Information regarding the Company’s intangible assets subject to amortization is as follows:
CarryingAmount
AccumulatedAmortization Net Book Value
October 31, 2007
Patent costs . . . . . . . . . . . . . . . . . . . . . . . . . . . . . . . . . . . $27,024 $ 3,592 $23,432Customer Relationships . . . . . . . . . . . . . . . . . . . . . . . . . . 25,609 1,557 24,052Noncompete agreements . . . . . . . . . . . . . . . . . . . . . . . . . . 5,956 2,551 3,405Core/developed technology . . . . . . . . . . . . . . . . . . . . . . . . 2,788 1,419 1,369Other . . . . . . . . . . . . . . . . . . . . . . . . . . . . . . . . . . . . . . . . 5,080 4,863 217
Total . . . . . . . . . . . . . . . . . . . . . . . . . . . . . . . . . . . . . . $66,457 $13,982 $52,475
CarryingAmount
AccumulatedAmortization Net Book Value
October 31, 2006
Patent costs . . . . . . . . . . . . . . . . . . . . . . . . . . . . . . . . . . . $ 2,579 $1,857 $ 722Noncompete agreements . . . . . . . . . . . . . . . . . . . . . . . . . . 4,086 1,908 2,178Core/developed technology . . . . . . . . . . . . . . . . . . . . . . . . 2,788 1,217 1,571Other . . . . . . . . . . . . . . . . . . . . . . . . . . . . . . . . . . . . . . . . 5,039 4,640 399
Total . . . . . . . . . . . . . . . . . . . . . . . . . . . . . . . . . . . . . . $14,492 $9,622 $4,870
At October 31, 2007, $14,291 of trademark and trade name intangible assets arising from fiscal 2007 acquisitionswas not subject to amortization. At October 31, 2006, $3,937 of intangible assets related to a minimum pensionliability for the Company’s pension plans were not subject to amortization.
Amortization expense for fiscal years 2007 and 2006 was $4,149 and $1,026, respectively. Estimated amortizationexpense for each of the five succeeding fiscal years is as follows:
Fiscal Year Amounts
2008 . . . . . . . . . . . . . . . . . . . . . . . . . . . . . . . . . . . . . . . . . . . . . . . . . . . . . . . . . . . . . . . . $5,8642009 . . . . . . . . . . . . . . . . . . . . . . . . . . . . . . . . . . . . . . . . . . . . . . . . . . . . . . . . . . . . . . . . $5,5752010 . . . . . . . . . . . . . . . . . . . . . . . . . . . . . . . . . . . . . . . . . . . . . . . . . . . . . . . . . . . . . . . . $5,5042011 . . . . . . . . . . . . . . . . . . . . . . . . . . . . . . . . . . . . . . . . . . . . . . . . . . . . . . . . . . . . . . . . $5,0762012 . . . . . . . . . . . . . . . . . . . . . . . . . . . . . . . . . . . . . . . . . . . . . . . . . . . . . . . . . . . . . . . . $4,489
63
Notes to Consolidated Financial Statements — (Continued)

Note 19 — Quarterly financial data (unaudited)
First Second Third Fourth
Fiscal 2007:Sales . . . . . . . . . . . . . . . . . . . . . . . . . . . . . . . . . . $203,875 $241,293 $257,713 $290,768Cost of sales . . . . . . . . . . . . . . . . . . . . . . . . . . . . . 86,214 109,419 113,005 131,166Net income . . . . . . . . . . . . . . . . . . . . . . . . . . . . . 15,557 20,980 24,521 29,634Earnings per share:
Basic . . . . . . . . . . . . . . . . . . . . . . . . . . . . . . . . .47 .62 .73 .88Diluted . . . . . . . . . . . . . . . . . . . . . . . . . . . . . . . .46 .61 .72 .87
Fiscal 2006:Sales . . . . . . . . . . . . . . . . . . . . . . . . . . . . . . . . . . $197,351 $227,840 $225,518 $241,512Cost of sales . . . . . . . . . . . . . . . . . . . . . . . . . . . . . 83,336 97,150 97,226 102,088Net income (loss):
From continuing operations. . . . . . . . . . . . . . . . 17,553 24,046 26,590 29,478From discontinued operations . . . . . . . . . . . . . . (1,486) (2,115) (1,776) (1,692)
Total net income . . . . . . . . . . . . . . . . . . . . . . . . . 16,067 21,931 24,814 27,786Net income per share — Basic:
Income from continuing operations . . . . . . . . . . .53 .72 .79 .88Loss from discontinued operations. . . . . . . . . . . (.04) (.06) (.05) (.05)
Total net income per share . . . . . . . . . . . . . . . . . . .49 .66 .74 .83Net income per share — Diluted:
Income from continuing operations . . . . . . . . . . .52 .70 .77 .87Loss from discontinued operations. . . . . . . . . . . (.05) (.06) (.05) (.05)
Total . . . . . . . . . . . . . . . . . . . . . . . . . . . . . . . . .47 .64 .72 .82
The sum of the per-share amounts for the four quarters of fiscal years 2007 and 2006 do not equal the annual per-share amounts because of the timing of stock repurchases.
The Company recognized pretax severance and restructuring costs of $55, $213 and $141 in the second, third andfourth quarters, respectively, of fiscal 2007.
During the second quarter of fiscal 2007, the Company recorded a gain of $2,655 related to a sale-leaseback of realestate.
The Company recognized pretax severance and restructuring costs of $1,233, $942, $556 and ($104) in the first,second, third and fourth quarters, respectively, of fiscal 2006.
During the third quarter of fiscal 2006, the Company recorded $2,835 of expense for estimated costs associated withthe remediation project for the New Richmond, Wisconsin municipal landfill. Also, during the third quarter, $800of interest income was recorded, which was associated with a tax refund of $3,100 that was also recognized in thequarter.
64
Notes to Consolidated Financial Statements — (Continued)

Note 20 — Guarantees
The Company has issued guarantees to two banks to support the short-term borrowing facilities of a 49 percent-owned South Korea joint venture/distributor of the Company’s products. One guarantee is for Korean Won2,400,000 (approximately $2,665) secured by land and a building and expires on January 31, 2009. The other is acontinuing guarantee for $1,650.
In 2004, the Company issued a guarantee to a U.S. bank related to a five-year trade financing agreement for a sale toa customer in Turkey. The loan is secured by collateral with a current value well in excess of the amount due. Theguarantee would be triggered upon a payment default by the customer to the bank. The amount of the guarantee atOctober 31, 2007, was Euro 1,000 (approximately $1,449) and is declining ratably as semiannual principalpayments are made by the customer. The Company has recorded $1,329 in accrued liabilities related to thisguarantee.
Note 21 — Contingencies
The Company is involved in pending or potential litigation regarding environmental, product liability, patent,contract, employee and other matters arising from the normal course of business. Including the environmentalmatter discussed below, it is the Company’s opinion, after consultation with legal counsel, that resolutions of thesematters are not expected to result in a material effect on its financial condition, quarterly or annual operating resultsor cash flows.
Environmental — The Company has voluntarily agreed with the City of New Richmond, Wisconsin and otherPotentially Responsible Parties (“PRP”) to share costs associated with the remediation of the City ofNew Richmond municipal landfill (the “Site”) and constructing a potable water delivery system serving theimpacted area down gradient of the Site.
The Feasibility Study / Remedial Investigation for this project was completed and approved by the WisconsinDepartment of Natural Resources (“WDNR”) in September 2006. The Company accrued $2,835 of expense in thethird quarter of fiscal 2006, its best estimate of its obligation. This amount was recorded in selling and admin-istrative expenses. In the fourth quarter of fiscal 2007, the PRPs signed an Environmental Repair Contract with theWDNR. The estimated cost to the Company for Site remediation, constructing a potable water delivery system andongoing operation, maintenance and monitoring (“OM&M”) at the Site and the impacted area down gradient ofthe Site over the statutory monitoring period of 30 years is $3,008. The amount recorded in accrued liabilities is$1,858, and the remaining $1,150 of the liability is classified as long-term.
The liability for environmental remediation represents management’s best estimate of the probable and reasonablyestimable undiscounted costs related to known remediation obligations. The accuracy of the Company’s estimate ofenvironmental liability is affected by several uncertainties such as additional requirements that may be identified inconnection with remedial activities, the complexity and evolution of environmental laws and regulations, and theidentification of presently unknown remediation requirements. Consequently, the Company’s liability could begreater than its current estimate. However, the Company does not expect that the costs associated with remediationwill have a material adverse effect on its financial condition or results of operations.
65
Notes to Consolidated Financial Statements — (Continued)

Management’s Report on Internal Control Over Financial Reporting
The management of Nordson Corporation is responsible for establishing and maintaining adequate internal controlover financial reporting.
Using criteria set forth by the Committee of Sponsoring Organizations of the Treadway Commission (COSO) inInternal Control-Integrated Framework, Nordson’s management assessed the effectiveness of the Company’sinternal control over financial reporting as of October 31, 2007.
On December 14, 2006, the Company completed the acquisition of Dage Holdings, Limited (Dage). As permittedby the Securities and Exchange Commission, management excluded the Dage operations from its assessment ofinternal control over financial reporting as of October 31, 2007. Dage constituted approximately 7.5 percent of totalassets (excluding goodwill) as of October 31, 2007, and 5.6 percent of net sales for the year then ended. Dage will beincluded in the Company’s assessment as of October 31, 2008.
Based on our assessment, management concluded that the Company’s internal control over financial reporting waseffective as of October 31, 2007.
The Company’s independent auditors, Ernst & Young LLP, have issued an audit report on the Company’s internalcontrol over financial reporting and on the effectiveness of internal control over financial reporting of the Companyas of October 31, 2007. This report is included herein.
/s/ EDWARD P. CAMPBELL /s/ PETER. S. HELLMAN
Chairman of the Board andChief Executive OfficerDecember 21, 2007
President, Chief Financial andAdministrative OfficerDecember 21, 2007
66

Report of Independent Registered Public Accounting Firm
The Board of Directors and Shareholders of Nordson Corporation
We have audited Nordson Corporation’s internal control over financial reporting as of October 31, 2007, based oncriteria established in Internal Control — Integrated Framework issued by the Committee of SponsoringOrganizations of the Treadway Commission (the COSO criteria). Nordson Corporation’s management isresponsible for maintaining effective internal control over financial reporting, and for its assessment of theeffectiveness of internal control over financial reporting included in the accompanying Management’s Report onInternal Control Over Financial Reporting. Our responsibility is to express an opinion on the company’s internalcontrol over financial reporting based on our audit.
We conducted our audit in accordance with the standards of the Public Company Accounting Oversight Board(United States). Those standards require that we plan and perform the audit to obtain reasonable assurance aboutwhether effective internal control over financial reporting was maintained in all material respects. Our auditincluded obtaining an understanding of internal control over financial reporting, assessing the risk that a materialweakness exists, testing and evaluating the design and operating effectiveness of internal control based on theassessed risk, and performing such other procedures as we considered necessary in the circumstances. We believethat our audit provides a reasonable basis for our opinion.A company’s internal control over financial reporting is a process designed to provide reasonable assurance regardingthe reliability of financial reporting and the preparation of financial statements for external purposes in accordancewith generally accepted accounting principles. A company’s internal control over financial reporting includes thosepolicies and procedures that (1) pertain to the maintenance of records that, in reasonable detail, accurately and fairlyreflect the transactions and dispositions of the assets of the company; (2) provide reasonable assurance thattransactions are recorded as necessary to permit preparation of financial statements in accordance with generallyaccepted accounting principles, and that receipts and expenditures of the company are being made only inaccordance with authorizations of management and directors of the company; and (3) provide reasonable assuranceregarding prevention or timely detection of unauthorized acquisition, use, or disposition of the company’s assetsthat could have a material effect on the financial statements.
Because of its inherent limitations, internal control over financial reporting may not prevent or detect misstate-ments. Also, projections of any evaluation of effectiveness to future periods are subject to the risk that controls maybecome inadequate because of changes in conditions, or that the degree of compliance with the policies orprocedures may deteriorate.
As indicated in the accompanying Management’s Report on Internal Control Over Financial Reporting,management’s assessment of and conclusion on the effectiveness of internal control over financial reporting didnot include the internal controls of Dage Holdings Limited, which is included in the October 31, 2007 consolidatedfinancial statements of Nordson Corporation and constituted 7.5 percent of total assets (excluding goodwill) as ofOctober 31, 2007 and 5.6 percent of revenues for the year then ended. Our audit of internal control over financialreporting of Nordson Corporation also did not include an evaluation of the internal control over financial reportingof Dage Holdings, Limited.
In our opinion, Nordson Corporation maintained, in all material respects, effective internal control over financialreporting as of October 31, 2007, based on the COSO criteria.We also have audited, in accordance with the standards of the Public Company Accounting Oversight Board(United States), the consolidated balance sheets of Nordson Corporation as of October 31, 2007 and 2006, and therelated consolidated statements of income, shareholders’ equity, and cash flows for each of the three years in theperiod ended October 31, 2007 of Nordson Corporation and our report dated December 17, 2007 expressed anunqualified opinion thereon.
Cleveland, OhioDecember 17, 2007
67

Report of Independent Registered Public Accounting Firm
The Board of Directors and Shareholders of Nordson Corporation
We have audited the accompanying consolidated balance sheets of Nordson Corporation and subsidiaries as ofOctober 31, 2007 and 2006, and the related consolidated statements of income, shareholders’ equity, and cash flowsfor each of the three years in the period ended October 31, 2007. Our audits also included the financial statementschedule listed in the Index at Item 15(a)(2) and (c). These financial statements and schedule are the responsibilityof the Company’s management. Our responsibility is to express an opinion on these financial statements andschedule based on our audits.
We conducted our audits in accordance with the standards of the Public Company Accounting Oversight Board(United States). Those standards require that we plan and perform the audit to obtain reasonable assurance aboutwhether the financial statements are free of material misstatement. An audit includes examining, on a test basis,evidence supporting the amounts and disclosures in the financial statements. An audit also includes assessing theaccounting principles used and significant estimates made by management, as well as evaluating the overall financialstatement presentation. We believe that our audits provide a reasonable basis for our opinion.
In our opinion, the financial statements referred to above present fairly, in all material respects, the consolidatedfinancial position of Nordson Corporation and subsidiaries at October 31, 2007 and 2006, and the consolidatedresults of their operations and their cash flows for each of the three years in the period ended October 31, 2007, inconformity with U.S. generally accepted accounting principles. Also, in our opinion, the related financial statementschedule, when considered in relation to the basic financial statements taken as a whole, presents fairly in all materialrespects the information set forth therein.
As discussed in Note 4 to the consolidated financial statements, the Company adopted the provisions of Statementof Financial Accounting Standards (SFAS) No. 158, “Employers’ Accounting for Defined Benefit Pension andOther Postretirement Plans, an amendment of FASB Statements No. 87, 88, 106 and 132(R)” effectiveOctober 31, 2007. As discussed in Note 13 to the consolidated financial statements, the Company adoptedStatement of Financial Accounting Standards (SFAS) No. 123(R), “Share-Based Payment” applying the modifiedprospective method at the beginning of fiscal 2006.
We also have audited, in accordance with the standards of the Public Company Accounting Oversight Board(United States), the effectiveness of Nordson Corporation’s internal control over financial reporting as ofOctober 31, 2007, based on criteria established in Internal Control-Integrated Framework issued by the Committeeof Sponsoring Organizations of the Treadway Commission and our report dated December 17, 2007 expressed anunqualified opinion thereon.
Cleveland, OhioDecember 17, 2007
68

Item 9. Changes in and Disagreements With Accountants on Accounting and
Financial Disclosure
None.
Item 9A. Controls and Procedures
(a) Evaluation of disclosure controls and procedures. The Company’s management, with the participation of itsprincipal executive officer (chairman and chief executive officer) and principal financial officer (president, chieffinancial and administrative officer), has reviewed and evaluated the Company’s disclosure controls and procedures(as defined in the Securities Exchange Act Rule 13a-15e) as of October 31, 2007. Based on that evaluation, theCompany’s management, including its principal executive and financial officers, has concluded that the Company’sdisclosure controls and procedures were effective as of October 31, 2007 in ensuring that information required to bedisclosed in the reports that the Company files or submits under the Securities Exchange Act of 1934 is recorded,processed, summarized and reported within the time periods specified in the SEC’s rules and forms and isaccumulated and communicated to the Company’s management, including its principal executive officer and itsprincipal financial officer, as appropriate to allow timely decisions regarding required disclosure.
(b) Management’s report on internal control over financial reporting. The Report of Management on InternalControl over Financial Reporting and the Report of Independent Registered Public Accounting Firm thereon areset forth in Part II, Item 8 of this Annual Report on Form 10-K.
(c) Changes in internal control over reporting. There were no changes in the Company’s internal controls overfinancial reporting that occurred during the fourth quarter of the fiscal year ended October 31, 2007 that havematerially affected, or are reasonably likely to materially affect, the Company’s internal control over financialreporting.
Item 9B. Other Information
None.
PART III
Item 10. Directors, Executive Officers and Corporate Governance
The Company incorporates herein by reference the information appearing under the captions “Election ofDirectors” and “Section 16(a) Beneficial Ownership Reporting Compliance” of the Company’s definitive ProxyStatement for the 2008 Annual Meeting of Shareholders. Information regarding the Company’s Audit Committeefinancial experts is incorporated by reference to the caption “Election of Directors” of the definitive ProxyStatement for the 2008 Annual Meeting of Shareholders.
Executive officers of the Company serve for a term of one year from date of election to the next organizationalmeeting of the board of directors and until their respective successors are elected and qualified, except in the case ofdeath, resignation or removal. Information concerning executive officers of the Company is contained in Part I ofthis report under the caption “Executive Officers of the Company.”
The Company has adopted a code of ethics for all employees and directors, including the principal executive officer,other executive officers, principal finance officer and other finance personnel. A copy of the code of ethics isavailable free of charge on the Company’s Web site at http://www.nordson.com/Corporate/Governance/. TheCompany intends to satisfy its disclosure requirement under Item 5.05 of Form 8-K regarding any amendment to orwaiver of a provision of the Company’s code of ethics that applies to the Company’s principal executive officer,principal financial officer, principal accounting officer or controller or persons performing similar functions and thatrelates to any element of the code of ethics definition enumerated in Item 406(b) of Regulation S-K by posting suchinformation on its Web site.
69

Item 11. Executive Compensation
The Company incorporates herein by reference the information appearing under the caption “Directors Com-pensation for Fiscal Year 2007,” and information pertaining to compensation of executive officers appearing underthe captions “Summary Compensation for Fiscal Year 2007,” “Grants of Plan-Based Awards for Fiscal Year 2007,”“Option Exercises and Stock Vested for Fiscal Year 2007,” and “Pension Benefits for Fiscal Year 2007,” “Non-qualified Deferred Compensation for Fiscal Year 2007” and “Potential Payments Upon Termination or Change ofControl” in the Company’s definitive Proxy Statement for the 2008 Annual Meeting of Shareholders.
Item 12. Security Ownership of Certain Beneficial Owners and Management and
Related Stockholder Matters
The Company incorporates herein by reference the information appearing under the caption “Ownership ofNordson Common Shares” in the Company’s definitive Proxy Statement for the 2008 Annual Meeting ofShareholders.
Equity Compensation TableThe following table sets forth information regarding the Company’s equity compensation plans in effect as ofOctober 31, 2007.
Plan category
Number of securities to beissued upon exercise of
outstanding options,warrants and rights
Weighted-averageexercise price of
outstanding options,warrants and rights
Number of securitiesremaining available forfuture issuance under
equity compensation plans(excluding securities
reflected in first reportingcolumn)
Equity compensation plans approvedby security holders . . . . . . . . . . . . . . 2,248 $31.54 1,180
Equity compensation plans notapproved by security holders . . . . . . . — — —
Total . . . . . . . . . . . . . . . . . . . . . . . . . . 2,248 $31.54 1,180
The number of Common Shares available for grant is 3 percent of the number of Common Shares outstanding as ofthe first day of each fiscal year, plus up to an additional 0.5 percent, consisting of shares available, but not granted, inprior years.
Item 13. Certain Relationships and Related Transactions, and Director
Independence
The Company incorporates herein by reference the information appearing under the caption “Review of Trans-actions with Related Persons” in the Company’s definitive Proxy Statement for the 2008 Annual Meeting ofShareholders.
William D. Ginn, a director of the Company, is a retired partner with the law firm of Thompson Hine LLP.Thompson Hine LLP has in the past provided and continues to provide legal services to the Company.
Item 14. Principal Accounting Fees and Services
The Company incorporates herein by reference the information appearing under the caption “IndependentAuditors” in the Company’s definitive Proxy Statement for the 2008 Annual Meeting of Shareholders.
70

PART IV
Item 15. Exhibits and Financial Statement Schedules
(a)(1). Financial StatementsThe financial statements listed in the accompanying index to financial statements are included in Part II, Item 8.
(a)(2) and (c). Financial Statement SchedulesSchedule II Valuation and Qualifying Accounts and Reserves for each of the three years in the period endingOctober 31, 2007. No other consolidated financial statement schedules are presented because the schedules are notrequired, because the required information is not present or not present in amounts sufficient to require submissionof the schedule, or because the information required is included in the financial statements, including the notesthereto.
(a)(3) and (b). ExhibitsThe exhibits listed on the accompanying index to exhibits are filed as part of this Annual Report on Form 10-K.
71

Signatures
Pursuant to the requirements of Section 13 or 15(d) of the Securities Exchange Act of 1934, the Registrant has dulycaused this report to be signed on its behalf by the undersigned, thereunto duly authorized.
NORDSON CORPORATION
Date: December 21, 2007
By: /s/ PETER S. HELLMAN
Peter S. HellmanPresident, Chief Financial andAdministrative Officer
By: /s/ GREGORY A. THAXTON
Gregory A. ThaxtonVice President, Controller(Principal Accounting Officer)
Pursuant to the requirements of the Securities Exchange Act of 1934, this report has been signed below by thefollowing persons on behalf of the Registrant and in the capacities and on the dates indicated.
/s/ EDWARD P. CAMPBELL
Edward P. CampbellChairman of the Board and Chief ExecutiveOfficer (Principal Executive Officer)
December 21, 2007
/s/ PETER S. HELLMAN
Peter S. HellmanDirector, President, Chief Financial andAdministrative Officer(Principal Financial Officer)
December 21, 2007
/s/ WILLIAM W. COLVILLE
William W. ColvilleDirector
December 21, 2007
/s/ WILLIAM D. GINN
William D. GinnDirector
December 21, 2007
/s/ STEPHEN R. HARDIS
Stephen R. HardisDirector
December 21, 2007
/s/ DR. DAVID W. IGNAT
Dr. David W. IgnatDirector
December 21, 2007
72

/s/ JOSEPH P. KEITHLEY
Joseph P. KeithleyDirector
December 21, 2007
/s/ WILLIAM P. MADAR
William P. MadarDirector
December 21, 2007
/s/ MARY G. PUMA
Mary G. PumaDirector
December 21, 2007
/s/ WILLIAM L. ROBINSON
William L. RobinsonDirector
December 21, 2007
/s/ BENEDICT P. ROSEN
Benedict P. RosenDirector
December 21, 2007
73
Signatures — Continued

Schedule II — Valuation and Qualifying Accounts and Reserves
Balance atBeginning
of Year
Assumedfrom
AcquisitionsCharged to
Expense DeductionsCurrency
Effects
Balanceat Endof Year
Allowance for Doubtful AccountsFiscal 2005 . . . . . . . . . . . . . . . . . . . . . . . $4,156 — 1,596 658 (50) $ 5,044Fiscal 2006 . . . . . . . . . . . . . . . . . . . . . . . $5,044 — 219 1,775 177 $ 3,665Fiscal 2007 . . . . . . . . . . . . . . . . . . . . . . . $3,665 229 1,147 1,089 350 $ 4,302Inventory Obsolescence and Other
ReservesFiscal 2005 . . . . . . . . . . . . . . . . . . . . . . . $7,139 — 2,896 2,770 (139) $ 7,126Fiscal 2006 . . . . . . . . . . . . . . . . . . . . . . . $7,126 — 2,392 2,342 323 $ 7,499Fiscal 2007 . . . . . . . . . . . . . . . . . . . . . . . $7,499 2,156 2,725 2,252 989 $11,117Warranty AccrualFiscal 2005 . . . . . . . . . . . . . . . . . . . . . . . $3,601 — 4,090 3,575 (127) $ 3,989Fiscal 2006 . . . . . . . . . . . . . . . . . . . . . . . $3,989 — 6,226 5,480 182 $ 4,917Fiscal 2007 . . . . . . . . . . . . . . . . . . . . . . . $4,917 603 5,702 5,845 407 $ 5,784
74

NORDSON CORPORATION
Index to Exhibits
(Item 15(a) (3))ExhibitNumber Description
(3) Articles of Incorporation and By-Laws3-a 1989 Amended Articles of Incorporation (incorporated herein by reference to Exhibit 3-a to
Registrant’s Annual Report on Form 10-K for the year ended October 30, 2005)3-b 1998 Amended Regulations (incorporated herein by reference to Exhibit 3-b to Registrant’s Annual
Report on Form 10-K for the year ended October 31, 2004)(4) Instruments Defining the Rights of Security Holders, including indentures4-a $400 million Credit Agreement between Nordson Corporation and various financial institutions
(incorporated herein by reference to Exhibit 10.1 to Registrant’s Form 8-K dated July 16, 2007)4-b Second Restated Rights Agreement between Nordson Corporation and National City Bank, Rights
Agent (incorporated herein by reference to Exhibit 4-b to Registrant’s Annual Report on Form 10-Kfor the year ended November 2, 2003)
4-c $100 million Senior Note Purchase Agreement between Nordson Corporation and various insurancecompanies (incorporated herein by reference to Exhibit 4-c to Registrant’s Annual Report on Form10-K for the year ended October 31, 2006)
(10) Material Contracts10-a Nordson Corporation 2004 Management Incentive Compensation Plan (incorporated herein by
reference to Exhibit 10.2 to Registrant’s Form 8-K dated November 8, 2004)*10-b Nordson Corporation Deferred Compensation Plan (incorporated herein by reference to Exhibit 10-
b to Registrant’s Annual Report on Form 10-K for the year ended October 31, 2006)*10-b-1 Nordson Corporation 2005 Deferred Compensation Plan (incorporated herein by reference to
Exhibit 10-1 to Registrant’s Form 10-Q for the quarter ended January 30, 2005)*10-c Indemnity Agreement*10-d Restated Nordson Corporation Excess Defined Contribution Retirement Plan (incorporated herein
by reference to Exhibit 10-d to Registrant’s Annual Report on Form 10-K for the year endedNovember 2, 2003)*
10-d-1 First Amendment to Nordson Corporation Excess Defined Contribution Retirement Plan(incorporated herein by reference to Exhibit 10-d-1 to Registrant’s Annual Report on Form 10-K forthe year ended October 31, 2006)*
10-d-2 Nordson Corporation 2005 Excess Defined Contribution Benefit Plan (incorporated herein byreference to Exhibit 10-d-2 to Registrant’s Annual Report on Form 10-K for the year endedOctober 30, 2005)*
10-e Nordson Corporation Excess Defined Benefit Pension Plan (incorporated herein by reference toExhibit 10-e to Registrant’s Annual Report on Form 10-K for the year ended November 2, 2003)*
10-e-1 Second Amendment to Nordson Corporation Excess Defined Benefit Retirement Plan (incorporatedherein by reference to Exhibit 10-e-1 to Registrant’s Annual Report on Form 10-K for the yearended October 31, 2006)*
10-e-2 Nordson Corporation 2005 Excess Defined Benefit Pension Plan (incorporated herein by reference toExhibit 10-2 to Registrant’s Form 10-Q for the quarter ended January 30, 2005)*
10-f Employment Agreement between the Registrant and Edward P. Campbell (incorporated herein byreference to Exhibit 10-f to Registrant’s Annual Report on Form 10-K for the year ended October31, 2004)*
10-g Nordson Corporation 1993 Long-Term Performance Plan, as amended March 12, 1998*10-g-1 Nordson Corporation 2004 Long-Term Performance Plan (incorporated herein by reference to
Exhibit 10.1 to Registrant’s Form 8-K dated November 8, 2004)*
75
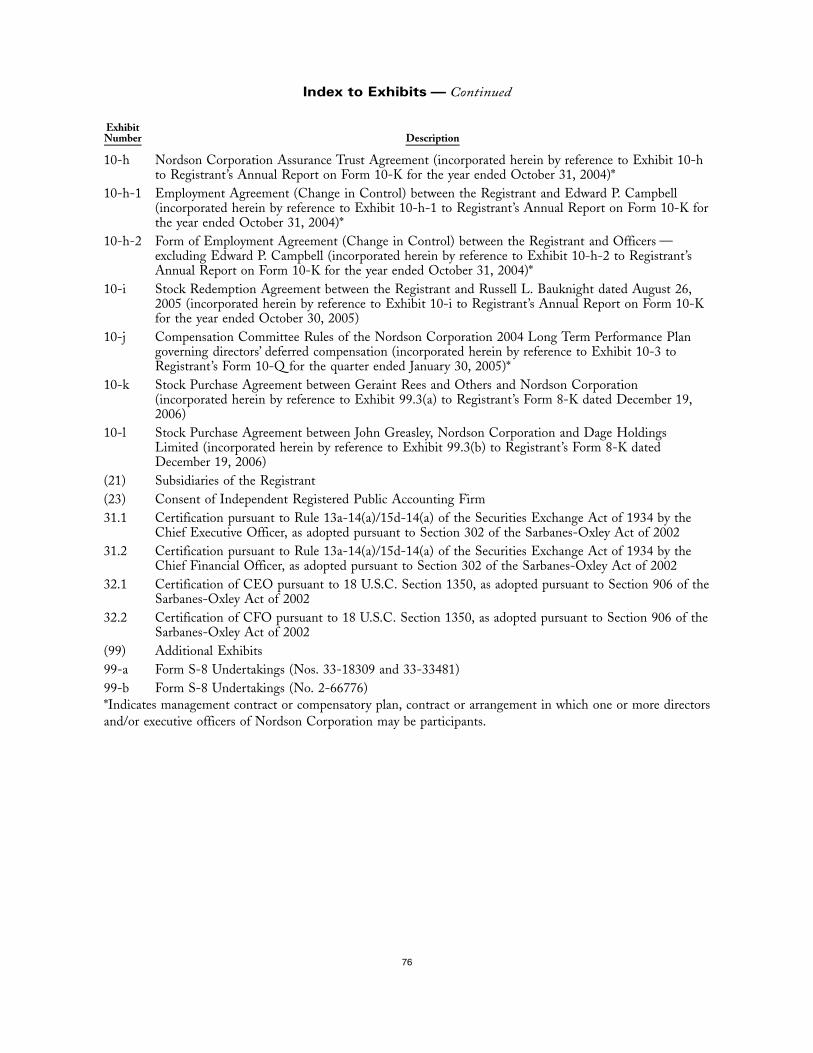
ExhibitNumber Description
10-h Nordson Corporation Assurance Trust Agreement (incorporated herein by reference to Exhibit 10-hto Registrant’s Annual Report on Form 10-K for the year ended October 31, 2004)*
10-h-1 Employment Agreement (Change in Control) between the Registrant and Edward P. Campbell(incorporated herein by reference to Exhibit 10-h-1 to Registrant’s Annual Report on Form 10-K forthe year ended October 31, 2004)*
10-h-2 Form of Employment Agreement (Change in Control) between the Registrant and Officers —excluding Edward P. Campbell (incorporated herein by reference to Exhibit 10-h-2 to Registrant’sAnnual Report on Form 10-K for the year ended October 31, 2004)*
10-i Stock Redemption Agreement between the Registrant and Russell L. Bauknight dated August 26,2005 (incorporated herein by reference to Exhibit 10-i to Registrant’s Annual Report on Form 10-Kfor the year ended October 30, 2005)
10-j Compensation Committee Rules of the Nordson Corporation 2004 Long Term Performance Plangoverning directors’ deferred compensation (incorporated herein by reference to Exhibit 10-3 toRegistrant’s Form 10-Q for the quarter ended January 30, 2005)*
10-k Stock Purchase Agreement between Geraint Rees and Others and Nordson Corporation(incorporated herein by reference to Exhibit 99.3(a) to Registrant’s Form 8-K dated December 19,2006)
10-l Stock Purchase Agreement between John Greasley, Nordson Corporation and Dage HoldingsLimited (incorporated herein by reference to Exhibit 99.3(b) to Registrant’s Form 8-K datedDecember 19, 2006)
(21) Subsidiaries of the Registrant(23) Consent of Independent Registered Public Accounting Firm31.1 Certification pursuant to Rule 13a-14(a)/15d-14(a) of the Securities Exchange Act of 1934 by the
Chief Executive Officer, as adopted pursuant to Section 302 of the Sarbanes-Oxley Act of 200231.2 Certification pursuant to Rule 13a-14(a)/15d-14(a) of the Securities Exchange Act of 1934 by the
Chief Financial Officer, as adopted pursuant to Section 302 of the Sarbanes-Oxley Act of 200232.1 Certification of CEO pursuant to 18 U.S.C. Section 1350, as adopted pursuant to Section 906 of the
Sarbanes-Oxley Act of 200232.2 Certification of CFO pursuant to 18 U.S.C. Section 1350, as adopted pursuant to Section 906 of the
Sarbanes-Oxley Act of 2002(99) Additional Exhibits99-a Form S-8 Undertakings (Nos. 33-18309 and 33-33481)99-b Form S-8 Undertakings (No. 2-66776)*Indicates management contract or compensatory plan, contract or arrangement in which one or more directorsand/or executive officers of Nordson Corporation may be participants.
76
Index to Exhibits — Continued

Exhibit 21
NORDSON CORPORATION
Subsidiaries of the Registrant
The following table sets forth the subsidiaries of the Registrant (each of which is included in the Registrant’sconsolidated financial statements), and the jurisdiction under the laws of which each subsidiary was organized.
Jurisdictionof Incorporation Name
INTERNATIONAL:Australia Nordson Australia Pty. LimitedAustria Nordson GmbHBelgium Nordson Benelux S.A./N.V.Brazil Nordson do Brasil Industria e Comercio Ltda.Canada Nordson Canada LimitedChina Nordson (China) Co. Ltd.China Dage Trading (Suzhou) Co. Ltd.(11)
China Dage Test Systems (Suzhou) Co. Ltd.(11)
Colombia Nordson Andina LimitadaCzech Republic Nordson CS, spol.s.r.o.Denmark Nordson Danmark A/SFinland Nordson Finland OyFrance Nordson France S.A.S.France Dosage 2000(1)
Germany Nordson Deutschland GmbH(2)
Germany Nordson Engineering GmbH(3)
Germany Nordson Holdings GmbHGermany Wolfgang Puffe Hotmelt-TechnologieGermany Dage Deutschland GmbH(10)
Germany Dage SemiConductor GmbH(12)
Germany Dage Medixtec GmbH(12)
Germany Dage Electronic Europa Vertrieb EV GmbH(12)
Germany Picodostec GmbHHong Kong Nordson Application Equipment, Inc.India Nordson India Private LimitedItaly Nordson Italia S.p.A.Japan Nordson K.K.Japan Nordson Asymtek K.K.Japan Dage Arctek(11)
Malaysia Nordson (Malaysia) Sdn. Bhd.Mexico Nordson de Mexico, S.A. de C.V.The Netherlands Nordson Benelux B.V.The Netherlands Nordson B.V.New Zealand Nordson New ZealandNorway Nordson Norge A/SPoland Nordson Polska Sp.z.o.o.Portugal Nordson Portugal Equipamento Industrial, Lda.Russia Nordson Deutschland GmbH - Representative OfficeSingapore Nordson S.E. Asia (Pte.) Ltd.Singapore Dage (SEASIA) Pte. Ltd.(11)
77
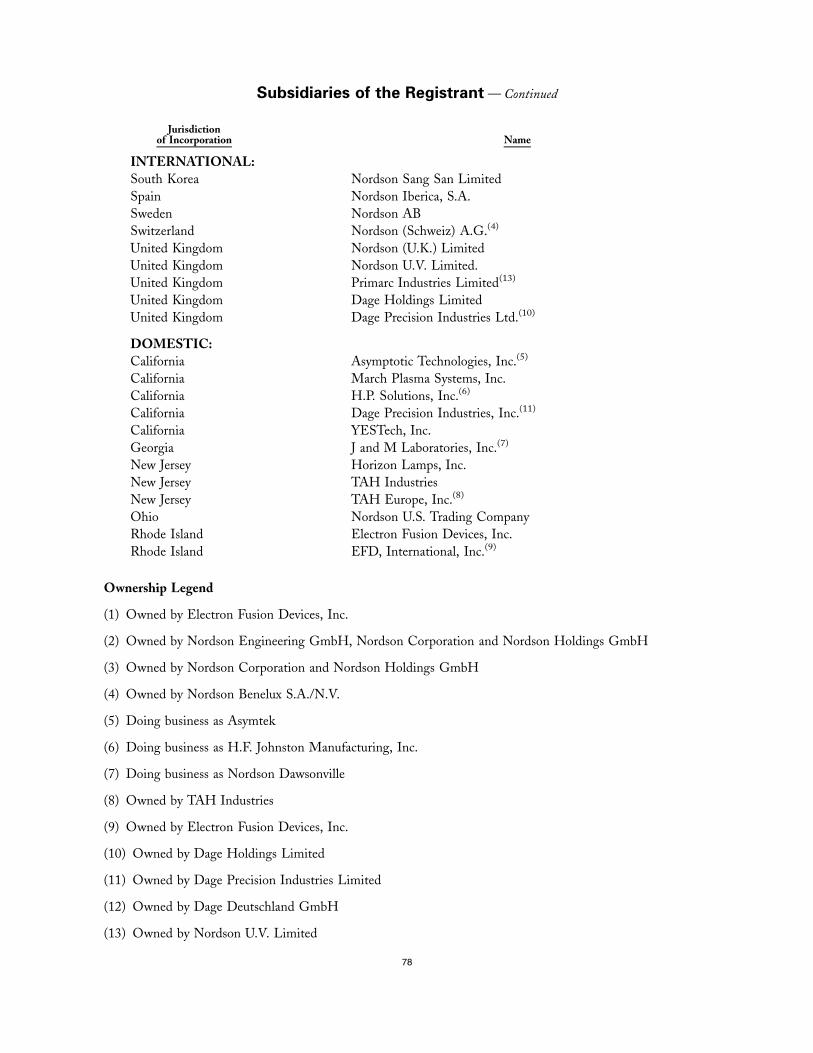
Jurisdictionof Incorporation Name
INTERNATIONAL:South Korea Nordson Sang San LimitedSpain Nordson Iberica, S.A.Sweden Nordson ABSwitzerland Nordson (Schweiz) A.G.(4)
United Kingdom Nordson (U.K.) LimitedUnited Kingdom Nordson U.V. Limited.United Kingdom Primarc Industries Limited(13)
United Kingdom Dage Holdings LimitedUnited Kingdom Dage Precision Industries Ltd.(10)
DOMESTIC:California Asymptotic Technologies, Inc.(5)
California March Plasma Systems, Inc.California H.P. Solutions, Inc.(6)
California Dage Precision Industries, Inc.(11)
California YESTech, Inc.Georgia J and M Laboratories, Inc.(7)
New Jersey Horizon Lamps, Inc.New Jersey TAH IndustriesNew Jersey TAH Europe, Inc.(8)
Ohio Nordson U.S. Trading CompanyRhode Island Electron Fusion Devices, Inc.Rhode Island EFD, International, Inc.(9)
Ownership Legend
(1) Owned by Electron Fusion Devices, Inc.
(2) Owned by Nordson Engineering GmbH, Nordson Corporation and Nordson Holdings GmbH
(3) Owned by Nordson Corporation and Nordson Holdings GmbH
(4) Owned by Nordson Benelux S.A./N.V.
(5) Doing business as Asymtek
(6) Doing business as H.F. Johnston Manufacturing, Inc.
(7) Doing business as Nordson Dawsonville
(8) Owned by TAH Industries
(9) Owned by Electron Fusion Devices, Inc.
(10) Owned by Dage Holdings Limited
(11) Owned by Dage Precision Industries Limited
(12) Owned by Dage Deutschland GmbH
(13) Owned by Nordson U.V. Limited
78
Subsidiaries of the Registrant — Continued

Exhibit 23
NORDSON CORPORATION
Consent of Independent Registered Public Accounting Firm
We consent to the incorporation by reference in the Registration Statements (Forms S-8) listed below of NordsonCorporation of our reports dated December 17, 2007, with respect to the consolidated financial statements andschedule of Nordson Corporation, and the effectiveness of internal control over financial reporting of NordsonCorporation included in the Annual Report (Form 10-K) for the year ended October 31, 2007:
• Nordson Employees’ Savings Trust Plan (No. 33-18309)
• Nordson Hourly-Rated Employees’ Savings Trust Plan (No. 33-33481)
• Nordson Corporation 1993 Long-Term Performance Plan (No. 33-67780)
• Nordson Corporation 2004 Long-Term Performance Plan (No. 333-119399)
Cleveland, OhioDecember 21, 2007
79

Exhibit 31.1
Certification Pursuant to Rule 13a-14(a)/15d-14(a) of the Securities
Exchange Act of 1934, as Adopted Pursuant to Section 302 of the
Sarbanes-Oxley Act of 2002
I, Edward P. Campbell, certify that:
1. I have reviewed this Annual Report on Form 10-K of Nordson Corporation;
2. Based on my knowledge, this report does not contain any untrue statement of a material fact or omit to statea material fact necessary to make the statements made, in light of the circumstances under which such statementswere made, not misleading with respect to the period covered by this report;
3. Based on my knowledge, the financial statements, and other financial information included in this report,fairly present in all material respects the financial condition, results of operations and cash flows of the registrant asof, and for, the periods presented in this report;
4. The registrant’s other certifying officer and I are responsible for establishing and maintaining disclosure controlsand procedures (as defined in Exchange Act Rules 13a-15(e) and 15d-15(e)) and internal control over financial reporting(as defined in Exchange Act Rules 13a-15(f ) and 15d-15(f )) for the registrant and have:
a) designed such disclosure controls and procedures, or caused such disclosure controls and procedures tobe designed under our supervision, to ensure that material information relating to the registrant, including itsconsolidated subsidiaries, is made known to us by others within those entities, particularly during the period inwhich this report is being prepared;
b) designed such internal control over financial reporting, or caused such internal control over financialreporting to be designed under our supervision, to provide reasonable assurance regarding the reliability offinancial reporting and the preparation of financial statements for external purposes in accordance withgenerally accepted accounting principles;
c) evaluated the effectiveness of the registrant’s disclosure controls and procedures and presented in thisreport our conclusions about the effectiveness of the disclosure controls and procedures, as of the end of theperiod covered by this report based on such evaluation; and
d) disclosed in this report any change in the registrant’s internal control over financial reporting thatoccurred during the registrant’s most recent fiscal quarter (the registrant’s fourth fiscal quarter in the case of anannual report) that has materially affected, or is reasonably likely to materially affect, the registrant’s internalcontrol over financial reporting; and
5. The registrant’s other certifying officer and I have disclosed, based on our most recent evaluation of internalcontrol over financial reporting, to the registrant’s auditors and the audit committee of registrant’s board of directors(or persons performing the equivalent functions):
a) all significant deficiencies and material weaknesses in the design or operation of internal control overfinancial reporting that are reasonably likely to adversely affect the registrant’s ability to record, process,summarize and report financial information; and
b) any fraud, whether or not material, that involves management or other employees who have asignificant role in the registrant’s internal control over financial reporting.
/s/ EDWARD P. CAMPBELL
Edward P. CampbellChairman of the Board of Directors
and Chief Executive Officer
Date: December 21, 2007
80

Exhibit 31.2
Certification Pursuant to Rule 13a-14(a)/15d-14(a) of the Securities
Exchange Act of 1934, as Adopted Pursuant to Section 302 of the
Sarbanes-Oxley Act of 2002
I, Peter S. Hellman, certify that:
1. I have reviewed this Annual Report on Form 10-K of Nordson Corporation;
2. Based on my knowledge, this report does not contain any untrue statement of a material fact or omit to statea material fact necessary to make the statements made, in light of the circumstances under which such statementswere made, not misleading with respect to the period covered by this report;
3. Based on my knowledge, the financial statements, and other financial information included in this report,fairly present in all material respects the financial condition, results of operations and cash flows of the registrant asof, and for, the periods presented in this report;
4. The registrant’s other certifying officer and I are responsible for establishing and maintaining disclosure controlsand procedures (as defined in Exchange Act Rules 13a-15(e) and 15d-15(e)) and internal control over financial reporting(as defined in Exchange Act Rules 13a-15(f ) and 15d-15(f )) for the registrant and have:
a) designed such disclosure controls and procedures, or caused such disclosure controls and procedures tobe designed under our supervision, to ensure that material information relating to the registrant, including itsconsolidated subsidiaries, is made known to us by others within those entities, particularly during the period inwhich this report is being prepared;
b) designed such internal control over financial reporting, or caused such internal control over financialreporting to be designed under our supervision, to provide reasonable assurance regarding the reliability offinancial reporting and the preparation of financial statements for external purposes in accordance withgenerally accepted accounting principles;
c) evaluated the effectiveness of the registrant’s disclosure controls and procedures and presented in thisreport our conclusions about the effectiveness of the disclosure controls and procedures, as of the end of theperiod covered by this report based on such evaluation; and
d) disclosed in this report any change in the registrant’s internal control over financial reporting thatoccurred during the registrant’s most recent fiscal quarter (the registrant’s fourth fiscal quarter in the case of anannual report) that has materially affected, or is reasonably likely to materially affect, the registrant’s internalcontrol over financial reporting; and
5. The registrant’s other certifying officer and I have disclosed, based on our most recent evaluation of internalcontrol over financial reporting, to the registrant’s auditors and the audit committee of registrant’s board of directors(or persons performing the equivalent functions):
a) all significant deficiencies and material weaknesses in the design or operation of internal control overfinancial reporting that are reasonably likely to adversely affect the registrant’s ability to record, process,summarize and report financial information; and
b) any fraud, whether or not material, that involves management or other employees who have asignificant role in the registrant’s internal control over financial reporting.
/s/ PETER S. HELLMAN
Peter S. HellmanPresident, Chief Financial and
Administrative Officer
Date: December 21, 2007
81

Exhibit 32.1
Certification Pursuant to
18 U.S.C. Section 1350,
As Adopted Pursuant to
Section 906 of the Sarbanes-Oxley Act of 2002
In connection with the Annual Report of Nordson Corporation (the “Company”) on Form 10-K for the year endedOctober 31, 2007, as filed with the Securities and Exchange Commission on the date hereof (the “Report”), I,Edward P. Campbell, chairman of the board of directors and chief executive officer of the Company, certify,pursuant to 18 U.S.C. Section 1350, as adopted pursuant to Section 906 of the Sarbanes-Oxley Act of 2002, that:
(1) The Report fully complies with the requirements of Section 13(a) or 15(d) of the Securities ExchangeAct of 1934; and
(2) The information contained in the Report fairly presents, in all material respects, the financialcondition and results of operations of the Company.
/s/ EDWARD P. CAMPBELL
Edward P. CampbellChairman of the Board of Directors
and Chief Executive Officer
December 21, 2007
82

Exhibit 32.2
Certification Pursuant to
18 U.S.C. Section 1350,
As Adopted Pursuant To
Section 906 of the Sarbanes-Oxley Act of 2002
In connection with the Annual Report of Nordson Corporation (the “Company”) on Form 10-K for the year endedOctober 31, 2007, as filed with the Securities and Exchange Commission on the date hereof (the “Report”), I, PeterS. Hellman, president, chief financial and administrative officer and director of the Company, certify, pursuant to18 U.S.C. Section 1350, as adopted pursuant to Section 906 of the Sarbanes-Oxley Act of 2002, that:
(1) The Report fully complies with the requirements of Section 13(a) or 15(d) of the Securities ExchangeAct of 1934; and
(2) The information contained in the Report fairly presents, in all material respects, the financialcondition and results of operations of the Company.
/s/ PETER S. HELLMAN
Peter S. HellmanPresident, Chief Financial and
Administrative Officer and Director
December 21, 2007
83

(This page intentionally left blank)
%%TRANSMSG*** Transmitting Job: L22480 PCN: 528000000 *** %%PCMSG| |00001|Yes|No|01/08/2007 20:13|0|1|Page is valid, no graphics -- Color: N|

© 2007 Nordson Corporation
Nordson is a registered trademark of Nordson Corporation.
This report was bound using Nordson adhesive dispensing equipment.
10-K pages were printed on paper containing 100% recycled content
with a minimum of 30% post-consumer waste. This paper was produced using
100% green power via hydroelectricity. The balance of the report was printed on
paper containing a minimum of 10% post-consumer recovered fiber.
C
0712542_cover-03.qxp 1/9/08 6:18 PM Page 4

Nordson Corporation 28601 Clemens Road Westlake, Ohio 44145-4551 www.nordson.com
0712542_cover-02.qxp 1/8/08 7:27 PM Page 1