Nordea Eiendomskreditt Covered Bonds...Nordea Eiendomskreditt – overview 5 • A 100% owned...
22
Nordea Eiendomskreditt Covered Bonds Q2 2018 Debt investor presentation
Transcript of Nordea Eiendomskreditt Covered Bonds...Nordea Eiendomskreditt – overview 5 • A 100% owned...
Nordea Eiendomskreditt Covered Bonds
Q2 2018 Debt investor presentation
Table of contents
1. In brief
2. Cover pool key characteristics
3. Asset quality
4. Covered bond framework
5. Macro
6. Further information
3
6
10
14
16
20
2
1. In brief
3
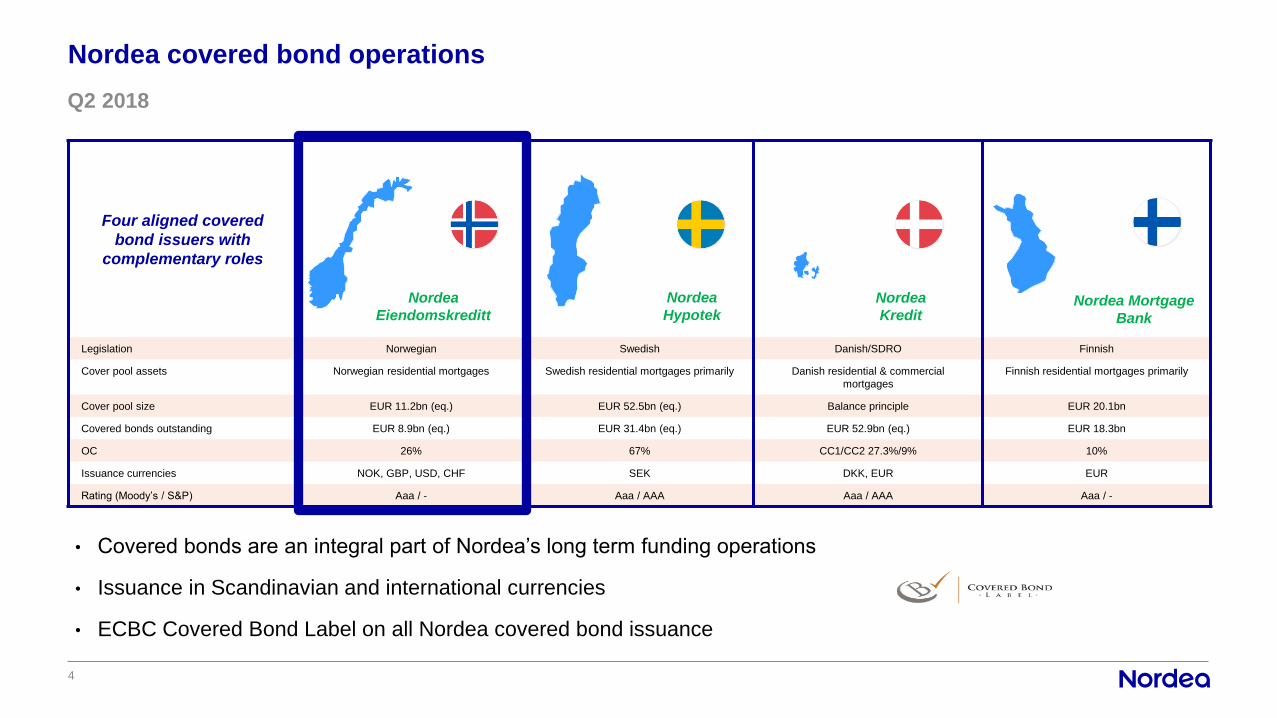
Nordea covered bond operations
• Covered bonds are an integral part of Nordea’s long term funding operations
• Issuance in Scandinavian and international currencies
• ECBC Covered Bond Label on all Nordea covered bond issuance
Four aligned covered
bond issuers with
complementary roles
Legislation Norwegian Swedish Danish/SDRO Finnish
Cover pool assets Norwegian residential mortgages Swedish residential mortgages primarily Danish residential & commercial
mortgages
Finnish residential mortgages primarily
Cover pool size EUR 11.2bn (eq.) EUR 52.5bn (eq.) Balance principle EUR 20.1bn
Covered bonds outstanding EUR 8.9bn (eq.) EUR 31.4bn (eq.) EUR 52.9bn (eq.) EUR 18.3bn
OC 26% 67% CC1/CC2 27.3%/9% 10%
Issuance currencies NOK, GBP, USD, CHF SEK DKK, EUR EUR
Rating (Moody’s / S&P) Aaa / - Aaa / AAA Aaa / AAA Aaa / -
Nordea Mortgage
Bank
Nordea
Kredit
Nordea
Hypotek
Nordea
Eiendomskreditt
4
Q2 2018
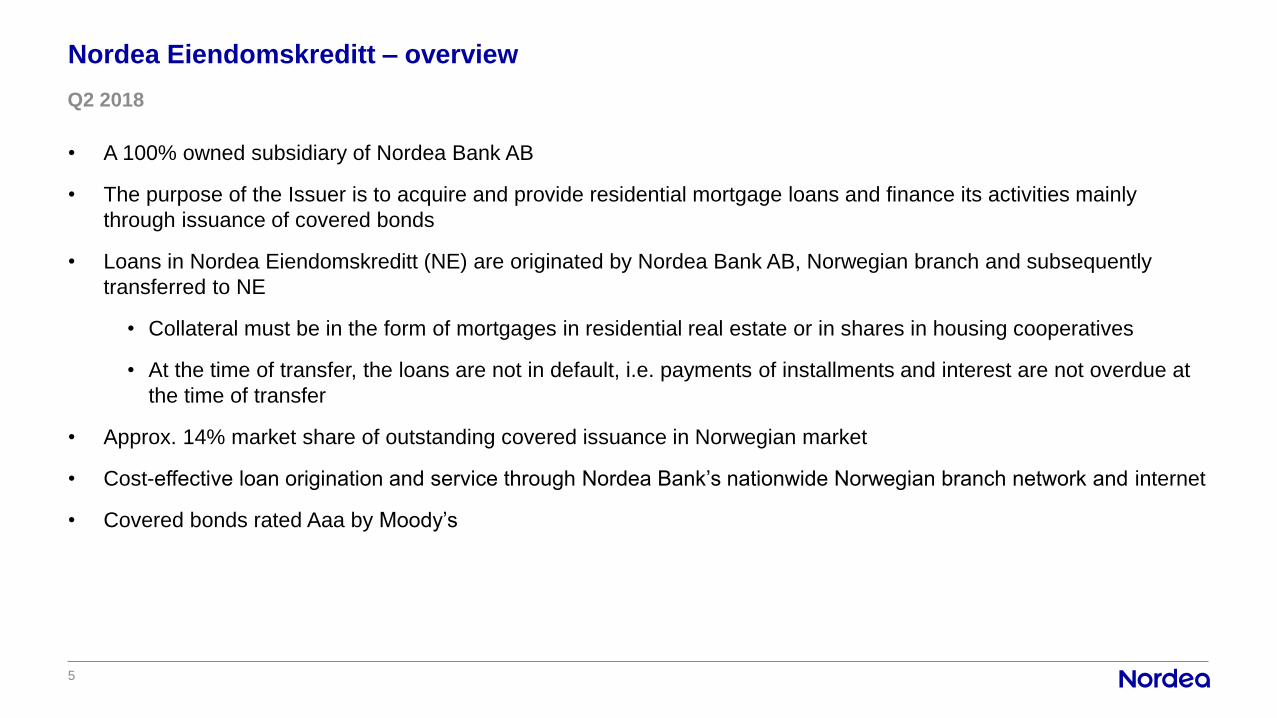
Nordea Eiendomskreditt – overview
5
• A 100% owned subsidiary of Nordea Bank AB
• The purpose of the Issuer is to acquire and provide residential mortgage loans and finance its activities mainly
through issuance of covered bonds
• Loans in Nordea Eiendomskreditt (NE) are originated by Nordea Bank AB, Norwegian branch and subsequently
transferred to NE
• Collateral must be in the form of mortgages in residential real estate or in shares in housing cooperatives
• At the time of transfer, the loans are not in default, i.e. payments of installments and interest are not overdue at
the time of transfer
• Approx. 14% market share of outstanding covered issuance in Norwegian market
• Cost-effective loan origination and service through Nordea Bank’s nationwide Norwegian branch network and internet
• Covered bonds rated Aaa by Moody’s
Q2 2018

2. Cover pool characteristics
6

Cover pool key characteristics
7
Cover pool summary
Pool notional NOK 109.8bn
Outstanding Covered Bonds NOK 87.1bn
Cover pool content Mortgage loans secured by Norwegian residential collateral
Geographic distribution Throughout Norway with concentration to urban areas
Asset distribution 100% residential
Weighted average LTV 49.3% (indexed, calculated per property)
Average loan size NOK 1.5m
Over Collateralisation (OC) 26.1%, (2% legal requirement)
Rate type Floating 98.3%, Fixed 1.7%
Amortisation Bullet/ interest only 33.0%, Amortizing 67.0%
Pool type Dynamic
Loans originated by Nordea Bank AB, Norway Branch
Q2 2018

Cover pool key characteristics (2)
8
49,9% 48,2%
45,4%
0%
10%
20%
30%
40%
50%
60%
70%
80%
90%
100%
Single-family houses Tenant owner units Summer houses
Weighted Average LTV – Indexed
Tenant owner units 26%
Single family houses
71%
Summer houses 3%
Cover pool balance by loan category
Regulatory limit 75%
Regulatory limit 60%
Q2 2018

Cover pool – geographic distribution
9
Fylke Loan balance Region
Akershus 17,27 % East
Aust-Agder 1,56 % South
Buskerud 4,20 % East
Finnmark 0,46 % North
Hedmark 1,93 % East
Hordland 11,00 % West
Møre og Romsdal 7,53 % West
Nordland 2,00 % North
Oppland 3,69 % East
Oslo 23,23 % East
Rogaland 4,35 % West
Sogn og Fjordane 1,11 % West
Svalbard 0,00 % North
Telemark 1,18 % East
Troms 2,24 % North
Trøndelag 3,03 % Mid
Vest-Agder 4,24 % South
Vestfold 3,55 % East
Østfold 7,44 % East
Q2 2018

3. Asset quality
10

Loan to Value (LTV) Each loan is reported in the highest bucket
11
Weighted Average LTV – Unindexed 50.3%
LTV buckets Nominal (NOKm) % Residential Loans
>0 - <=40 % 30 684 27,94%
>40 - <=50 % 18 218 16,59%
>50 - <=60 % 23 440 21,35%
>60 - <=70 % 21 441 19,52%
>70 - <=80 % 16 033 14,60%
Total 109 816 100%
Weighted Average LTV - Indexed 49.3%
LTV buckets Nominal (NOKm) % Residential Loans
>0 - <=40 % 32 256 29,37%
>40 - <=50 % 18 952 17,26%
>50 - <=60 % 23 779 21,65%
>60 - <=70 % 21 014 19,14%
>70 - <=80 % 13 815 12,58%
Total 109 816 100%
Q2 2018

Loan structure
12
Q2 2018
Rate type Repayment
2,3% 1,7% 1,7% 1,5% 1,6% 1,7%
97,7% 98,3% 98,3% 98,5% 98,4% 98,3%
0%
10%
20%
30%
40%
50%
60%
70%
80%
90%
100%
17Q1 17Q2 17Q3 17Q4 18Q1 18Q2
Floating rate
Fixed rate
37,4% 35,0% 35,2% 32,3% 32,8% 33,0%
62,6% 65,0% 64,8% 67,7% 67,2% 67,0%
0%
10%
20%
30%
40%
50%
60%
70%
80%
90%
100%
17Q1 17Q2 17Q3 17Q4 18Q1 18Q2
Repayment
Amortising
Bullet / interest only
* Including Flex loans
*

Underwriting criteria
13
Affordability
• Customers ability to service its commitment out of its cash flow/income is critical
• Repayment ability of borrowers is calculated using stressed scenarios. Customers must manage 5 percentage points
increase on interest rate on all debt
• Scoring of retail customers
Payment history
• Credit bureau check is always conducted. Potential external payment remarks are revealed
Collateral
• Information from Norwegian official property register in order to secure correct real estate ownership and priority
• Nordea accepts four sources of real estate valuations:
a) Written statement from external authorized valuer
b) Last sales price (within 6 months)
c) Use of external evaluating system “Eiendomsverdi” (used by most banks and real estate agents in Norway)
d) Written statement from (external) real estate agent
Q2 2018
5. Covered Bond framework
14
2
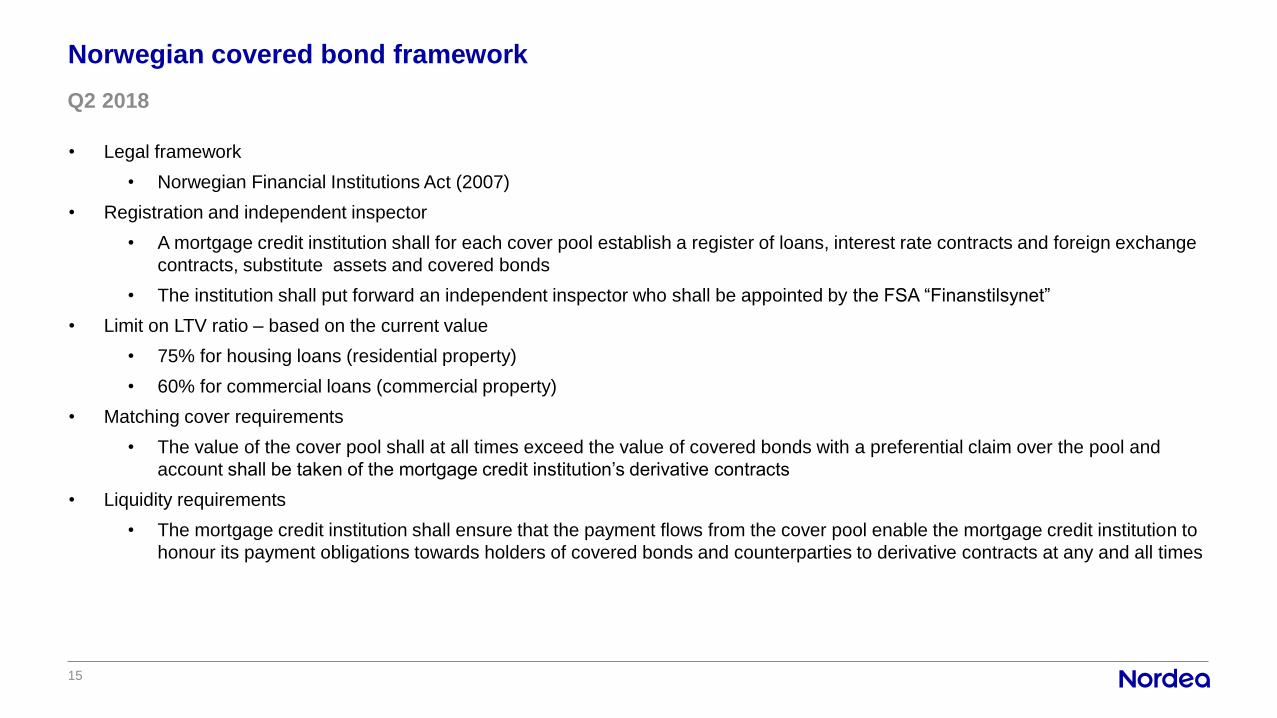
• Legal framework
• Norwegian Financial Institutions Act (2007)
• Registration and independent inspector
• A mortgage credit institution shall for each cover pool establish a register of loans, interest rate contracts and foreign exchange
contracts, substitute assets and covered bonds
• The institution shall put forward an independent inspector who shall be appointed by the FSA “Finanstilsynet”
• Limit on LTV ratio – based on the current value
• 75% for housing loans (residential property)
• 60% for commercial loans (commercial property)
• Matching cover requirements
• The value of the cover pool shall at all times exceed the value of covered bonds with a preferential claim over the pool and
account shall be taken of the mortgage credit institution’s derivative contracts
• Liquidity requirements
• The mortgage credit institution shall ensure that the payment flows from the cover pool enable the mortgage credit institution to
honour its payment obligations towards holders of covered bonds and counterparties to derivative contracts at any and all times
Norwegian covered bond framework
15
Q2 2018
6. Macro
16

Prospering Nordic economies
Source: Nordea Markets Economic Outlook April 2018 and Macrobond
• The Nordics are enjoying an economic tailwind. While the
synchronized global recovery raise exports, the
accommodative monetary polices support domestic demand
• Short-term survey indicators remain upbeat, which suggests
growth will be held up in the near-term
Country 2015 2016 2017 2018E 2019E
Denmark 1.6 2.0 2.2 1.8 1.7
Finland 0.1 2.1 2.6 3.0 2.5
Norway 1.4 1.0 1.8 2.4 2.4
Sweden 4.3 3.0 2.7 2.5 1.9
GDP development Unemployment rate
Comments GDP forecast, %
17

Belgium
Denmark
Germany
IrelandGreece
Spain
FranceItaly
Netherlands
AustriaPortugalFinland
Sweden
UK
US
Norway
-6
-4
-2
0
2
4
6
8
10
20 40 60 80 100 120 140 160 180
Pu
bli
c b
ala
nc
e, %
of
GD
P,
20
18
E
Public debt, % of GDP, 2018E *blue line = Maastricht criteria
Household debt remains high, but so is private and public savings
Source: Nordea Markets, European Commission, Winter 2018 forecast
• In all countries, apart from Denmark, household debt
continues to rise somewhat faster than income. Meanwhile,
households’ savings rates remain at high levels, apart from
Finland where savings have declined somewhat in recent
years
• The Nordic public finances are robust due to the overall
economic recovery and relatively strict fiscal policies. Norway
is in a class of its own due to oil revenues
Household debt Household savings
Public balance/debt, % of GDP, 2018E Comments
18
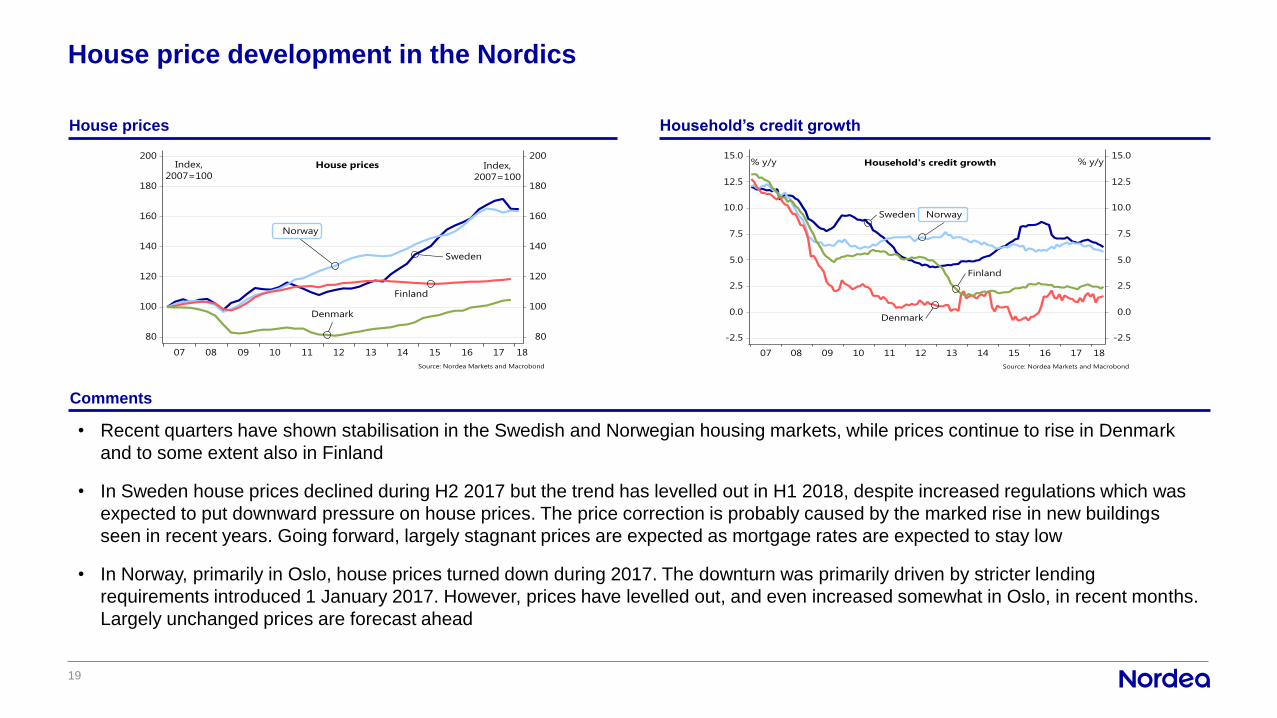
House price development in the Nordics
• Recent quarters have shown stabilisation in the Swedish and Norwegian housing markets, while prices continue to rise in Denmark
and to some extent also in Finland
• In Sweden house prices declined during H2 2017 but the trend has levelled out in H1 2018, despite increased regulations which was
expected to put downward pressure on house prices. The price correction is probably caused by the marked rise in new buildings
seen in recent years. Going forward, largely stagnant prices are expected as mortgage rates are expected to stay low
• In Norway, primarily in Oslo, house prices turned down during 2017. The downturn was primarily driven by stricter lending
requirements introduced 1 January 2017. However, prices have levelled out, and even increased somewhat in Oslo, in recent months.
Largely unchanged prices are forecast ahead
House prices Household’s credit growth
Comments
19

7. Further information
20
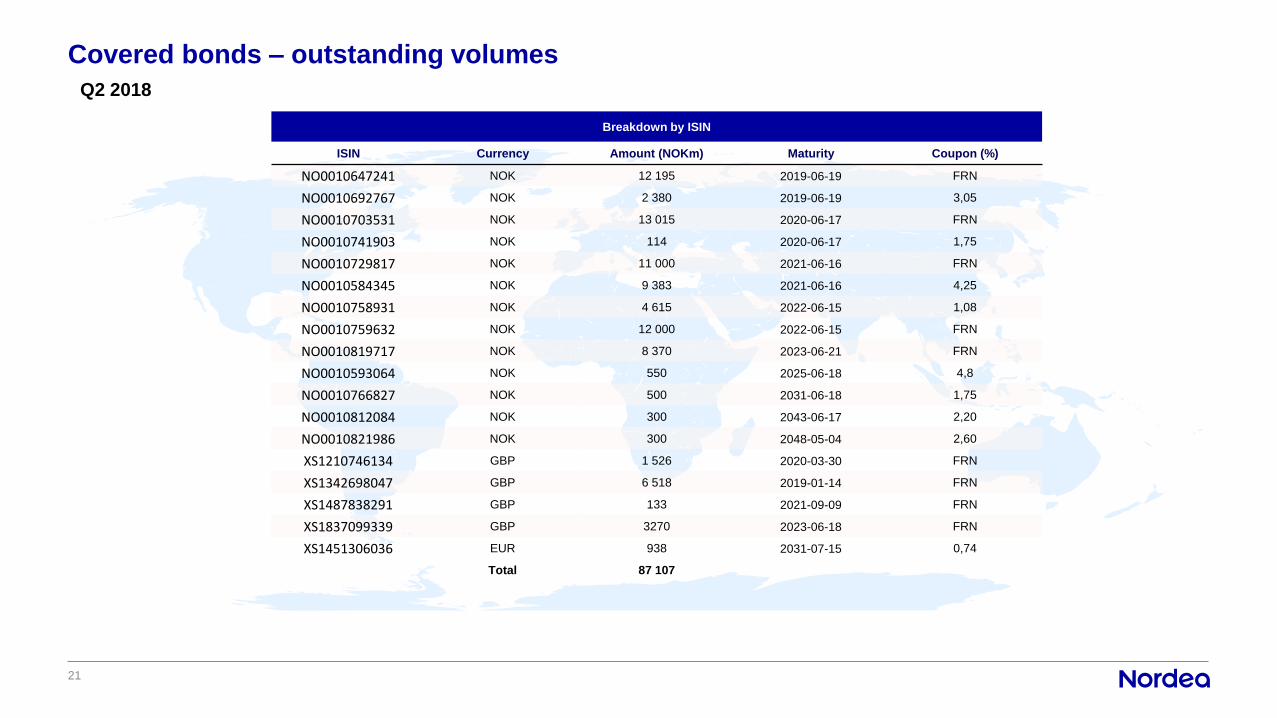
Covered bonds – outstanding volumes
Breakdown by ISIN
ISIN Currency Amount (NOKm) Maturity Coupon (%)
NO0010647241 NOK 12 195 2019-06-19 FRN
NO0010692767 NOK 2 380 2019-06-19 3,05
NO0010703531 NOK 13 015 2020-06-17 FRN
NO0010741903 NOK 114 2020-06-17 1,75
NO0010729817 NOK 11 000 2021-06-16 FRN
NO0010584345 NOK 9 383 2021-06-16 4,25
NO0010758931 NOK 4 615 2022-06-15 1,08
NO0010759632 NOK 12 000 2022-06-15 FRN
NO0010819717 NOK 8 370 2023-06-21 FRN
NO0010593064 NOK 550 2025-06-18 4,8
NO0010766827 NOK 500 2031-06-18 1,75
NO0010812084 NOK 300 2043-06-17 2,20
NO0010821986 NOK 300 2048-05-04 2,60
XS1210746134 GBP 1 526 2020-03-30 FRN
XS1342698047 GBP 6 518 2019-01-14 FRN
XS1487838291 GBP 133 2021-09-09 FRN
XS1837099339 GBP 3270 2023-06-18 FRN
XS1451306036 EUR 938 2031-07-15 0,74
Total 87 107
21
Q2 2018

Contacts
Investor Relations
Andreas Larsson
Head of Debt IR
Nordea Bank AB
Mobile: +46 709 70 75 55
Tel: +46 10 156 29 61
Axel Malgerud
Debt IR Officer
Nordea Bank AB
Mobile: +46 721 41 51 50
Tel: +46 10 157 13 13
Group Treasury & ALM
Nils Gunnar Baumann
Chief Treasury Manager
Tel: +47 240 15 076
Mobile: +47 932 49 720
22