Nonlinear Analysis of Reinforced Concrete T-Beam
18
868 . Nonlinear Analysis of Reinforced Concrete T-Beam Osman M. O. Ramadan a , Ahmed H. Abdel-Kareem b , Hala R. Abou safa b , and Ibrahim A. El-Azab b * a Department of Civil Engineering, Cairo University, Cairo, Egypt b Department of Civil Engineering, Benha University, Benha, Egypt خص العربى :مل الد العدث أنها تستخدم فة، ح الهندسة المدن مجالق واسع ف نطاشفه علحة ذات المسلة اللخرسان الكمرات ا تستخدموع من الكمرات هذا النة علة والنظرعملت الساد من الدرا العد عملة. تملخرسانصر العنات واقا والتطب المنشأت من متها فت أهم وقد اثبتلتحل ال بعمل هذا البحث نقومقص بشكل فعال. فومة قوي ال قاة العنصرستخدام نظرلنظري با ا برنامج "ل استخدام المحدود من خANSYS لكمرات النموذج النظري لق منده بعد التحقرات جدذلك دراسة متغ " وكةلخرسان امسلحة الوي القص من خاومة ق مقشفة علر ال الشفة وتأث ذات تم التنات الع نماذج لبع ل عمل بواسطةدةرات جد دراسة متغا أنه تم، كمستخدم صحة النموذج الملتأكد منلنتائج لها لرنة افعل ومقاختبارها بال ارات دراسةذه المتغ، ومن هلمشار له النموذج الخرسانةومة ا مقاثة من حلخرساند الشفة ا ، نسبة أبعا العمق والعربعا لها د العصبن ، النسبة بنةمق الع بحر القص وع، را نسبة و أخد الطول الحد بالشفة.Abstract: The main objective of this research is to study the shear strength outcomes from the nonlinear constitutive reinforced concrete T-beam models and make a comparison with experimental results. The models were performed in the finite element computer program ANSYS V-19.2 so as to apply the 3D nonlinear analysis of flanged specimens. Ninety-six samples were tested simply supports under two concentrated points of static loading up to failure. Several validation studies have been carried out on flanged beams with variable flange dimensions. The current work presents good results between experimental and numerical results about (1.03 and 0.87 %) for the load-deflection curves and the crack patterns. Moreover, parametric studies have been occurred to discuss the effect of structural parameters on the performance of T-section against shear straining action. Four design parameters were arranged to involve flange dimensions, longitudinal reinforcement in flange, concrete compressive strength “fc”, and shear span to depth ratio. Beams were shown to obtain the load-deflection relationships, the ultimate loads, and the crack patterns. Therefore, they are compared to the solid reference one. The flange dimensions effect on the increased the shear strength by up to 260% of the shear strength of the web alone, and the effect of longitudinal reinforcement in flange enhancements the shear capacity up to 40%, finally shear span to depth ratio improvements the shear strength from 85% Al-Azhar University Civil Engineering Research Magazine (CERM) Vol. (43 ) No. ( 2 ) April . 2021
Transcript of Nonlinear Analysis of Reinforced Concrete T-Beam

868
.
Nonlinear Analysis of Reinforced Concrete T-Beam
Osman M. O. Ramadana, Ahmed H. Abdel-Kareem
b, Hala R. Abou safa
b,
and Ibrahim A. El-Azabb*
aDepartment of Civil Engineering, Cairo University, Cairo, Egypt
bDepartment of Civil Engineering, Benha University, Benha, Egypt
الملخص العربى :
تستخدم الكمرات الخرسانٌة المسلحة ذات الشفه علً نطاق واسع فً مجال الهندسة المدنٌة، حٌث أنها تستخدم فً العدٌد
من المنشأت والتطبٌقات والعناصر الخرسانٌة. تم عمل العدٌد من الدراسات العملٌة والنظرٌة علً هذا النوع من الكمرات
النظري باستخدام نظرٌة العنصر قاومة قوي القص بشكل فعال. فً هذا البحث نقوم بعمل التحلٌلوقد اثبتت أهمٌتها فً م
" وكذلك دراسة متغٌرات جدٌده بعد التحقق من النموذج النظري للكمرات ANSYS المحدود من خلال استخدام برنامج "
ل عمل نماذج لبع العٌنات التً تم ذات الشفة وتأثٌر الشفة علً مقاومة قوي القص من خلا المسلحة الخرسانٌة
اختبارها بالفعل ومقارنة النتائج لها للتأكد من صحة النموذج المستخدم، كما أنه تم دراسة متغٌرات جدٌدة بواسطة
العمق والعر ، نسبة أبعاد الشفة الخرسانٌة من حٌث مقاومة الخرسانةالنموذج المشار له، ومن هذه المتغٌرات دراسة
بالشفة. الحدٌد الطولًو أخٌرا نسبة ، بحر القص وعمق العٌنة، النسبة بٌن د العصبلها لأبعا
Abstract:
The main objective of this research is to study the shear strength outcomes from the nonlinear
constitutive reinforced concrete T-beam models and make a comparison with experimental
results. The models were performed in the finite element computer program ANSYS V-19.2 so
as to apply the 3D nonlinear analysis of flanged specimens. Ninety-six samples were tested
simply supports under two concentrated points of static loading up to failure. Several validation
studies have been carried out on flanged beams with variable flange dimensions. The current
work presents good results between experimental and numerical results about (1.03 and 0.87 %)
for the load-deflection curves and the crack patterns. Moreover, parametric studies have been
occurred to discuss the effect of structural parameters on the performance of T-section against
shear straining action. Four design parameters were arranged to involve flange dimensions,
longitudinal reinforcement in flange, concrete compressive strength “fc”, and shear span to
depth ratio. Beams were shown to obtain the load-deflection relationships, the ultimate loads,
and the crack patterns. Therefore, they are compared to the solid reference one. The flange
dimensions effect on the increased the shear strength by up to 260% of the shear strength of the
web alone, and the effect of longitudinal reinforcement in flange enhancements the shear
capacity up to 40%, finally shear span to depth ratio improvements the shear strength from 85%
Al-Azhar University Civil Engineering Research Magazine (CERM)
Vol. (43 ) No. ( 2 ) April . 2021

869
to 260%. Three experimental T-beams were in the main concern of this research and they were
done in variety to ensure the validity of types.
Keywords: finite element analysis, shear strength, reinforced concrete beams, T-beam, Girder
1. Introduction
Flanged reinforced concrete beams have been widely used in many applications in the field of
civil engineering. The attitude of this kind of structural members was discussed experimentally
as well as analytically. Numerical analysis technique that is based on the finite element method
has been checked in this research to detect the effect of the flange on the reinforced concrete T-
beam in both pre- and post-cracking stages of loading and up to ultimate load.
ANSYS [1] is one of the most exceedingly famous computer programs which used structural
analysis through the finite element method. The overall study in the area of numerical modeling
and finite element supports the engineers and researchers with many applications not only in
construction on but also in other industries and scientific aspects. One of the characteristics of
ANSYS, which was appealing to researchers, is the possibility of specification through adding
extra features and qualities. This simplified the research process by contributing in the
production of new material models or finite elements and anticipated to the spread of
understanding knowledge in all scientific realms.
According to Hesham et al. [2] a numerical experimental study was fulfilled to check the
validity of using lightweight concrete beams. It observed the shear behavior of lightweight
concrete; six lightweight concrete beams were tested in two-point bending to urge the effect of
flange width and shear span on depth ratio. In the experimental and FE studies, the failure load
of the T-beams with different flange widths (320, 520, and 720 mm) were increased in
proportion to the flange width. During the experimental and FE studies, the failure load noticed
to be inversely proportional to all the shear span to depth ratio, vertical deflection, longitudinal
steel strain, stirrup steel strain, and compressive concrete strain of the T-beams with various
flange widths (320, 520, and 720 mm) respectively.
As Balamuralikrishnan et al. [3] mentioned, the main objective of this work is to evaluate the
static load trend of RC T-beams reinforced internally with GFRP reinforcements using finite
element analysis software ANSYS. Totally twelve numbers of specimens were completely Pm
outlined in this study in a way of varying parameters such as the type of reinforcements,
reinforcements ratio, and concrete grade. Modeling of the T- beams was done with ANSYS by
using solid 65 and link 8 element and the same was tested under static loading atmospheres. The
experimental outcomes of the flanged beams met perfectly that of the analytical results that
were gathered from the flanged beams reinforced with steel and GFRP reinforcements.
2. Finite Element Modeling Using ANSYS
2.1. Geometric
Finite element modeling and nonlinear analysis are performed by using ANSYS software.
The structural element types which helped for geometric idealization of the different materials

871
are SOLID 65 for concrete, LINK 8 for steel bars and stirrups. In order to avoid stress
concentration problems such as localized crushing of concrete elements near the bearing and
loading plates, steel plates with 30 mm thickness are modeled by SOLID 45 at the location of
supports and loading places in specimen. The structural element types functioned to simulate the
different materials which are presented in Fig. 1. For solving the nonlinear analysis equations of
specimen, Newton- Raphson equilibrium iteration technique is used in the ANSYS software.
This technique relayed on a series of successive linear approximations with corrections.
According to this study, the convergence criterion relies on a displacement control. The infinite
norm of displacement and the convergence precision is 0.05 [9,10,11]. Thus, to improve the
convergence of nonlinear analysis, adaptive descend gene, linear searching, fore-casting, and
dichotomy were applied at the same time. The displacement boundary conditions are necessary
to protect the models. To show the cut off support boundary condition of the specimen, the
translations at the nodes (UX, UY and UZ) were specified as a constant value of zero, whereas
the other support was displayed as roller by indicating the translations at the nodes (UY) equal
zero value. The force (P) at two points was placed at the top of specimen in the gravity direction
to reveal the experimentally tested. The applicable load was known as incremental loads. There
was an adjustment for every increase in the result at certain specific load level. Fig. 2 shows the
occurred load and the supports conditions. The maximum number of iterations in each load step
was set as program default.
(a) Solid 65 (b) Link 8 (c) Solid 45
Fig. 1. Structural elements idealization for the numerical models [9]
Fig. 2. Applied Load and Support Conditions.

878
2.2. Constitutive Relations
Constitutive relationships were desired to connect average stresses to average strains for both
the reinforcement as well as the concrete. These relations may deviate much from the usual
local stress-local strain relations which are specified by the standard materials tests.
2.2.1. Constitutive relation for concrete
To develop a model for the attitude of concrete, it was a difficult activity. Concrete is a quasi-
brittle material and has different reaction in compression and tension. The tensile strength of
concrete is typically 8-15% of the compressive strength [12](Shah, et al. 1995). Fig.3 shows a
typical stress-strain curve for normal weight concrete [13](Bangash 1989).
To cover a descriptive analysis, the stress-strain curve expressed for concrete is linearly elastic
up to about 30 percent of the maximum compressive strength. Above this point, an increase of
stress is shown gradually up to the maximum compressive strength. After it reaches the
maximum compressive strength fcu, the curve begins to decline into a softening region. finally,
crushing failure happens at an ultimate strain εcu .
In tension, the stress-strain curve for concrete is almost linearly elastic up to the maximum
tensile strength. After this point, the concrete cracks and the strength rises down gradually to
zero [13].
Fig. 3. Typical uniaxial compressive and tensile stress-strain curve for concrete (Bangash 1989)
For concrete, ANSYS requires input data for qualifications of materials as follows:
Elastic modulus (Ec).
Ultimate uniaxial compressive strength (f’c).
Ultimate uniaxial tensile strength (modulus of rupture, fr).
Poisson’s ratio (ν).
Shear transfer coefficient (βt).
871
2.2.1.1. Compressive Uniaxial Stress-Strain Relationship for Concrete
The uniaxial stress-strain relationship for concrete in compression was needed to the ANSYS
program. Numerical terminologies (Desayi and Krishnan 1964), Eq. 1 &2, were used along
with Eq.3 (Gere and Timoshenko 1997) to establish the uniaxial compressive stress-strain curve
for concrete [14].
(1)
(2)
(3)
Where:
f = stress at any strain ε , psi
ε = strain at stress f
εo = strain at the ultimate compressive strength fc’
Ec = the initial tangent modulus for concrete in MPa and is defined according to ACI-318 14
[17] by the following equations:
(4)
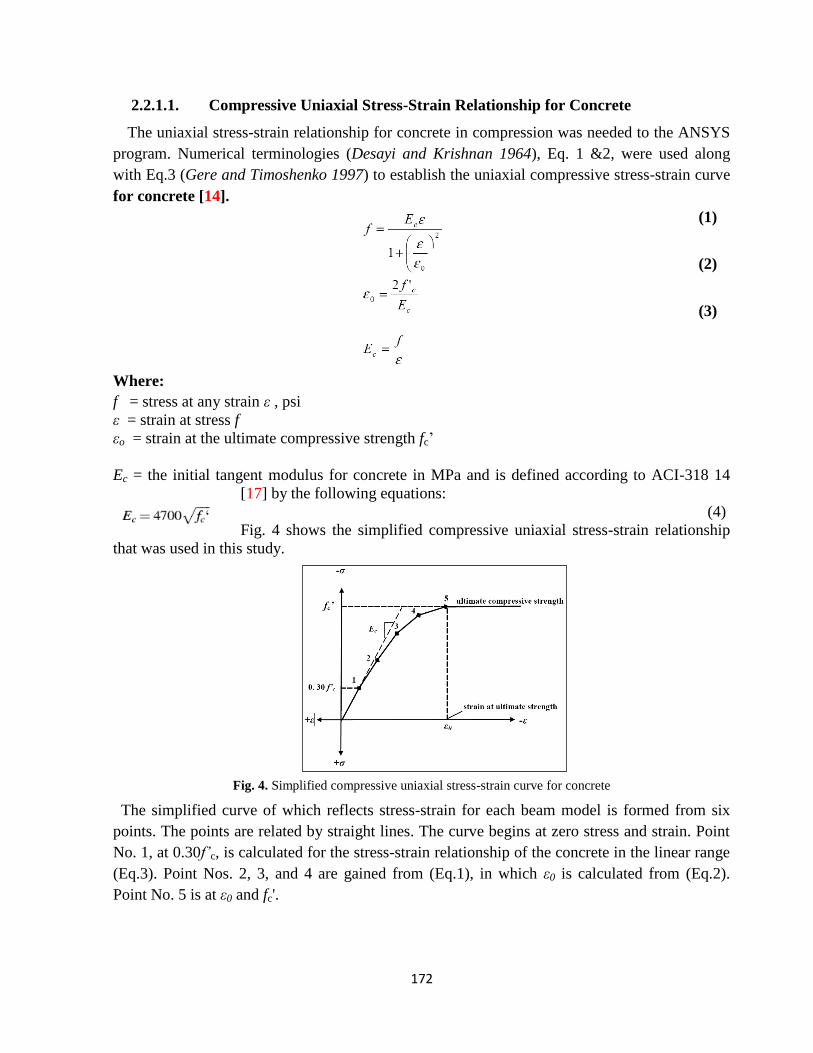
Fig. 4 shows the simplified compressive uniaxial stress-strain relationship
that was used in this study.
Fig. 4. Simplified compressive uniaxial stress-strain curve for concrete
The simplified curve of which reflects stress-strain for each beam model is formed from six
points. The points are related by straight lines. The curve begins at zero stress and strain. Point
No. 1, at 0.30f’c, is calculated for the stress-strain relationship of the concrete in the linear range
(Eq.3). Point Nos. 2, 3, and 4 are gained from (Eq.1), in which ε0 is calculated from (Eq.2).
Point No. 5 is at ε0 and fc'.

871
2.2.1.2. Failure Criteria for Concrete
The model gives an expect failure for concrete materials. The cause for this return to both
cracking and crushing failure modes. The two input strength parameters i.e., ultimate uniaxial
tensile and compressive strengths are important to define a failure surface for the concrete.
Then, the standard of concrete failure DC which is caused by a multi-axial stress state can be
calculated (William and Warnke 1975). A three-dimensional failure surface for concrete is
described in Fig.5. The most considerable nonzero principal stresses found in the x and y
directions, are symbolized by σxp and σyp, respectively. Three failure in the surfaces are
exhibited as projections on the σxp-σyp plane. The mode of failure is a function of the sign of σzp
(principal stress in the z direction).
Fig.5. 3-D failure surface for concrete (ANSYS)
For example, if σxp and σyp are both negative (compressive) and σzp is slightly positive (tensile),
cracking would be revealed in a direction perpendicular to σzp Although, if σzp is zero or slightly
negative, it is supposed that the material will crush.
2.2.2. Constitutive relation for steel
The experimental beams originated steel reinforcement with typical Grade 60 steel reinforcing
bars. In this FEM discussion, steel reinforcement had certain qualities, i.e., elastic modulus and
yield stress, it follows the design material properties shown in the experimental investigation
(Kachlakev and McCurry 2000). The steel for the finite element models was assumed to be an
elastic-typical plastic material and identical in tension and compression. Poisson’s ratio of 0.3
was applied for the steel reinforcement in this study (Gere and Timoshenko 1997). Fig.6 shows
the idealized stress-strain relationship mentioned in this research. Material properties for the
steel reinforcement are stated as follows:
Elastic modulus, Es = 200,000 MPa
Yield stress, fy = 420 MPa (Lab test)

871
Poisson’s ratio, ν = 0.3
Fig.6. Idealized stress-strain curve for reinforcing steel
3. Model Validation studies
Validation studies were discussed on several T-beams. Table 1 introduces a summary for the
geometrical and mechanical properties of the available specimens. FE model offers an
alternative tool that is used in the analysis process, and also for getting different results with the
previously done experiments, Ahmed H. et al. [16]. The details and set-up of tested specimens
are shown in shape. 7& 8 respectively. Also, the finite element simulation models are shown in
Fig. 9
.
Fig. 7. Specimen details and arrangement of reinforcement (All dimensions in mm) [16]

871
Fig. 8. Preparation of Test set-up Specimens [16]
[Table-1] Experimental Program
Specimen
Cross
Sectional
Area (cm2)
Cross
Sectional
Area
Increasing
(%)
Flange Dim. Stirrups in
flange
within
shear zone
(mm)
Longitudinal reinforcement
in Flange Longitudinal
reinforcemen
t in Flange
[%]
tf
(cm)
bf
(cm)
Af
(cm2)
Bottom
Steel
Top
Steel
C0 300 ------ ------ ------ ------ ------
G1-T1-0.3 480 60% 0.3h= 9 30 270 ------ ------ ------
G3-T3-0.5 900 200% 0.5h=15 00 750 Ø8@75 6 Ø 10 +
1Ø10/side
2 Ø 8 + 2
Ø 6 1.046%
G = Reinforcement group, "G1" without reinforcement, "G3" with longitudinal and stirrups in shear zone. Total depth 300
mm, web width (bw) 100 mm. T = Flange thickness, "T1=0.3h" 90 mm, "T2=0.4h" 120mm& "T3=0.5h" 150mm. 0.3&0.5 =
Flange width; "0.3" 300 mm& "0.5" 500mm.

876
[a]- Finite Element Model for C0 (control)
[b]- Finite Element Model for G1-T1-0.3
[c]- Finite Element Model for G3-T3-0.5
Fig. 9. Finite Element Simulation Models for specimens in Ref. [16]

877
3.1. Load deflection curves
The load-deflection curve achieved outlined results such as the ultimate load capacity (Pu) and
the corresponding ultimate deflection (Δu). The area under the load-deflection curve which
represents the toughness (I) is also calculated. Fig. 10 introduces the obtained numerical
results altogether with the experimental results for definite specimens. The figure is reflecting
a good agreement between the experimental results [16] and the desired results at different
levels of response, the load-deflection plot from the finite element analysis matches well the
experimental data for C0, G1-T1-0.3& G3-T3-0.5. In the linear range, the load-deflection
which is derived from the finite element analysis is stiffer than that from the experimental
results by about 10.7, 8.8& 16.1% respectively.
Fig. 10. Predicted and Measured Load-Deflections curves for specimens in Ref. [16]
3.2. Ultimate load comparison
The ultimate load had the test for C0, G1-T1-0.3& G3-T3-0.5 was 106.4, 281.9& 473.8 kN
respectively, while on the other hand the ultimate load obtained from ANSYS analysis was
113.4, 264.1& 516.2kN. So, the difference is about ± 6% and this assures that ANSYS program
is an appropriate method to know the behavior of reinforced concrete T-beams.
3.3. Crack pattern and failure mode
A comparison between the predicted crack patterns against the experimental crack patterns for
tested beams in Ref. [16] is shown in Fig. 11. As cleared in the shape, there is an outstanding
harmonization noticed between the experimental and the numerical crack patterns. For all
specimens suggested, the expected failure mode becomes shear mode. The failure mode is
distinguished by wide shear diagonal cracks which occurs so close to the support column
intersection with loading steel plate at the top. In addition, the figure describes that the
spreading of cracks is changing in relation to the flange dimensions.

878
(a) Experimental crack pattern for C0 (b) Predicted crack pattern for C0
(c)Experimental crack pattern for G1-T1-0.3 (d) Predicted crack pattern for G1-T1-0.3
(e)
Experimental crack pattern for G3T3-0.5 (f) Predicted crack pattern for G3T3-0.5
Fig. 11. Predicted & observed cracking patterns for specimens in Ref. [16]
3.4. Concluding remarks
For all discussed cases, a noticed connection found due to the comparison between the
experimental and the predicted results by finite element (FE) which involved the load-deflection
curves and crack patterns. At the final level, the total average value for [Pu(FE) / Pu(EXP)] ratio
and [Δu(FE) /Δu(EXP)] ratio for all specimens were 1.03 and 0.87 respectively. Hence, ANSYS
computer program which was applied to joint with the offered constitutive models was a good
tool for modeling. This program was mainly designed to study the flange effect on the shear
strength of flanged reinforced concrete beam with or without longitudinal reinforcement in
flange and with different material parameters.

879
Table 2 Parametric Study
Specimen width ratio depth ratio
a/d fc' Longitudinal steel in flange No of
(ρb) (ρt) ρ % Runs
S ------ ------ 2.0 30 ----- 1
S 01:12 3 0.10, 0.3, 0.5& 0.7 0.5, 1.0, and 2.0 30 0.5 12
Total 13
Width ratio (ρb = bf /bw) is the ratio of flange width “bf “and web width “bw“, depth ratio (ρt = t/h) is the ratio of flange thickness “t” and total web
depth “h”. Control specimen S is rectangular section, with total depth 300 mm and width 100 mm.
4. Parametric study
4.1. General
In order to discuss the effect of different parameters on the structural response; groups of
reinforced concrete T-beam, which labeled as (S1, S2... S12) are analyzed. As given in Table 2,
the main parameters studied here include: (1) the concrete strength (fc’), (2) width ratio (ρb), (3)
depth ratio (ρt), (4) ratio of longitudinal steel in flange (ρ), and (5) shear span to depth ratio
(a/d). For each parameter, the predicted response curve is personalized by the load-deflection
curve. The control used specimen in this paper is the rectangular beam S plus the geometry
given in Table 2.
4.2. Evaluation criteria of the parametric studies
The load - deflection curve gave an indication that the effects of the analyzed parameters, which
have been already studied, are using the following measures:
Loads at the yield level (Py) and at the ultimate level (Pu).
Deflection at the yield level (Δy) and at the ultimate level (Δu).
Displacement ductility (μΔ) = (Δu/Δy).
Toughness (I) = the area under the load-deflection curve.
For the above parameters, the outcomes of a specified specimen (S) are regarded as reference
values to calculate the following relative measures:
QuR=Pu / Pur (0)
αuR=Δu / Δur (7)
IuR=I / Iur
(8)

881
Table 3 The output results for the analyzed specimens of parametric studies.
Specimen Pu (kN) Py (kN) Pcr (kN) Δu (mm) Δy (mm) Δcr (mm) QuR αuR I IuR
S 141.61 ------ 33.47 2.81 ------ 0.34 1 1 1089 1.0
S1 559.50 356.40 140.44 2.86 3.03 0.36 3.95 1.02 2907 2.7
S2 516.96 437.77 142.56 2.04 2.51 0.33 3.65 0.73 3846 3.5
S3 692.85 430.30 150.87 2.91 3.18 0.38 4.89 1.04 3673 3.4
S4 714.67 N.Y* 178.62 2.43 N.Y* 0.38 5.05 0.86 4364 4.0
S5 300.22 210.57 72.36 2.53 2.82 0.38 2.12 0.90 1717 1.6
S6 328.58 271.78 72.66 2.67 3.53 0.33 2.32 0.95 2715 2.5
S7 440.19 427.09 73.28 3.92 4.21 0.34 3.11 1.40 3104 2.9
S8 500.99 N.Y 86.67 3.65 N.Y 0.33 3.54 1.30 3119 2.9
S9 156.09 100.52 38.30 2.69 7.35 0.32 1.10 0.96 1022 0.9
S10 198.57 147.53 35.73 3.57 5.05 0.27 1.40 1.27 1446 1.3
S11 270.99 195.03 37.47 4.50 5.37 0.27 1.91 1.60 1674 1.5
S12 354.17 N.Y 45.78 5.13 N.Y 0.29 2.50 1.83 2127 2.0
*: The longitudinal steel in flange Not Yield
Where:
Pu : Ultimate load (kN).
Py : Load at yielding of longitudinal steel reinforcement in flange (kN).
Pcr : Cracked load (kN).
Δu : The deflection at the ultimate (mm).
Δy : The deflection at the yielding (mm).
Δcr : The deflection at the first crack (mm).
I : The toughness (the area under the load-deflection curve).
Where:
4.3. Effect of flange dimensions: width ratio (ρb=bf / bw) and depth ratio (ρt =t/h)
4.3.1. Width ratio (ρb)
A parametric thesis used the 3D FEM is implemented to convey the effect of flange
dimensions (ρb & ρt) in T- beams on shear capacity. In the parametric investigation, the
flange width was changed depending on width ratio ρb to shift from 3 to 9 as shown in table
QuR : Shear capacity ratio at the ultimate load level.
Pur : Shear capacity at the ultimate load level for the control specimen
(S).
αuR : Deflection ratio at the ultimate load level.
Δur : Deflection at the ultimate level for the control specimen.
IuR : Toughness ratio.
Iur : Toughness of the control specimen.

888
2. Fig. 12 describes that predicted width ratio curve for four analytical T-beams. The result
is compared to control beam S, they are all compared to flange width. The adequate
providing main steel reinforcement causes all specimens to fail in shear failure mode. Then
the Load increases step by step until the drop.
From the vivid shape it’s found out that, beam with larger width ratio is showing higher ability
in resisting shear capacity with reference to control beam. The shear capacity is rising up to 150,
209, 231& 262% respectively comparing to S specimen.
Fig. 12. Effect of flange width
4.3.2. Depth ratio (ρt)
The flange depth is changed according to depth ratio ρt that vary from 0.1 to 0.7 as shown in
table 2. Fig. 13 reveals predicted depth ratio curve for four analytical T-beams, which is
compared with control beam S. As shown in fig.13, a beam which has a larger depth ratio is
showing higher ability in resisting shear capacity compared to S. The shear capacity is getting
up gradually to 12.74, 75.13, 175.05, and 262.18% respectively comparing with S.
Fig. 13. Effect of flange depth
4.4. Effect of longitudinal steel in flange
The Three categories of longitudinal steel reinforcement ratio (ρ) in the flange occupy between
0.5, 1 and 2% in the flange concrete area. Fig.14 clarifies the comparison between the given
results of some groups with deferent value of a/h. It indicates that when there is an increasing of
ρ, it leads to a growth in shear capacity by 14:18% for a/h =0.5, 5:9 % for a/h = 1 and 37:40%
for a/h = 2.
0
100
200
300
400
500
600
0 1 2 3 4 5 6 7 8 9 10
Pu (
kN)
ρb
1
3
5
7
9
ρb
0
100
200
300
400
500
600
0 0.1 0.2 0.3 0.4 0.5 0.6 0.7 0.8
Pu (
kN)
ρt
0
0.1
0.3
0.5
0.7
S
ρt

881
600
800
1000
0 0.5 1 1.5 2
Pu (
kN)
ρ
0
0.5
1
2
ρ
200
300
400
500
600
0 0.5 1 1.5 2
Pu (
kN)
ρ
0
0.5
1
2
ρ
600
700
800
0 0.5 1 1.5 2
Pu (
kN)
ρ
0
0.5
1
2
ρ
i. a/h = 0.5
ii. a/h = 1
iii. a/h = 2
Fig. 14. Effect of longitudinal reinforcement in flange
4.5. Effect of shear span to depth ratio.
In this study three groups are explained with different shear span to depth ratio (a/h) “0.5, 1
and 2”. The received results curves of a/h for the specimens with different flange width are
involved in Fig. 14-(a&b). Mostly, an increase of (a/h) reduced the shear capacity of the flanged
concrete beam. The decline of (a/h) ratio led to a good high rise in the shear capacity of flanged
beam about 83:260 %. Fig.14-c represents the effect of (a/h) on the toughness, where the
increasing (a/h)
Fig. 14-a
0
100
200
300
400
500
600
0 0.5 1 1.5 2 2.5
Pu
(kN
)
a/h
0.5
1
2
S1
S5
S9

881
decreases slightly the toughness (I). As shown in the load-deflection curves Fig.14-c, the
toughness is lowered for example specimens S8& S12 when compared with S4 by 28% and
49% respectively.
Fig. 14-b
Fig. 14-c
Fig. 14. Effect of shear span-to-depth ratio
A considerable increase with significant enhancement in the toughness (I) which is calculated
as the area under the load- deflection curve is observed as a result to an increase of fc’. The load
deflection curves in Fig.15 expresses how toughness is so significant to an average of 74%. At
last, for the crack patterns that are drawn in Fig. 16., It is observed that the raise of (fc’) causes
to delay the occurrence of premature shear failure for flanged beam.
Fig. 15. Effect of concrete characteristic strength on Deflection
0
100
200
300
400
500
600
700
800
S1 S2 S3 S4 S5 S6 S7 S8 S9
S10
S11
S12
S4
S8
S12
Specime
𝑃𝑢
[𝑘
𝑁]
a/h=0.5
a/h=1
a/h=2
ρ = 0.5, ρb =3 & fcu = 30 MPa
0
100
200
300
400
500
600
700
800
0 1 2 3 4 5 6 7 8 9 10
Pu
[kN
]
Def. [mm]
S4
S8
S12
a/h = 0.5
a/h=1
a/h=2
0
200
400
600
800
1000
1200
0 1 2 3 4 5 6 7 8 9 10 11 12 13
Pu
(kN
)
Def.(mm)
fc'=30 Mpa
fc'=60 Mpa
0
200
400
600
800
1000
1200
1400
0 1 2 3 4 5 6 7 8 9 10 11 12 13
Pu
(kN
)
Def.(mm)
fc'=60 Mpa
fc'=30 Mpa
0
200
400
600
800
1000
1200
1400
1600
1800
0 1 2 3 4 5 6 7 8 9 10 11 12
Pu
(kN
)
Def.(mm)
fc'=30 Mpa
fc'=60 Mpa

881
Fig. 16. Crack patterns
5. Conclusions
To sum up from the validation and parametric studies of the finite element computer program
ANSYS, the following conclusive points are derived:
[1] A good harmonization in the ending results was achieved by all reached cases of validity,
the detected load-deflection response, the points of cracks, and the failure modes which applied
the nonlinear FE program (ANSYS). At the final level, the total average value for [Pu(FE) /
Pu(EXP)] ratio and [Δu(FE) /Δu(EXP)] ratio for the experimented specimens were 1.03 and 0.87
respectively. This result led us to the use of FE programs.
[2] The most important parameters in this paper were acted by The effectiveness of the ratio of
flange width to web width (bf/bw) and the ratio of flange depth to web depth (t/h) on the shear
strength of a point-loaded reinforced concrete T-beam .To consider the geometric ratios
discussed in this theoretical study, it was suggested that the rise in the ratio (bf/bw) caused a rise
in shear resistance from 12:260%.
[3] The push of longitudinal steel reinforcement ratio (ρ) in the flange from 0.5: 2% of the
flange concrete area has helped to enhancement in shear capacity by 14:18% for a/h =0.5, 5:9 %
for a/h = 1 and 37:40% for a/h = 2.
References
[1] ANSYS-Release Version 19.2.0., “A Finite Element Computer Software and User Manual
for Nonlinear Structural Analysis,” ANSYS Inc. Canonsburg, PA 15317, 2018.
[2] Hesham A. A. and Wael M. M., “Shear behavior of reinforced lightweight concrete T-
beams, beams,” Life Sci J, 16(8), 2019.

881
[3] Balamuralikrishnan R. and Saravanan J., “Finite Element Modelling of RC T - Beams
Reinforced Internally with GFRP Reinforcements,” Civil Engineering Journal, 5(3), 2019.
[4] Hamdy K. S., Mohamed M. H., Mahmoud A. K. and Mahmoud Y. A. Z. “Finite Element
Analysis on the behavior of Strengthened RC Shallow T-Beams with Large Openings at Shear
Zone Using CFRP and BFRP sheets,” IJSEAS, 3(11), 2017.
[5] Hugo C. B., Carlos C. and Manuel A.G., “Smeared Crack Analysis of Reinforced Concrete
T-Beams Strengthened With Gfrp Composites,” Engineering Structures 56, 2013.
[6] Pansuk W and Sato Y., “Shear Mechanism Of Reinforcement Concrete T-Beams With
Stirrups,” Journal of Advanced Concrete Technology, 5(3), 2007.
[7] Pansuk W., Sato Y., Takahashi R. and Ueda T., “Influence of Top Flange to Shear Capacity
of Reinforced Concrete T-Beams,” Concrete Engineering Annual Papers, 26(2), 2004.
[8] Giaccio C., Al-Mahaidi R, and Taplin G., “Experimental study on the effect of flange
geometry on the shear strength of reinforced concrete T-beams subjected to concentrated loads,”
Can. J. Civ. Eng. 29,2002
[9] Kachlakev D., and Miller T., “Finite Element Modeling of Reinforced Concrete Structures
Strengthened with FRP Laminates,” Final Report, Oregon Department of Transportation, Salem,
Oregon, May 2001.
[10] Musmar M. A., Rjoub M. I. and Abdel Hadi M. A., “Nonlinear Finite Element Analysis of
Shallow Reinforced Concrete Beams Using SOLID65 Element,” ARPN Journal of Engineering
and Applied Sciences, 9(2), February 2014.
[11] Tjitradi D., Eliatun E. and Taufik S., “3D ANSYS Numerical Modeling of Reinforced
Concrete Beam Behavior under Different Collapsed Mechanisms,” International Journal of
Mechanics and Applications 2017, 7(1): 14-23
[12] Shah, S. P., Swartz, S. E., and Ouyang, C., “Fracture Mechanics of Concrete,” John Wiley
& Sons, Inc., New York, New York, 1995.
[13] Bangash, M. Y. H., “Concrete and Concrete Structures: Numerical Modeling and
Applications,” Elsevier Science Publishers Ltd., London, England, 1989.
[14] Gere, J. M. and Timoshenko, S. P.,”Mechanics of Materials,” PWS Publishing Company,
Boston, Massachusetts, 1997.
[15] Kachlakev, D.I. and McCurry, D., Jr., “Simulated Full Scale Testing of Reinforced
Concrete Beams Strengthened with FRP Composites: Experimental Results and Design Model
Verification,” Oregon Department of Transportation, Salem, Oregon, June 2000
[16] ElAzab I (2021) Behavior of flanged reinforced concrete beams subjected to shear force.
PhD. thesis, Benha University, Benha Faculty of Engineering, Benha, Egypt, May 2021.
[17] ACI Committee 318.,”Building Code Requirements for Structural Concrete ACI,” vols.
318–14, 2014.