Non-Invasive Methods for Assessing Host- Microbe Interactions in...
35
Non-Invasive Methods for Assessing Host- Microbe Interactions in the Infant Sharon M. Donovan, PhD, RD Department of Food Science & Human Nutrition University of Illinois, Urbana, IL, 61801, USA ILSI FNSP Mid-Year meeting June 28, 2016
Transcript of Non-Invasive Methods for Assessing Host- Microbe Interactions in...

Non-Invasive Methods for Assessing Host-Microbe Interactions in the Infant
Sharon M. Donovan, PhD, RD
Department of Food Science & Human Nutrition
University of Illinois, Urbana, IL, 61801, USA
ILSI FNSP Mid-Year meetingJune 28, 2016

Disclosure Slide
• This research funded in part by Mead Johnson Nutrition and the Dairy Research Institute
• Dr. Donovan has received grant funding, has served as a consultant and as a member of the speakers bureau for the Mead Johnson Pediatric Nutrition Institute
• Dr. Donovan has received grant funding and has served on advisory boards for the Dairy Research Institute

Presentation Outline
• Introduction
–Benefits of breastfeeding
– Factors affecting development of the gut microbiome
• Non-invasive Detection of Intestinal Epithelial Gene Expression
–Experimental Approach
– Impact of infant diet on infant gut epithelial gene expression
• Host-Microbe Interactions in the Neonate
• Future Directions
– STRONG Kids 2 cohort

• The intestinal tract of the newborn undergoes marked structural and functional adaptation in response to feeding
• The response to human milk exceeds that of formula, suggesting that human milk components contribute to this response
• Data from germ free animals show that a microbiota is essential for normal GI development
• Human milk contains bioactive components that influence intestinal development and shape the intestinal microbiota
Breastfeeding and Intestinal Development

Factors Impacting Establishment of the Intestinal Microbiota
Milk oligosaccharides (HMO)
Bacteria in milk Bacteria on maternal skin
Type of Nutrition
Term vs. PretermDelivery
Route of Delivery
Perinatal Antibiotics
Type of formula Prebiotics/Probiotics
Reduced overall diversity and numbers
Host Genetics
Adlerberth & Wold. Establishment of the gut microbiota in Western infants. Acta Paediatr 2009; 98: 229-38.
C-section: less Bifidoand Bacteroides; more E. coli & C. difficile
Preterm: Slower colonization and less diversity
Other
Siblings, pets in the home, smoking, daycare, etc

Presentation Outline
• Introduction
–Benefits of breastfeeding
– Factors affecting development of the gut microbiome
• Non-invasive Detection of Intestinal Epithelial Gene Expression
–Experimental Approach
– Impact of infant diet on infant gut epithelial gene expression
• Host-Microbe Interactions in the Neonate
• Future Directions
– STRONG Kids 2 cohort

Adapted from: Hattori & Taylor. The human intestinal microbiome: A new frontier of human biology. DNA Res 2009; 16:1-12.
Looking into the “Black Box”: Host-Microbe Interactions in the Neonate
What components in the infant diet affect the intestinal gene
expression & microbiota?
Intestinal Microbiome
Host Genome
Bacterial Components &
MetabolitesWhat bacteria and their
genes are involved in the interaction?
Which human genes are involved in the
interaction and respond to bacterial
signals?

• Defining the mechanisms whereby early nutrition regulates gut development has been limited by the lack of non‐invasive approaches suitable for use in the healthy human infant
• We hypothesized that the epithelial cell transcriptome of breastfed infants would differ from formula-fed and would provide insight into the developmental pathways that are modulated by diet
Development of a Non-Invasive Approach
Electron micrograph of sloughed epithelial cell from stool
• Exfoliated intestinal cells may provide a means investigate the impact nutrition on intestinal development and function (Davidson et al., 1995)
• Approximately 1/6 to 1/3 of epithelial cells are shed daily (>1010 cells/day) (Potten et al., 1979)
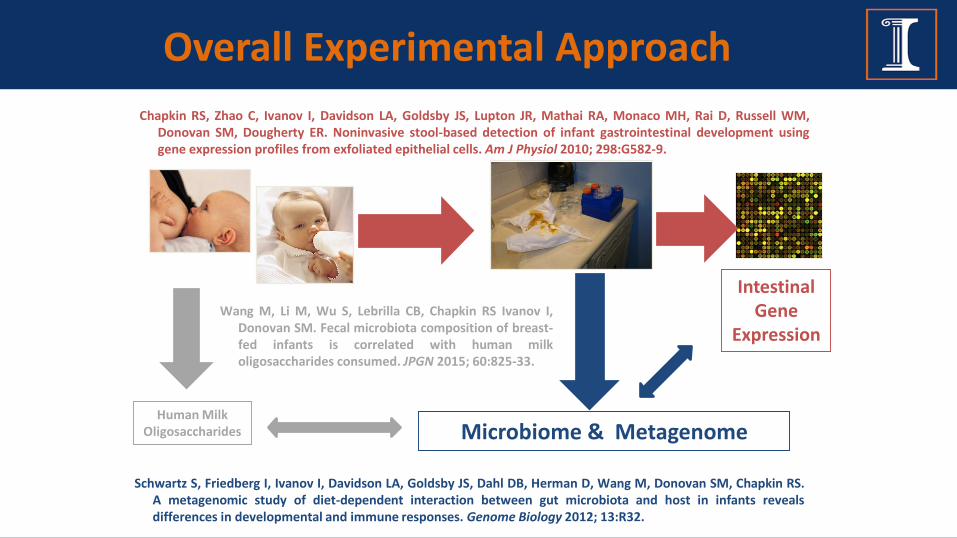
Chapkin RS, Zhao C, Ivanov I, Davidson LA, Goldsby JS, Lupton JR, Mathai RA, Monaco MH, Rai D, Russell WM,Donovan SM, Dougherty ER. Noninvasive stool-based detection of infant gastrointestinal development usinggene expression profiles from exfoliated epithelial cells. Am J Physiol 2010; 298:G582-9.
Microbiome & Metagenome
Schwartz S, Friedberg I, Ivanov I, Davidson LA, Goldsby JS, Dahl DB, Herman D, Wang M, Donovan SM, Chapkin RS.A metagenomic study of diet-dependent interaction between gut microbiota and host in infants revealsdifferences in developmental and immune responses. Genome Biology 2012; 13:R32.
IntestinalGene
Expression
Overall Experimental Approach
Human Milk Oligosaccharides
Wang M, Li M, Wu S, Lebrilla CB, Chapkin RS Ivanov I,Donovan SM. Fecal microbiota composition of breast-fed infants is correlated with human milkoligosaccharides consumed. JPGN 2015; 60:825-33.

Adapted from: Hattori & Taylor. The human intestinal microbiome: A new frontier of human biology. DNA Res 2009; 16:1-12.
Host-Microbe Interactions in the Neonate
What components in the infant diet affect the intestinal gene
expression & microbiota?
Intestinal Microbiome
Host Genome
Bacterial Components &
MetabolitesWhat bacteria and their
genes are involved in the interaction?
Which human genes are involved in the
interaction and respond to bacterial
signals?

Experimental Subjects
• Vaginally-delivered, term infants of second parity mothers that were medically certified as healthy
• Exclusively breast-fed or fed Enfamil Lipil formula (Mead Johnson, Evansville, IN) until 3 months of age
• Exclusion criteria: formula intolerance, combined breast milk/formula, non-study formula, juice or solid foods
Breastfed (BF) Formula-fed (FF)
N = 12 10
Maternal Age (years) 29.5 ± 4.2 29.8 ± 4.9
Infant Birth Weight (kg) 3.78 ± 0.56 3.51 ± 6.2
Infant Birth Length (cm) 52.5 ± 5.5 51.0 ± 2.8
Chapkin RS et al. Noninvasive stool-based detection of infant gastrointestinal development using gene expression profiles from exfoliated epithelial cells. Am J Physiol 2010; 298:G582-9.

Milk Intake & Infant Growth
100
125
150
175
200
225
1 2 3
Breastfed
Formula-fed
Postnatal Age (months)
Intake (ml/kg/d)
Mean ± SDN.S.
• No significant difference in intake or body weight gain
2
4
6
8
10
1 2 3
Postnatal Age (months)
Mean ± SDN.S.
BW (kg)
Breastfed
Formula-fed

Stool Sample Collection
• Sample was collected at 3 months postnatal age by the parent
• Freshly voided stool (~10 g) was placed into a sterile tube containing Trizolreagent (Ambion, Austin, TX)
• Samples were mixed by hand to create a homogenous sample and were immediately frozen at -20 °C– Samples were held at –80 °C until shipped
on dry ice to Texas A&M University
• An additional aliquot was immediately frozen for microbial and SCFA analyses

mRNA Isolation & Microarray
• Poly A+ RNA was isolated to from sloughed epithelial cells to enrich mammalian RNA using established methods (U.S. Patent 6258541)
• mRNA samples analyzed using the Human Whole Genome Expression Bioarray (CodeLink™, Applied Microarray, Tempe, AZ) (Davidson et al., 1995)
colonic mucosa total RNA
fecal poly A+ RNA
bacterial total RNA
bacterial DNA
A B C D E
• Previous studies have shown that mRNA isolated from colonic mucosa or stool hybridizes to biotinylated oligo dT, whereas bacterial RNA or DNA from stool do not (Davidson et al., 1995)

• These 146 genes were subjected to further analyses• Linear Discriminant Analysis (LDA)
• What genes or combinations of genes provide the best “classifiers” of a breast-fed vs. formula-fed infant?
• Gene Networks (Metacore™, GeneGo, St. Joseph, MI) • What gene networks are involved based on known relationships
between genes?
Bioinformatic Analyses
Kim S, et al. General nonlinear framework for the analysis of gene Interaction via multivariate expression arrays. J Biomed Optics 2000; 5: 411–424.
.
57,000 genes on array 4,250 showed signal on all arrays
1,214 genes had p-value <0.05146 genes
Prior Knowledge529 genes

Linear Discriminant Analysis (LDA)
Formula-Fed
Breast-fed
Endothelial PAS Domain Protein 1
Un
cou
plin
g P
rote
in 2
FormulaFed
BreastFed
Syn
apto
ph
ysin
2-Gene Combination 3-Gene Combination

Best Genes from LDA For Classifying BF vs FF
Gene Name
FunctionFold Change
(BF/FF)
EPAS1 Transcription Factor (TF); cellular response to hypoxia 3.3
NR5A2TF, encodes liver receptor homolog-1 (LRH-1); development
2.8
NR3C1 Encodes glucocorticoid receptor 5.5
PCDH7 Encodes protocadherin-7; membrane protein 3.9
ITGB2 Encodes integrin beta-2 (CD18); ICAM-1 receptor 2.5
FGF5Encodes fibroblast growth factor 5; mitogenesis & cell survival
2.0
TJP1 Encodes ZO-1; intercellular tight junctions 2.2
MYB TF, transcriptional transactivation; proto-ongogene 2.8
EPIM Syntaxin 2/Epimorphin; epithelial cell morphogenesis 2.5
BAD BCL2-associated agonist of apoptosis 4.0

• Signal transduction• WNT• NOTCH• TGF-ß
•Cytoskeleton remodeling• Cell migration
• Cell adhesion• Barrier function
• Immune response• Inflammation• Histamine
Gene Networks – BF vs FF Infants
From: Metacore™, Thomson Reuters, St. Joseph, MI

Summary of Intestinal Gene Expression
• The relationships between diet and host gene expression can be assessed non-invasively in the human infant• 2- and 3-gene combinations were shown to distinguish BF from
FF infants
• Provides insight into potential mechanisms whereby human milk regulates intestinal development and represent potential targets for manipulation of infant formula composition
• In preterm infants, this approach has shown developmental differences in gene expression compared to term infants (Knight et al. 2014)
- Lower expression of genes in LCPUFA synthesis - Lower proliferation/cell cycle gene expression- Greater inflammatory gene expression
Knight JM, Davidson LA, Herman D, Martin CR, Goldsby JS, Ivanov IV, Donovan SM, Chapkin RS. Non-invasive analysis of intestinal development in preterm and full term infants using RNA-SEQ: A pilot study. Nature Scientific Reports 2014; 4: 5453.

Presentation Outline
• Introduction
–Benefits of breastfeeding
– Factors affecting development of the gut microbiome
• Non-invasive Detection of Intestinal Epithelial Gene Expression
–Experimental Approach
– Impact of infant diet on infant gut epithelial gene expression
• Host-Microbe Interactions in the Neonate
• Future Directions
– STRONG Kids 2 cohort

Adapted from: Hattori & Taylor. The human intestinal microbiome: A new frontier of human biology. DNA Res 2009; 16:1-12.
Host-Microbe Interactions in the Neonate
What components in the infant diet affect the intestinal gene
expression & microbiota?
Intestinal Microbiome
Host Genome
Bacterial Components &
MetabolitesWhat bacteria and their
genes are involved in the interaction?
Which human genes are involved in the
interaction and respond to bacterial
signals?

Fecal Microbiota of BF and FF Infants
• Pyrosequencing of V1-V3 region of 16s rRNA gene amplicons
• 321,822 sequences (10,743 per sample)
• Distance based redundancy analysis (dbRDA) showed that the overall structure of the microbiome differed between BF and FF infants.
-1 0 1 2
-1.5
-1.0
-0.5
0.0
0.5
1.0
1.5
2.0
CAP1M
DS
1
1
2
3
4
5
6
7
8
910
11
12
13
14
15
16
17
18
19
2021
22
P = 0.005
BF
FF
Wang M, Li M, Wu S, Lebrilla CB, Chapkin RS Ivanov I, Donovan SM. Fecal microbiota composition of breast-fed infants is correlated with human milk oligosaccharides consumed. JPGN 2015; 60:825-33.
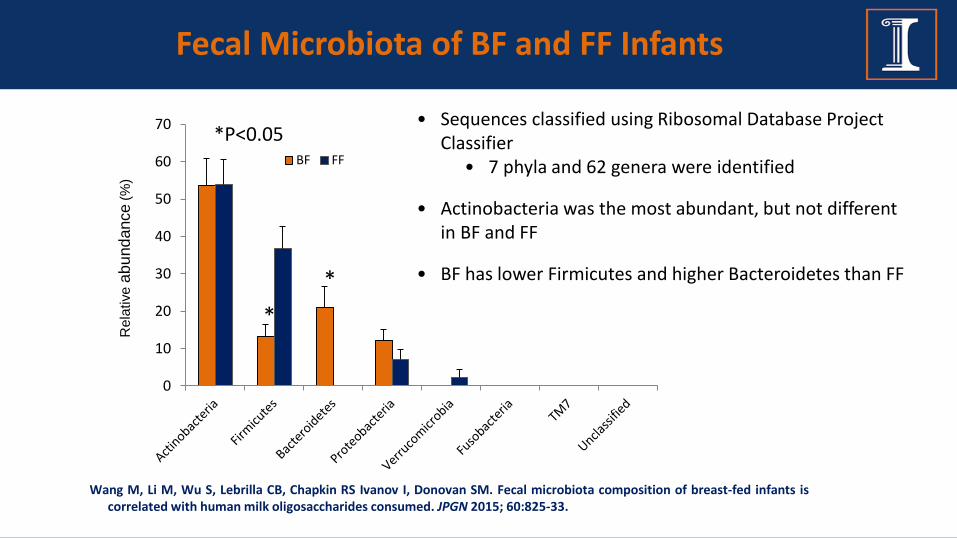
Fecal Microbiota of BF and FF Infants
0
10
20
30
40
50
60
70
BF FF
*P<0.05R
ela
tive
ab
und
ance
(%)
*
*
• Sequences classified using Ribosomal Database Project Classifier
• 7 phyla and 62 genera were identified
• Actinobacteria was the most abundant, but not different in BF and FF
• BF has lower Firmicutes and higher Bacteroidetes than FF
Wang M, Li M, Wu S, Lebrilla CB, Chapkin RS Ivanov I, Donovan SM. Fecal microbiota composition of breast-fed infants iscorrelated with human milk oligosaccharides consumed. JPGN 2015; 60:825-33.

• 5 distinct signatures: FF, BF (3 infants), BF1, BF2, BF3• Can we use differences in microbiota of BF and FF infants to
predict differences in host gene expression?
Variation in Microbiome Composition
0
10
20
30
40
50
60
70
80
90
FF
BF
BF unique
% o
f To
tal C
lass
ifie
d
BF3
BF2
BF1
.
X(1)
.
X(2)

• SEED level 1 functional categorization via MG-RAST revealed that:– A larger proportion of genes involved in
CHO metabolism in FF
– A larger proportion of genes were involved in AA and protein metabolism in BF
– virulence characteristics differed between FF and BF babies
Bacterial Metagenomics (DNA Sequencing)
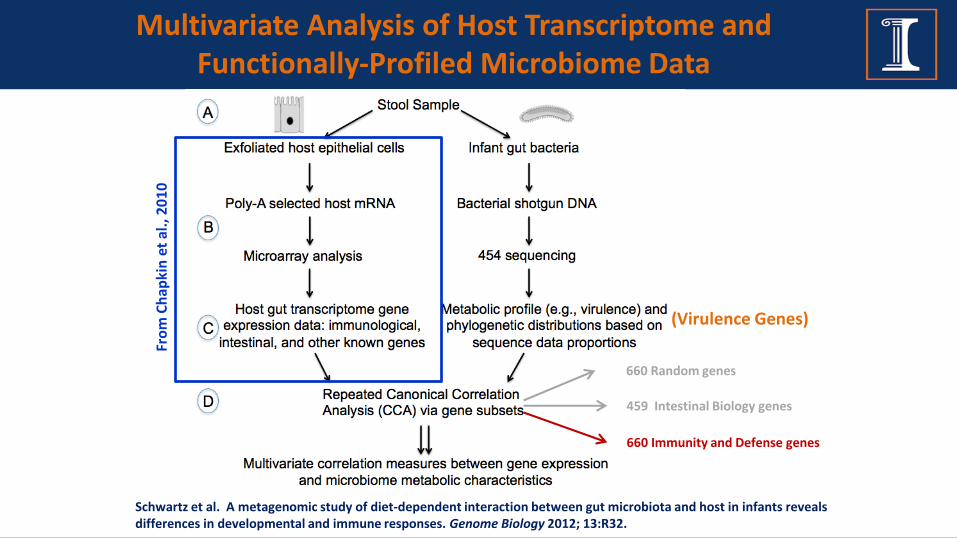
Schwartz et al. A metagenomic study of diet-dependent interaction between gut microbiota and host in infants reveals differences in developmental and immune responses. Genome Biology 2012; 13:R32.
Multivariate Analysis of Host Transcriptome and Functionally-Profiled Microbiome Data
660 Immunity and Defense genes
660 Random genes
459 Intestinal Biology genes
Fro
m C
hap
kin
et a
l., 2
01
0
(Virulence Genes)

11 Host Immunity Genes Most Related to Microbial Virulence Genes
TACR1neurokinin (NK) 1
receptor; member of the tachykinin family of G-protein-coupled
receptors
VAV2Guanine-nucleotide
exchange factor
ALOX5Lipoxygenase gene;
synthesis of leukotrienes from arachidonic acid
NDSTGlcNAc N-
deacetylase/N-sulfotransferase-1;
heparin sulfate synthesis
RELMember of Rel/ NFKB
family
BPILIBactericidal/perme-
ability-increasing protein-like 1; LPS
binding protein
AOC3Mediates the binding
of lymphocytes to vascular endothelial cells in an L-selectin-independent fashion
KLRF1NK Cell Receptor;
stimulates natural kill cell cytotoxicity
DUOX2NADPH oxidase;lactoperoxidase-
mediated antimicrobial defense
IL1ACytokine secreted by
activated macrophages, IL-1
stimulates thymocyteproliferation
SP2transcription factor
required for expression of cell
cycle- and developmentally-regulated genes
Up-regulated in BF vs FF
Down-regulated in BF vs FF

• A multivariate structure relating the host immune system and microbiome virulence characteristics exists in the infant gut
• The virulence properties of the microbiota were the most responsive characteristics with respect to BF vs. FF, but probably do not reflect an infection.
• BF babies had a larger complement of gram-negative bacteria than FF• Gram-negative bacteria have genes that, although classified as 'virulent,' can activate the
immune system, but not cause an infection in the process
• The relative abundance of CHO and protein metabolizing genes differed in the microbiota of FF and BF infants.
• These data suggest linkages between early nutrition and the functional characteristics of the neonatal microbiota.
Summary of Host-Microbe Gene Expression
Presentation Outline
• Introduction
–Benefits of breastfeeding
– Factors affecting development of the gut microbiome
• Non-invasive Detection of Intestinal Epithelial Gene Expression
–Experimental Approach
– Impact of infant diet on infant gut epithelial gene expression
• Host-Microbe Interactions in the Neonate
• Future Directions
– STRONG Kids 2 cohort

Synergistic Theory and Research on Nutrition and Growth (STRONG) kids
STRONG Kids 2 (SKP2): 2012-2019• A Cells-to-Society Approach to Nutrition in Early Childhood• Supported by the Dairy Research Institute (Rosemont, IL), $1.6M• Birth to 5 years of age (n=440)• Recruited from hospitals in third trimester of pregnancy
• Systematic reviews reveal that rapid growth in early infancy is a risk factor for childhood obesity1.
• Exclusive breastfeeding (BF) is modestly protective against excessive infant gain and later obesity, whereas exclusive formula feeding (FF) increases obesity risk2,3.
• In the U.S., 30-40% of infants are fed both breastmilk and infant formula (combined feeding, CF)4, however, few studies have examined how CF affects the risk of childhood obesity5.
1Baird et al. BMJ 2005; 2Oddy et al. Ann Nutr Metab 2014; 3Imai et al. Nutrients 2014; 4http://www.cdc.gov/media/releases/2014/a0731-breatfeeding.html ; 5Rossiter et al. Matern Child Health J 2015

4 yrs
SKP 2 Data Collection
SKP Parent Survey:• Nutrition Practices & Intake• Day Care Practices• Family Mealtimes• Family Physical Activity• Media Exposure• Sleep patterns• Attachment
Biometric Measures (Mom and Child):• Height and weight (all time points)• Stool sample (child all time points; mom at 6 weeks)• Saliva sample (6 weeks)• Human milk sample and milk intake (6 weeks and 6 months)
1 week
6 weeks
3 months
9 months
18 months12 months
3 yrs2 yrs
5 yrs4 yrs

Feeding Mode in the First Year
Cow-milk
(13%)
% o
f In
fan
ts
0
10
20
30
40
50
60
70
80
90
100
1 week 6 weeks 3 months 6 months 9 months 12months
Exclusively BreastfedCombined- fed
Exclusively Formula-fed
Postnatal Age
(N=295)

Percent of Infants at Risk of Overweight or Overweight (BMI >85th) by Feeding Mode
0
10
20
30
40
50
60
BF CF FF
Perc
en
t o
f In
fan
ts
6 weeks 3 months 6 months 9 months 12 months
Chi-Square difference by diet, p< 0.01
Dietary Treatment

• Robert Chapkin PhD , Texas A&M University
• Infant Study:• Rose Ann Mathai, PhD, RD • Marcia Monaco PhD
• Microbiome Analyses and Bioinformatics:• Mei Wang PhD and Min Li PhD• Scott Schwartz PhD, Ivan Ivanov PhD and Iddo Friedberg PhD
• HMO Analyses:• Shuai Wu and Carlito Lebrilla, PhD (University of California, Davis)
• NIH grants: R01 HD061929, R01 CA129444, R01 DK71707, P30 ES09106• Mead Johnson Nutrition• Dairy Research Institute
Acknowledgments
Questions?
Breastfeeding:
A Balance of Art and Science