Non-invasive assessment ofaortic stenosis by Doppler...
9
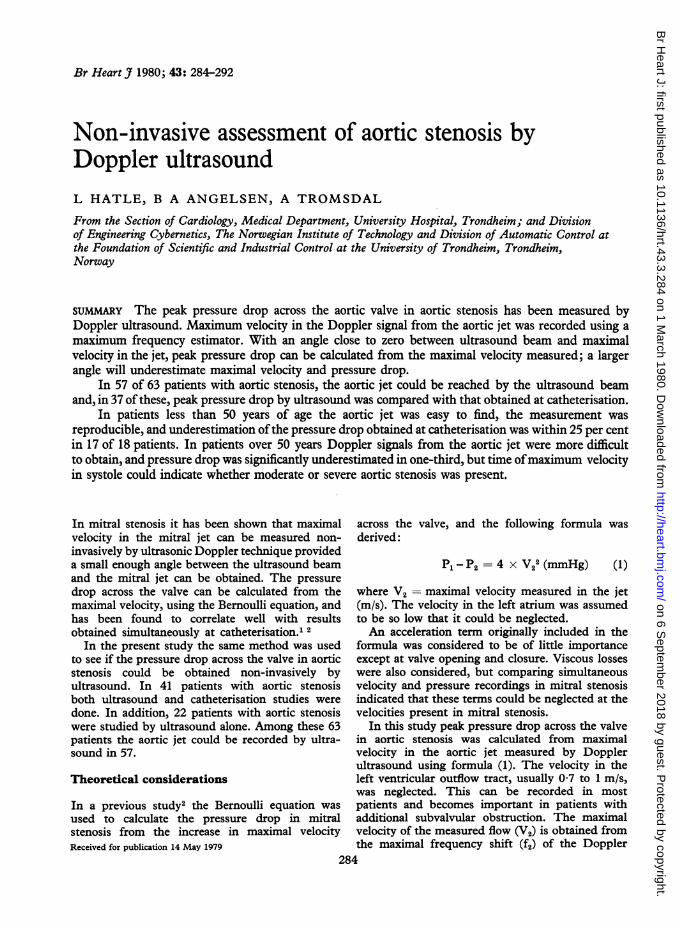
Br Heart3' 1980; 43: 284-292 Non-invasive assessment of aortic stenosis by Doppler ultrasound L HATLE, B A ANGELSEN, A TROMSDAL From the Section of Cardiology, Medical Department, University Hospital, Trondheim; and Division of Engineering Cybernetics, The Norwegian Institute of Technology and Division of Automatic Control at the Foundation of Scientific and Industrial Control at the University of Trondheim, Trondheim, Norway SUMMARY The peak pressure drop across the aortic valve in aortic stenosis has been measured by Doppler ultrasound. Maximum velocity in the Doppler signal from the aortic jet was recorded using a maximum frequency estimator. With an angle close to zero between ultrasound beam and maximal velocity in the jet, peak pressure drop can be calculated from the maximal velocity measured; a larger angle will underestimate maximal velocity and pressure drop. In 57 of 63 patients with aortic stenosis, the aortic jet could be reached by the ultrasound beam and, in 37 of these, peak pressure drop by ultrasound was compared with that obtained at catheterisation. In patients less than 50 years of age the aortic jet was easy to find, the measurement was reproducible, and underestimation of the pressure drop obtained at catheterisation was within 25 per cent in 17 of 18 patients. In patients over 50 years Doppler signals from the aortic jet were more difficult to obtain, and pressure drop was significantly underestimated in one-third, but time of maximum velocity in systole could indicate whether moderate or severe aortic stenosis was present. In mitral stenosis it has been shown that maximal velocity in the mitral jet can be measured non- invasively by ultrasonic Doppler technique provided a small enough angle between the ultrasound beam and the mitral jet can be obtained. The pressure drop across the valve can be calculated from the maximal velocity, using the Bernoulli equation, and has been found to correlate well with results obtained simultaneously at catheterisation.1 2 In the present study the same method was used to see if the pressure drop across the valve in aortic stenosis could be obtained non-invasively by ultrasound. In 41 patients with aortic stenosis both ultrasound and catheterisation studies were done. In addition, 22 patients with aortic stenosis were studied by ultrasound alone. Among these 63 patients the aortic jet could be recorded by ultra- sound in 57. Theoretical considerations In a previous study2 the Bernoulli equation was used to calculate the pressure drop in mitral stenosis from the increase in maximal velocity Received for publication 14 May 1979 across the valve, and the following formula was derived: Pl-P2 = 4 x V22 (mmHg) (1) where V2 = maximal velocity measured in the jet (m/s). The velocity in the left atrium was assumed to be so low that it could be neglected. An acceleration term originally included in the formula was considered to be of little importance except at valve opening and closure. Viscous losses were also considered, but comparing simultaneous velocity and pressure recordings in mitral stenosis indicated that these terms could be neglected at the velocities present in mitral stenosis. In this study peak pressure drop across the valve in aortic stenosis was calculated from maximal velocity in the aortic jet measured by Doppler ultrasound using formula (1). The velocity in the left ventricular outflow tract, usually 0-7 to 1 m/s, was neglected. This can be recorded in most patients and becomes important in patients with additional subvalvular obstruction. The maximal velocity of the measured flow (V2) is obtained from the maximal frequency shift (f2) of the Doppler 284 on 6 September 2018 by guest. Protected by copyright. http://heart.bmj.com/ Br Heart J: first published as 10.1136/hrt.43.3.284 on 1 March 1980. Downloaded from
-
Upload
hoangxuyen -
Category
Documents
-
view
223 -
download
0
Transcript of Non-invasive assessment ofaortic stenosis by Doppler...
Br Heart3' 1980; 43: 284-292
Non-invasive assessment of aortic stenosis byDoppler ultrasoundL HATLE, B A ANGELSEN, A TROMSDAL
From the Section of Cardiology, Medical Department, University Hospital, Trondheim; and Divisionof Engineering Cybernetics, The Norwegian Institute of Technology and Division of Automatic Control atthe Foundation of Scientific and Industrial Control at the University of Trondheim, Trondheim,Norway
SUMMARY The peak pressure drop across the aortic valve in aortic stenosis has been measured byDoppler ultrasound. Maximum velocity in the Doppler signal from the aortic jet was recorded using a
maximum frequency estimator. With an angle close to zero between ultrasound beam and maximalvelocity in the jet, peak pressure drop can be calculated from the maximal velocity measured; a largerangle will underestimate maximal velocity and pressure drop.
In 57 of 63 patients with aortic stenosis, the aortic jet could be reached by the ultrasound beamand, in 37 ofthese, peak pressure drop by ultrasound was compared with that obtained at catheterisation.
In patients less than 50 years of age the aortic jet was easy to find, the measurement was
reproducible, and underestimation ofthe pressure drop obtained at catheterisation was within 25 per centin 17 of 18 patients. In patients over 50 years Doppler signals from the aortic jet were more difficultto obtain, and pressure drop was significantly underestimated in one-third, but time ofmaximum velocityin systole could indicate whether moderate or severe aortic stenosis was present.
In mitral stenosis it has been shown that maximalvelocity in the mitral jet can be measured non-invasively by ultrasonic Doppler technique provideda small enough angle between the ultrasound beamand the mitral jet can be obtained. The pressuredrop across the valve can be calculated from themaximal velocity, using the Bernoulli equation, andhas been found to correlate well with resultsobtained simultaneously at catheterisation.1 2
In the present study the same method was usedto see if the pressure drop across the valve in aorticstenosis could be obtained non-invasively byultrasound. In 41 patients with aortic stenosisboth ultrasound and catheterisation studies weredone. In addition, 22 patients with aortic stenosiswere studied by ultrasound alone. Among these 63patients the aortic jet could be recorded by ultra-sound in 57.
Theoretical considerations
In a previous study2 the Bernoulli equation wasused to calculate the pressure drop in mitralstenosis from the increase in maximal velocityReceived for publication 14 May 1979
across the valve, and the following formula wasderived:
Pl-P2 = 4 x V22 (mmHg) (1)
where V2 = maximal velocity measured in the jet(m/s). The velocity in the left atrium was assumedto be so low that it could be neglected.An acceleration term originally included in the
formula was considered to be of little importanceexcept at valve opening and closure. Viscous losseswere also considered, but comparing simultaneousvelocity and pressure recordings in mitral stenosisindicated that these terms could be neglected at thevelocities present in mitral stenosis.
In this study peak pressure drop across the valvein aortic stenosis was calculated from maximalvelocity in the aortic jet measured by Dopplerultrasound using formula (1). The velocity in theleft ventricular outflow tract, usually 0-7 to 1 m/s,was neglected. This can be recorded in mostpatients and becomes important in patients withadditional subvalvular obstruction. The maximalvelocity of the measured flow (V2) is obtained fromthe maximal frequency shift (f2) of the Doppler
284
on 6 Septem
ber 2018 by guest. Protected by copyright.
http://heart.bmj.com
/B
r Heart J: first published as 10.1136/hrt.43.3.284 on 1 M
arch 1980. Dow
nloaded from
Non-invasive assessment of aortic stenosis by Doppler ultrasound
signal according to the following equation:
C f2V2 =- .
2fo cos 0
where fo is the transmitted ultrasonic frequency,C the velocity of sound in blood, and 0 the anglebetween ultrasound beam and the direction ofmaximal velocity.To obtain the maximal velocity present in the
measured area the angle between ultrasound beamand blood flow must be known or be so small thatthe cosine of the angle can be approximated to 1and thus neglected in the equation. With an angleof 200 between ultrasound beam and maximalvelocity the velocity will be underestimated by6 per cent. At a maximal velocity of 2 m/s this willunderestimate the pressure drop with 5 per centand at 4 m/s the underestimation of the pressuredrop will be 11 per cent.The direction of the aortic jet may vary consider-
ably from patient to patient depending on theposition of the heart and the aorta and on theaortic valve deformity. With the jet directedmainly upwards the smallest angle would mostlikely be found from the suprasternal notch orsubxiphoid position. With a jet direction more tothe right and anteriorly, measurements from theright sternal border-if possible-should give thesmallest angle-while with a more posteriordirection, aiming from the left sternal border orapex should give the best possibilities. The possibleerrors with this method therefore include:
Failure to reach the aortic jet.Failure to obtain a small enough angle between
ultrasound beam and maximal velocity.Failure to maintain an adequate position through-
out systole because of movements of the heart andthe aorta. Errors introduced by neglecting viscouslosses, shown to be unimportant at the velocitiespresent in mitral stenosis.
In this study the ultrasonic and pressure measure-ments were not done simultaneously except in onecase-and changes in cardiac output and peripheralresistance may have resulted in a different peakpressure drop on the two occasions.
Patients and methods
Mean age of the 63 patients was 46 (3 to 89) years.The age of the 41 patients with catheterisationstudies varied from 10 to 71 years. Fifteen wereless than 20 years, 14 were between 20 and 49 years,27 patients were between 50 and 69 years, and sevenwere 70 years or more. Among patients below 20
years 11 were male and four were female, andamong those above 20 years 28 were men and 20women. In 33 patients aortic stenosis was the mainvalve lesion, 16 had moderate (11) to severe (five)aortic regurgitation, 10 had mitral stenosis, and fivemoderate to severe mitral regurgitation which, inone, was caused by a ruptured papillary muscle. Inone of the 63 patients aortic regurgitation wascombined with mitral stenosis.The pressure drop across the aortic valve was
measured by percutaneous retrograde catheterisa-tion via the femoral artery in 35 patients, and bytransseptal catheterisation in six. Pressures wererecorded with an Elema transducer and an ElemaMingograph. The ultrasonic recording was doneone day before catheterisation in most patients,and a few months later in two of the children; theblood pressure, however, was similar on the twooccasions.The apparatus used for the ultrasonic measure-
ments is described in detail elsewhere.3 It canbe used in either a pulsed mode when velocities upto 1-75 m/s can be measured, or in a continuousmode when velocities up to 6 m/s can be measured,but with loss of range resolution. To measure thevelocities present in aortic stenosis the continuousmode must be used, while the pulsed mode is usedto localise the increased velocities to the ascendingaorta.
Several positions were tried to record aortic flow,the suprasternal notch, right and left sternal border,apex, and occasionally if these positions failed, thesubxiphoid position. When aortic flow was obtainedthe transducer was moved/angulated to record flowjust distal to the aortic valve (in the proximal partof the ascending aorta). In this position a harshsound of high intensity caused by turbulence canbe heard in aortic stenosis. This sound is clearlydifferent from the sound of normal aortic flow.Exploring this area a more high-pitched sound maybe recorded when the aortic jet is found. Thehighest velocity will be recorded in the area withthe highest pitched sound. Mean and maximalvelocity were then recorded together with theelectrocardiogram and phonocardiogram on anElema Mingograph with paper speed of 25, 50, and100 mm/s. Peak pressure drop was calculated fromthe maximal velocity using formula (1).The time from the start of flow to the peak of
maximal velocity was also noted and divided bythe duration of flow obtained from the flow curverecorded at 100 mm/s. Only beats where thesepoints were clearly shown were used, and the meanof 5 to 10 beats was analysed. The resulting index( > 0 50 if peak velocity occurred after mid-systole)was compared with the pressure drop. This index
285
on 6 Septem
ber 2018 by guest. Protected by copyright.
http://heart.bmj.com
/B
r Heart J: first published as 10.1136/hrt.43.3.284 on 1 M
arch 1980. Dow
nloaded from
Hatle, Angelsen, Tromsdal
was also measured in patients without heart diseaseand in patients with other valve lesions.
In some patients the ultrasonic examination wasrepeated on one or more occasions for up to twoyears.The patients who were not investigated by
methods other than ultrasonic examination wereeither small children or older patients wheresurgery was not indicated or was refused.
Results
Doppler signals from the aortic jet were easy toobtain in children and young patients, but at agesabove 50 the success rate was much lower (Table 1).In six patients (aged 58 or more) aortic jet velocitiescould not be recorded, only a harsh sound indicatingturbulence and the presence of aortic stenosis.Four of these had significant aortic stenosis and
Table 1 Doppler signals from the aortic jet obtainednon-invasively
Good Not satisfactory Not obtained
< 20 years 15 - -20-49 years 14 - -
50-69 years 12 9 6>70 years 2 5 -
43 14 6
two had moderate stenosis. Doppler signals fromthe jet were considered inadequate when only weaksignals were obtained, or perhaps on only occasionalbeats or during part of systole. These 14 patientswere over 58 years; 12 of them had significant
A
-t- z '% E p_@ir<^\__ _.r\_~~~~~~~~~~~~~~~~~~~~~~~~~~~~~~~~~~~~~~~~~~~~~~
mI-'\~~~~~~~~~irXs ~ ~~~~~s
t >A
4- A ^ i3-
mnmHg50 -
0 .
0-.
aortic stenosis and two had moderate stenosis.The position where the highest velocities were
recorded in the 57 patients is given in Table 2, asis the success rate of measuring from the rightsternal border. Attempts at recording from the
Table 2 Positions for best ultrasonic recording of aorticjet velocity
No. of patients
< 50 years > 50 years
Suprasternal notch 16 13Right sternal border 10 9Left sternal border 1 2Apex 1 4Subxiphoid position 1
29 28
Aortic jet reached from rightsternal border 70% 33%
right sternal border were not done in all the patientsin the beginning of the study and only in the latterpart were the patients turned over to the right sidewhich usually made the recording of aortic jetvelocities from this position easier. This mayindicate that satisfactory recordings from the rightsternal border can be obtained more often than isshown in Table 2.
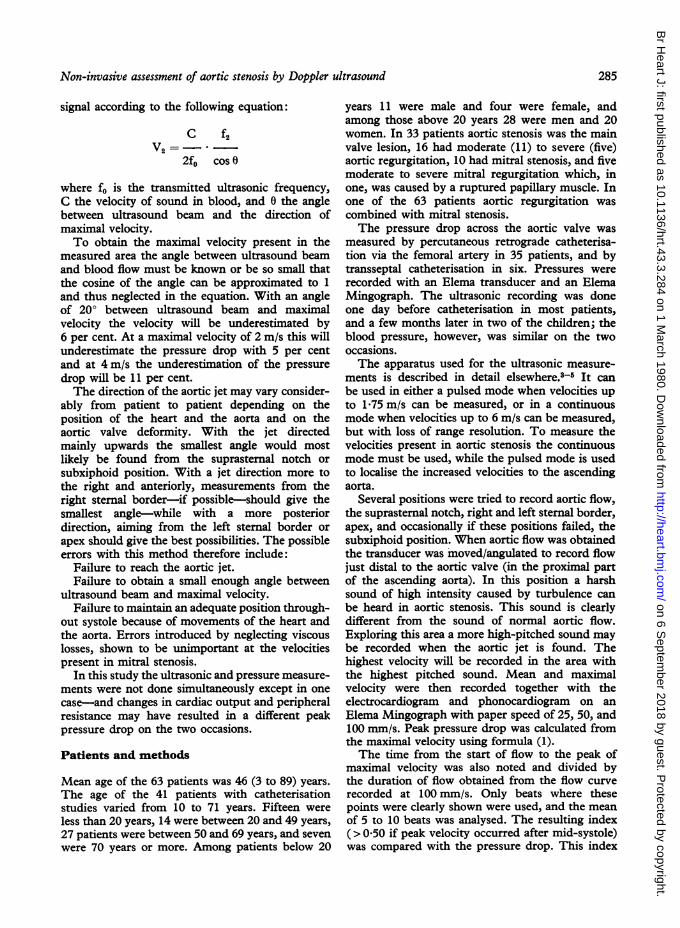
Fig. 1 shows the maximal velocity curve recordedfrom the first right intercostal space in one of thepatients. Maximal velocity recorded was 4-25 m/swith a calculated peak pressure drop of 69 mmHg.At catheterisation a peak pressure drop of 68 mmHgwas found.
mmHg 0'2s200 -
100-
..
I; \
0*15
ILi1 \
ii /
Fig. 1 (A) Ultrasonic recording of aortic flow from the first right intercostal space, mean and maximal (below)velocity; (B) pressure recording from the left ventricle and the aorta; (C) pressure drop across the aortic valve duringsystole for two beats. by pressure recording, ------- by ultrasonic recording.
286
.. 1:.. .: ". ...
on 6 Septem
ber 2018 by guest. Protected by copyright.
http://heart.bmj.com
/B
r Heart J: first published as 10.1136/hrt.43.3.284 on 1 M
arch 1980. Dow
nloaded from
Non-invasive assessment of aortic stenosis by Doppler ultrasound
A B
0 4s 0-2s
n/s i 1 A,.ammHg
J + ~~~~~~~C
o U \,,_~-. W mm |0 ...K
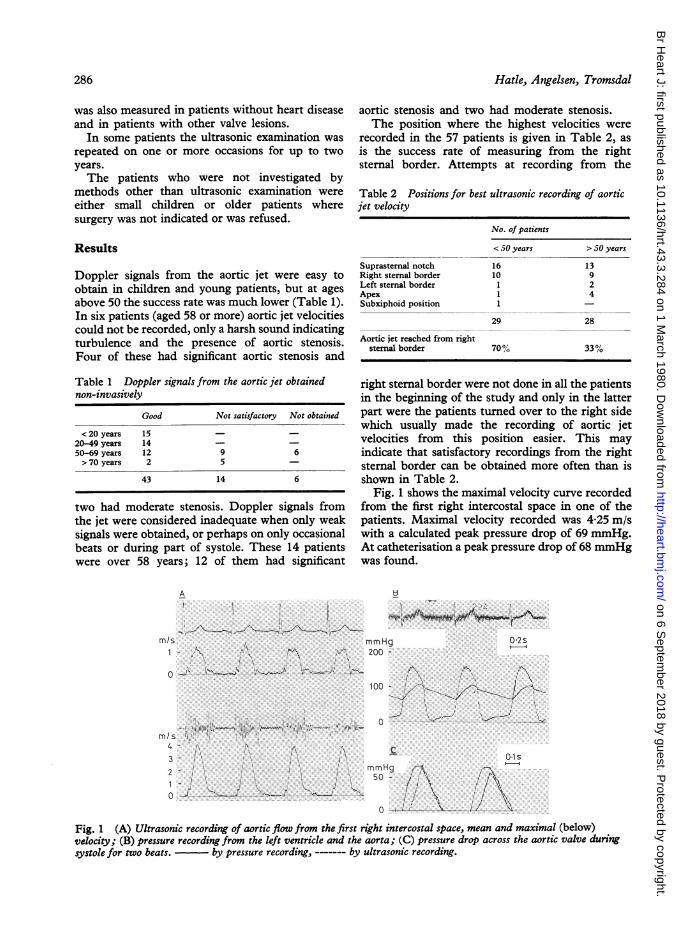
Fig. 2 (A) Mean (above) and maximal velocity ofaortic flow measured by ultrasound from first rightintercostal space; (B) left ventricular and aortic pressure;(C) Pressure drop across the aortic valve for two beats.
,pressure recording;----, ultrasonic recording.
Fig. 2 shows velocity and pressure curves fromanother patient. Peak pressure drop at catheterisa-tion was 42 mmHg, and maximal velocity recordedwas 3-04 m/s with a calculated pressure drop of37 mmHg. Comparing the pressure drop duringsystole for the two methods (C), systole was slightlylonger during ultrasonic examination when theheart rate was 80 than at catheterisation when theheart rate was 112.The delay seen in increase in velocity in the
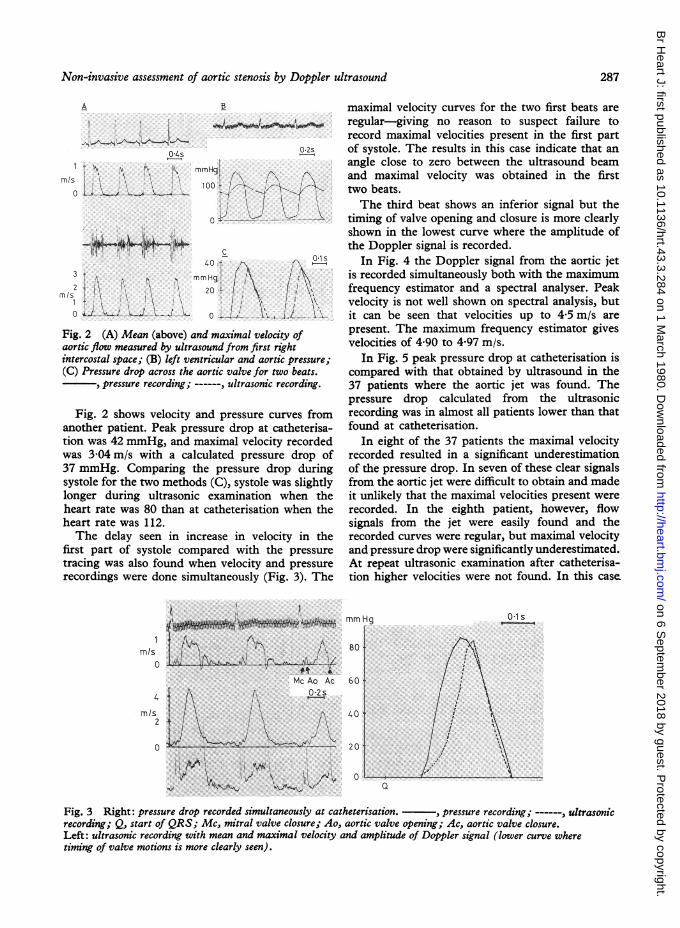
first part of systole compared with the pressuretracing was also found when velocity and pressurerecordings were done simultaneously (Fig. 3). The
rn/s0
4
rnls2
0
* .~~~~*4.Mc Ao Ac0.2
maximal velocity curves for the two first beats areregular-giving no reason to suspect failure torecord maximal velocities present in the first partof systole. The results in this case indicate that anangle close to zero between the ultrasound beamand maximal velocity was obtained in the firsttwo beats.The third beat shows an inferior signal but the
timing of valve opening and closure is more clearlyshown in the lowest curve where the amplitude ofthe Doppler signal is recorded.
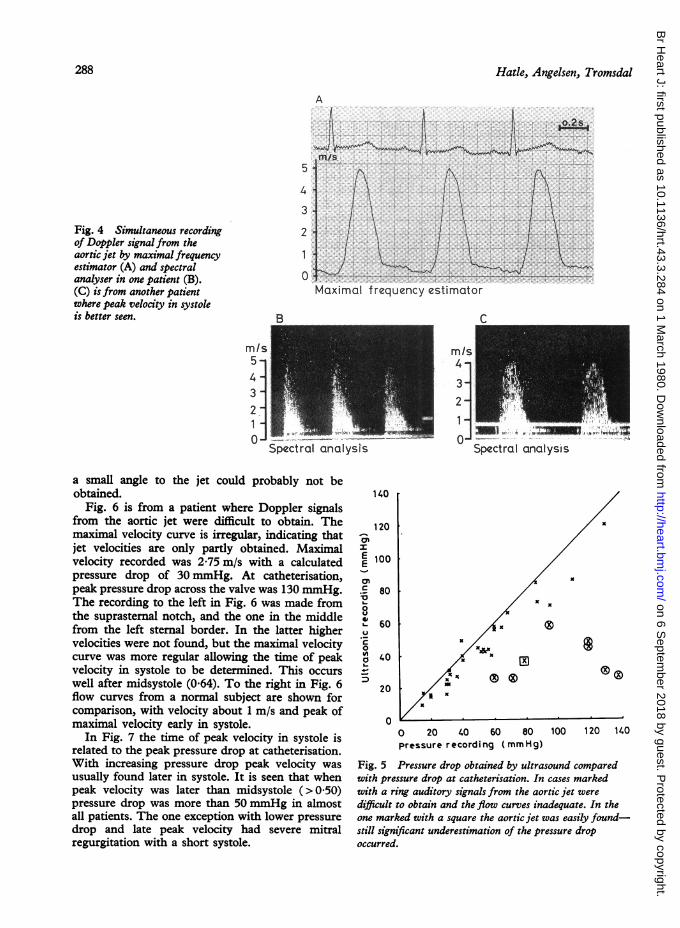
In Fig. 4 the Doppler signal from the aortic jetis recorded simultaneously both with the maximumfrequency estimator and a spectral analyser. Peakvelocity is not well shown on spectral analysis, butit can be seen that velocities up to 4-5 m/s arepresent. The maximum frequency estimator givesvelocities of 4*90 to 4 97 m/s.
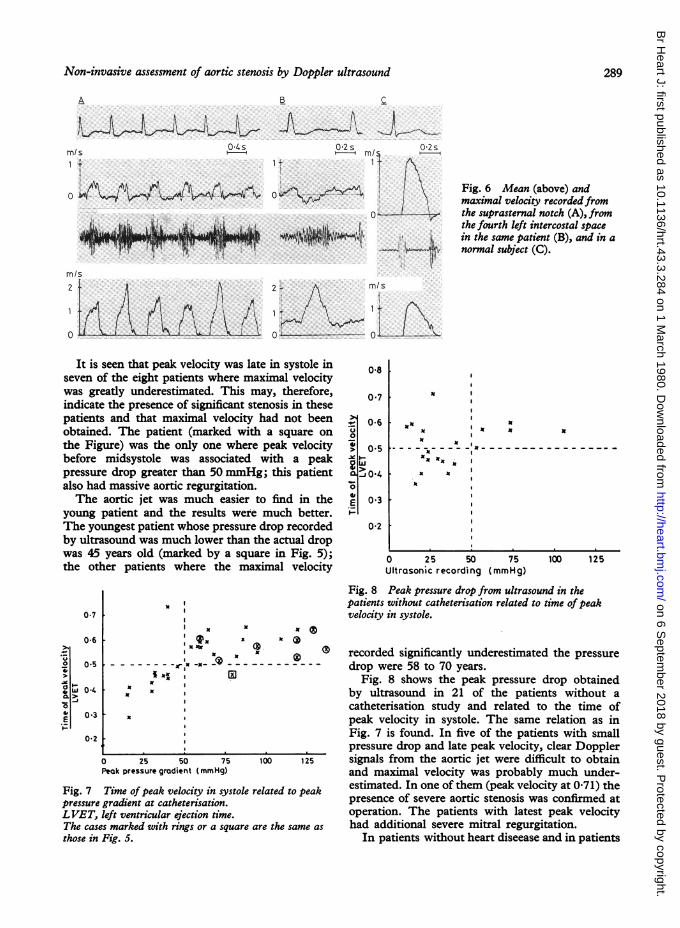
In Fig. 5 peak pressure drop at catheterisation iscompared with that obtained by ultrasound in the37 patients where the aortic jet was found. Thepressure drop calculated from the ultrasonicrecording was in almost all patients lower than thatfound at catheterisation.
In eight of the 37 patients the maximal velocityrecorded resulted in a significant underestimationof the pressure drop. In seven of these clear signalsfrom the aortic jet were difficult to obtain and madeit unlikely that the maximal velocities present wererecorded. In the eighth patient, however, flowsignals from the jet were easily found and therecorded curves were regular, but maximal velocityand pressure drop were significantly underestimated.At repeat ultrasonic examination after catheterisa-tion higher velocities were not found. In this case
mmHg Ols
80
60
40
20
0Q
Fig. 3 Right: pressure drop recorded simultaneously at catheterisation. , pressure recording; -- , ultrasonicrecording; Q, start of QRS; Mc, mitral valve closure; Ao, aortic valve opening; Ac, aortic valve closure.Left: ultrasonic recording with mean and maximal velocity and amplitude of Doppler signal (lower curve wheretiming of valve motions is more clearly seen).
287
on 6 Septem
ber 2018 by guest. Protected by copyright.
http://heart.bmj.com
/B
r Heart J: first published as 10.1136/hrt.43.3.284 on 1 M
arch 1980. Dow
nloaded from
Hatle, Angelsen, Tromsdal
Fig. 4 Simultaneous recordingof Doppler signal from theaortic jet by maximal frequencyestimator (A) and spectralanalyser in one patient (B).(C) is from another patientwhere peak velocity in systoleis better seen.
Mn/s5
3
2
Maximal frequency estimatorMaximail f requency estimator
1- --J I-all. .0 -
Spectral analysis
a small angle to the jet could probably not beobtained.
Fig. 6 is from a patient where Doppler signalsfrom the aortic jet were difficult to obtain. Themaximal velocity curve is irregular, indicating thatjet velocities are only partly obtained. Maximalvelocity recorded was 2-75 m/s with a calculatedpressure drop of 30mmHg. At catheterisation,peak pressure drop across the valve was 130 mmHg.The recording to the left in Fig. 6 was made fromthe suprasternal notch, and the one in the middlefrom the left sternal border. In the latter highervelocities were not found, but the maximal velocitycurve was more regular allowing the time of peakvelocity in systole to be determined. This occurswell after midsystole (0'64). To the right in Fig. 6flow curves from a normal subject are shown forcomparison, with velocity about 1 m/s and peak ofmaximal velocity early in systole.
In Fig. 7 the time of peak velocity in systole isrelated to the peak pressure drop at catheterisation.With increasing pressure drop peak velocity wasusually found later in systole. It is seen that whenpeak velocity was later than midsystole (>0-50)pressure drop was more than 50 mmHg in almostall patients. The one exception with lower pressuredrop and late peak velocity had severe mitralregurgitation with a short systole.
140
1200mIE 100
E 8.'to40L. 60IU._
0a 40
20
0
0
0 20 40 60 80pressure r ecord i ng ( mm H g)
100 120 140
Fig. 5 Pressure drop obtained by ultrasound comparedwith pressure drop at catheterisation. In cases markedwith a ring auditory signals from the aortic jet weredifficult to obtain and the flow curves inadequate. In theone marked with a square the aortic jet was easily found-still significant underestimation of the pressure dropoccurred.
288
x x
on 6 Septem
ber 2018 by guest. Protected by copyright.
http://heart.bmj.com
/B
r Heart J: first published as 10.1136/hrt.43.3.284 on 1 M
arch 1980. Dow
nloaded from
Non-invasive assessment of aortic stenosis by Doppler ultrasound
A a
mf/s
M/S 0.4-
02s 02s1rmr/I
0 In 1-u-I ; F
w a AiAml!2
0
Is1 .^.i 1 Ll Li_ tlA
Fig. 6 Mean (above) andmaximal velocity recorded fromthe suprasternal notch (A), fromthe fourth left intercostal spacein the same patient (B), and in anormal subject (C).
2*, MIS
0 I
It is seen that peak velocity was late in systole inseven of the eight patients where maximal velocitywas greatly underestimated. This may, therefore,indicate the presence of significant stenosis in thesepatients and that maximal velocity had not beenobtained. The patient (marked with a square onthe Figure) was the only one where peak velocitybefore midsystole was associated with a peakpressure drop greater than 50 mmHg; this patientalso had massive aortic regurgitation.The aortic jet was much easier to find in the
young patient and the results were much better.The youngest patient whose pressure drop recordedby ultrasound was much lower than the actual dropwas 45 years old (marked by a square in Fig. 5);the other patients where the maximal velocity
0-8
0 7
= 0-6u01
40
> 0 5
02
x I
UN
_---Nx
x X
I.
0 25 50Ultrasonic recording
0*7
0-6 II x x
Ilx x C
x
-.-- r' -x- -<& - I- -
39 x
0 25 50 75Peak pressure gradient (mmHg)
Fig. 7 Time of peak velocity in systole rpressure gradient at catheterisation.LVET, left ventricular ejection time.The cases marked with rings or a square athose in Fig. 5.
Fig. 8 Peak pressure drop from ultrasound in thepatients without catheterisation related to time ofpeakvelocity in systole.
O recorded significantly underestimated the pressure------ ~~~ drop were 58 to 70 years.
Fig. 8 shows the peak pressure drop obtainedby ultrasound in 21 of the patients without acatheterisation study and related to the time ofpeak velocity in systole. The same relation as inFig. 7 is found. In five of the patients with smallpressure drop and late peak velocity, clear Doppler
100 125 signals from the aortic jet were difficult to obtainand maximal velocity was probably much under-
Pelated to peak estimated. In one of them (peak velocity at 0-71) thepresence of severe aortic stenosis was confirmed atoperation. The patients with latest peak velocity
ire the same as had additional severe mitral regurgitation.In patients without heart diseease and in patients
Ix
75(mmHg)
100 125
o 0-5
o w 0-4>1
E 0.3
0-2
289
I
on 6 Septem
ber 2018 by guest. Protected by copyright.
http://heart.bmj.com
/B
r Heart J: first published as 10.1136/hrt.43.3.284 on 1 M
arch 1980. Dow
nloaded from
Hatle, Angelsen, Tromsdal
70 Ir
60 F
50 F
40
mm Hg
30
20
10 F
0
Fig. 9 Repeat examination in 13 patients. Timebetween first and second examination three to 15 months(mean 12-4).
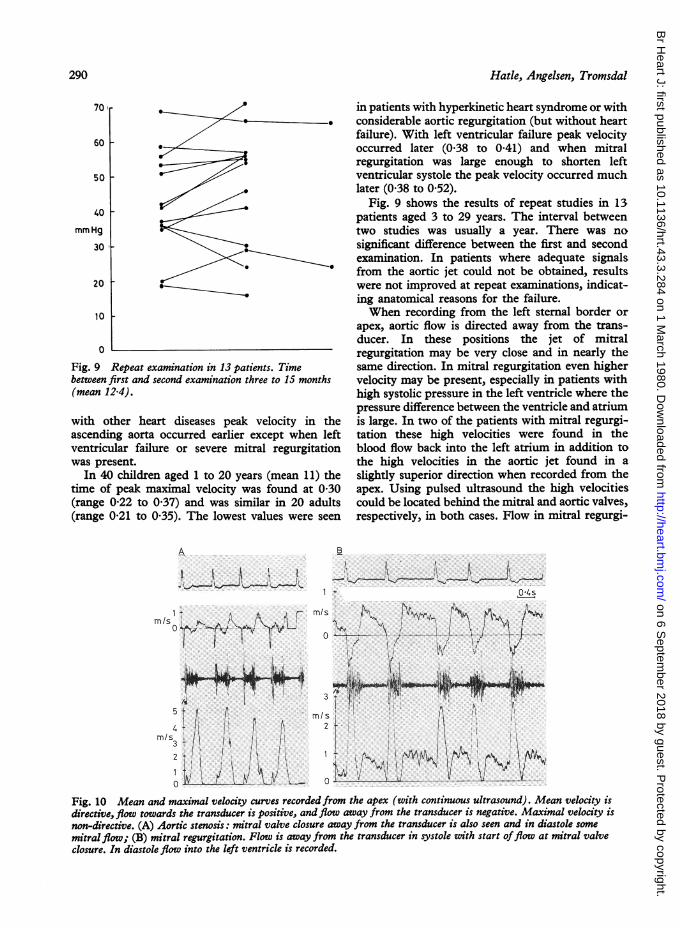
with other heart diseases peak velocity in theascending aorta occurred earlier except when leftventricular failure or severe mitral regurgitationwas present.
In 40 children aged 1 to 20 years (mean 11) thetime of peak maximal velocity was found at 0 30(range 0'22 to 0.37) and was similar in 20 adults(range 0-21 to 0'35). The lowest values were seen
A
in patients with hyperkinetic heart syndrome or withconsiderable aortic regurgitation (but without heartfailure). With left ventricular failure peak velocityoccurred later (0-38 to 0-41) and when mitralregurgitation was large enough to shorten leftventricular systole the peak velocity occurred muchlater (0-38 to 0.52).
Fig. 9 shows the results of repeat studies in 13patients aged 3 to 29 years. The interval betweentwo studies was usually a year. There was nosignificant difference between the first and secondexamination. In patients where adequate signalsfrom the aortic jet could not be obtained, resultswere not improved at repeat examinations, indicat-ing anatomical reasons for the failure.When recording from the left sternal border or
apex, aortic flow is directed away from the trans-ducer. In these positions the jet of mitralregurgitation may be very close and in nearly thesame direction. In mitral regurgitation even highervelocity may be present, especially in patients withhigh systolic pressure in the left ventricle where thepressure difference between the ventricle and atriumis large. In two of the patients with mitral regurgi-tation these high velocities were found in theblood flow back into the left atrium in addition tothe high velocities in the aortic jet found in aslightly superior direction when recorded from theapex. Using pulsed ultrasound the high velocitiescould be located behind the mitral and aortic valves,respectively, in both cases. Flow in mitral regurgi-
B
I_ I ti I
0:I
IJ i! p
~~~~~~di&~~~~~~~~~~~~
M/S
0~
0
Fig. 10 Mean and maximal velocity curves recorded from the apex (with continuous ultrasound). Mean velocity isdirective, flow towards the transducer is positive, and flow away from the transducer is negative. Maximal velocity isnon-directive. (A) Aortic stenosis: mitral valve closure away from the transducer is also seen and in diastole some
mitral flow; (B) mitral regurgitation. Flow is away from the transducer in systole with start offlow at mitral valveclosure. In diastole flow into the left ventricle is recorded.
M/s
0
--A
3
rnls2 +
290
on 6 Septem
ber 2018 by guest. Protected by copyright.
http://heart.bmj.com
/B
r Heart J: first published as 10.1136/hrt.43.3.284 on 1 M
arch 1980. Dow
nloaded from
Non-invasive assessment of aortic stenosis by Doppler ultrasound
tation also started earlier, at the closure of themitral valve and maximal velocity was reachedshortly after, compared with the later start of flowand later peak of maximal velocity in the aorta asshown in Fig. 10. Fig. 11 is redrawn from theangiogram showing the small angle between theaortic jet and mitral regurgitation in one of these.In the other cases of mitral regurgitation, flow alsostarted at the closure of the mitral valve but lowerand rather unchanged velocities during systolewere found.
Discussion
The results in the patient with simultaneousultrasonic and pressure recording, with a peakpressure drop of 84 and 86 mmHg, respectively,indicate that the applied formula can be used tocalculate peak pressure drop from maximal velocityat the velocities present in aortic stenosis.The delayed increase in velocity compared with
the pressure recording is probably a result of theomission of a second acceleration term in theformula. As discussed in a previous paper,2 onlyconvective acceleration is considered in the formulawhile acceleration resulting from changes invelocity with time was found to be of importanceat the time of valve opening and during increase invelocity. At peak velocity this term could be ignored,and in mitral stenosis the period at the beginning ofdiastole where this term was of importance was soshort that it could be ignored also in calculatingmean pressure drop. That this delay is moreevident in aortic stenosis may possibly be because
Fig. 11 Redrawn from the left ventricular angiogramfrom a patient with aortic stenosis and mitralregurgitation.LA, left atrium; LV, left ventricle; PV, pulmonaryvein; Ao, aorta. Solid arrows indicate aortic jet andstippled arrow indicates mitral jet.
A 16years
i
-4.: " ^-ECG
m/sMean I1 A. fr~\
velocity f0 /. -.. .. . ,
B 12 years
{k; 0-1s330
mi/s -
I
4 ~~~~A3Max 2
velocity2 1 X
Tinme of peak max velocity 061
LV ETPeak pressure drop 60mm/Hg
0 62
55 mm Hq
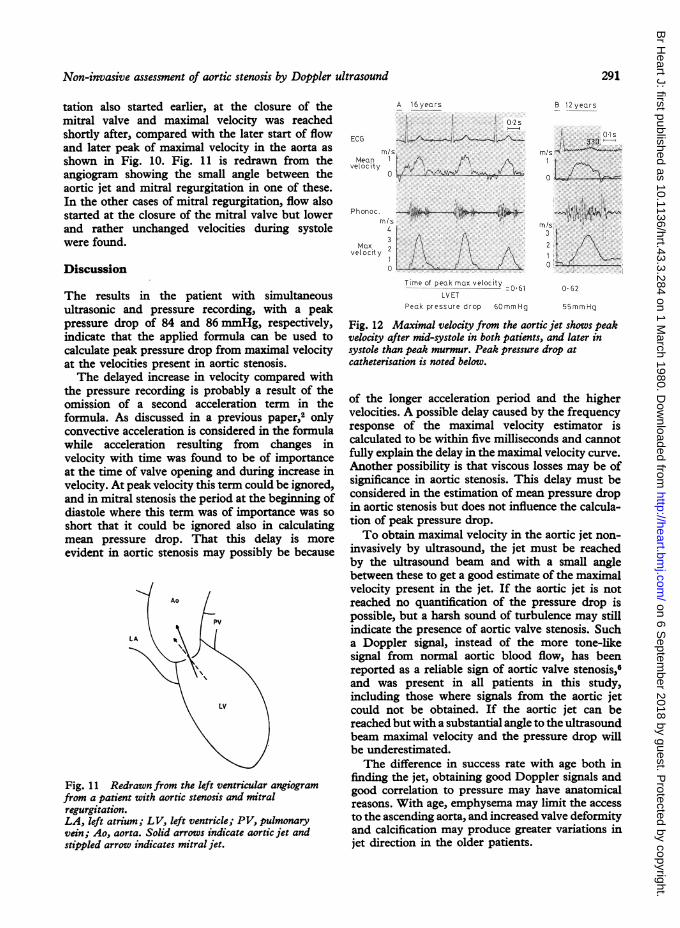
Fig. 12 Maximal velocity from the aortic jet shows peakvelocity after mid-systole in both patients, and later insystole than peak murmur. Peak pressure drop atcatheterisation is noted below.
of the longer acceleration period and the highervelocities. A possible delay caused by the frequencyresponse of the maximal velocity estimator iscalculated to be within five milliseconds and cannotfully explain the delay in the maximal velocity curve.Another possibility is that viscous losses may be ofsignificance in aortic stenosis. This delay must beconsidered in the estimation of mean pressure dropin aortic stenosis but does not influence the calcula-tion of peak pressure drop.To obtain maximal velocity in the aortic jet non-
invasively by ultrasound, the jet must be reachedby the ultrasound beam and with a small anglebetween these to get a good estimate of the maximalvelocity present in the jet. If the aortic jet is notreached no quantification of the pressure drop ispossible, but a harsh sound of turbulence may stillindicate the presence of aortic valve stenosis. Sucha Doppler signal, instead of the more tone-likesignal from normal aortic blood flow, has beenreported as a reliable sign of aortic valve stenosis,6and was present in all patients in this study,including those where signals from the aortic jetcould not be obtained. If the aortic jet can bereached but with a substantial angle to the ultrasoundbeam maximal velocity and the pressure drop willbe underestimated.The difference in success rate with age both in
finding the jet, obtaining good Doppler signals andgood correlation to pressure may have anatomicalreasons. With age, emphysema may limit the accessto the ascending aorta, and increased valve deformityand calcification may produce greater variations injet direction in the older patients.
291
on 6 Septem
ber 2018 by guest. Protected by copyright.
http://heart.bmj.com
/B
r Heart J: first published as 10.1136/hrt.43.3.284 on 1 M
arch 1980. Dow
nloaded from
Hatle, Angelsen, Tromsdal
Below 50 years good Doppler signals were easilyobtained in all, and peak pressure drop wassignificantly underestimated in only one of 18. Inthe age group above 50 years satisfactory resultswere obtained in only 40 per cent, but time of peakmaximal velocity in systole indicated whether mildor severe aortic stenosis was present in the 82 percent where signals from the jet were obtained. Thepossibility must be considered that significantaortic regurgitation will cause peak maximalvelocity to occur relatively early in systole; andthat mitral regurgitation or left ventricular failuremay result in it being relatively delayed.
In this study peak maximal velocity after mid-ejection was almost always associated with a peakpressure drop above 50 nunHg. This may becompared with the timing of the maximal intensityof the systolic murmur, a late peak of murmurindicating a more severe stenosis.7 8 In children,the peak of the murmur may be unreliable with anearly peak despite a high pressure drop.9 In thechildren in the present study peak velocity wasfound at or after mid-systole when peak pressuredrop was above 50 mmHg, even if the peak of themurmur occurred earlier (Fig. 12).
In an effort to avoid underestimation of thepressure drop, several transducer positions shouldbe tried and the region where the jet is foundmust be carefully scanned to obtain the bestpossible angle to the jet. When measurements aremade from the apex or left stemal border care mustbe taken to distinguish between the jet of mitralregurgitation and the aortic jet. Subvalvular aorticstenosis can also be distinguished as the highvelocity can then be localised to the left ventricularoutflow tract below the aortic valve using pulsedultrasound from the apical region.
Repeat measurements did not indicate anysignificant change in pressure drop over one to twoyears. This also indicates the reproducibility of themethod, which may help in the non-invasiveassessment of aortic stenosis provided the possibilityof underestimating the pressure drop is kept in
mind. It seems especially useful in children andyoung patients and in the follow-up of all patientswhere the jet is easily found.
This work was supported by the NorwegianCouncil on Cardiovascular Disease.
References
'Holen J, Aaslid R, Landmark K, Simonsen S.Determination of pressure gradient in mitral stenosiswith a noninvasive ultrasound Doppler technique.Acta Med Scand 1976; 199: 455-60.2Hatle L, Brubakk A, Tromsdal A, Angelsen B. Non-invasive assessment of pressure drop in mitral stenosisby Doppler ultrasound. Br Heart J 1978; 40: 131-40.3Angelsen BAJ. Transcutaneous measurement of aorticblood velocity by ultrasound. A theoretical and experi-mental approach. Report 75-78-W. Norway: Divisionof Engineering Cybernetics, Norwegian Institute ofTechnology, University of Trondheim, 1975.4Angelsen BAJ. Analog estimation of the maximumfrequency of Doppler spectra in ultrasonic blood velocitymeasurements. Report 76-21-W. Norway: Division ofEngineering Cybernetics, Norwegian Institute ofTechnology, University of Trondheim, 1976.5Brubakk AO, Angelsen BAJ, Hatle L. Diagnosis ofvalvular heart disease using transcutaneous Dopplerultrasound. Cardiovasc Res 1977; 11: 461-9.6Johnson SL. Pulse-Doppler echocardiography. Locali-zation ofmurmurs and spectrum of clinical applications.In: Mason DT, ed. Advances in heart disease, vol. 1.New York: Grune & Stratton, 1977: 396.7Oakley CM, Hallidie-Smith KA. Assessment of siteand severity in congenital aortic stenosis. Br Heart J1967; 29: 367-79.8Bonner AJ Jr, Sachs HN, Tavel ME. Assessing theseverity of aortic stenosis by phonocardiography andexternal carotid pulse recordings. Circulation 1973;48: 247-52.9Gamboa R, Hugenholtz PG, Nadas AS. Accuracy ofthe phonocardiogram in assessing severity of aorticand pulmonic stenosis. Circulation 1964; 30: 35-46.
Requests for reprints to Dr L Hatle, Section ofCardiology, University Hospital, 7000 Trondheim,Norway.
292
on 6 Septem
ber 2018 by guest. Protected by copyright.
http://heart.bmj.com
/B
r Heart J: first published as 10.1136/hrt.43.3.284 on 1 M
arch 1980. Dow
nloaded from