Non-Clinical and Clinical EEG tools. How they translate ...
45
Alain PATAT, MD Biotrial Club Phase 1 17ème Annual Meeting Paris, 05 April 2018 Non-Clinical and Clinical EEG tools. How they translate and can be scaled to clinical practice.
Transcript of Non-Clinical and Clinical EEG tools. How they translate ...

Alain PATAT, MD
Biotrial
Club Phase 1
17ème Annual Meeting
Paris, 05 April 2018
Non-Clinical and Clinical EEG tools. How they translate and
can be scaled to clinical practice.

Outline
Introduction: Use of biomarkers
EEG & ERPs as biomarkers for disease
identification and drug development
Examples of use of spontaneous EEG & ERPs
Example of use of sleep EEG
Conclusion

Translational Biomarkers BIO 2016 largest survey 9,985 transitions and 7,455
drugs
David W. Thomas et al. 2016

Translational Biomarkers BIO 2016 largest survey 9,985 transitions and 7,455
drugs
David W. Thomas et al. 2016

Utility of Biomarkers in Early Drug Development
Biomarker Study
Phase 1
Combined Phase 2a/2b
Phase 2a (POC)
STOP
NORMAL GO
FAST GO
Proof of Pharmacology / PD measure
Proof of Mechanism and/or Efficacy Prediction
Model-based/mechanistic (in HVs)
Early Signal of Efficacy in Patients
Patient selection
Preclinical
Proof of Pharmacology / PD measure
Proof of Mechanism
Animal models of disease
* Biomarker study can be carried out in parallel with the MAD study to save time, if a single acute dose design is used; EEG can potentially be integrated in the Phase 1 (SAD or MAD) studies;
Biomarker Study*

Impact on Both Discovery and Development
Bridging Discovery and Development
Development Discovery
• Identify biomarkers for use in early clinical studies
• Improve predictability of animal models and cell systems
• Evaluate clinical relevance of targets
• Determine biomarker response at pharmacology active doses
• Biomarkers can be used to: – Show early Proof-of-Biology
– Guide dose selection in humans
– Predict toxicity
– Characterize exposure-response
• Clinical experimental models
• Selected exploratory studies
• Smaller and shorter POC studies
• Shortened cycle time • Higher success rate
• Early identification of probable failures • Reduced risk
• Higher quality candidates • Increased value of compounds

CNS Biomarkers & Their Utility
Examples of CNS biomarkers
Peripheral or CSF wet markers (neuromediators or metabolites, enzyme reuptake inhibition or enzyme inhibition)
Electrophysiology (qEEG, ERPs, PSG, SEM…)
Psychomotor performance and cognitive functions
Brain imaging (MRI, fMRI, PET)
Use of CNS biomarkers in Early Development
Translation from animal to human (dose selection)
Time course of central effect (optimize dosage regimen)
Predictivity of clinical efficacy (or safety)

Use of cortical EEG as a Biomarker in drug development
EEG (oscillations) is an old technique, discovered by Hans Berger in 1929, which improved since.
Electrode numbers have increased from the initial single bipolar montage up to a high 256 electrodes density (improving source localisation and allowing connectivity measures)
However, a limited number of electrodes is often sufficient for drug profiling using EEG which has been widely used in CNS drug development especially using spectral analysis: Fink (sixties), Itil (seventies), Hermann & Saletu (eigthies)
Portable & cost-effective technique
Applicable to animals with telemetry (translational tool)

Utility of EEG as a CNS Biomarker in Drug Development
qEEG has as a number of characteristics of an "ideal" biomarker for CNS active compounds, since:
recording and analysis techniques are relatively unexpansive and broadly available preclinically and clinically
it is continuous, objective, repeatable, reproducible, translatable and sensitive
it can be easily included in early clinical studies to measure CNS pharmacological activity & neuronal function and by inference target engagement and activation
it provides PD outcomes for PK-PD modelling and thereby a fuller understanding of the pharmacology earlier in the programme (“window into the brain”)
Additional value
qEEG has even face- and construct- validity for the effects of drugs in several target indications (insomnia, epilepsy)
there is increasing evidence for the use of qEEG as :
a prognostic biomarker for the cognitive deficits in MCI and Alzheimer,
a drug-response biomarker in major depressive disorder
a marker of genetic risk for ADHD

The fall and rise of EEG as a CNS biomarker
Despite being a longstanding and well-established technology, EEG has been devalued by the industry largely due to:
Disbelief in the value of EEG as a biomarker due to past failures with a wide variety of causes, including ‘over-promising’ what it can deliver
The advance of imaging techniques, which were thought to supersede EEG as a "window into the brain", whereas current knowledge pleads for both techniques to be regarded as complementary.
Lack of standardisation in EEG recordings and study designs, leading to: Problems with data sharing / pooling
Problems when trying to compare proprietary EEG data with data from literature
Costly attempts by most major Pharma to set up their own (pre)clinical reference EEG databases
Incomplete knowledge of the translatability of pharmaco-EEG effects from animal to man

The fall and rise of EEG as a CNS biomarker
However, there is a recent revival of the use of EEG as a CNS biomarker in drug development due to improved capabilities linked to technical advances:
Improved EEG recording equipment enables easier incorporation into clinical studies, increased bandwidth (gamma), and better artefact and noise reduction
Greater data storage capabilities enable all data to be stored and analysed
Improved data analysis techniques enable the study of novel measures such as coherence and cordance and source localisation to better address assessment of connectivity and neural networks

Different spatial and temporal resolutions
Spatial Resolution (millimeters)
Temporal Resolution (seconds)
.001 .01 1 .1 100 10 1000
10
5
0
20
15
Invasiveness
EEG
MEG
MRS
IEEG fMRI
PET
SPECT
PRISM
PRISM

Synchronisation
between regions
Δ(1-4Hz),θ(4-8Hz),α(8-12)
Synchronisation
within a region
β(12-30Hz), γ(30-70Hz)
Discovered by Hans Berger 1929

EEG (Oscillations) Detects the summation of potentials in the vicinity of surface electrodes through the scalp and skull (in humans) or at the cortex level (animals).
Oscillations dynamics (qEEG using frequency spectral analysis) is used to pragmatically identify patterns of temporal or spatial changes associated with :
a state (awake eyes open/closed, asleep, drowsy)
a drug
a phenotype for alpha magnitude and now COMT val15met polymorphism,
a pathology: Alzheimer, schizophrenia etc.
Scales very well with animals

EEG as Biomarker in AD qEEG advantages over
other BM and Bioimaging
Measures oscillatory electrical
brain activity and captures dynamical
processes at the macroscopic scale
Relatively easy to deploy in
Clinical trials
Inexpensive
Non invasive
Repeated
Possibly remote
Van Straaten et al Alzh Res Ther 2014

Potentials of very small voltage, generated in response to specific event or stimulus overimposed to oscillations corresponding to the sum of Exitatory Post Synaptic Potentials (EPSP) from 100,000-1,000,000 pyramidal cells firing
First 100 msec termed « sensory » or « exogenous » and later potentials « cognitive »or « endogenous »:
Various ERPs
P50: strength of inhibitory pathways exploited for auditory gating
N200 (N2a=MisMatchNegativity): Unconscious reaction when a rule is violated elicited by any discriminable change
P300: Cognitive potential when a deviant stimulus is detected consciously with processing exploited in auditory oddball
Auditory Steady State Response (ASSR) with click stimuli at 4OHz
Key to ERP is time resolution (in the msec range) & location of potentials, described with their validation (often one group or even one electrode being better as generating a greater potential)
ERPs are more complex to adapt to animals particularly rodents
Evoked Related Potentials (ERPs)

Both auditory oddball (P300) and MisMatch Negativity (N200) are based on the detection of a rare deviant sound from a frequent one.
For P300, this is a conscious task processing with a behavioural response (key press, counting etc) when a deviant stimulus is detected consciously, as for MMN no response is expected and distractor used (e.g. cartoon).
MMN is automatic and preattentional occurring around 200 msec P300 is a cognitive potential occurring from 300 msec and onwards
ERPs: Close paradigms, Big difference
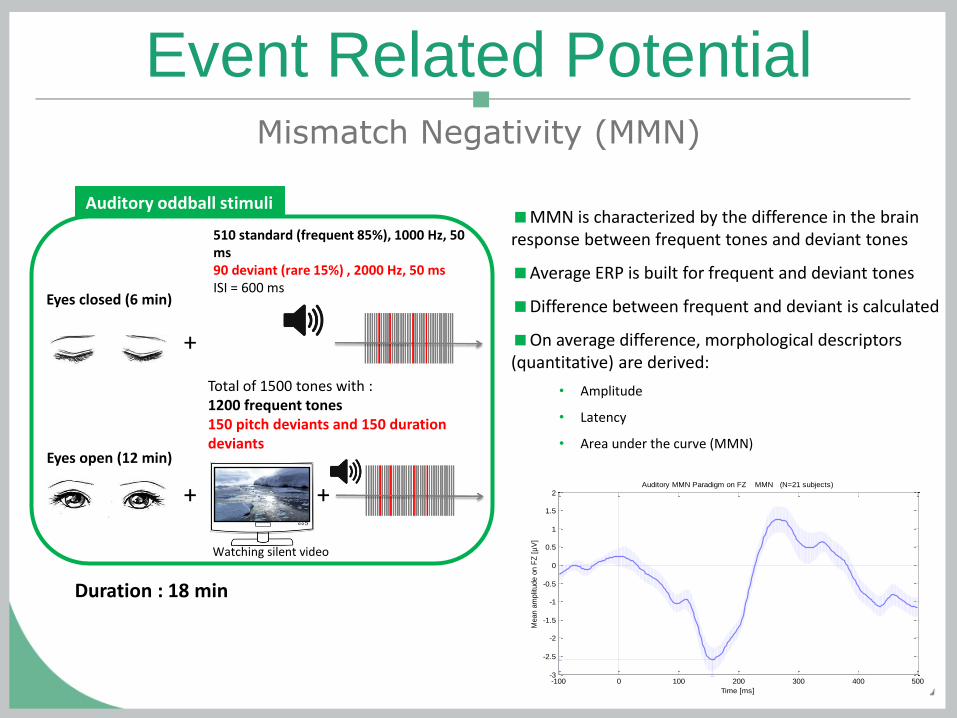
Auditory oddball stimuli
Duration : 18 min
510 standard (frequent 85%), 1000 Hz, 50 ms 90 deviant (rare 15%) , 2000 Hz, 50 ms ISI = 600 ms
+
Total of 1500 tones with : 1200 frequent tones 150 pitch deviants and 150 duration deviants
Watching silent video
+
+
Eyes closed (6 min)
Eyes open (12 min)
Event Related Potential Mismatch Negativity (MMN)
MMN is characterized by the difference in the brain response between frequent tones and deviant tones
Average ERP is built for frequent and deviant tones
Difference between frequent and deviant is calculated
On average difference, morphological descriptors (quantitative) are derived:
• Amplitude
• Latency
• Area under the curve (MMN)
-100 0 100 200 300 400 500-3
-2.5
-2
-1.5
-1
-0.5
0
0.5
1
1.5
2
Time [ms]
Mean a
mplit
ude o
n F
Z [
µV
]
Auditory MMN Paradigm on FZ MMN (N=21 subjects)

Event Related Potential Mismatch Negativity (MMN)
Difference between healthy subjects (n=32) and schizophrenic patients) (n=12)
MMN located in Fronto-Central area Schizophrenic patients show an attenuation of the MMN

Event Related Potential Auditory P300
The P300 is a large and positive component that peaks approx 300 ms after onset of a rare stimulus - Duncan (2009)
Auditory oddball stimuli
Duration : 4 to 9 min
Frequent : 85%, 500 Hz, 10 ms Rare: 15% (n=30-40), 2000 Hz, 10 ms ISI = 1200 to 1900 ms
85 dB
Subject : must count the rare sounds
-500 -400 -300 -200 -100 0 100 200 300 400 500-6
-4
-2
0
2
4
6
8
10
12
14
Time [ms]
Mean a
mplitu
de o
n C
Z [
µV
]
Visual (blue) and Auditory (red) Oddball Paradigms on CZ Mean and SEM
Visual P300: 11.4772µV at 387.5ms (N=21)
Auditory P300: 10.9571µV at 312.5ms (N=124)
Grand average ERP from visual (blue) and auditory (red) oddball paradigms on Cz. Mean and SEM. The P300 wave’s maxima are marked by dashed lines. Visual P300: 11.4772µV at 387.5ms (n=21). Auditory P300: 10.9571µV at 312.5ms (historical data, n=124).

Pilot study results
N100
P300
-4µV 0
6µV 14
-500 -400 -300 -200 -100 0 100 200 300 400 500-2
0
2
4
6
8
10
12
14
Time [ms]
Mean a
mplit
ude o
n F
Z [
µV
]
Visual Oddball Paradigm on FZ P300: 8.9624µV at 375ms (N=21 subjects)
-500 -400 -300 -200 -100 0 100 200 300 400 500-2
0
2
4
6
8
10
12
14
Time [ms]
Mean a
mplit
ude o
n C
Z [
µV
]
Visual Oddball Paradigm on CZ P300: 11.4772µV at 387.5ms (N=21 subjects)
-500 -400 -300 -200 -100 0 100 200 300 400 500-2
0
2
4
6
8
10
12
14
Time [ms]
Mean a
mplit
ude o
n P
Z [
µV
]
Visual Oddball Paradigm on PZ P300: 11.4834µV at 382.5ms (N=21 subjects)
Fz Cz Pz
Fz
Cz
Pz
O1
O1
Fz
Cz
Pz
-500 -400 -300 -200 -100 0 100 200 300 400 500-4
-3
-2
-1
0
1
2
3
4
5
6
Time [ms]
Mean a
mplit
ude o
n O
1 [
µV
]
Visual Oddball Paradigm on O1 P300: 5.4019µV at 375ms (N=21 subjects)
N100 in occipital area
Oribe et al. (2015)
O1
Visual Oddball (P300) Results from pilot study – ERP flat maps

Rat electrocorticogram sensitivity matrix (dark phase)

Daytime qEEG healthy humans sensitivity matrix

Hypnotic Drugs
Ideal example of an easy and validated use of CNS biomarkers to define
active dose and safety profile
qEEG: time course of effect (increase delta and theta, decrease alpha
and fast beta and gamma, increase beta 1 for benzodiazepine)
Latency to Sleep Onset: Multiple sleep latency test
PSG: define sleep efficiency and profile
Psychomotor and cognitive testing: to define lack of residual effects
Various models to sensitize effects on sleep onset and/or sleep
maintenance (post nap effect, phase advanced, noise induced (for sleep
maintenance only))

PD effects of oral and iv zolpidem administration in
12 healthy subjects DELTA ENERGIES
25
ALPHA ENERGIES
BETA1 ENERGIES
STANFORD SLEEPINESS SCALE
Patat et al, Psychopharmacol, 1994; 114 : 138-146

Delta sleep and 5-HT2a receptor
Rat study : Dose-dependent increases in NREM sleep consolidation and delta power
Healthy subjects : Dose-dependent increases in SWS
Effects of a single bedtime dose of nelotanserin on sleep architecture in the post-nap sleep model of insomnia.

Hours post
Delta rest
Delta VC
Theta rest
Theta VC
Alpha rest
Alpha VC
Beta rest
Beta VC
Absolute power
0
0.01
0.05
1,-1
- 0.1
- 0.05
- 0.01
0
Relative power
0.5 1.5 2.5 3.5 4.5 5.5 6.5 7.5 8.5 26.5 0.5 1.5 2.5 3.5 4.5 5.5 6.5 7.5 8.5 26.5
Lorazepam (2 mg) vs placebo in young healthy men

0,5
1
1,5
2
***
***
**
*
First in human SAD trial conducted at Biotrial CPU in cohorts of 8 subjects (6 active & 2 placebo): qEEG add-on (baseline and 1h post dose)
Change in relative power in standard frequency bands (eyes open) Consistent with animal data
Effect on Gamma (animal)
EEG in SAD & MAD of a drug to treat neurodegeneration and
restore cognitive function in Alzheimer’s disease patients
Gamma Power

qEEG: β1 in FP1 with 3 formulations of alprazolam
in 12 subjects (IV, transnasal & sublingual)
8
10
12
14
16
18
20
-0,5 0 0,5 1 1,5 2 2,5 3 3,5 4 4,5
Intra venous
Transnasal
Sublingual
FP1 derivation- Béta1 Relative Energy
10,51 ±0,18
TIME (Hours)

Evidence of target engagement in a multiple ascending dose study with
BNC210, an α7 nicotinic Acetylcholine Receptor (nAChR) negative allosteric
modulator (NAM) in development for the treatment of anxiety disorders
BACKGROUND: BNC210 is a negative allosteric modulator (NAM) of the α7 nicotinic Acetylcholine Receptor in development for the treatment of anxiety disorders. STUDY DESIGN: Randomised, double-blind, placebo-controlled, MAD oral doses BID for 8 days study in healthy subjects: Cohorts 300, 600 and 1200 mg/day with 8 subjects (6 active & 2 placebo) & 2000 mg/day in 30 subjects (24 active & 6 placebo) for the nicotine shift assay.
TARGET ENGAGEMENT METHOD - NICOTINE SHIFT ASSAY Quantitative EEG (qEEG) recordings were performed at screening, on D-1 (before dosing) and after 7 days of dosing with 2000 mg (6h after dosing)). Dose titrations of nicotine (from 0.5 to 2 mg) were administered by nasal spray (Nicorette®) 10’ prior to recordings ( 2’ eyes-closed). The alpha-2 band (10-12.5Hz) of qEEG should increase after nicotine in a dose dependent manner.
Subjects who produced a nicotine dose
response at screening and on Day-1 were
used for analysis in the nicotine shift assay
(RESPONDERS)
Analyses of the nicotine shift assay compared nicotine
dose response data on Day-1 (baseline before drug)
with dose response data on Day 7 (steady state after
2000 mg BNC210)

Evidence of target engagement in a multiple ascending dose study with
BNC210, an α7 nicotinic Acetylcholine Receptor (nAChR) negative allosteric
modulator (NAM) in development for the treatment of anxiety disorders
Multiple doses of 2000 mg/day of BNC210 significantly reduced the peak height of nicotine responses on the α2 band measured using qEEG in 24 healthy subjects
Nicotine shift after multiple dosing of BNC210 for 7 days in 24 healthy subjects showing a significant reduction in a2 power amplitude compared to baseline (day -1)
0 .0 0 .5 1 .0 1 .5 2 .0
0 . 0 0
0 . 2 5
0 . 5 0
0 . 7 5
1 . 0 0
N ic o t in e D o s e ( m g )
Po
we
r i
n a
lph
a2
ba
nd
D a y -1 (N o B N C 2 1 0 )
D a y 7 (W ith B N C 2 1 0 )
p = 0 .0 0 6 2
p = 0 .0 4 8 7
p = 0 .0 0 2 6
p = 0 .3 1 5 4
* ** *N S
*
0 .0 0 .5 1 .0 1 .5 2 .0
- 1 .0
- 0 .5
0 .0
0 .5
N ic o t in e (m g )
Re
du
cti
on
in
Po
we
r in
a2
Ba
nd
p = 0 .3 5 2 5
p = 0 .0 0 1 4
p = 0 .0 0 0 9
p = 0 .0 1 9 7
* ** *
*

P300 amplitude : Scopolamine, an anticholenergic drug, significantly decreased P300 amplitude and donepezil, an acetylcholinesterase inhibitor, had
the opposite effect
Scopolamine
0.5 mg SC
Donepezil
5 mg orally
Pharmacodynamic : P300 amplitude of auditory ERP
after a single dose of Scopolamine and Donepezil

-1000 -500 0 500 1000 1500 2000 2500 30000
0.5
1
1.5
2
2.5
Uhlhaas 0.27232
Clicks 1.46
Time [ms]
Evoked p
ow
er
on F
Z [
µV
²]
ASSRs on FZ blue:Clicks set (N=21) red:Uhlhaas paradigm (N=20)
Average power during stimulation (POI) Corrected by average power during 500ms prior to stimulation (BL)
POI clics
BL POI Uhlhaas
Auditory Steady-State Response (ASSR)
Parameters
POI Uhlhaas

Effect of escitalopram 15mg/d on ASSR in 32 healthy
male subjects
: evoked gamma (35-45 Hz)

Escitalopram evoked gamma (ASSR elicited by
clicks) BRAIN MAPPING REPRESENTATION OF AUDITORY EVOKED GAMMA
Statistical comparison of absolute
power (treatment v/s placebo)

Sleep Studies Sleep is an important function of brain and during sleep many offline processing occurs (episodic and procedural memory consolidation, metabolic cleaning, etc).
Sleep is affected by most of CNS active drugs and then sleep may contain biomarkers of Mechanism Of Action which are silent during day.
Some examples are biomarkers of antidepressant (REM suppression and increase in REM latency) or hypnotic drugs action
For a CNS-active drug, not studying its effects on sleep would be odd and was systematic in the past.
Combined studies with daytime EEG and Polysomnography covers all aspects of CNS functioning
Some vertical integration between species for elementary components although sleep structure varies between species.

Rat electrocorticogram sensitivity matrix (light phase)

Polysomnography healthy humans sensitivity matrix

qEEG after a single and multiple doses of
antidepressants in 20 healthy subjects
LEFT FRONTO-TEMPORAL (F3T3) BETA ABSOLUTE ENERGY

PSG after a single and multiple doses of
antidepressants in 20 healthy subjects
LATENCY TO REM SLEEP ABSOLUTE REM SLEEP DURATION

Effects of duloxetine, a SNRI versus reference
desipramine on REM sleep
From Chalon et al. Psychopharmacology 2005

EEG analysis : current and future analysis
Level 1
Basic signal analysis
Level 2
Connectivity analysis
Stam & van Straaten 2012
Level 3
Network analysis
Different brain areas signal
correlations functional connection

European IMI aiming to unpick biological reasons underlying social withdrawal
which is a common early symptom of schizophrenia (SZ), Alzheimer’s disease (AD)
and major depression 5MD).
Public private collaboration involving academic units, CROs (P1vital, Biotrial) &
pharmaceutical companies (Lilly, Boehringer, Janssen, Takeda, Roche, Novartis, Pfizer
…)
Objective: develop a quantitative approach to the understanding of
neuropsychiatric diseases (SZ, AD, MD) relying mainly on Imaging and EEG/ERP
assessments through conducting a clinical trial in 140 patients.
4 sites.
Back translation approach to develop preclinical tasks
PRISM (Psychiatric Rating using Intermediate
Stratified Markers) IMI PROJECT

CONCLUSION
EEG and ERP are useful biomarkers and translational tools for development of CNS compounds
EEG allows profiling and detecting effects of CNS drugs in the brain in humans and animals (Minimum Effective Dose, time-course, PK/PD, contribution of metabolites, PD interactions and synergistic effects etc).
Portable, non invasive, reliable and cost-effective measures of CNS functional activity: sedation and activation for qEEG, wake-sleep stages for polysomnography and cognitive activation for ERP
Sample size has to be carefully estimated depending on effect size of the drug (massive for BZD, NMDA antagonists, subtle in most of the cases).
EEGs can be assessed during FIH, dedicated PD, DDI & bioequivalence/bioavailability PD studies.
ERP probe specific functions with specific objectives and sometimes may be meaningless in healthy subjects (e.g. no deficit in auditory gating)
Complementary to other methods with a higher spatial resolution such as imaging (BOLD fMRI or ASL)
Good properties for being used to phenotype subgroup of a pathological population (PRISM) suitable for multi-center studies

Thank You for your attention