Clinical electroencephalogram (EEG) evaluation is improved ... · Clinical electroencephalogram...
8
536 DOI: 10.1590/0004-282X20160082 ARTICLE Clinical electroencephalogram (EEG) evaluation is improved by the amplitude asymmetry index Avaliação da assimetria de amplitudes amplia o uso clínico do eletroencefalograma (EEG) Francisco José Carchedi Luccas 1 , Thalita Bártolo 2 , Nayara Lucio da Silva 2 , Barbara Cavenaghi 2 EEG clinical interpretation is based on the detection of paroxysms and on background activity evaluation. Visual analysis is fundamental for paroxysmal detection, not sur- passed by computer specific programs. Electrocerebral back- ground activities comprise the dominant rhythms over the scalp, their topography, reactivity, morphology, frequency, amplitude, and only the last two are more amenable to pa- rameterization. Frequency is evaluated by spectral analysis and presents four classical defined bands: delta (0.5–3.5 Hz), theta (4–7.5 Hz), alpha (8–12.5 Hz), and beta (13–20 Hz). e majority of studies on frequency asymmetry focus on alpha rhythm, considered as pathological whenever values larger than 0.5–1 Hz are attained. Classical amplitude measures are more laborious, usually done by hand with a ruler, generating subjective criteria of low, medium, and high values 1,2,3 . e concept of symmetry is ubiquitous in nature and an im- portant property in the evaluation of various clinical conditions. Cerebral hemispheres, although appearing similar, are neither completely symmetrical in structure nor equivalent in function. Modest physiological asymmetries of EEG rhythms are frequent, but greater asymmetries present clinical relevance in several brain disorders. When based on analogical EEG equipment am- plitude asymmetry definition was more difficult: 1) Kugler 4 re- ferred alpha amplitudes usually higher on the right hemisphere of right-handed individuals, and differences up to 30% should be considered normal; 2) Kellaway 5 reported 60% of adults present- ing alpha rhythm voltage asymmetry, half of them with higher values on the right side, not correlated to hemispherical domi- nance; amplitude differences higher than 50% should be consid- ered potentially pathologic; 3) Delamonica 6 reported EEG am- plitude as characteristically symmetrical, suggesting to search other parameters, such as frequency, to overcome the dilemma of asymmetry. In general these studies related almost exclusively to alpha rhythm, breach rhythm representing the exception after 1 Hospital São Luiz, Neurofisiologia Clínica, Neurofisiologia Clínica, São Paulo SP, Brasil; 2 Hospital São Luiz, Neurofisiologia Clínica, Biomedicina, São Paulo SP, Brasil. Correspondence: Francisco José Carchedi Luccas; Rua Simão Alvares, 250 / apto. 22; 05417-020 São Paulo SP, Brasil; E-mail: [email protected] Conflict of interest: There is no conflict of interest to declare. Received 26 April 2015; Received in final form 18 December 2015; Accepted 18 May 2016. ABSTRACT Cerebral hemispheres, although similar, are neither completely symmetrical in structure nor equivalent in function. EEG asymmetry studies have been directed more to frequency than to amplitude analysis. Objective: Better definition of normal amplitude asymmetry values on the classical EEG frequency bands. Results: EEG amplitude asymmetry index (AAI) is physiologically low in normal adults, differences usually lesser than 7%. Conclusion: Persistent or intermittent amplitude asymmetry regional differences higher than 7% may be suggestive of pathology after adequate correlation with clinical data and EEG classical visual analysis. Keywords: Electroencephalography; amplitude; asymmetry. RESUMO Os hemisférios cerebrais não são simétricos em morfologia ou funções. Tradicionalmente, os estudos de assimetria do EEG focaram mais na análise de frequências do que na de amplitudes. Objetivo: Contribuir para melhor definição dos valores normais de assimetria de amplitudes nas faixas de frequência clássicas do EEG. Resultados: O índice de assimetria de amplitudes é fisiologicamente baixo em adultos, usualmente menor do que 7%. Conclusão: Se adequadamente correlacionadas aos dados clínicos e à análise visual do EEG, assimetrias persistentes ou intermitentes de amplitude acima de 7% podem ser sugestivas de patologia. Palavras-chave: Eletroencfalografia; amplitude; assimetria.
-
Upload
hoangquynh -
Category
Documents
-
view
223 -
download
0
Transcript of Clinical electroencephalogram (EEG) evaluation is improved ... · Clinical electroencephalogram...

536
DOI: 10.1590/0004-282X20160082
ARTICLE
Clinical electroencephalogram (EEG) evaluation is improved by the amplitude asymmetry indexAvaliação da assimetria de amplitudes amplia o uso clínico do eletroencefalograma (EEG)Francisco José Carchedi Luccas1, Thalita Bártolo2, Nayara Lucio da Silva2, Barbara Cavenaghi2
EEG clinical interpretation is based on the detection of paroxysms and on background activity evaluation. Visual analysis is fundamental for paroxysmal detection, not sur-passed by computer specific programs. Electrocerebral back-ground activities comprise the dominant rhythms over the scalp, their topography, reactivity, morphology, frequency, amplitude, and only the last two are more amenable to pa-rameterization. Frequency is evaluated by spectral analysis and presents four classical defined bands: delta (0.5–3.5 Hz), theta (4–7.5 Hz), alpha (8–12.5 Hz), and beta (13–20 Hz). The majority of studies on frequency asymmetry focus on alpha rhythm, considered as pathological whenever values larger than 0.5–1 Hz are attained. Classical amplitude measures are more laborious, usually done by hand with a ruler, generating subjective criteria of low, medium, and high values1,2,3.
The concept of symmetry is ubiquitous in nature and an im-portant property in the evaluation of various clinical conditions.
Cerebral hemispheres, although appearing similar, are neither completely symmetrical in structure nor equivalent in function. Modest physiological asymmetries of EEG rhythms are frequent, but greater asymmetries present clinical relevance in several brain disorders. When based on analogical EEG equipment am-plitude asymmetry definition was more difficult: 1) Kugler4 re-ferred alpha amplitudes usually higher on the right hemisphere of right-handed individuals, and differences up to 30% should be considered normal; 2) Kellaway5 reported 60% of adults present-ing alpha rhythm voltage asymmetry, half of them with higher values on the right side, not correlated to hemispherical domi-nance; amplitude differences higher than 50% should be consid-ered potentially pathologic; 3) Delamonica6 reported EEG am-plitude as characteristically symmetrical, suggesting to search other parameters, such as frequency, to overcome the dilemma of asymmetry. In general these studies related almost exclusively to alpha rhythm, breach rhythm representing the exception after
1Hospital São Luiz, Neurofisiologia Clínica, Neurofisiologia Clínica, São Paulo SP, Brasil;2Hospital São Luiz, Neurofisiologia Clínica, Biomedicina, São Paulo SP, Brasil.
Correspondence: Francisco José Carchedi Luccas; Rua Simão Alvares, 250 / apto. 22; 05417-020 São Paulo SP, Brasil; E-mail: [email protected]
Conflict of interest: There is no conflict of interest to declare.
Received 26 April 2015; Received in final form 18 December 2015; Accepted 18 May 2016.
AbstrACtCerebral hemispheres, although similar, are neither completely symmetrical in structure nor equivalent in function. EEG asymmetry studies have been directed more to frequency than to amplitude analysis. Objective: Better definition of normal amplitude asymmetry values on the classical EEG frequency bands. Results: EEG amplitude asymmetry index (AAI) is physiologically low in normal adults, differences usually lesser than 7%. Conclusion: Persistent or intermittent amplitude asymmetry regional differences higher than 7% may be suggestive of pathology after adequate correlation with clinical data and EEG classical visual analysis.
Keywords: Electroencephalography; amplitude; asymmetry.
rEsumoOs hemisférios cerebrais não são simétricos em morfologia ou funções. Tradicionalmente, os estudos de assimetria do EEG focaram mais na análise de frequências do que na de amplitudes. Objetivo: Contribuir para melhor definição dos valores normais de assimetria de amplitudes nas faixas de frequência clássicas do EEG. Resultados: O índice de assimetria de amplitudes é fisiologicamente baixo em adultos, usualmente menor do que 7%. Conclusão: Se adequadamente correlacionadas aos dados clínicos e à análise visual do EEG, assimetrias persistentes ou intermitentes de amplitude acima de 7% podem ser sugestivas de patologia.
Palavras-chave: Eletroencfalografia; amplitude; assimetria.

537Luccas FJC et al. EEG evaluation by the amplitude asymmetry index
surgical burr holes providing beta asymmetry. More recently Aurlien et al.7 used visual analysis on occipital leads to measure alpha rhythm separated from the other background activities; the amplitudes showed wide variation, but amplitude asymme-tries were not considered.
Brain symmetry index (BSI) developed by Putten2 on digi-tal EEG compares longitudinal montage of electrodes on the right and left hemispheres to detect temporal spectral char-acteristics and interhemispheric asymmetry, but smaller brain regions were not contemplated. BSI was successfully applied in carotid endarterectomy monitoring, ranging from zero (per-fect symmetry) to 1 (perfect asymmetry). BSI has also found application monitoring acute strokes and focal seizures in the Intensive Care Unit. Finnigan and van Putten suggested BSI could inform the efficacy of thrombolytic therapy and help prognostication and rehabilitation strategies8,9,10.
Numbers (digits) in digital EEG equipment permits the development of several quantitative EEG (qEEG) formats de-rived by mathematical analysis. But, “Despite the presence of numbers, EEG analyses continue to be limited to classic visu-al as in the past, taking no advantages of quantitative EEG”.i Restating, clinical neurophysiologists are recording dEEG, but interpreting solely classical visual xy graphs.
Considering clinical application, should the more recent qEEG be preferred over dEEG graphics? The almost infinite possibility of qEEG formats turns this into a very complex is-sue. We believe that the simultaneous display of dEEG plus a limited number of qEEG formats represents the best of worlds. Recently a program called Video Monitor EEG EQSA260 (Neurotec Pesquisa & Desenvolvimento em Biomedicina ®) is being routinely employed, where classical EEG is simultane-ously viewed with three digitalized formats: 1) Compressed Spectral Array (CSA), graphics deploying EEG frequency bands spectral power (μV2) as “hills and valleys” of higher and low-er activity. 2) Spectral Edge Frequency (SEF), a cursor defin-ing 90% of EEG spectral limits. 3) Amplitude asymmetry index (AAI), showing percentage differences among eight electrode pairs of both hemispheres. Better EEG parameters definition may help surpass subjectivity weak limits11.
During routine EEG recording an online graphic, seen as a green line, climbs between CSA left and right hemispheres spectral analysis, easily allowing AAI evaluation of every ep-och or period (“Raia”) (Figure 1). Artifacts may cause short-lived amplitude variations that are usually disregarded, but when real-time online left or right higher persistent or inter-mittent drifts are envisaged on a hemisphere or region the quest for pathology is mandatory (Figures 2 and 3).
Figure 1. Clinical example showing simultaneous classical electroencephalogram (EEG) channels on the left and Compressed Spectral Array (CSA) analysis on the right. A cursor resting on one of CSA epochs reveal an isolated period amplitude asymmetry percentage (55.23% “Raia” of 2 seconds). It may be noted that Amplitude Asymmetry Index (AAI) is higher on left anterior (F3-T3 x F4-T4) compared to posterior (C3-O1 x C4-O2) leads.
i Wilfong AA. Personal communication In 5th Latin-American Clinical Neurophysiology Congress; 2008; Puebla, México.

538 Arq Neuropsiquiatr 2016;74(7):536-543
Figure 2. Late postoperative left side meningioma showing: (A) Figure left side, upper 8 channels raw electroencephalogram (EEG) depicting slow delta waves on the left hemisphere, and lower 8 channels with normal EEG on the right hemisphere; (B) Figure right side, Compressed Spectral Array (CSA) comparing F3-T3 to F4-T4 and C3-O1 to C4-O2; larger amount of delta & theta slow waves on left hemisphere derivations; (C) Real-time green line between both CSA columns shows a left drift indicating large delta band asymmetry.
Figure 3. Amplitude Asymmetry Index (AAI) table developed offline constituted by 20 artifact-free epochs of the same patient, comparing eight electrode pairs and demonstrating a left side increase of delta & theta slow waves, compatible with figure 2 online recording.

539Luccas FJC et al. EEG evaluation by the amplitude asymmetry index
An important question will surface whenever low-er online AAI values are observed, basically, which are the normal adult acceptable limits? These data were not found in the literature and offline tables expressing the percentage of left-right AAI may help the clinical-EEG correlation. Normal adult AAI values together with few examples will be provided.
mEtHoD
Thirty adult patients aged 19 to 59 years (17 F, 13 M) ex-amined at Hospital São Luiz – Morumbi (Figure 4) submit-ted to EEG as part of their clinical workup had their EEG reported as normal by a team with one clinical neurophysi-ologist (FJCL) and three biomedical; neurological lesions were not present (Figure 5). Patients with external factors capable of influence symmetry, such as localized scalp ede-mas or hematomas were excluded. Since EEG recording is noninvasive a written informed consent is considered un-necessary, substituted by a careful explanation of the pro-ceedings, respecting patient questions and agreement.
Normal EEG files were retrieved to extract the data, the patients being allocated to three different groups in accor-dance to temporal recording sequence, ten patients each, whose mean ages were 37.1, 37.4, and 41.5 years.
Noninvasive video-EEG recorded simultaneously 26 channels dEEG plus qEEG CSA, SEF and AAI formats applying 19 scalp and 2 reference linked ears electrodes [A1 + A2] / 2 (10–20 International System) with adhesive-conductive paste, impedance below 5 kOhms, plus 2 elec-trodes for cardiac monitoring, and an oxymeter. Notations were kept for routine eyes open and closed, hyperventilation, and intermittent photic stimulation. Routinely the online AAI is continuously evaluated together with CSA, allowing real-time analysis of a selected frequency band increment or reduction occurring in one hemisphere or region.
After recording offline AAI table allows to compare spec-tra power percent difference (left minus right) for each fre-quency band among homologous eight electrode pairs Fp1-Fp2, F3-F4, F7-F8, C3-C4, T3-T4, P3-P4, T5-T6 and O1-O2, also showing sample variation (VAR) and standard deviation (SD), with statistical data provided by the program. Sample variation (VAR) will not be further analysed, it was expected-ly large within groups composed of different EEG. AAI SD will also not be further discussed, since lower values neither sus-tain clinical relevance nor it is accepted that amplitude val-ues sustain Gaussian distribution. Maximal values and their limits represent the searched information.
Development of offline AAI table encompass the follow-ing steps: 1) edition of 20 epochs, two seconds each (totaling 40 seconds), selected during wakefulness trying to avoid ar-tifacts; care is taken with artifact exclusion, and comparison with raw EEG may help to overcome identification difficulties with digital formats; 2) activation methods and eyes opening and closing are not included; 3) Fast Fourier Transform (FFT) execution of the 20 selected epochs; 4) the program calcu-lates amplitude percentage difference for every electrode pair on each 2 second epoch, and mean differences along the to-tal 40 seconds time will appear on the asymmetry summary; 5) program sequence is: select “Mapas” (brain maps), “Tabelas” (tables), and “Resumo de assimetria” (asymmetry summary). Each group of ten normal adult EEG generated 200 epochs – 20 epochs per EEG and 10 EEG (Figures 6, 7 and 8).
Color brain mapping of absolute frequency bands of the three groups was also analysed, helping to assert the 200 epoch adequate technical quality selection, without gross asymmetries.
An interesting clinical example shows the EEG and AAI table in a patient with breach rhythm12.
rEsuLts
Each group developed offline tables (Figures 6, 7 and 8) showing the four different frequency bands and the measured
Patient ages distribution
30
20
10
019–30years
31–40years
41–50years
51–59years
Total
35
25
15
5
Figure 4. Age distribution of 30 patients.
Diagnostic hypotheses
12
8
4
0Syncope Headache Possible
neurologicalPossible
psychogenicCheckup
14
10
6
2
Figure 5. Number of diagnostic hypotheses of 30 patients.

540 Arq Neuropsiquiatr 2016;74(7):536-543
AAI percentage (%MED) for all electrode pairs. Higher left percentages were shown in red and higher right ones in blue. The %MED comparison shows that AAI percentage is very small in all groups, almost towards symmetry. A
color predominance suggesting more left or right AAI val-ues was not observed. The group tables also show vari-ance and standard deviation, but the mixture of 10 differ-ent patients prevents its clinical usefulness.
Figure 6. Amplitude asymmetry index patient group 1.
Figure 7. Amplitude asymmetry index patient group 2.

541Luccas FJC et al. EEG evaluation by the amplitude asymmetry index
Figure 8. Amplitude asymmetry index patient group 3.
For a better analyses a new table was compiled de-picting only the minimum and maximum percentage AAI (%MED) values, and minima small values ranged from 0.05–2.73% with parasagittal (Fp1-Fp2, F3-F4, C3-C4, P3-P4, and O1-O2) electrode pairs predominance (Table – white cells). Intermediate AAI percentages ranging from 2–3% were sparse (Table – gray cells).
Considering small values close to symmetry carries no pathological decision, more importance will be directed to higher AAI percentage values, which may suggest pathology. Maxima AAI values between 3.73%–6.47% occurred mostly on temporal leads (Table – yellow cells). It is noteworthy to remember that AAI values under 7% measured in CSA power
spectra (μV2) can be reduced to 2.64% applying the normal voltage (μV) after calculating the root mean square.
Mean minima and maxima values for each frequency band are also shown below on Table; minima mean AAI are below 1%, the lowest mean occurring on alpha band (0.67%). The highest mean belongs to delta band (3.16%).
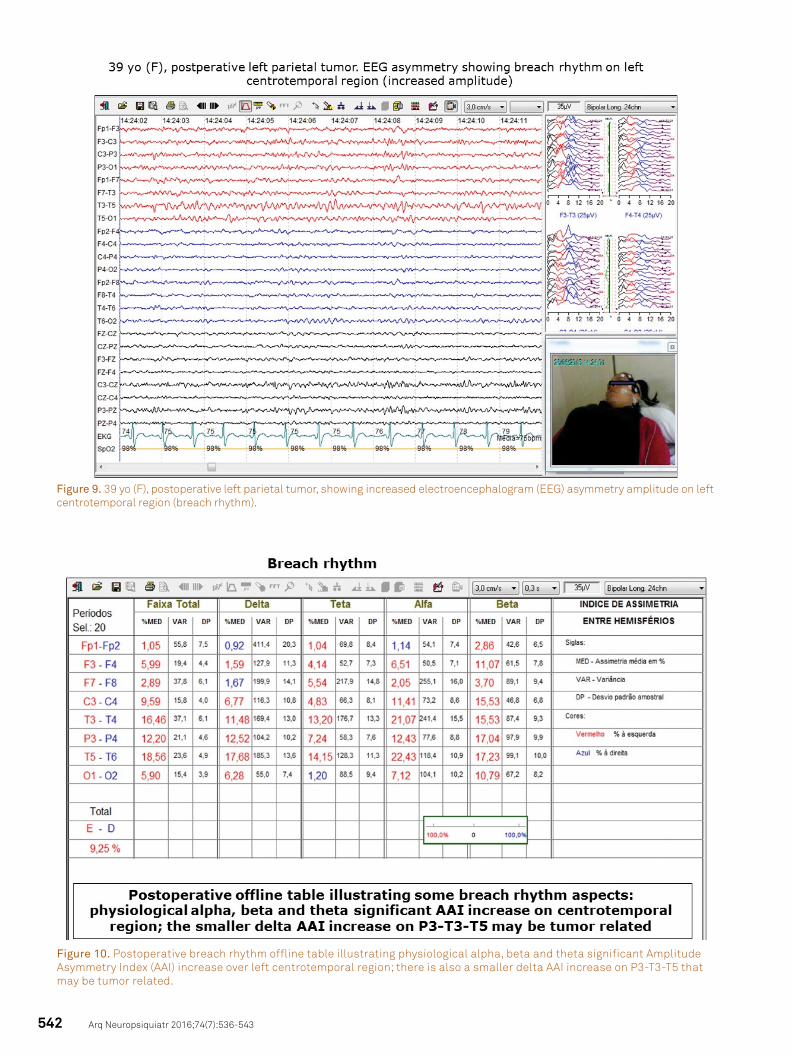
Careful breach rhythm AAI analysis may present clini-cal importance after better background activity definition (Figures 9 and 10). Figure 9 show left leads higher EEG ampli-tude and Figure 10 shows offline table with a left (red) signifi-cant increase of physiological rhythms (alpha, beta, and theta) on centrotemporal region and a smaller slow wave delta AAI P3-T3-T5 increase that may be postoperatively tumor related.
Table. Amplitude asymmetry percentage (AAI) minima and maxima of the different frequency bands.
BandsTotal 0.5–20 Hz Delta 0.5–3.5 Hz Theta 4–7.5 Hz Alpha 8–12.5 Hz Beta 13–20 Hz
< > < > < > < > < >
Fp1-Fp2 0.20 1.37 0.06 2.38 0.80 2.06 0.05 1.68 0.18 1.48
F3-F4 0.52 1.55 0.48 2.08 0.10 2.23 0.07 1.28 0.33 1.69
C3-C4 1.34 2.52 0.96 1.52 1.37 2.99 1.04 3.26 1.35 2.22
P3-P4 0.18 0.82 0.15 0.81 0.17 1.41 0.57 1.14 0.31 1.07
O1-O2 0.08 0.87 1.50 2.61 0.05 1.06 0.06 1.49 0.72 2.04
F7-F8 1.13 5.47 0.56 6.47 2.73 6.42 0.86 3.73 0.50 5.68
T3-T4 1.51 5.40 1.27 5.57 0.89 3.82 0.92 5.03 2.04 6.05
T5-T6 2.33 2.99 1.50 3.86 1.66 2.88 1.83 5.22 0.85 3.14
Mean 0.91 2.62 0.81 3.16 0.97 2.85 0.67 2.85 0.78 2.92
<: minimum; > maxim.
542 Arq Neuropsiquiatr 2016;74(7):536-543
Figure 9. 39 yo (F), postoperative left parietal tumor, showing increased electroencephalogram (EEG) asymmetry amplitude on left centrotemporal region (breach rhythm).
Figure 10. Postoperative breach rhythm offline table illustrating physiological alpha, beta and theta significant Amplitude Asymmetry Index (AAI) increase over left centrotemporal region; there is also a smaller delta AAI increase on P3-T3-T5 that may be tumor related.

543Luccas FJC et al. EEG evaluation by the amplitude asymmetry index
references
1. Niedermeyer E. The normal EEG of the waking adult. In: Niedermeyer E, Silva FL, editors. Electroencephalography: basic principles, clinical applications and related fields. 4th ed. Philadelphia: Lippincott Williams & Wilkins; 1999. p. 149-73.
2. Putten MJAM. The revised brain symmetry index. Clin Neurophysiol. 2007;118:2362-7.
3. Kandel ER. Brain and behavior. In: Kandel ER, Schwartz JH, Jessell TM. Principles of neural science, editors. 3rd Ed. New York: Elsevier; 1991. p. 1-17.
4. Kugler J. La electroencefalografia em la clínica y em la practica. Madrid: Alhambra; 1969. El electroebcefakigrana: elementos gráficos: nomenclatura; p. 39-57.
5. Kellaway P. An orderly approach to visual analysis: the parameters of the normal EEG in adults and children. In: Klass DW, Daly DD, editors., Current practice of clinical electroencephalography. New York: Raven Press; 1979. p. 69-147.
6. Delamonica EA. Electroencefalografía. 2nd ed. Buenos Aires: Libreria El Ateneo; 1984. Chapter 4, El EEG Normal del Adulto; p. 87-130.
7. Aurlien H, Gjerde IO, Aaserth JJ, Eldoen G, Karlsen, B, Skeidsvoll H et al. EEG background activity described by a large computerized database. Clin Neurophysiol. 2004;115(3):665-73. doi:10.1016/j.clinph.2003.10.019
8. Cloostermans MC, Vos CC, Putten MJAM. A novel approach for computer assisted EEG monitoring in the ICU. Clin Neurophysiol. 2011;122(10):2100-9. doi:10.1016/j.clinph.2011.02.035
9. Finnigan S, Putten MJAM. EEG in ischaemic stroke: quantitative EEG can uniquely inform (sub)-acute prognoses and clinical management. Clin Neurophysiol. 2013;124(1):10-19. doi:10.1016/j.clinph.2012.07.003
10. Lodder SS, Putten MJAM. Quantification of the adult EEG background pattern. Clin Neurophysiol. 2013;124(2):228-37. doi:10.1016/j.clinph.2012.07.007
11. Bickford RG, Billinger TW, Fleming NI, Stewart F. The compressed spectral array (CSA): a pictorial EEG. Proc San Diego Biomed Symp. 1972;11:365-70.
12. Myslobodsky MS, Coppola R, Bar-Ziv J, Weinberger DR. Adequacy of the International 10-20 Electrode System for Computed Neurophysiologic Topography. J Clin Neurophysiol. 1990;7(4):507-18.
13. Brigo F, Cicero R, Fiaschi A, Bongiovanni LG. The breach rhythm. Clin Neurophysiol. 2011;122(11):2116-20. doi:10.1016/j.clinph.2011.07.024
DisCussion
International 10–20 system of EEG electrodes placement based on bone and facial landmarks uses proportional distances as a standard guideline in clinical neurophysiology. The system was predominantly developed for major sulci, but do not exact-ly represent the subjacent cerebral areas. Myslobodsky et al.12 showed enormous differences between electrode position and markers such as the longitudinal fissure and falx position, the inion localization, and the relationship between temporal elec-trodes and sylvian fissure. Indications also exist that EEG asym-metries are related to skull thickness and to the amount of cor-tex buried in the fissures of the two sides12.
EEG frequency bands asymmetries historically received more attention than amplitudes, considered far less impor-tant, and on occasion it was assumed that hemispherical (skull) asymmetries do not exert a major role in routine EEG.
Envisaging automated EEG analysis development, BSI was employed together with other parameters such as al-pha rhythm frequency, reactivity, anteroposterior gradients, asymmetries, and diffuse slow-wave activity. Nevertheless, the automated system presents some drawbacks when con-sidering amplitude asymmetries: different hemispherical re-gions were not individualized, amplitude asymmetries on other frequency bands were not discussed, lack of exact defi-nition of zero (perfect symmetry) and 1 (perfect asymmetry), and a rather subjective affirmation of “symmetric”, “slightly asymmetric”, or “asymmetric” without defining the limits2,8.
Initially intended for critical care application, it was soon de-cided to routinely apply the Video Monitor EEG EQSA260 pro-gram to all patients, and our work derived from clinical EEG routine observation of occasionally larger online amplitude asymmetry values. Adequately correlated to localized brain
lesions diagnosis, routine EEG analysis simultaneously recorded with CSA spectral analysis, accompanied by online amplitude asymmetry index permit better characterize the EEG. To attain better parameterization and define normal adult AAI limits, an offline table was created to demonstrate differences among electrode pairs on classical EEG frequency bands. Whenever a more precise AAI is necessary a quick table is offline construct-ed, helping to observe on which frequency bands the asymme-try is present. Correlation of these formats simultaneously re-corded with dEEG well known established values may amplify clinical neurophysiology information. AAI is physiologically low in normal adults, some regions (parasagittal) with values below 2%, and not surpassing 7% even on regions where it is higher (temporal). AAI values exceeding 7% may be helpful to detect the occurrence of lower grade asymmetries.
EEG after craniotomy is difficult to interpret because of the presence of a breach rhythm consisting of unfiltered higher voltage physiological waveforms, sometimes with a spiky mor-phology and frequently associated with a few slow waves mim-icking abnormalities. Brigo et al.13 recommended the adoption of a “conservative” reading, not misinterpreting the EEG as pathological. AAI offline tables permit more detailed definition of the breach rhythm composition, helping to reduce errors13.
Future studies may be directed to compare two succes-sive EEG of the same patient, refining the concept of im-provement or deterioration.
Acknowledgements
Dr. Luiz Calistro Balestrassi supplied the EEG program. Dr. Daniel Cibils made valuable suggestions concerning the study of EEG symmetry.