Today: The Electroencephalogramapsychoserver.psychofizz.psych.arizona.edu/JJBA... ·...
109
Today: The Electroencephalogram
Transcript of Today: The Electroencephalogramapsychoserver.psychofizz.psych.arizona.edu/JJBA... ·...

Today:
The Electroencephalogram

Announcements 3/21/16
Papers: 1 or 2 paragraph prospectus due no
later than Monday April 4
Lab Tomorrow (EEG!)
3x5 time

The Electroencephalogram
Basics in Recording EEG, Frequency
Domain Analysis and its Applications

Electroencephalogram (EEG)
The EEG--an oscillating voltage recorded on scalp
surface
Reflects Large # Neurons
Is small voltage
Bands of activity and behavioral correlates
Gamma 30-50 Hz
Beta 13-30 Hz
Alpha 8-13 Hz
Theta 4-8 Hz
Delta 0.5-4 Hz

Delta 1-4 Hz
Theta 4-7 Hz
Alpha 8-13 Hz
Beta 13-30 Hz
Gamma 30-50 Hz
EMG 70-150 Hz

Utility of EEG
Relatively noninvasive
Excellent time resolution
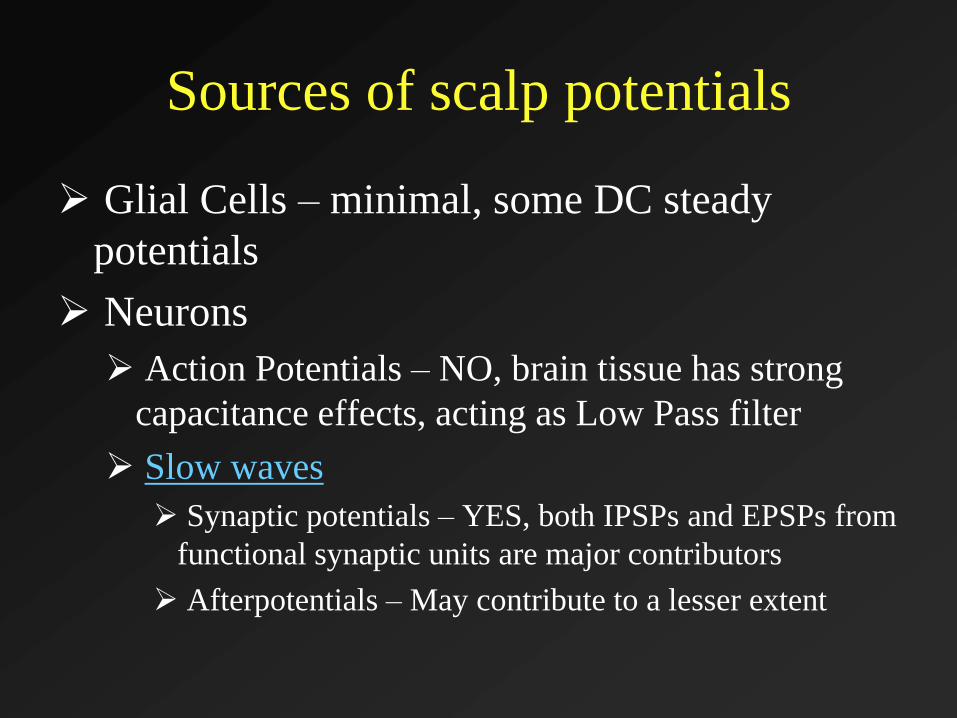
Sources of scalp potentials
Glial Cells – minimal, some DC steady
potentials
Neurons
Action Potentials – NO, brain tissue has strong
capacitance effects, acting as Low Pass filter
Slow waves
Synaptic potentials – YES, both IPSPs and EPSPs from
functional synaptic units are major contributors
Afterpotentials – May contribute to a lesser extent


Alpha and Synchronization
Why Alpha?
It is obvious and hard to miss!
Accounts for ~70% of EEG activity in adult human brain
From where, Alpha?
Historically, thought to be thalamocortial looping
Adrian (1935) demolished that theory
Recorded EEG simultaneously in cortex and thalamus
Damage to cortex did not disrupt thalamic alpha rhythmicity
Damage to thalamus DID disrupt cortical alpha rhythmicity
Thalamic rhythmicity remains even in decorticate preparations (Adrian, 1941)
Removal of ½ thalamus results in ipsilateral loss of cortical alpha
Next
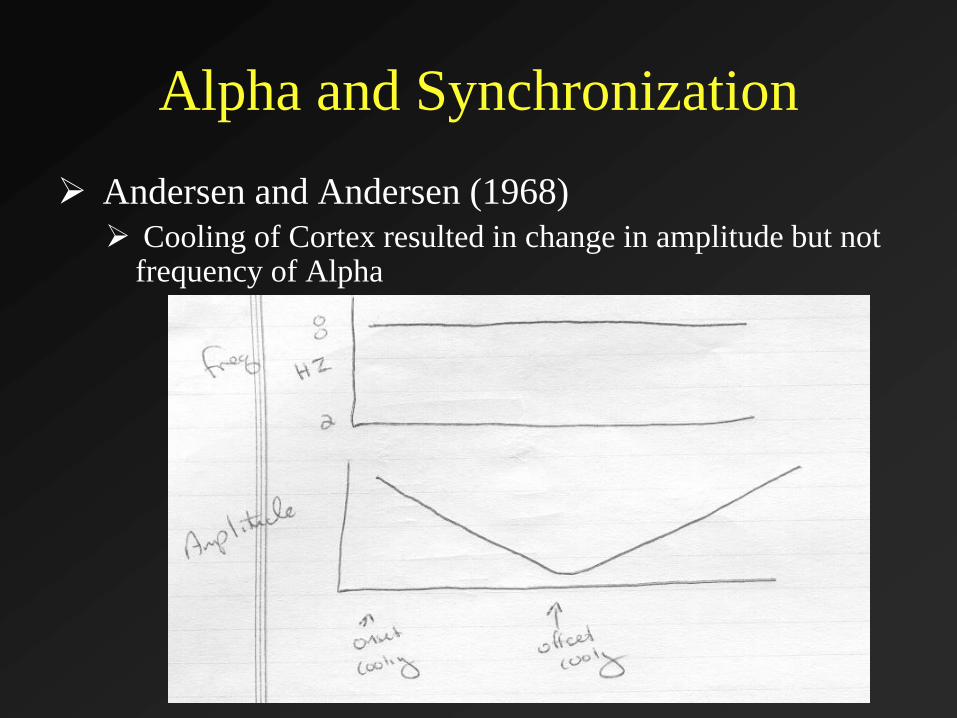
Alpha and Synchronization
Andersen and Andersen (1968)
Cooling of Cortex resulted in change in amplitude but not frequency of Alpha

Alpha and Synchronization
Andersen and Andersen (1968)
Cooling of Thalamus resulted in change in amplitude and frequency of Alpha at both thalamus and cortex
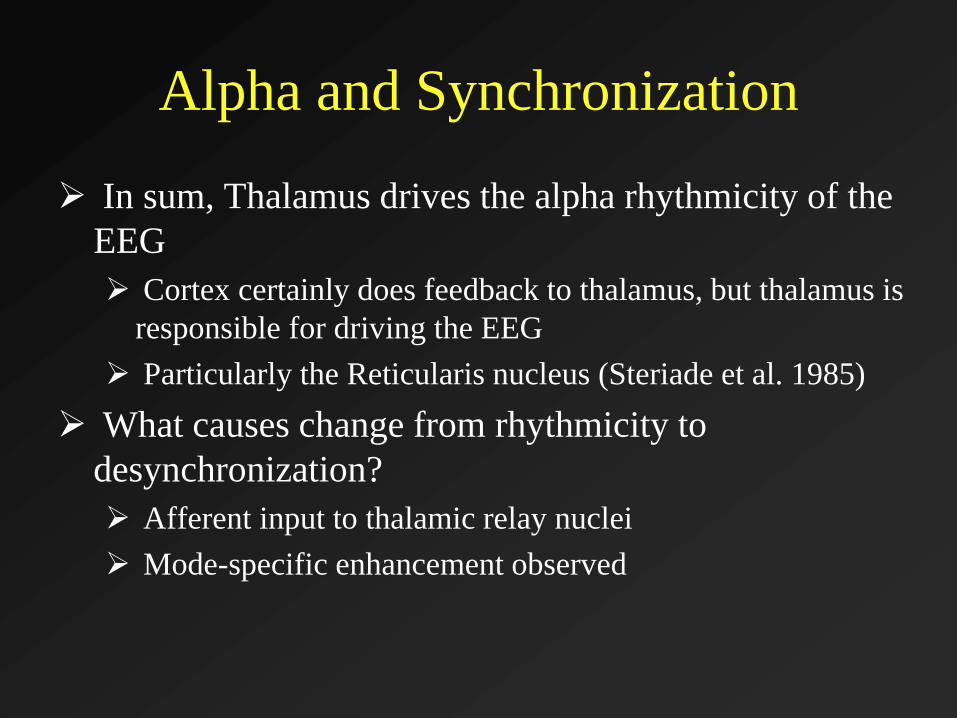
Alpha and Synchronization
In sum, Thalamus drives the alpha rhythmicity of the
EEG
Cortex certainly does feedback to thalamus, but thalamus is
responsible for driving the EEG
Particularly the Reticularis nucleus (Steriade et al. 1985)
What causes change from rhythmicity to
desynchronization?
Afferent input to thalamic relay nuclei
Mode-specific enhancement observed
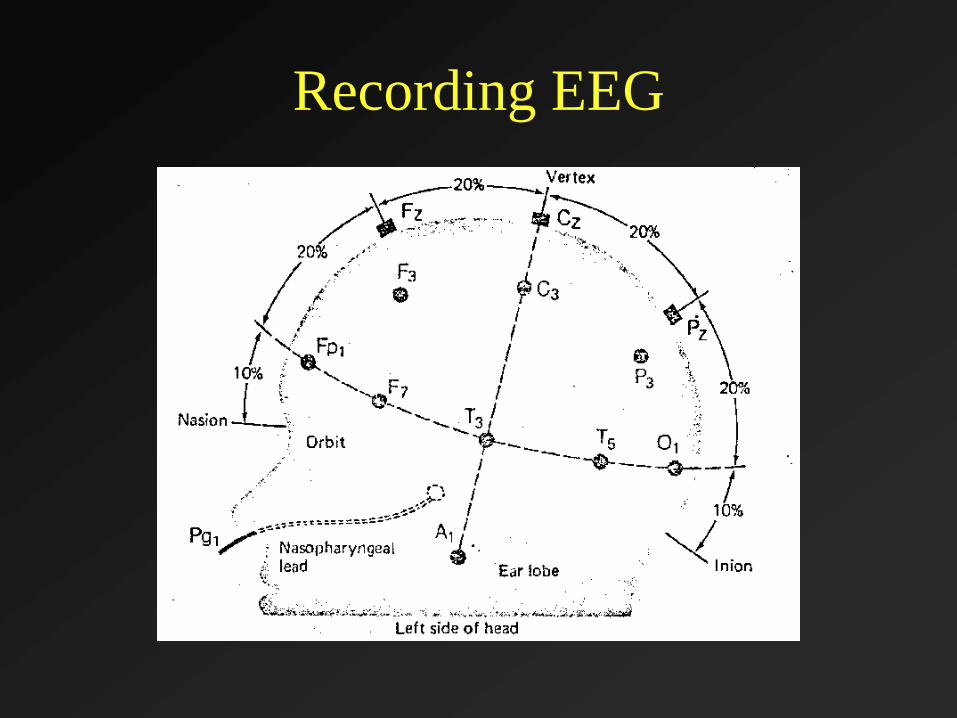
Recording EEG

Recording EEG

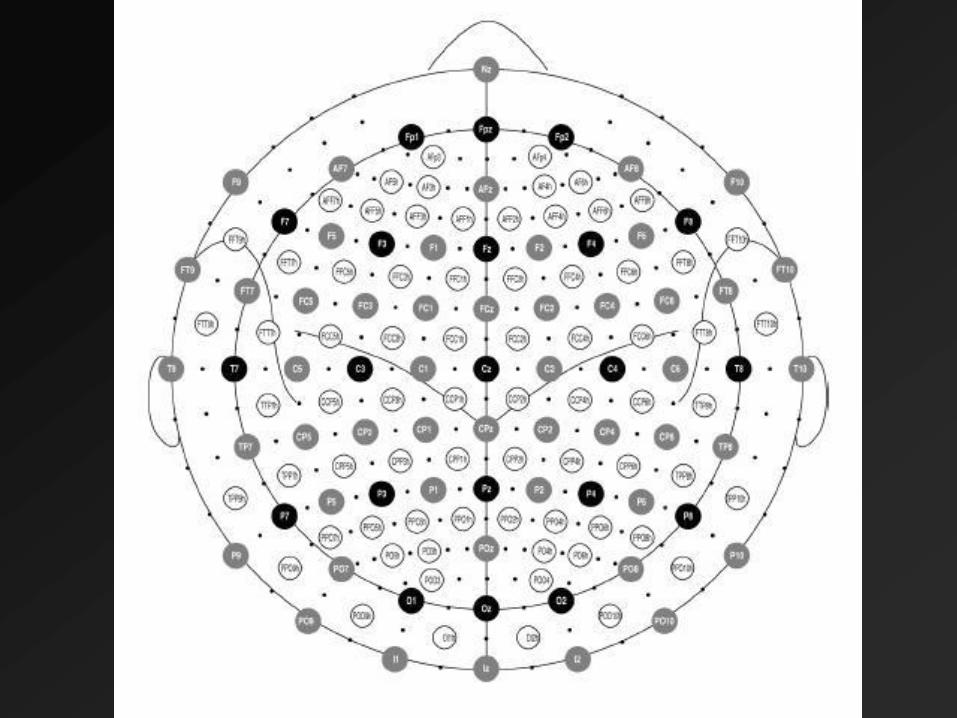

Systems are surface-based, not
anatomically-based

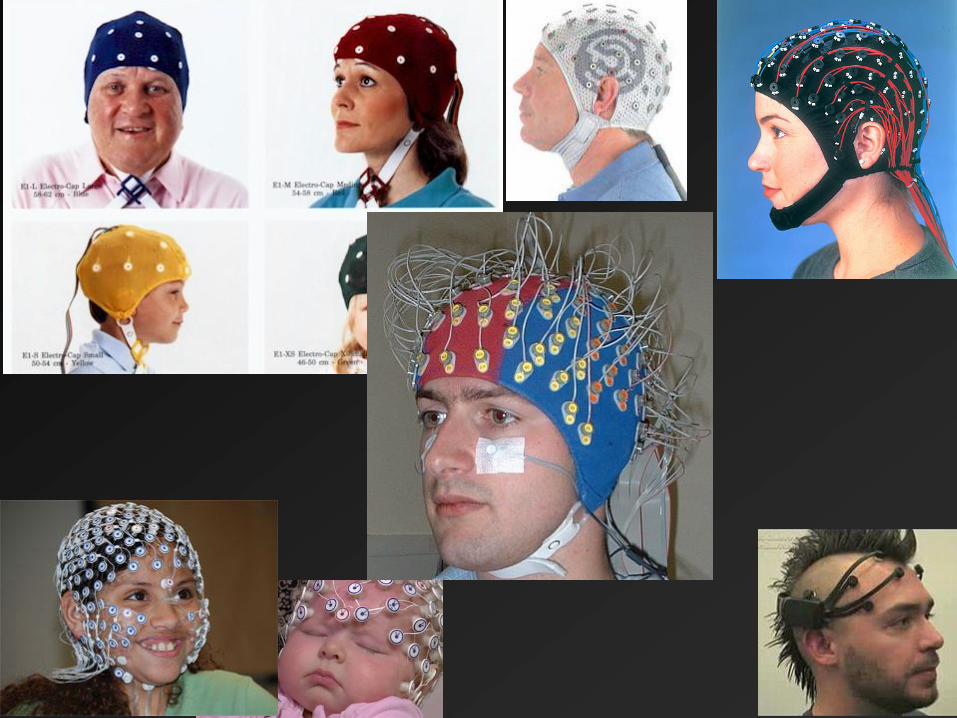
Electrodes, Electrolyte, Preparation
Ag-AgCl preferred, Gold OK if slowest frequencies not of interest
Polarizing electrodes act as capacitors in series with signal
Electrolyte: ionic, conductive
Affixing
Subcutaneous needle electrodes (OUCH)
Collodion (YUCK)
EC-2 paste; lesser of the evils
Electrocap

Recording References Measure voltage potential differences
Difference between what and what else?
“Monopolar” versus Bipolar
No truly inactive site, so monopolar is a relative term
Relatively monopolar options
Body – BAD IDEA
Head
Linked Ears or Mastoids
Tip of Nose
Reference choice nontrivial (more later) as it will change your ability to observe certain signals

Recording References Bipolar recording
Multiple active sites
Sensitive to differences between electrodes
With proper array, sensitive to local fluctuations (e.g. spike localization)
Off-line derivations
Averaged Mastoids
Average Reference (of EEG Leads)
With sufficient # electrodes and surface coverage, approximates inactive site (signals cancel out)
Artifacts “average in”
Current Source Density (more in advanced topics)

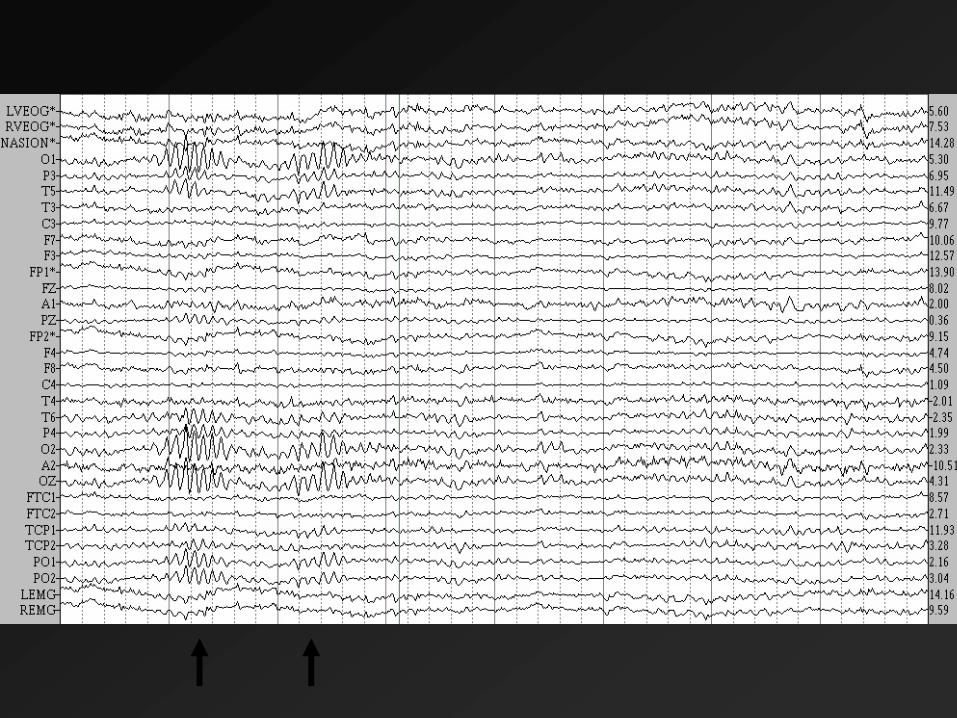
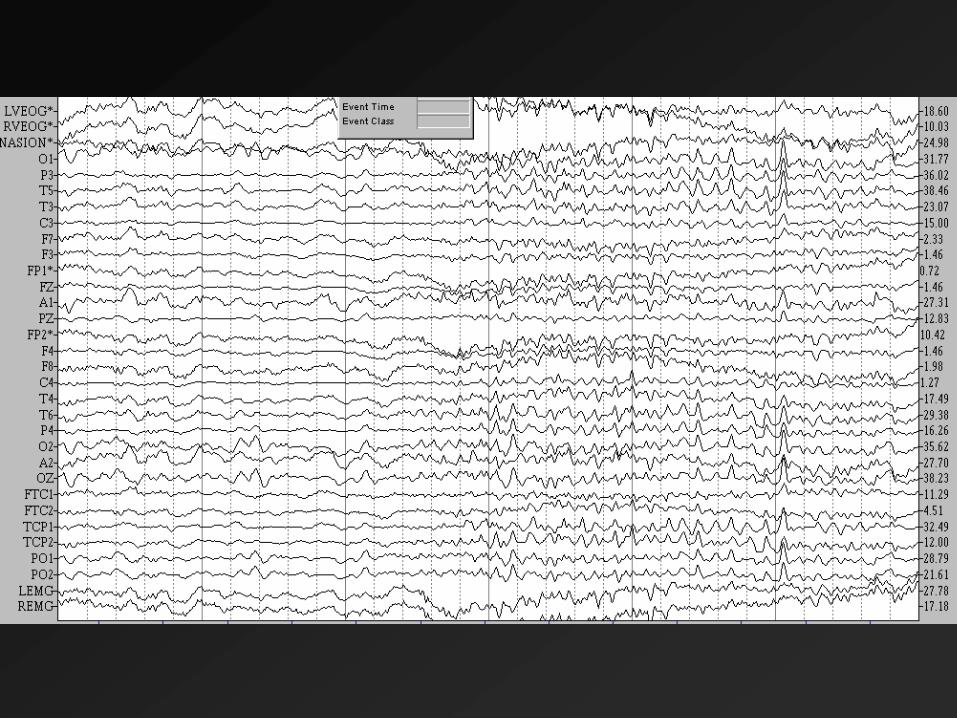
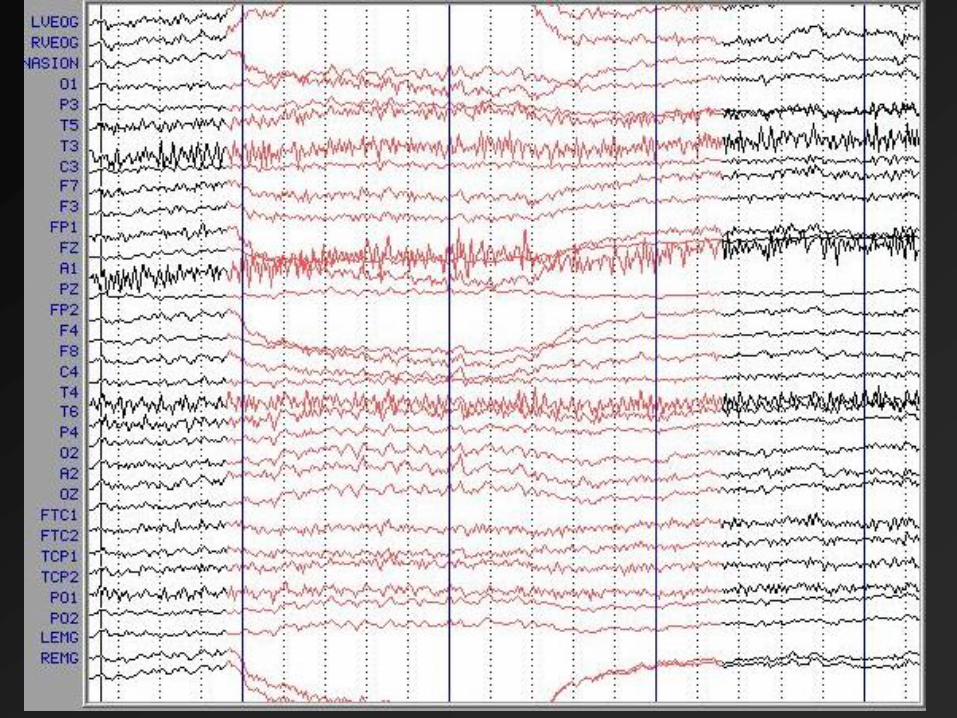
Dreaded Artifacts Three sources
60-cycle noise
Ground subject
60 Hz Notch filter
Muscle artifact
No gum!
Use headrest
Measure EMG and reject/correct for influence
Eye Movements
Eyes are dipoles
Reject ocular deflections including blinks
Use correction procedure (more in advance lecture)

Name
That
Artifact!


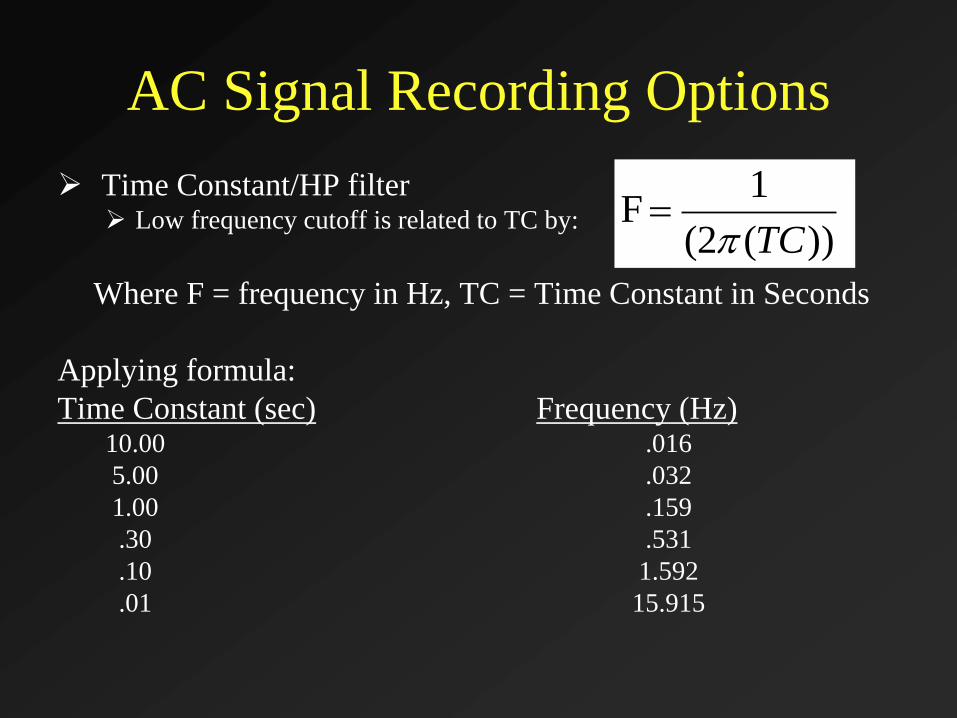
AC Signal Recording Options
Time Constant/HP filter Low frequency cutoff is related to TC by:
Where F = frequency in Hz, TC = Time Constant in Seconds
Applying formula:
Time Constant (sec) Frequency (Hz)10.00 .016
5.00 .032
1.00 .159
.30 .531
.10 1.592
.01 15.915
))((2
1 F
TC


Hi Frequency/LP Settings
Do not eliminate
frequencies of interest
Polygraphs have
broad roll-off
characteristics
Be mindful of
digitization rate (more
info soon!)

Digital Signal Acquisition
Analog Vs Digital Signals
Analog
Continuously varying voltage as fxn of time
Discrete Time
Discrete points on time axis, but full range in amplitude
Digital
Discrete time points on x axis represented as a limited
range of values (usally 2x, e.g 212 = 4096)

A/D converters Schmidt Trigger as simple example
The A/D converter (Schematic diagram)
Multiplexing (several channels); A/D converter is serial processor
Result is a vector [1 x n samples] of digital values for each channel ( [x(t0), x(t1), x(t2),...,x(tn-1)]
12 bit converters allow 212 = 4096 values
16 bit converters allow 216 = 65536 values
12 bit is adequate for EEG
4096 values allow 1 value for each ~0.02 μvolts of scalp voltage (depending upon sensitivity of amplifier, which will amplify signal ~20,000 times before polygraph output)
e.g.,
2.1130 μvolts => 2481 D.U.'s (2480.74)
2.1131 μ volts => 2481 D.U.'s (2480.76)
2.1250 μ volts => 2483 D.U.'s (2483.20)


The Problem of Aliasing Definition To properly represent a signal, you must sample at a
fast enough rate.
Nyquist’s (1928) theorem
a sample rate twice as fast as the highest signal frequency will capture that signal perfectly
Stated differently, the highest frequency which can be accurately represented is one-half of the sampling rate
This frequency has come to be known as the Nyquist frequency and equals ½ the sampling rate
CommentsWave itself looks distorted, but frequency is captured
adequately.
Frequencies faster than the Nyquist frequency will not be adequately represented
Minimum sampling rate required for a given frequency signal is known as Nyquist sampling rate Harry Nyquist

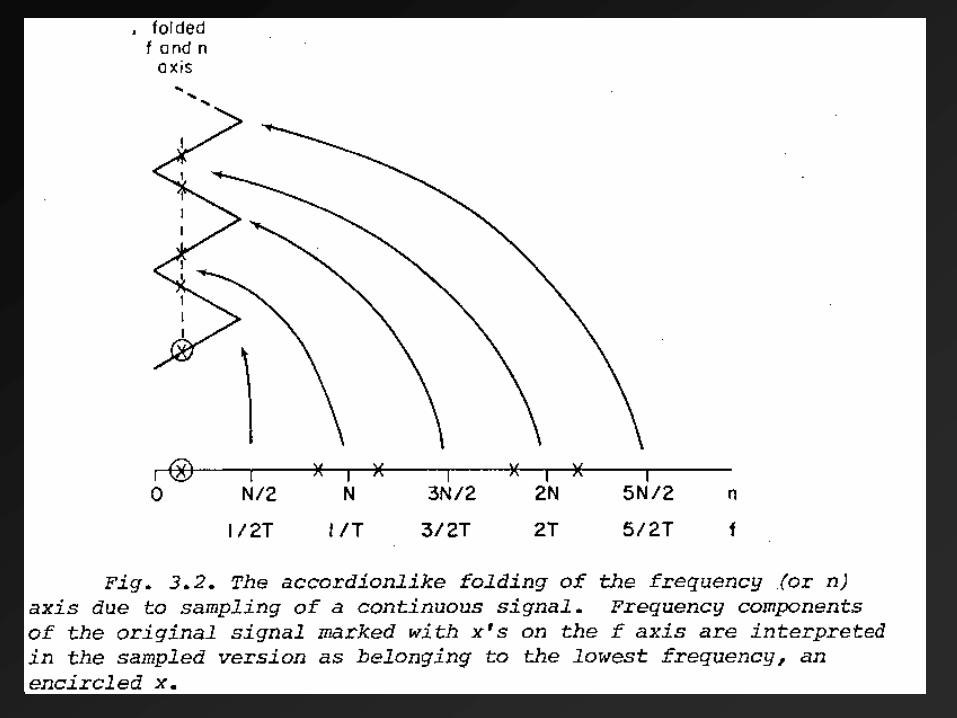
Aliasing and the Nyquist Frequency
In fact, frequencies above Nyquist frequency
represented as frequencies lower than Nyquist
frequency
FNy + x Hz will be seen as FNy - x Hz
“folding back”
frequency 2FNy seen as 0,
frequency 3FNy will be seen as FNy
accordion-like folding of frequency axis


-1.2
-0.8
-0.4
0
0.4
0.8
1.2
1.25 hz
1.0 hz
1.5 Hz
Aliasing Demo (Part 1, 10 Hz Sampling Rate)

-1.2
-0.8
-0.4
0
0.4
0.8
1.2
1.25 hz
1.0 hz
1.5 Hz
Aliasing Demo (Part 2, 2.5 Hz Sampling Rate)

Matlab Demo of Aliasing

Solutions to Aliasing
Sample very fast
Use anti-aliasing filters
KNOW YOUR SIGNAL!

Time Domain Vs Frequency Domain
Analysis
Frequency Domain Analysis involves characterizing the signal in terms of its component frequencies
Assumes periodic signals
Periodic signals (definition):
Repetitive
Repetitive
Repetition occurs at uniformly spaced intervals of time
Periodic signal is assumed to persist from infinite past to infinite future


Fourier Series Representation If a signal is periodic, the signal can be expressed as the sum
of sine and cosine waves of different amplitudes and
frequencies
This is known as the Fourier Series Representation of a signal

Fourier Series Representation Pragmatic Details
Lowest Fundamental Frequency is 1/T
Resolution is 1/T
Phase and Power
There exist a phase component and an amplitude component to the
Fourier series representation
Using both, it is possible to completely reconstruct the waveform.
Psychophysiologists often interested in amplitude component:
Power spectrum; for each frequency n/T
|Ampcos2 + Ampsin
2|
Amplitude Spectrum (may conform better to assumptions of statistical
procedures); for each frequency n/T
|Ampcos2 + Ampsin
2|1/2

Time Domain Frequency Domain

Averaging
Multiple
Epochs
improves
ability to
resolve signal
Note noise is twice
amplitude of the signal

Lingering details
In absence of phase information, it is impossible to reconstruct the original signal Infinite number of signals that could produce the same
amplitude or power spectrum
Spectra most often derived via a Fast Fourier transform (FFT); a fourier transform of a discretely sampled band-limited signal with a power of 2 samples
Sometimes autocovariance function is used (a signal covaries with itself at various phase lags; greater covariation at fundamental frequencies)
Windowing: the Hamming Taper

Preventing Spectral Leakage
Use windows
not Micro$oft Windows
Hamming
Hanning
Cosine
Etc.

Hamming Demo
-1.2
-0.8
-0.4
0
0.4
0.8
1.2
Signal
HammingWeights
Result


Matlab Demo of Hamming Window

Pragmatic Concerns
Sample fast enough so no frequencies exceed Nyquist signal bandwidth must be limited to less than Nyquist
Violation = ERROR
Sample a long enough epoch so that lowest frequency will go through at least one periodViolation = ERROR
Sample a periodic signal if subject engaging in task, make sure that subject is
engaged during entire epoch
Violation = ??, probably introduce some additional frequencies to account for change


Demo of EEG Data
CNT Data to Frequency Domain
Representation

Frequency-domain EEG
applications and methodological
considerations

Applications
Emotion Asymmetries
Lesion findings
Catastrophic reaction (LH)
RH damage show a belle indifference
EEG studies
Trait (100+ studies)
State (oodles more studies)

Types of Studies
Trait
Resting EEG asymmetry related to other traits (e.g. BAS)
Resting EEG asymmetry related to psychopathology (e.g. depression)
Resting EEG asymmetry predicts subsequent emotional responses (e.g. infant/mom separation)
State
State EEG asymmetry covaries with current emotional state (e.g., self report, spontaneous emotional expressions)

Trait, Occasion, and State variance Three sources of reliable variance for EEG Asymmetry
Stable trait consistency across multiple assessments
Occasion-specific variance
reliable variations in frontal asymmetry across multiple sessions of measurement
may reflect systematic but unmeasured sources such as current mood, recent life events and/or factors in the testing situation.
State-specific variance
changes within a single assessment that characterize
the difference between two experimental conditions
the difference between baseline resting levels and an experimental condition.
conceptualized as proximal effects in response to specific experimental manipulations
should be reversible and of relatively short duration
Unreliability of Measurement (small)
Allen, Coan, & Nazarian 2004

Hamming Window Overlap (D)
0
0.2
0.4
0.6
0.8
1
0.0 0.5 1.0 1.5 2.0 2.5 3.0 3.5 4.0 4.5
Seconds
We
igh
t
-0.1
0.4
0.9
1.4
1.9
2.4
-50
-30
-10
10
30
50
0 0.5 1 1.5 2 2.5 3 3.5 4 4.5 5 5.5 6 6.5 7 7.5 8 8.5 9 9.5 10Seconds
Mic
rovo
lts
Raw EEG (A)
0 0.5 1 1.5 2
0.5 1 1.5 2 2.5
1 1.5 2 2.5 3
…
Creation of
Overlapping Epochs (B)
Power Spectrum (A)
0
5
10
15
20
25
30
35
40
0 5 10 15 20 25 30Hz
Effect of Averaging Power Spectra (E)
-5000000
15000000
35000000
55000000
75000000
95000000
0 5 10 15 20 25Hz
μV2μV
Impact of Hamming Window (C)
-30
-20
-10
0
10
20
30
0 0.5 1 1.5 2Seconds
-0.8
-0.6
-0.4
-0.2
0
0.2
0.4
0.6
0.8
1
μV

Oakes et al, 2004, Human Brain Mapping
Alpha Vs Activity Assumption (AAA)
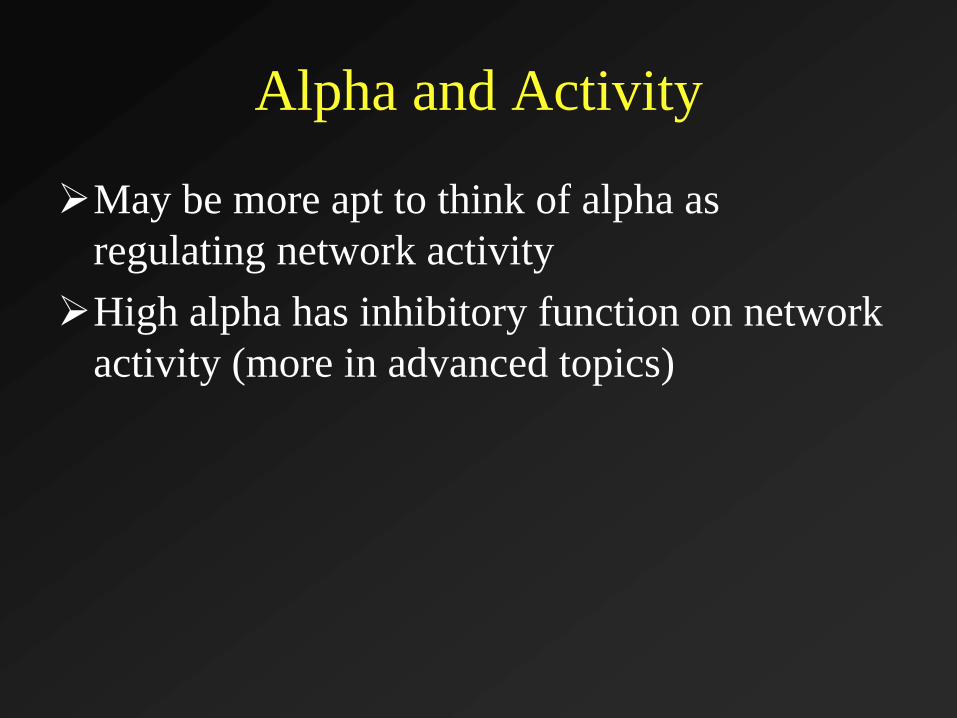
Alpha and Activity
May be more apt to think of alpha as
regulating network activity
High alpha has inhibitory function on network
activity (more in advanced topics)

EEG Asymmetry,
Emotion, and Psychopathology

“During positive affect, the frontal
leads display greater relative left
hemisphere activation compared with
negative affect and vice versa”

Left Hypofrontality in Depression
Henriques & Davidson (1991); see also, Allen et al. (1993), Gotlib et al. (1998);
Henriques & Davidson (1990); Reid Duke and Allen (1998); Shaffer et al (1983)

Individual
Subjects’ Data
Henriques & Davidson (1991)
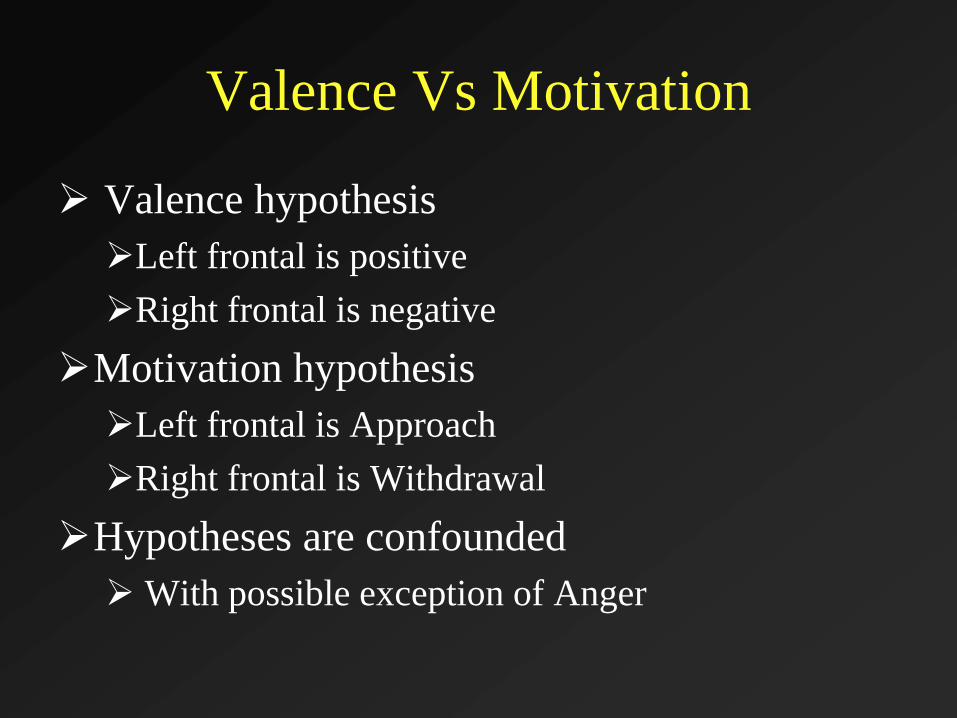
Valence Vs Motivation
Valence hypothesis
Left frontal is positive
Right frontal is negative
Motivation hypothesis
Left frontal is Approach
Right frontal is Withdrawal
Hypotheses are confounded
With possible exception of Anger
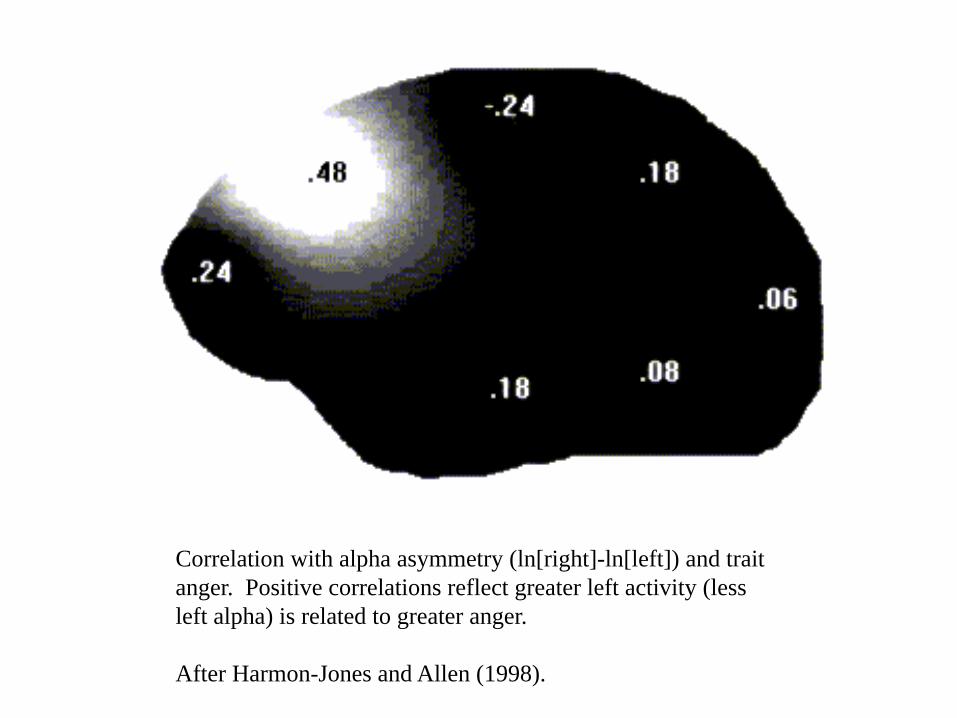
Correlation with alpha asymmetry (ln[right]-ln[left]) and trait
anger. Positive correlations reflect greater left activity (less
left alpha) is related to greater anger.
After Harmon-Jones and Allen (1998).
State Anger and
Frontal Asymmetry
Would situationally-induced anger relate to
relative left frontal activity?
Harmon-Jones & Sigelman, JPSP, 2001

Method
Cover story: two perception tasks – person perception
& taste perception
Person perception task – participant writes essay on
important social issue; another ostensible participant
gives written feedback on essay
Feedback is neutral or insulting
negative ratings + “I can’t believe an educated person
would think like this. I hope this person learns something
while at UW.”
Harmon-Jones & Sigelman, JPSP, 2001

Record EEG immediately after feedback
Then, taste perception task, where
participant selects beverage for other
participant, “so that experimenter can
remain blind to type of beverage.”
6 beverages; range from pleasant-tasting
(sweetened water) to unpleasant-tasting
(water with hot sauce)
Aggression measure
Harmon-Jones & Sigelman, JPSP, 2001

Harmon-Jones & Sigelman, JPSP, 2001

-0.7
-0.5
-0.3
-0.1
0.1
0.3
Neutral Insult
Standard
Scores
Relative Left Frontal, Anger, & Aggression
as a Function of Condition
Left Frontal
Anger
Aggression
Harmon-Jones & Sigelman, JPSP, 2001
Harmon-Jones & Sigelman, JPSP, 2001
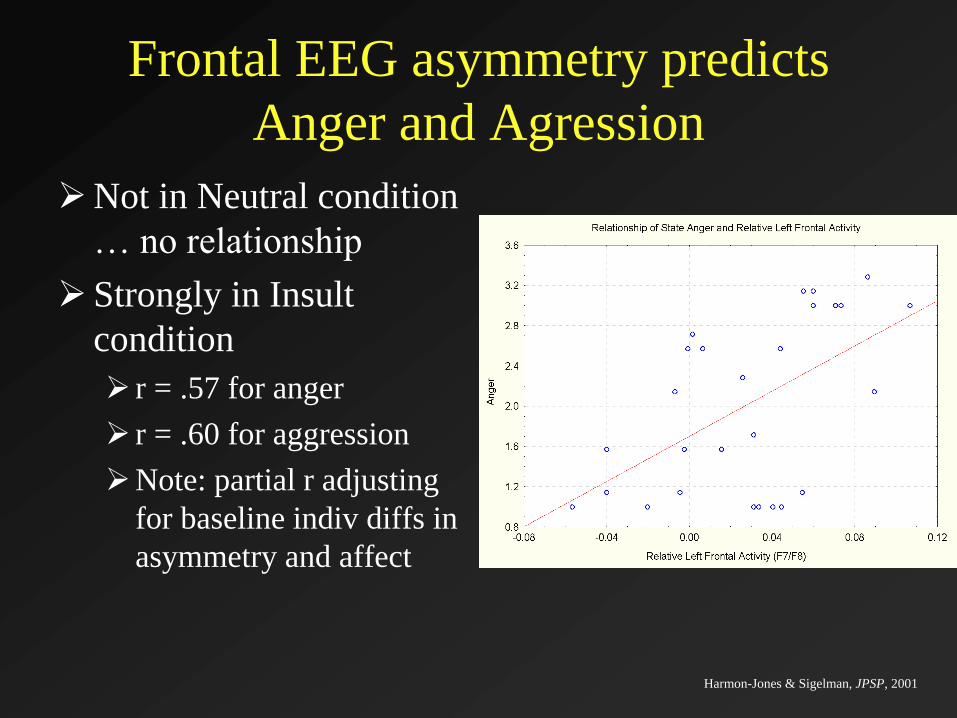
Frontal EEG asymmetry predicts
Anger and Agression
Not in Neutral condition
… no relationship
Strongly in Insult
condition
r = .57 for anger
r = .60 for aggression
Note: partial r adjusting
for baseline indiv diffs in
asymmetry and affect
Manipulation of EEGPeterson, Shackman, Harmon-Jones (2008)
Hand contractions to activate contralateral premotor cortex
Insult about essay (similar to Harmon-Jones & Sigelman, JPSP, 2001) followed by chance to give aversive noise blasts to the person who insulted them
Hand contractions:
altered frontal asymmetry as predicted
Altered subsequent aggression (noise blasts)
Asymmetry duruing hand contractions predicted aggression

Peterson, Shackman, Harmon-Jones (2008)
The BAS/BFS/Approach System
sensitive to signals of
conditioned reward
nonpunishment
escape from punishment
Results in:
driven pursuit of appetitive stimuli
appetitive or incentive motivation
Decreased propensity for depression (Depue &
Iacono, 1989; Fowles 1988)
Motivational Styles and Depression
Behavioral Activation Scale
Reward Responsiveness
When I see an opportunity for something I like, I get
excited right away.
Drive
I go out of my way to get things I want.
Fun Seeking
I'm always willing to try something new if think it
will be fun.
Carver & White, 1994

Motivational Styles and Depression
Harmon-Jones & Allen, 1997
r = .45Mid-Frontal Asymmetry and BAS Scores
Mid-Frontal Asymmetry and PA Scores
r = .00

Motivational Styles and Depression
Replications
Sutton & Davidson, 1997
Correlations with alpha asymmetry (ln[right]-ln[left]) and self-
reported BAS scores (right) or BAS-BIS (left).
Positive correlations reflect greater left activity (less left alpha) is
related to greater BAS scores or greater BAS-BIS difference
Coan & Allen, 2003

L>R Activity (R>L Alpha) characterizes:
an approach-related motivational style (e.g. Harmon-Jones
& Allen, 1997; Sutton & Davidson, 1997)
higher positive affect (e.g. Tomarken, Davidson, Wheeler, & Doss,
1992)
higher trait anger (e.g. Harmon-Jones & Allen, 1998)
lower shyness and greater sociability (e.g. Schmidt & Fox,
1994; Schmidt, Fox, Schulkin, & Gold, 1999)

R>L Activity (L>R Alpha) characterizes:
depressive disorders and risk for depression (e.g. Allen,
Iacono, Depue, & Arbisi, 1993; Gotlib, Ranganath, & Rosenfeld, 1998;
Henriques & Davidson, 1990; Henriques & Davidson, 1991 but see also
Reid, Duke, & Allen, 1998
certain anxiety disorders (e.g. Davidson, Marshall, Tomarken, &
Henriques, 2000; Wiedemann et al., 1999)

Correlations ≠ Causality
Study to manipulate EEG Asymmetry
Five consecutive days of biofeedback training (R vs L) Nine subjects trained “Left”; Nine “Right”
Criterion titrated to keep reinforcement equal
Tones presented when asymmetry exceeds a threshold, adjusted for recent performance
Films before first training and after last training

Manipulation of EEG asymmetry with biofeedback produced differential change across
5 days of training; Regression on Day 5
Training Effects: Asymmetry Scores
-0.1
-0.08
-0.06
-0.04
-0.02
0
0.02
0.04
0.06
0.08
0.1
Day 1 Day 2 Day 3 Day 4 Day 5
Ba
se
lin
e A
dj.
R-L
Alp
ha
Right
Left
From Allen, Harmon-Jones, and Cavender (2001)

Despite no differences prior to training, following manipulation of EEG asymmetry with
biofeedback subjects trained to increase left frontal activity report greater positive affect.
Happy Film
0
1
2
3
4
5
6
Interest Amuse Happy Sad Fear Disgust Anger
Emotion
Rati
ng
Right
Left
From Allen, Harmon-Jones, and Cavender (2001)
From Allen, Harmon-Jones, and Cavender (2001)

Manipulation of Asymmetry using Biofeedback
Phase 1: Demonstrate that manipulation of EEG
asymmetry is possible
Phase 2: Determine whether EEG manipulation
has emotion-relevant consequences
Phase 3: Examine whether EEG manipulation
produces clinically meaningful effects
Phase 4: Conduct efficacy trial

Biofeedback provided 3 times per week for 12 weeks
Phase 3a
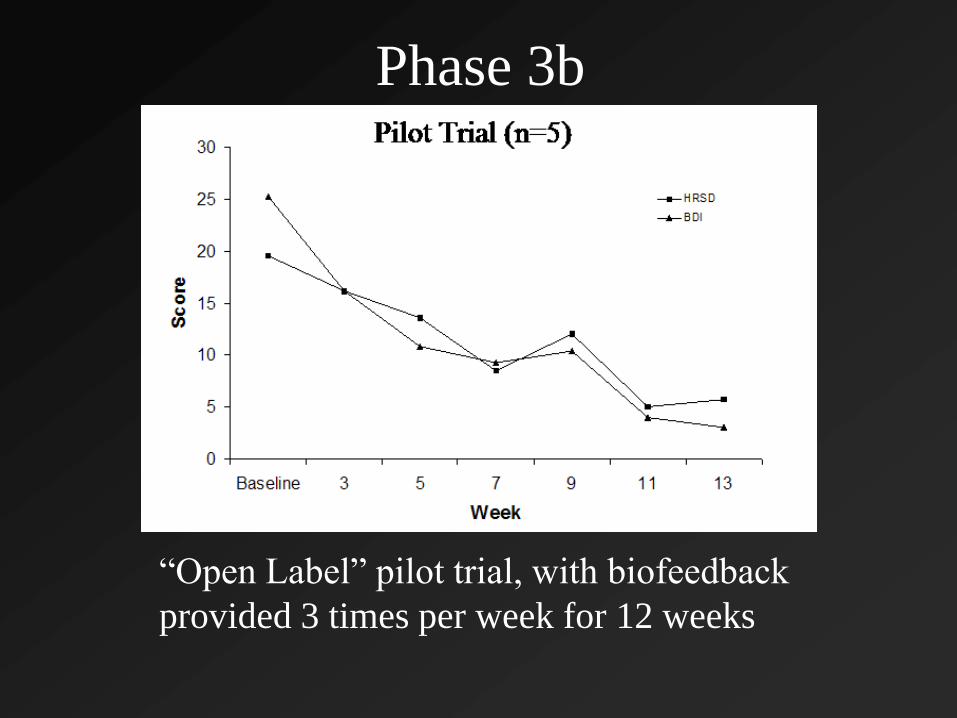
“Open Label” pilot trial, with biofeedback
provided 3 times per week for 12 weeks
Phase 3b

Phase 4: Randomized Control Trial
Depressed subjects ages 18-60 to be
recruited through newspaper ads
Ad offers treatment for depression but does
not mention biofeedback
Participants meet DSM-IV criteria for
Major Depressive Episode (nonchronic)
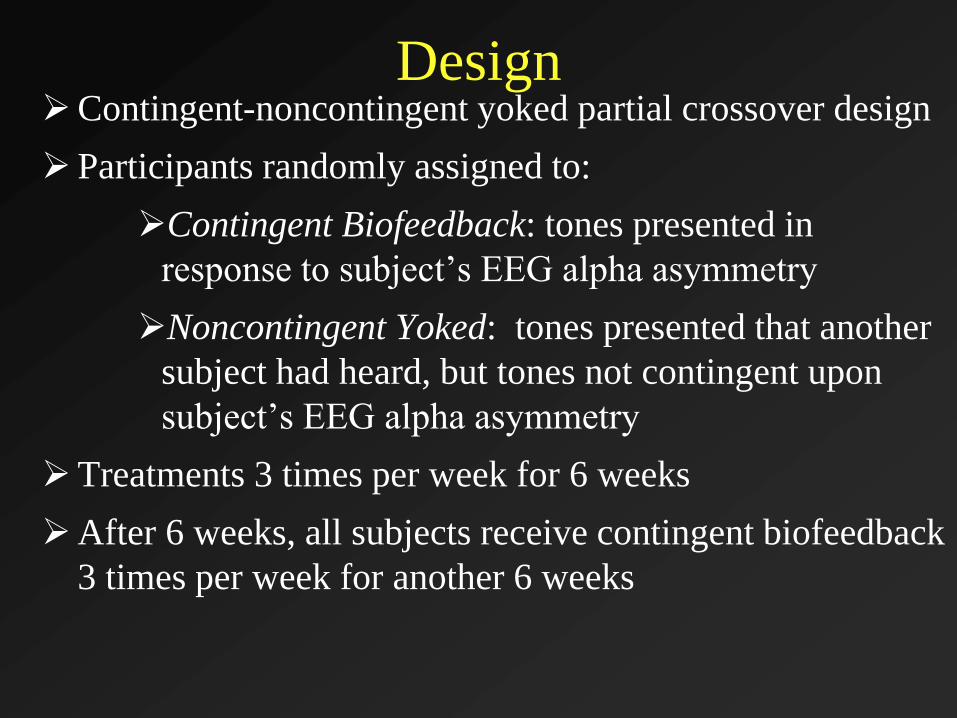
DesignContingent-noncontingent yoked partial crossover design
Participants randomly assigned to:
Contingent Biofeedback: tones presented in
response to subject’s EEG alpha asymmetry
Noncontingent Yoked: tones presented that another
subject had heard, but tones not contingent upon
subject’s EEG alpha asymmetry
Treatments 3 times per week for 6 weeks
After 6 weeks, all subjects receive contingent biofeedback
3 times per week for another 6 weeks
Results

State Changes
Infants
Stanger/Mother paradigm (Fox & Davidson, 1986)
Sucrose Vs water (Fox & Davidson, 1988)
Films of facial expressions (Jones & Fox, 1992;
Davidson & Fox, 1982)
Primates
Benzodiazepines increases LF (Davidson et al.,
1992)

State Changes
Adults
Spontaneous facial expressions (Ekman &
Davidson, 1993; Ekman et al., 1990; Davidson et
al., 1990)
Directed facial actions (Coan, Allen, & Harmon-
Jones, 2001)

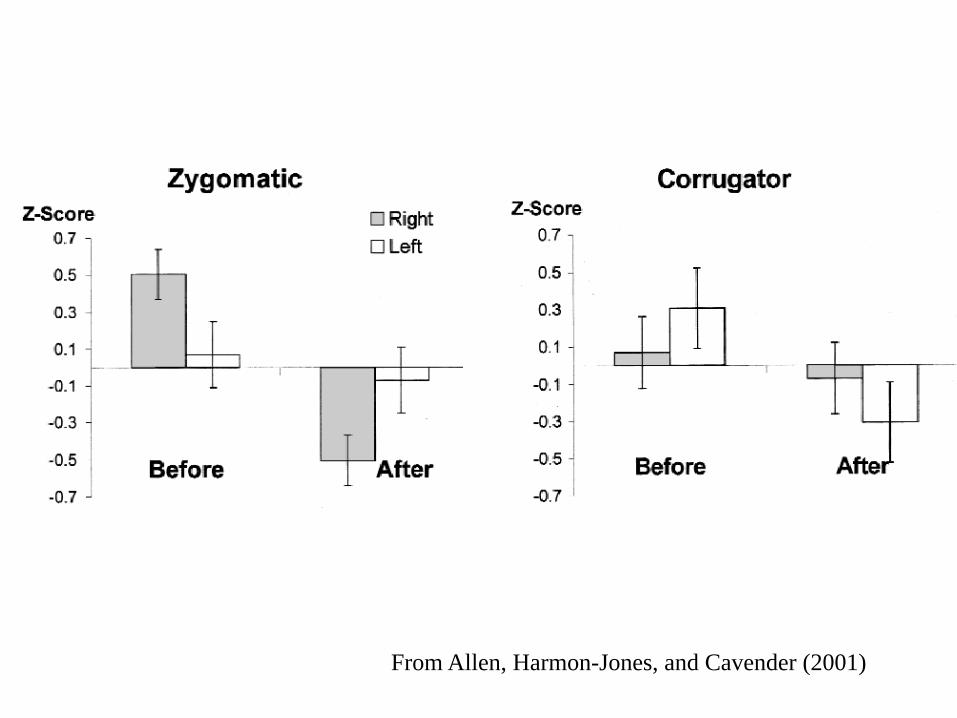
From Coan, Allen, and
Harmon-Jones (2001)
EEG responds
to directed
facial actions

EEG responds
to directed
facial actions
From Coan, Allen, and
Harmon-Jones (2001)
States – how short can they be?


Notes:
• Split Half
• 1000 Iterations
• Mean Fisher Z
• Spearman-Brown


State EEG in CIT!
Matsuda, Nittono, & Allen, Neurosci Letters, 2013