No Time to Lose - c.ymcdn.com · No Time to Lose The Imperatives to Educate A New Majority: Low...
36
No Time to Lose The Imperatives to Educate A New Majority: Low Income Students in Georgia “One by one their seats were emptied…Here the circle has been broken…” ‐ Will the Circle Be Unbroken PAGE Foundation Meeting Georgian Terrace Hotel Atlanta, GA September 21, 2015 © SEF 2015
Transcript of No Time to Lose - c.ymcdn.com · No Time to Lose The Imperatives to Educate A New Majority: Low...
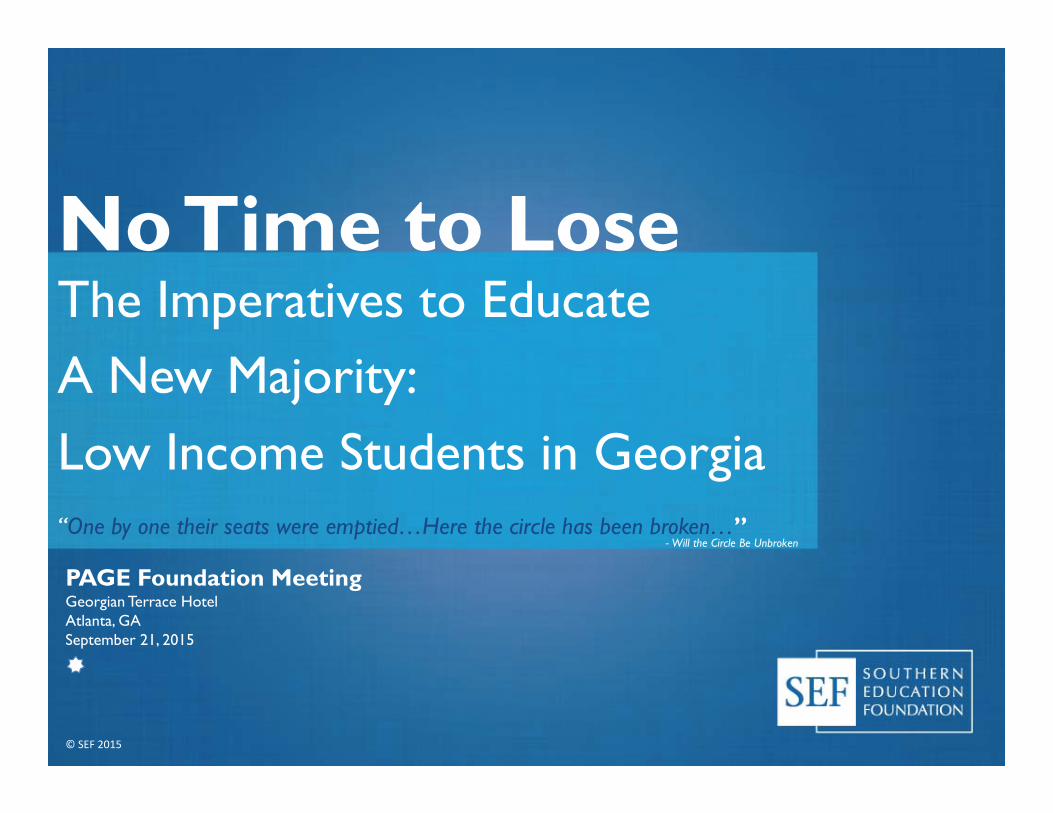
No Time to LoseThe Imperatives to Educate A New Majority: Low Income Students in Georgia“One by one their seats were emptied…Here the circle has been broken…”
‐ Will the Circle Be Unbroken
PAGE Foundation Meeting Georgian Terrace Hotel Atlanta, GA September 21, 2015
© SEF 2015
www.SouthernEducation.org2
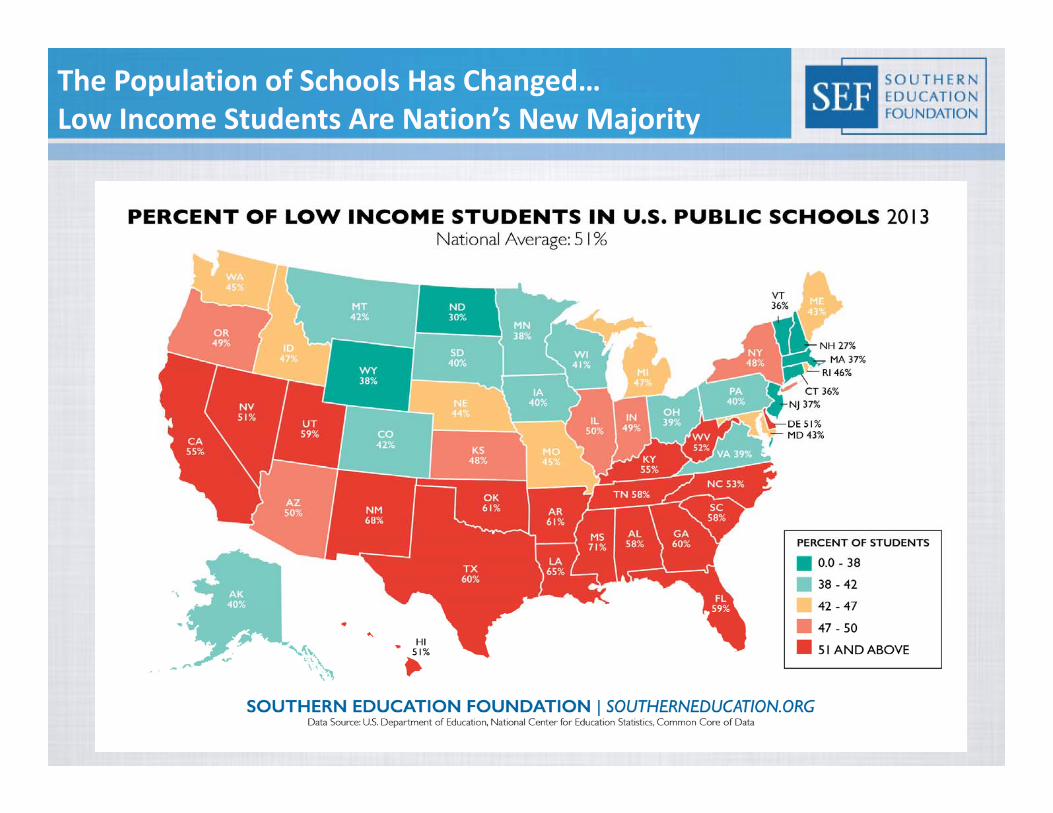
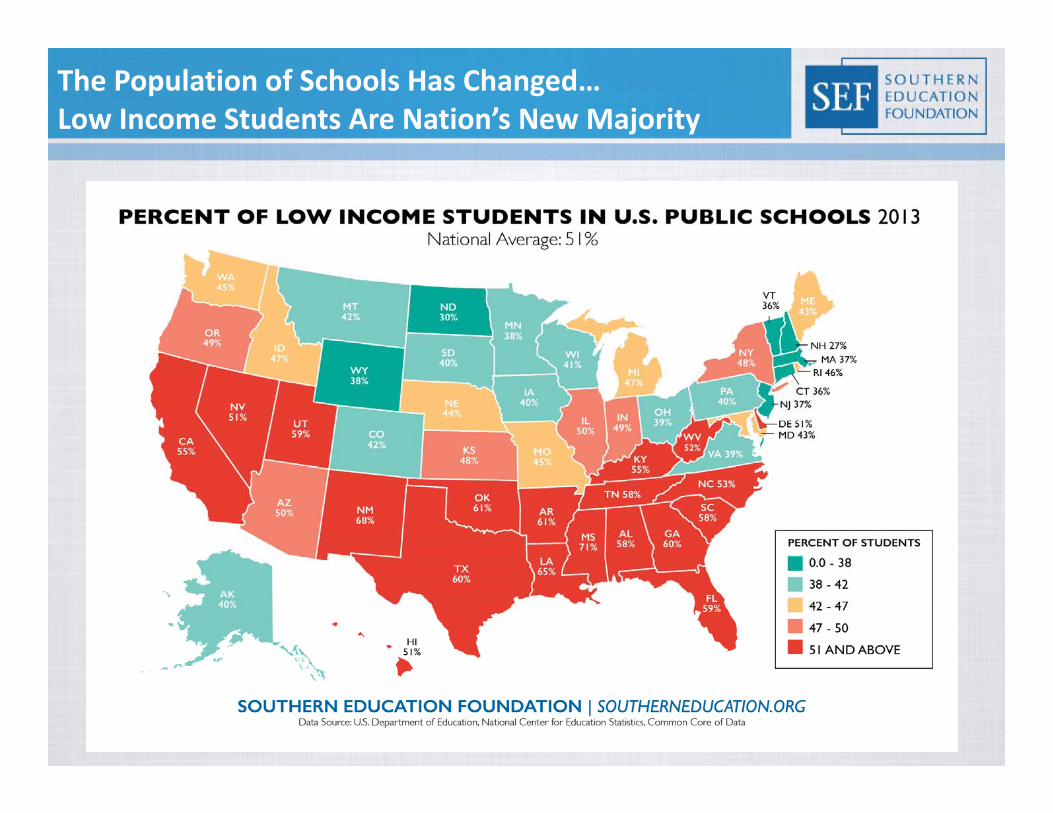
The Population of Schools Has Changed… Low Income Students Are Nation’s New Majority
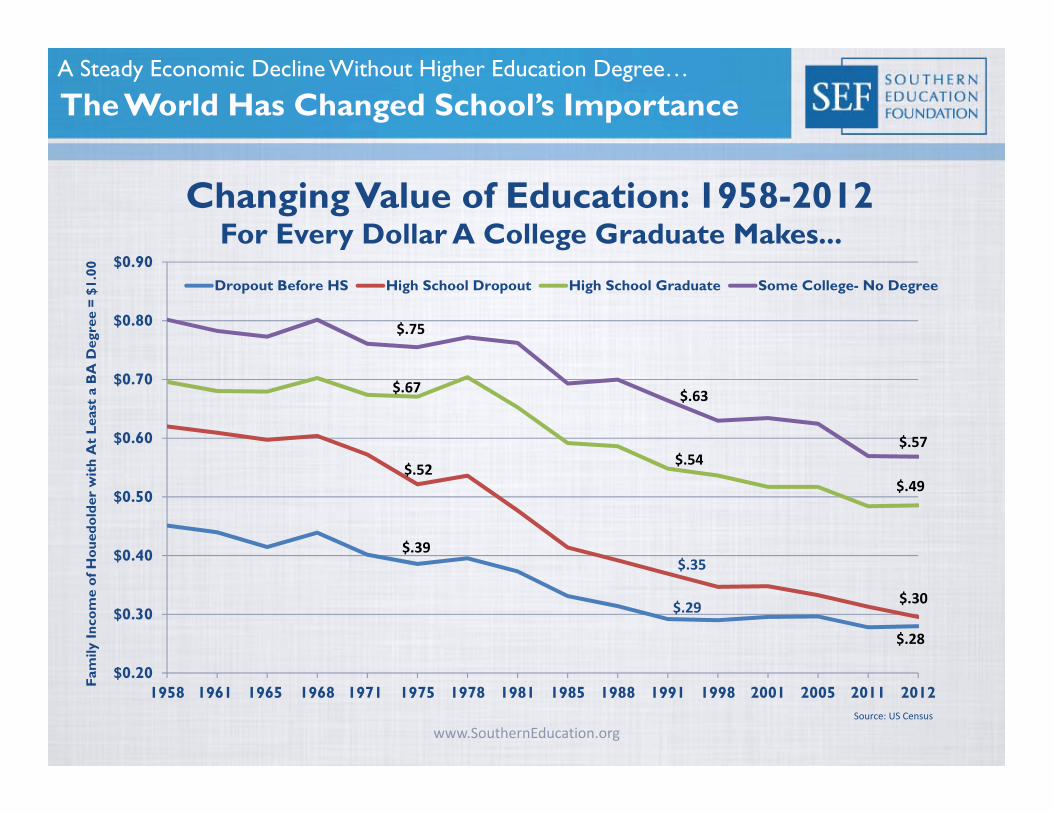
The World Has Changed School’s Importance
www.SouthernEducation.orgSource: US Census
A Steady Economic Decline Without Higher Education Degree…
$0.20
$0.30
$0.40
$0.50
$0.60
$0.70
$0.80
$0.90
1958 1961 1965 1968 1971 1975 1978 1981 1985 1988 1991 1998 2001 2005 2011 2012
Fam
ily In
com
e of
Hou
edol
der
wit
h A
t Le
ast
a B
A D
egre
e =
$1.0
0
Changing Value of Education: 1958-2012 For Every Dollar A College Graduate Makes...
Dropout Before HS High School Dropout High School Graduate Some College- No Degree
$.75
$.67
$.52
$.39
$.54
$.63
$.57
$.49
$.30
$.28
$.35
$.29
www.SouthernEducation.org 4
0%
10%
20%
30%
40%
50%
60%
70%
80%
90%
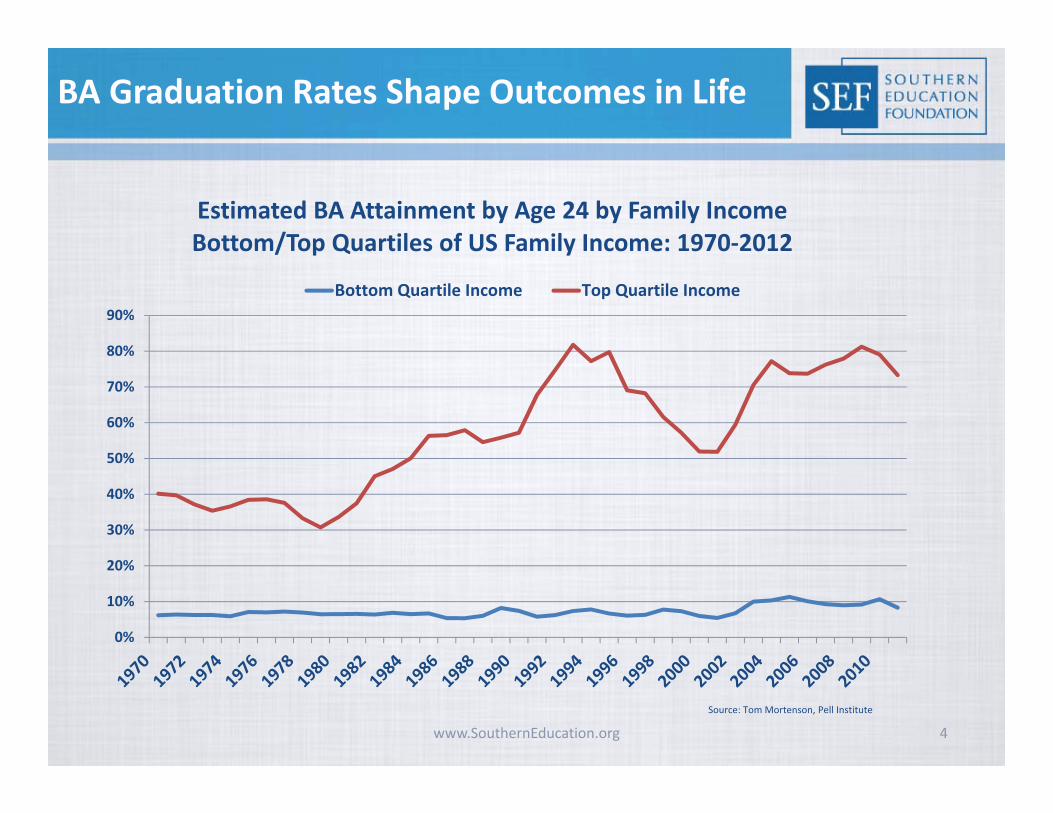
Estimated BA Attainment by Age 24 by Family Income Bottom/Top Quartiles of US Family Income: 1970‐2012
Bottom Quartile Income Top Quartile Income
Source: Tom Mortenson, Pell Institute
BA Graduation Rates Shape Outcomes in Life
www.SouthernEducation.org 5
0.00
0.10
0.20
0.30
0.40
0.50
0.60
0.70
0.80
0.90
1970 1977 1987 1997 2007 2008 2009 2010 2012
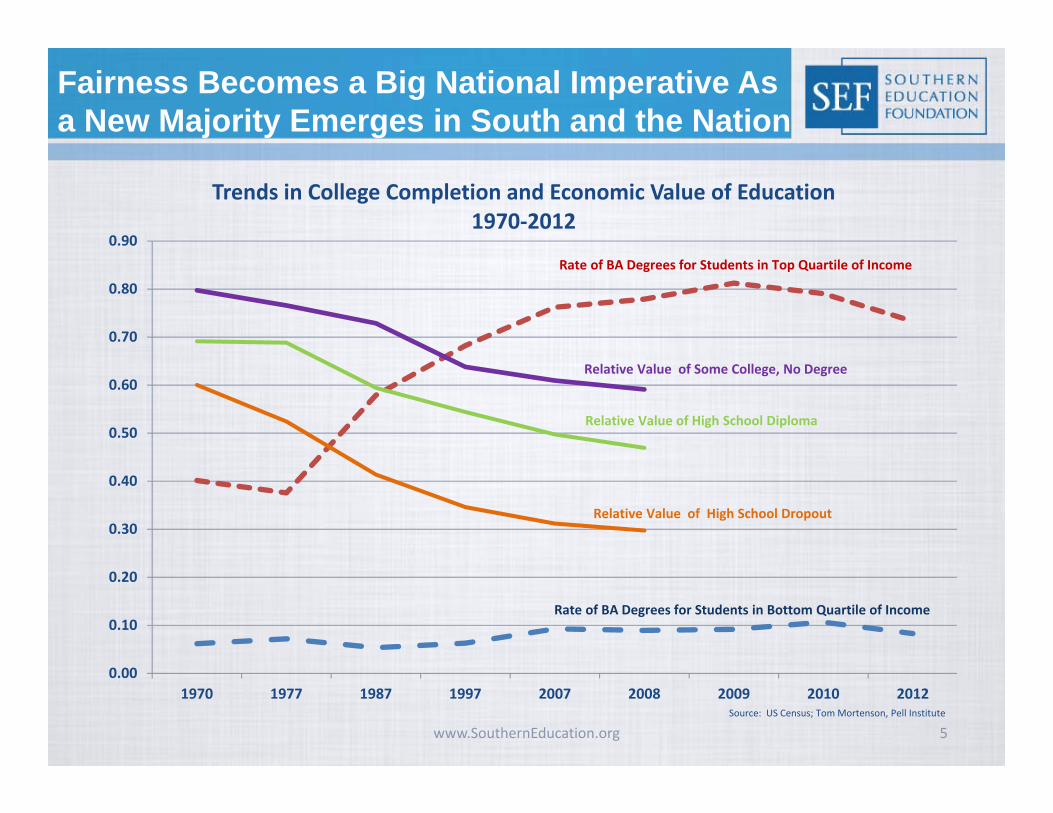
Trends in College Completion and Economic Value of Education 1970‐2012
Relative Value of Some College, No Degree
Relative Value of High School Diploma
Relative Value of High School Dropout
Rate of BA Degrees for Students in Top Quartile of Income
Rate of BA Degrees for Students in Bottom Quartile of Income
Fairness Becomes a Big National Imperative Asa New Majority Emerges in South and the Nation
Source: US Census; Tom Mortenson, Pell Institute
www.SouthernEducation.org 6
The Population of Schools Has Changed… Low Income Students Are Nation’s New Majority
Source: National Center for Education Statistics
www.SouthernEducation.org7
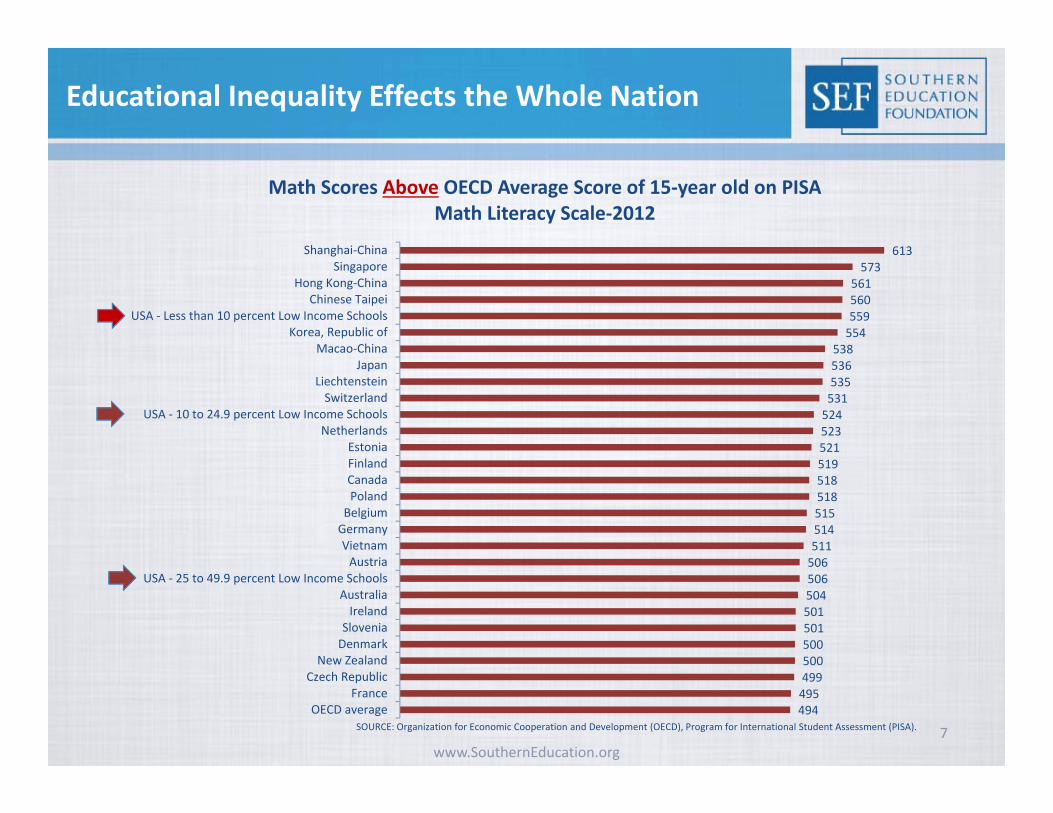
Educational Inequality Effects the Whole Nation
SOURCE: Organization for Economic Cooperation and Development (OECD), Program for International Student Assessment (PISA).
613573
561560559554
538536535531524523521519518518515514511506506504501501500500499495494
Shanghai‐ChinaSingapore
Hong Kong‐ChinaChinese Taipei
USA ‐ Less than 10 percent Low Income SchoolsKorea, Republic of
Macao‐ChinaJapan
LiechtensteinSwitzerland
USA ‐ 10 to 24.9 percent Low Income SchoolsNetherlands
EstoniaFinlandCanadaPolandBelgiumGermanyVietnamAustria
USA ‐ 25 to 49.9 percent Low Income SchoolsAustraliaIreland
SloveniaDenmark
New ZealandCzech Republic
FranceOECD average
Math Scores Above OECD Average Score of 15‐year old on PISA Math Literacy Scale‐2012
www.SouthernEducation.org8
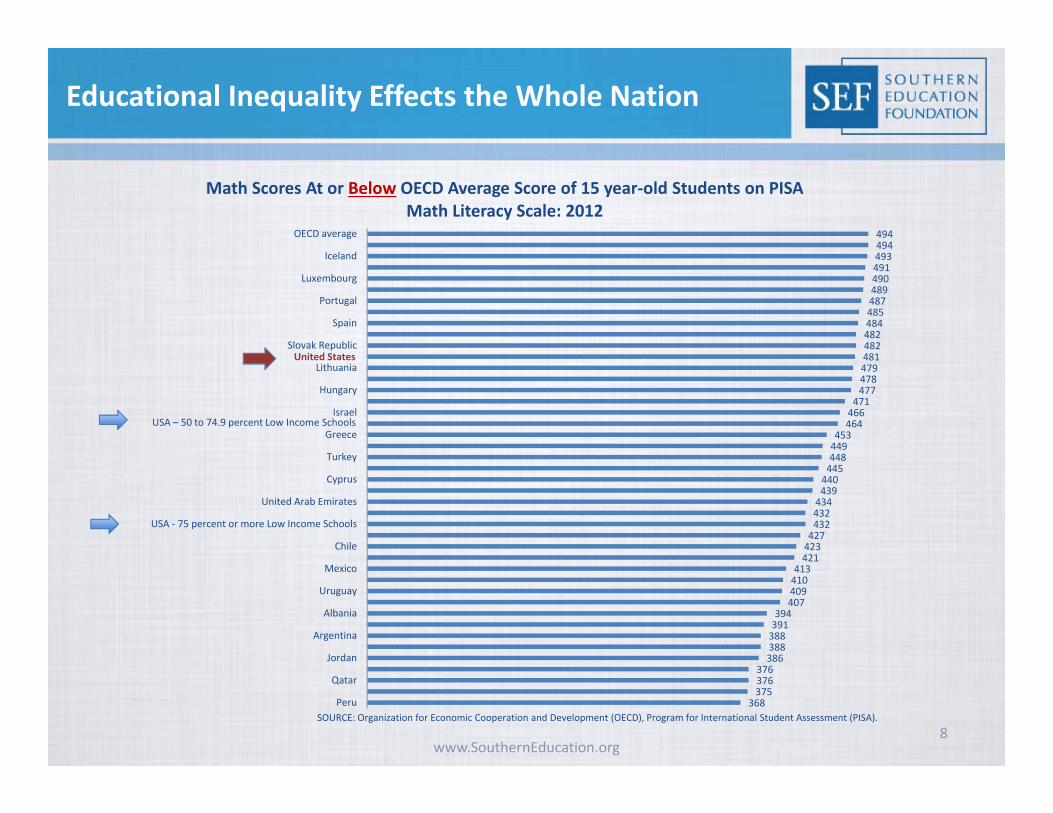
494494493491490489487485484482482481479478477
471466464
453449448445440439434432432427423421
413410409407
394391388388386
376376375
368
OECD average
Iceland
Luxembourg
Portugal
Spain
Slovak Republic
Lithuania
Hungary
Israel
Greece
Turkey
Cyprus
United Arab Emirates
USA ‐ 75 percent or more Low Income Schools
Chile
Mexico
Uruguay
Albania
Argentina
Jordan
Qatar
Peru
Math Scores At or Below OECD Average Score of 15 year‐old Students on PISA Math Literacy Scale: 2012
United States
USA – 50 to 74.9 percent Low Income Schools
SOURCE: Organization for Economic Cooperation and Development (OECD), Program for International Student Assessment (PISA).
Educational Inequality Effects the Whole Nation
www.SouthernEducation.org 9
220
230
240
250
260
270
280
290
300
310
1996 2000 2003 2005 2007 2009 2011 2013
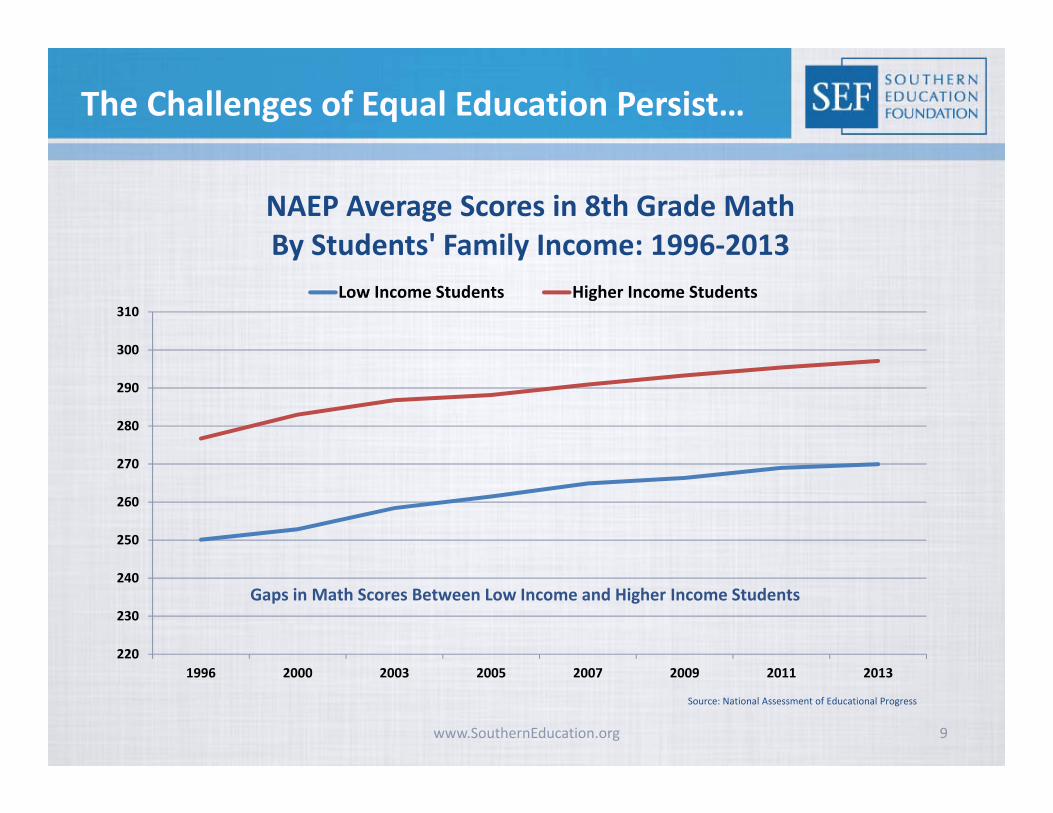
NAEP Average Scores in 8th Grade Math By Students' Family Income: 1996‐2013
Low Income Students Higher Income Students
Gaps in Math Scores Between Low Income and Higher Income Students
The Challenges of Equal Education Persist…
Source: National Assessment of Educational Progress
www.SouthernEducation.org 10
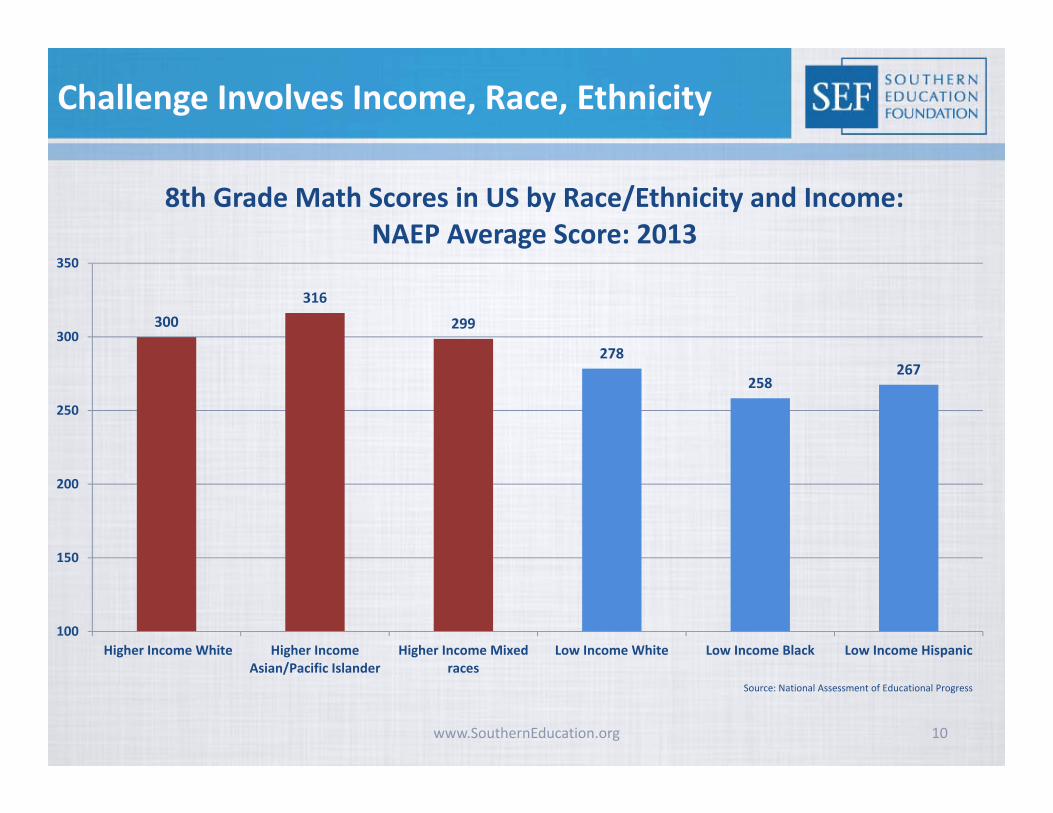
300316
299
278
258267
100
150
200
250
300
350
Higher Income White Higher IncomeAsian/Pacific Islander
Higher Income Mixedraces
Low Income White Low Income Black Low Income Hispanic
8th Grade Math Scores in US by Race/Ethnicity and Income: NAEP Average Score: 2013
Source: National Assessment of Educational Progress
Challenge Involves Income, Race, Ethnicity
www.SouthernEducation.org 11
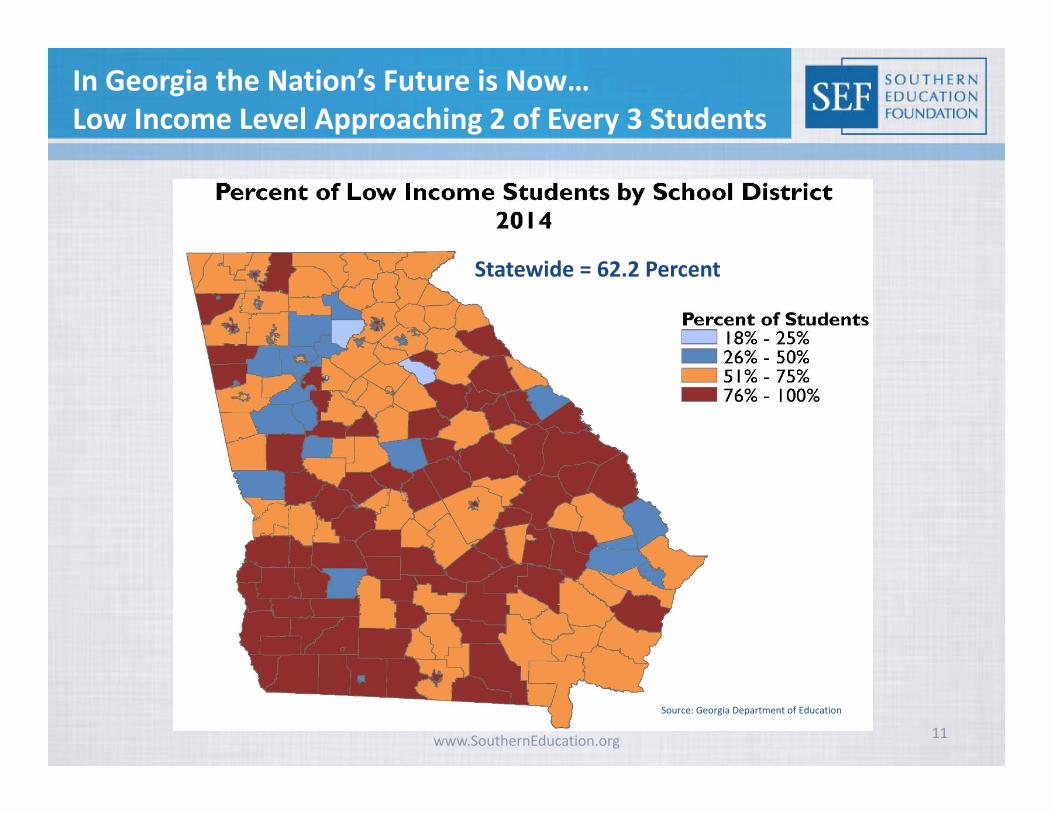
In Georgia the Nation’s Future is Now…Low Income Level Approaching 2 of Every 3 Students
Source: Georgia Department of Education
Statewide = 62.2 Percent
www.SouthernEducation.org 12
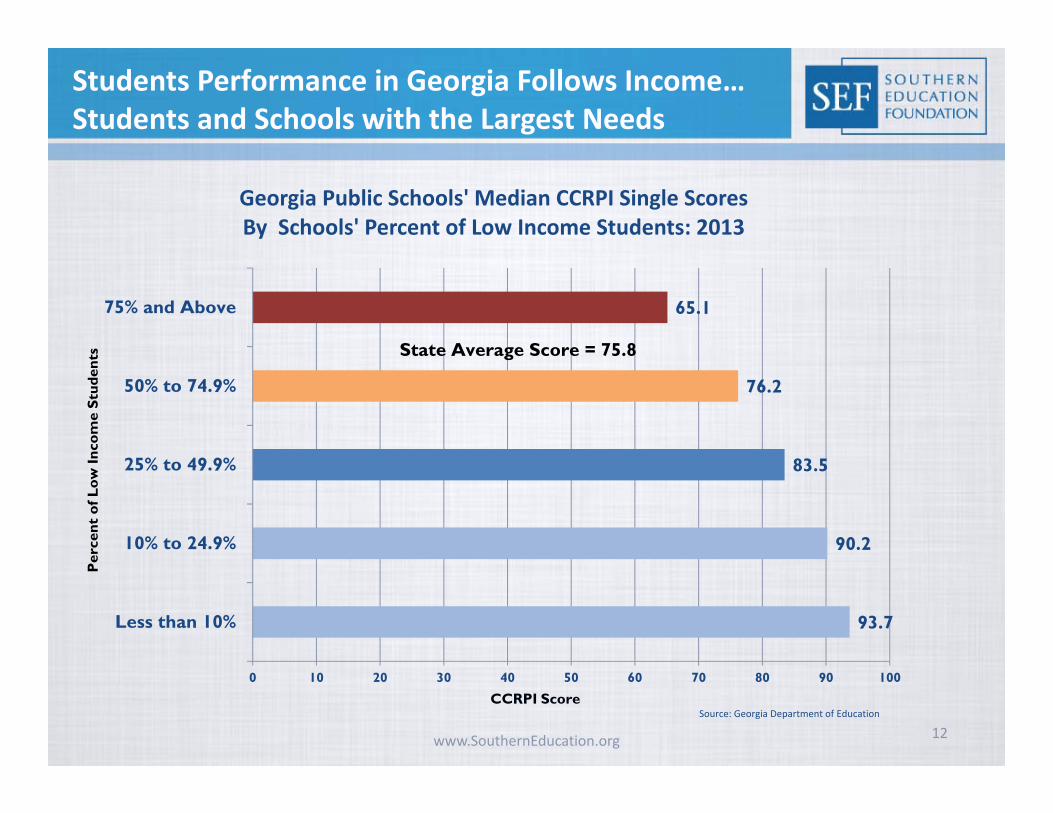
Students Performance in Georgia Follows Income…Students and Schools with the Largest Needs
Source: Georgia Department of Education
93.7
90.2
83.5
76.2
65.1
0 10 20 30 40 50 60 70 80 90 100
Less than 10%
10% to 24.9%
25% to 49.9%
50% to 74.9%
75% and Above
Georgia Public Schools' Median CCRPI Single Scores By Schools' Percent of Low Income Students: 2013
Per
cent
of L
ow In
com
e St
uden
ts State Average Score = 75.8
CCRPI Score
www.SouthernEducation.org 13
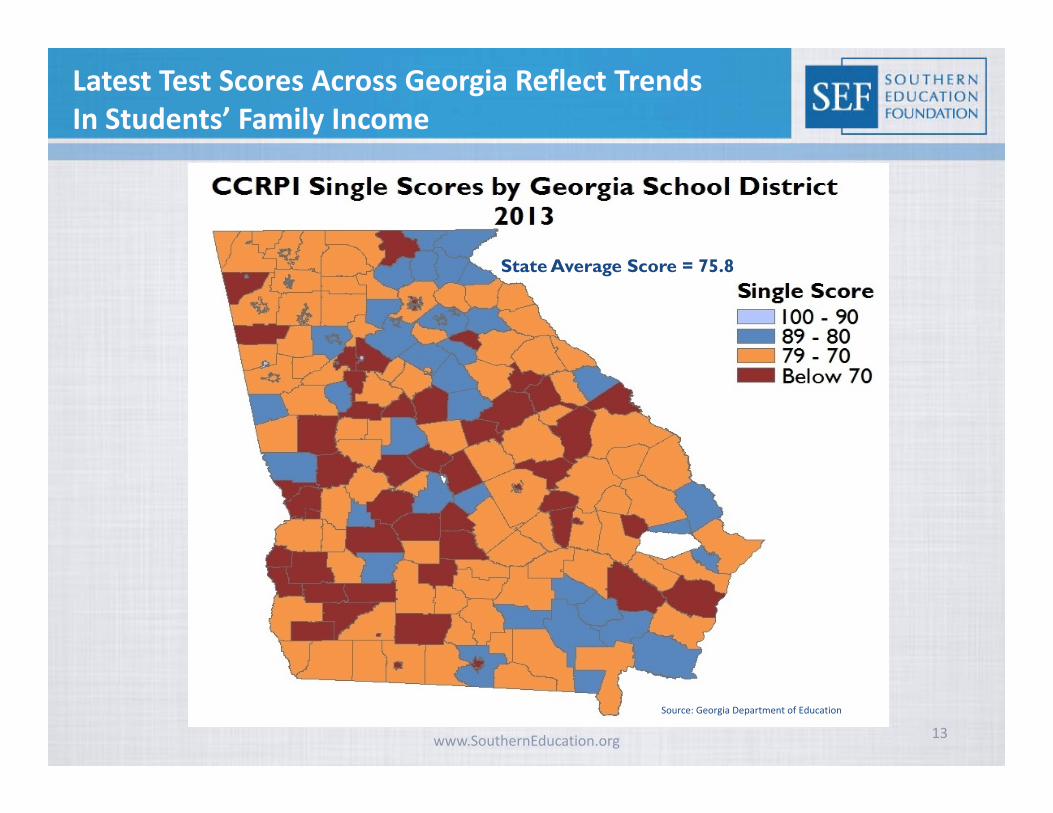
Latest Test Scores Across Georgia Reflect Trends In Students’ Family Income
Source: Georgia Department of Education
State Average Score = 75.8

www.SouthernEducation.org 14
How Did We Get Here? Large Majority of Low Income Students
Source: Georgia Department of Education
Statewide = 62.2 Percent
www.SouthernEducation.org 15Source: National Center for Education Statistics / Georgia Department of Education
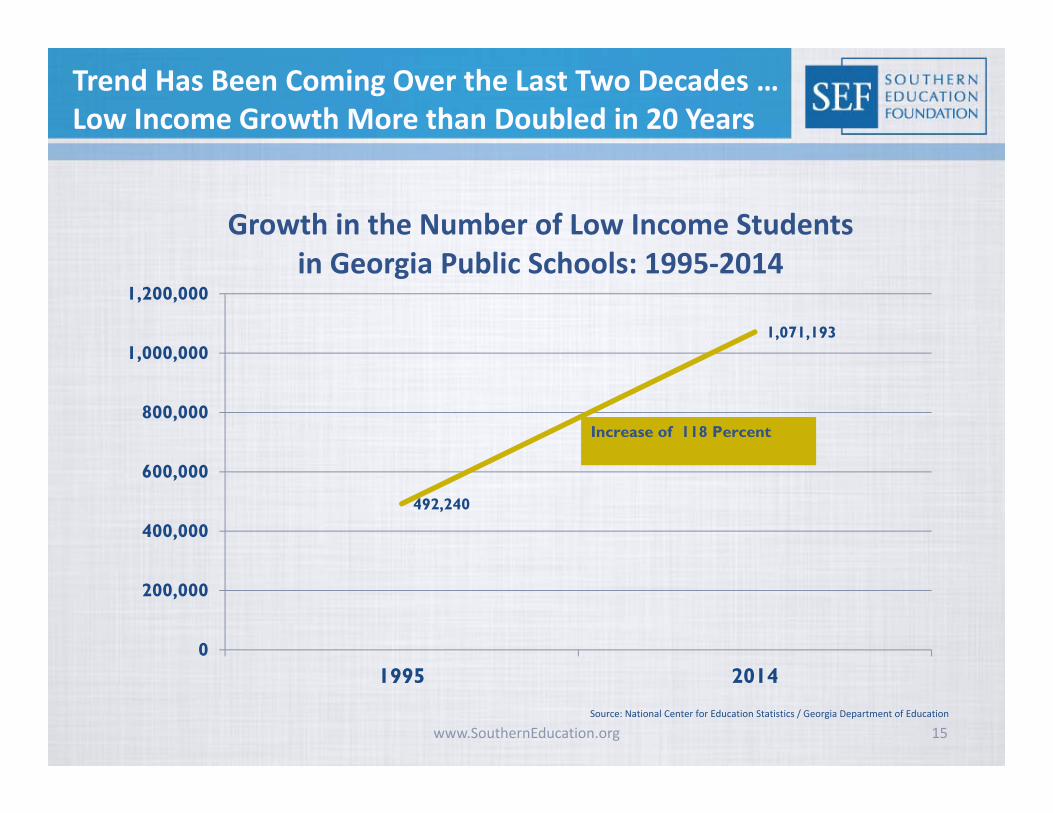
Trend Has Been Coming Over the Last Two Decades … Low Income Growth More than Doubled in 20 Years
492,240
1,071,193
0
200,000
400,000
600,000
800,000
1,000,000
1,200,000
1995 2014
Growth in the Number of Low Income Students in Georgia Public Schools: 1995‐2014
Increase of 118 Percent
www.SouthernEducation.org 16Source: National Center for Education Statistics
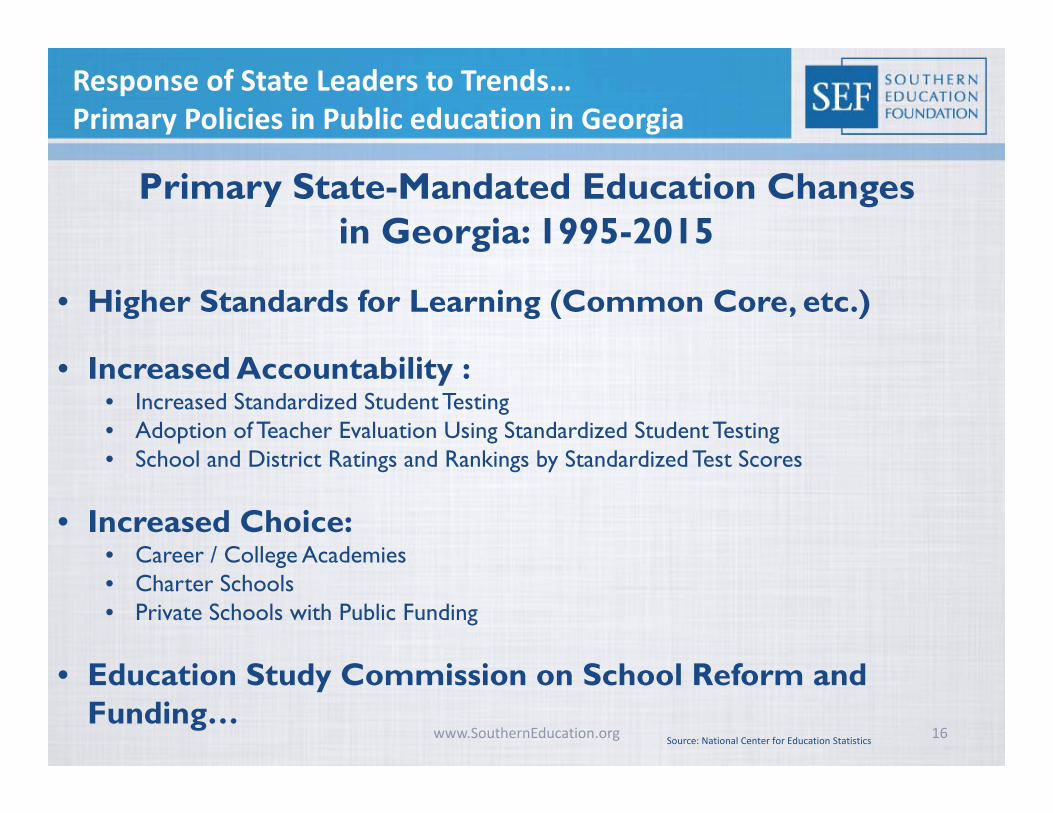
Response of State Leaders to Trends… Primary Policies in Public education in Georgia
Primary State-Mandated Education Changes in Georgia: 1995-2015
• Higher Standards for Learning (Common Core, etc.)
• Increased Accountability :• Increased Standardized Student Testing• Adoption of Teacher Evaluation Using Standardized Student Testing• School and District Ratings and Rankings by Standardized Test Scores
• Increased Choice:• Career / College Academies• Charter Schools• Private Schools with Public Funding
• Education Study Commission on School Reform and Funding…
www.SouthernEducation.org 17
Source: Georgia Department of Education
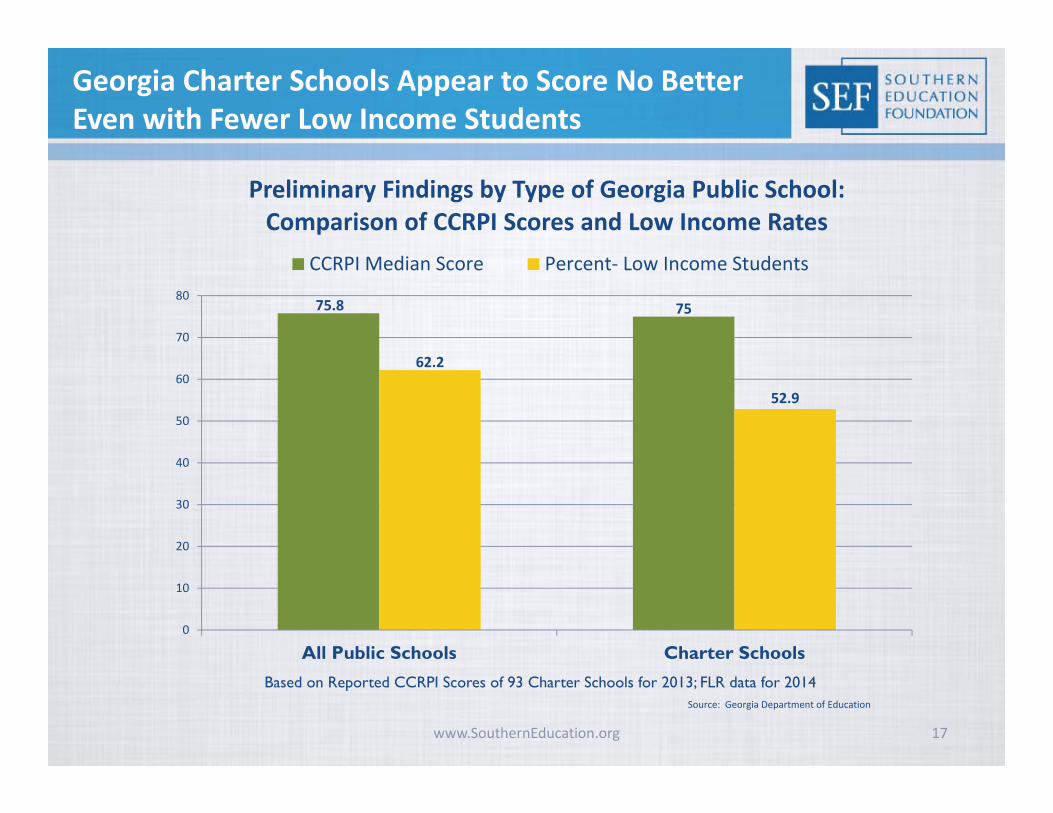
Georgia Charter Schools Appear to Score No Better Even with Fewer Low Income Students
75.8 75
62.2
52.9
0
10
20
30
40
50
60
70
80
All Public Schools Charter SchoolsBased on Reported CCRPI Scores of 93 Charter Schools for 2013; FLR data for 2014
Preliminary Findings by Type of Georgia Public School:Comparison of CCRPI Scores and Low Income Rates
CCRPI Median Score Percent‐ Low Income Students
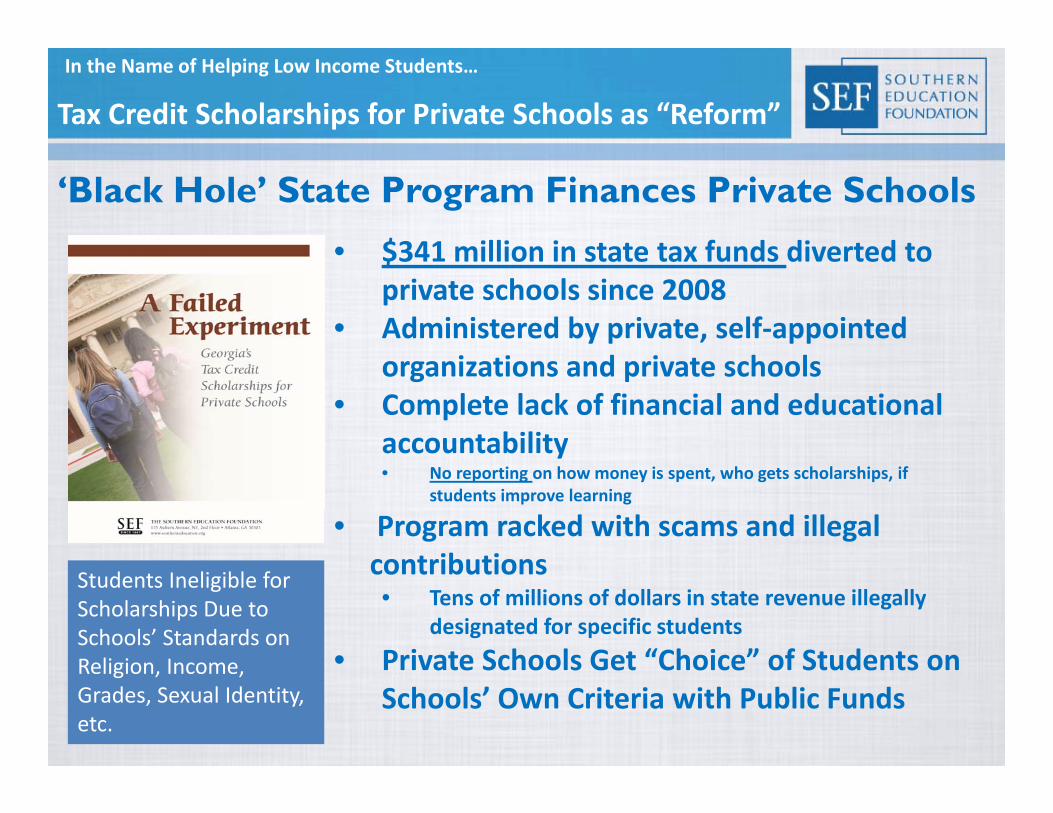
Tax Credit Scholarships for Private Schools as “Reform”
• $341 million in state tax funds diverted to private schools since 2008
• Administered by private, self‐appointed organizations and private schools
• Complete lack of financial and educational accountability• No reporting on how money is spent, who gets scholarships, if
students improve learning
• Program racked with scams and illegal contributions • Tens of millions of dollars in state revenue illegally
designated for specific students• Private Schools Get “Choice” of Students on
Schools’ Own Criteria with Public Funds
In the Name of Helping Low Income Students…
‘Black Hole’ State Program Finances Private Schools
Students Ineligible for Scholarships Due to Schools’ Standards on Religion, Income, Grades, Sexual Identity, etc.
www.SouthernEducation.org 19
Source: National Center for Education Statistics
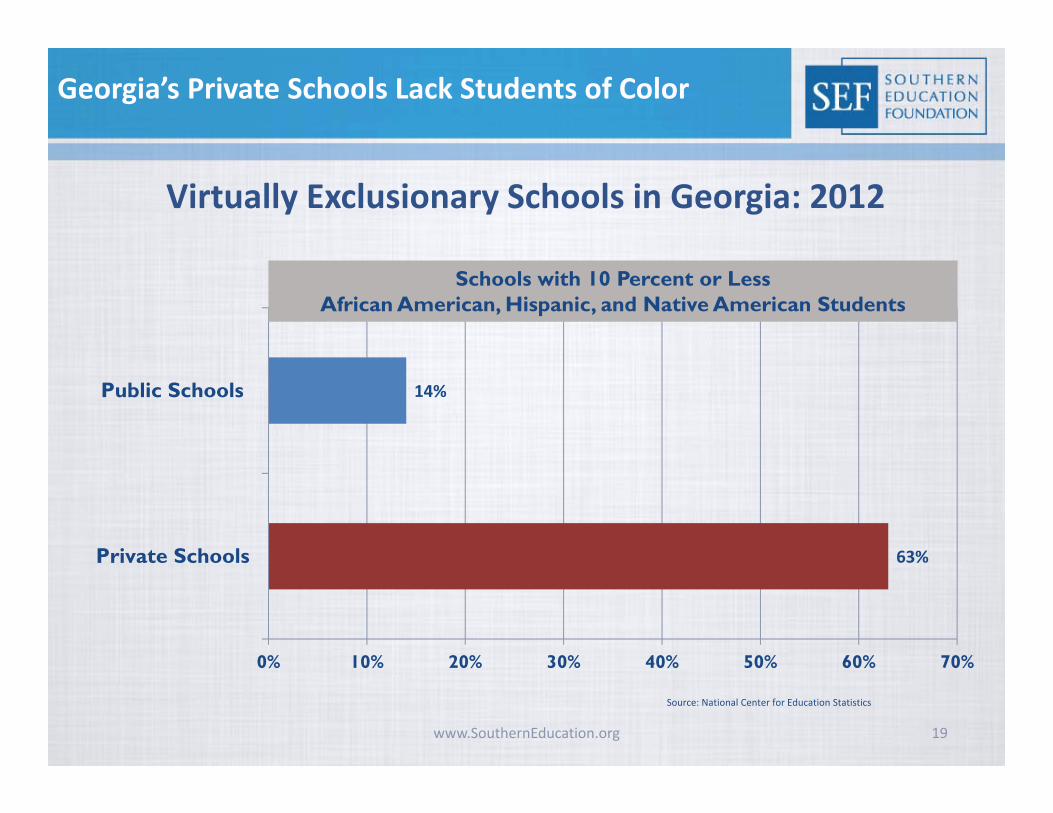
Georgia’s Private Schools Lack Students of Color
63%
14%
0% 10% 20% 30% 40% 50% 60% 70%
Private Schools
Public Schools
Virtually Exclusionary Schools in Georgia: 2012
Schools with 10 Percent or Less African American, Hispanic, and Native American Students
www.SouthernEducation.org 20
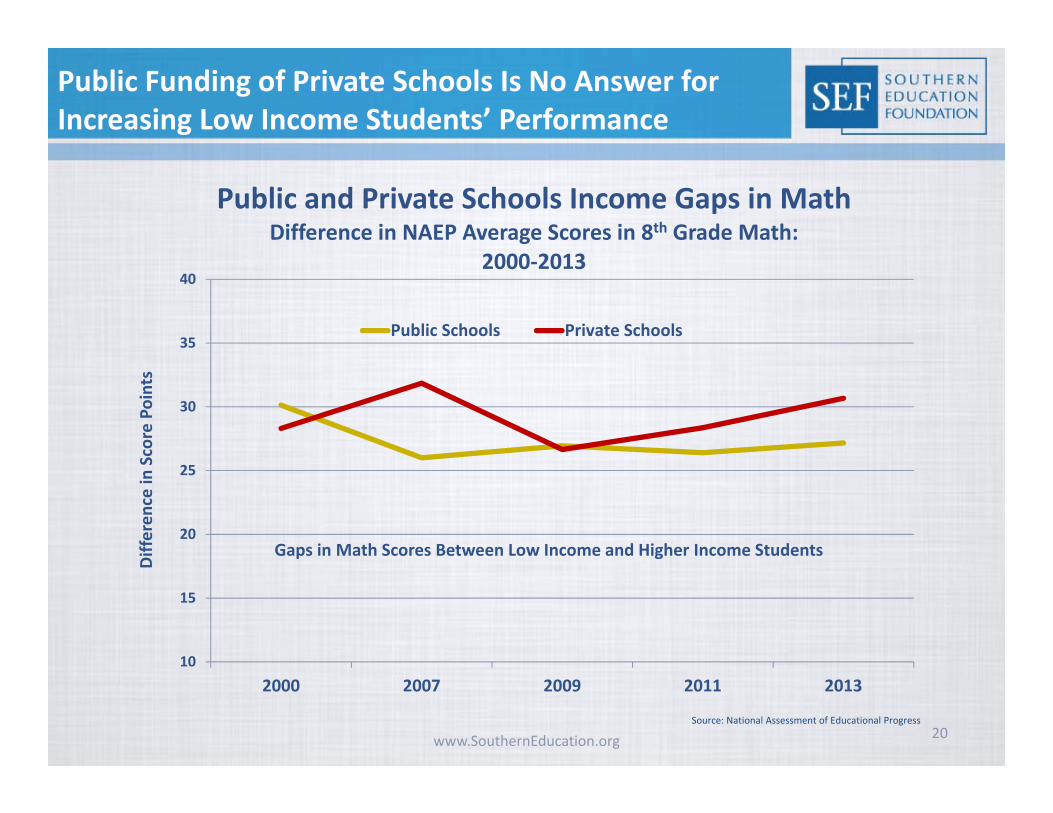
10
15
20
25
30
35
40
2000 2007 2009 2011 2013
Differen
ce in
Score Points
Public and Private Schools Income Gaps in Math Difference in NAEP Average Scores in 8th Grade Math:
2000‐2013
Public Schools Private Schools
Source: National Assessment of Educational Progress
Public Funding of Private Schools Is No Answer for Increasing Low Income Students’ Performance
Gaps in Math Scores Between Low Income and Higher Income Students

www.SouthernEducation.org 21
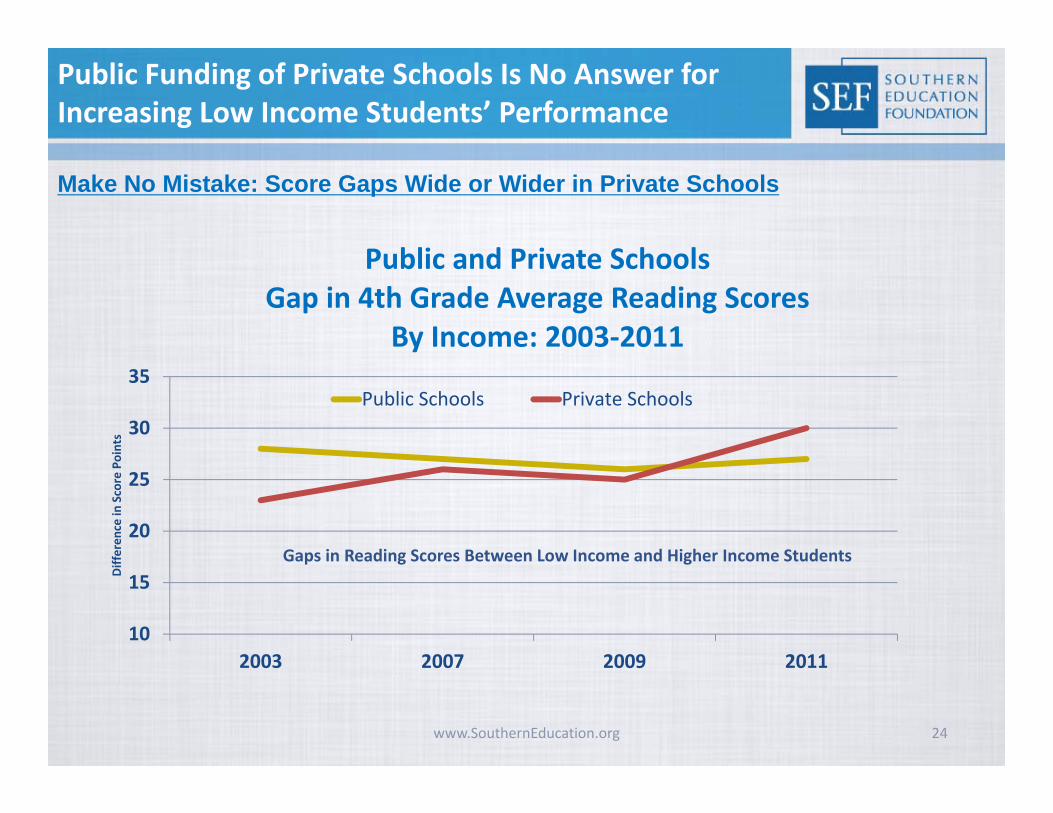
Make No Mistake: Score Gaps Wide or Wider in Private Schools
10
15
20
25
30
35
2003 2007 2009 2011
Differen
ce in
Score Points
Public and Private Schools Gap in 4th Grade Average Reading Scores
By Income: 2003‐2011
Public Schools Private Schools
Gaps in Reading Scores Between Low Income and Higher Income Students
Public Funding of Private Schools Is No Answer for Increasing Low Income Students’ Performance
www.SouthernEducation.org 22
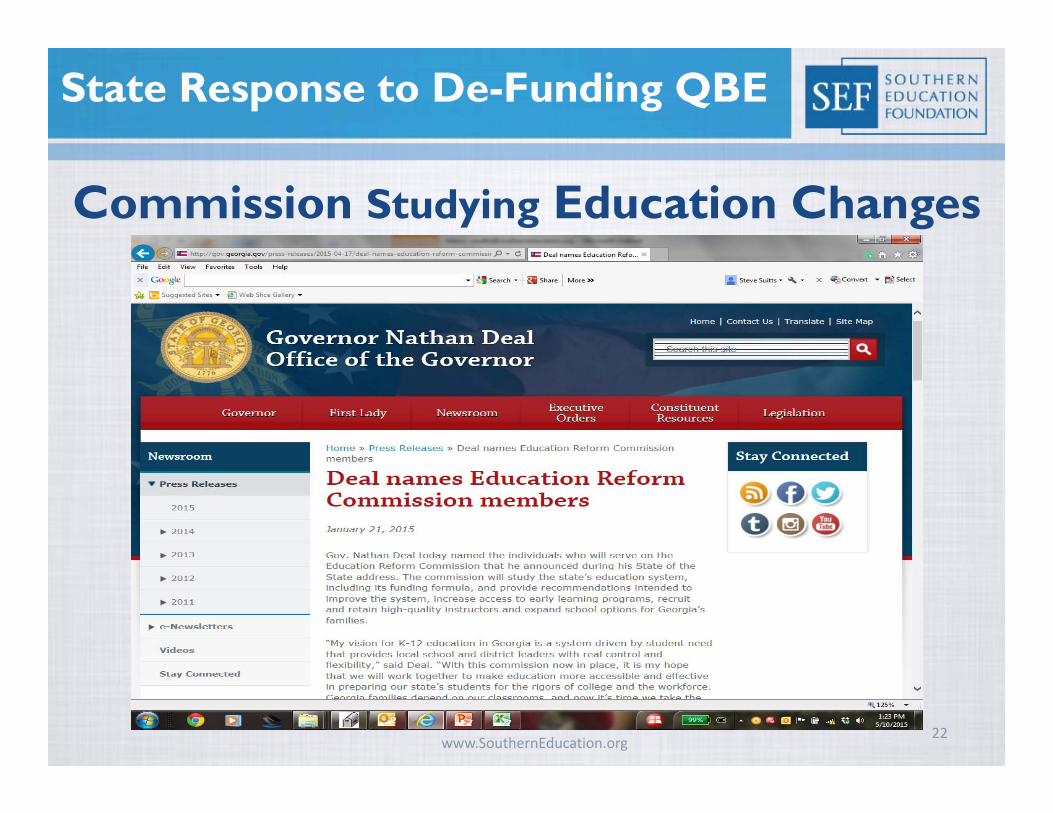
State Response to De-Funding QBE
Commission Studying Education Changes
www.SouthernEducation.org 23
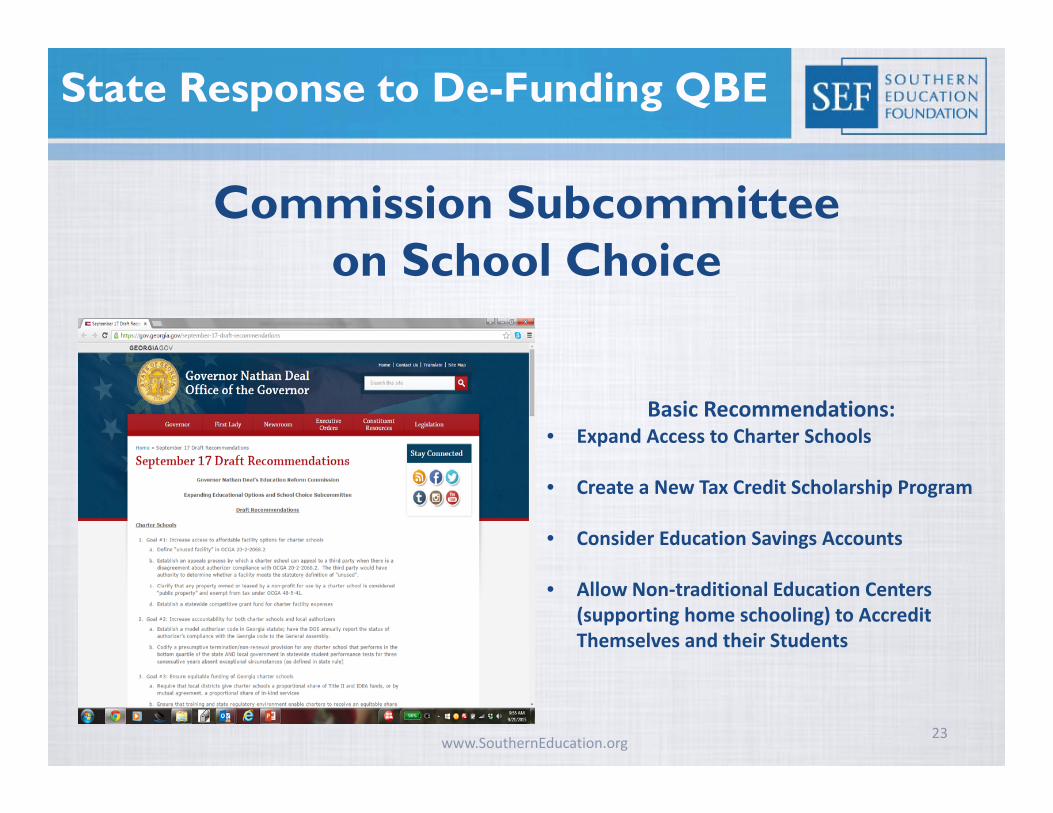
State Response to De-Funding QBE
Commission Subcommittee on School Choice
Basic Recommendations:• Expand Access to Charter Schools
• Create a New Tax Credit Scholarship Program
• Consider Education Savings Accounts
• Allow Non‐traditional Education Centers (supporting home schooling) to Accredit Themselves and their Students
www.SouthernEducation.org 24
Make No Mistake: Score Gaps Wide or Wider in Private Schools
10
15
20
25
30
35
2003 2007 2009 2011
Differen
ce in
Score Points
Public and Private Schools Gap in 4th Grade Average Reading Scores
By Income: 2003‐2011
Public Schools Private Schools
Gaps in Reading Scores Between Low Income and Higher Income Students
Public Funding of Private Schools Is No Answer for Increasing Low Income Students’ Performance
www.SouthernEducation.org
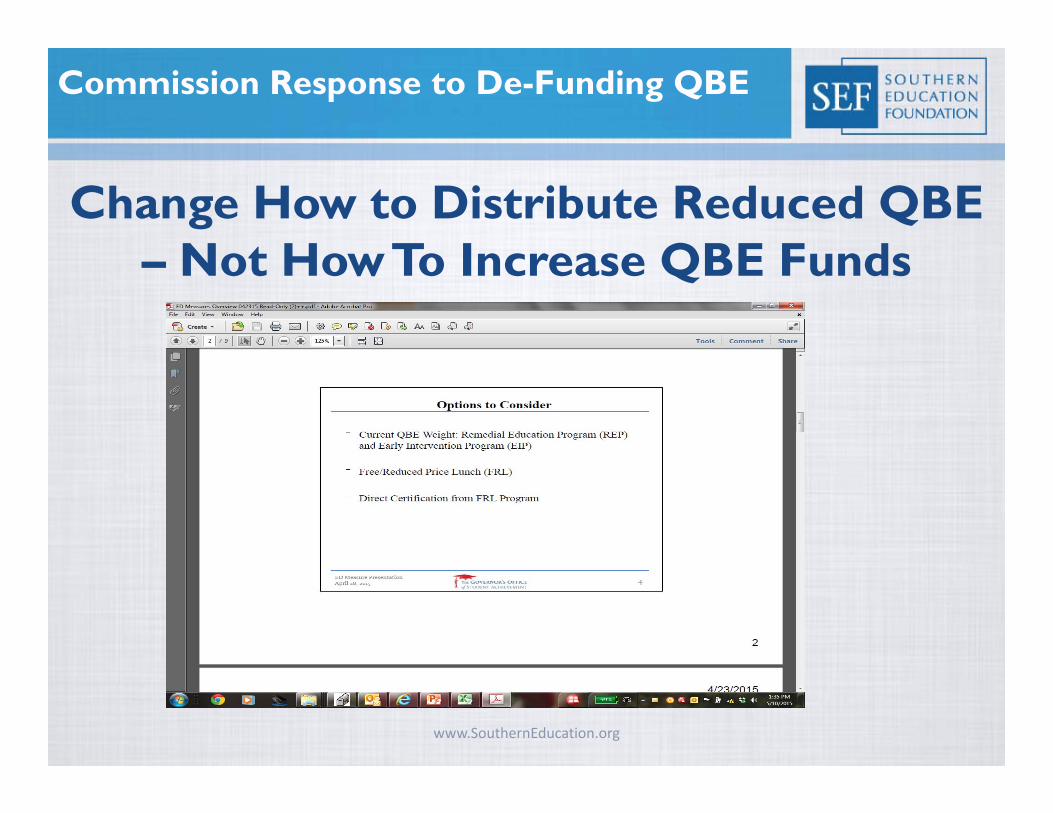
Commission Response to De-Funding QBE
Change How to Distribute Reduced QBE – Not How To Increase QBE Funds
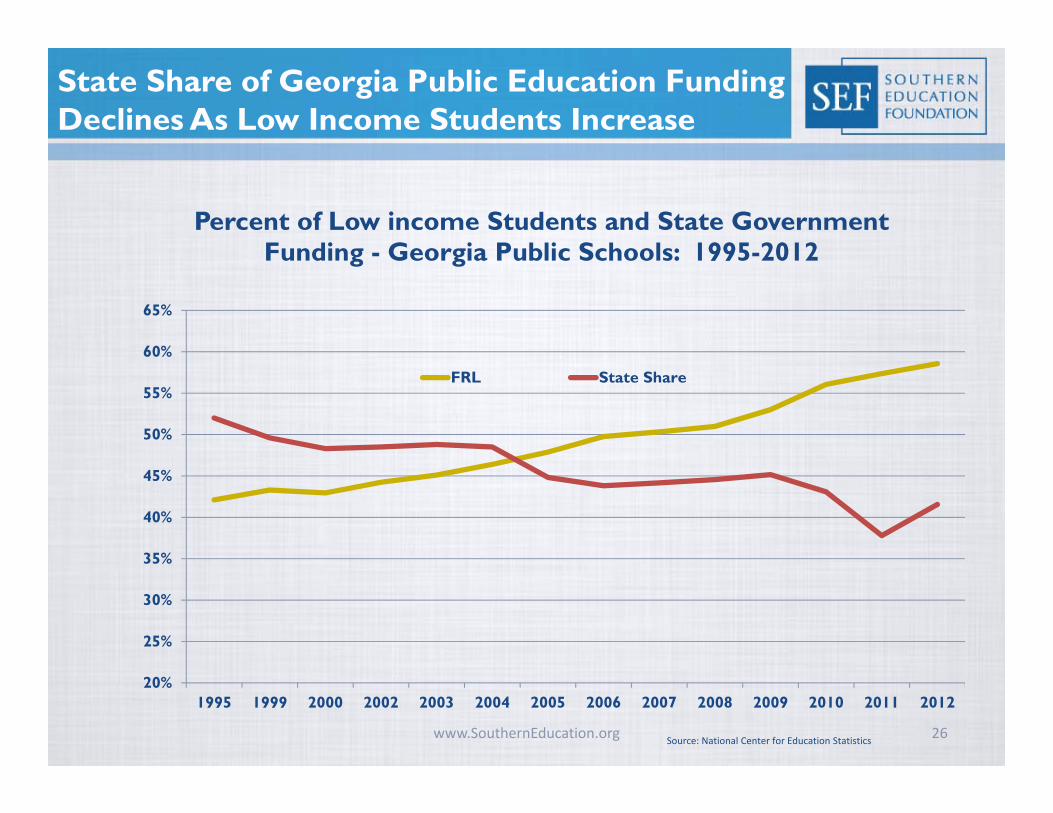
www.SouthernEducation.org 26Source: National Center for Education Statistics
State Share of Georgia Public Education Funding Declines As Low Income Students Increase
20%
25%
30%
35%
40%
45%
50%
55%
60%
65%
1995 1999 2000 2002 2003 2004 2005 2006 2007 2008 2009 2010 2011 2012
Percent of Low income Students and State Government Funding - Georgia Public Schools: 1995-2012
FRL State Share
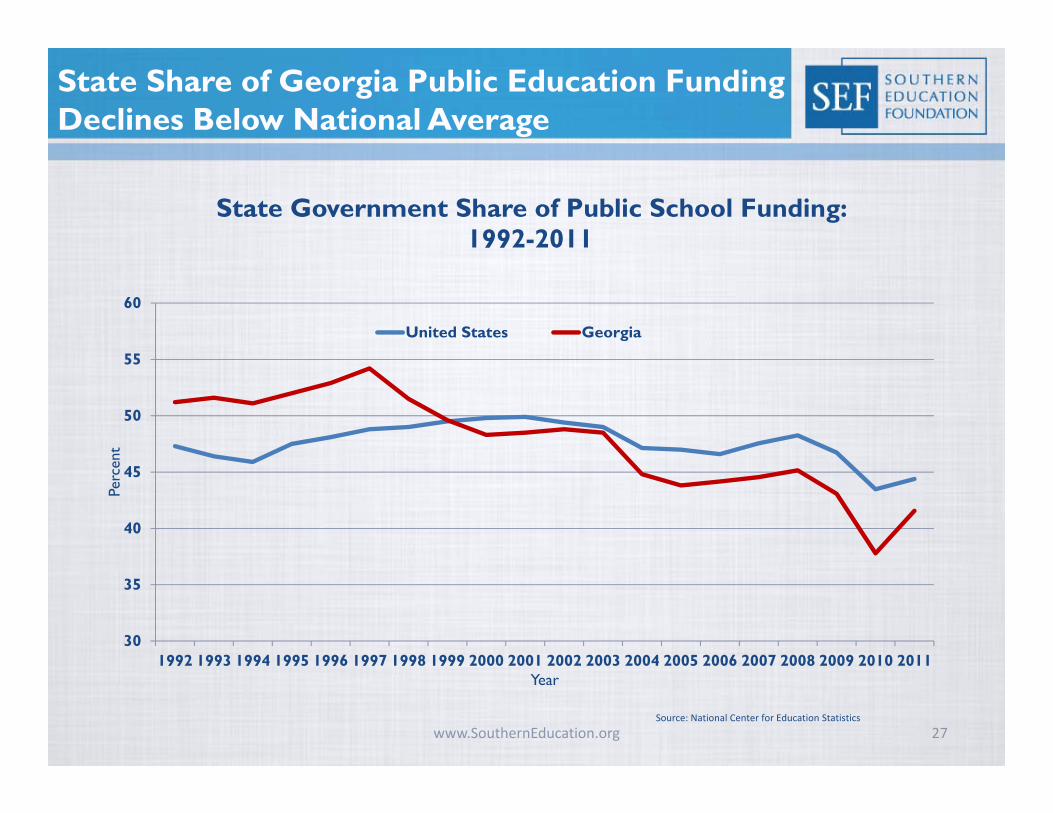
www.SouthernEducation.org 27Source: National Center for Education Statistics
State Share of Georgia Public Education Funding Declines Below National Average
30
35
40
45
50
55
60
1992 1993 1994 1995 1996 1997 1998 1999 2000 2001 2002 2003 2004 2005 2006 2007 2008 2009 2010 2011
Perc
ent
Year
State Government Share of Public School Funding: 1992-2011
United States Georgia
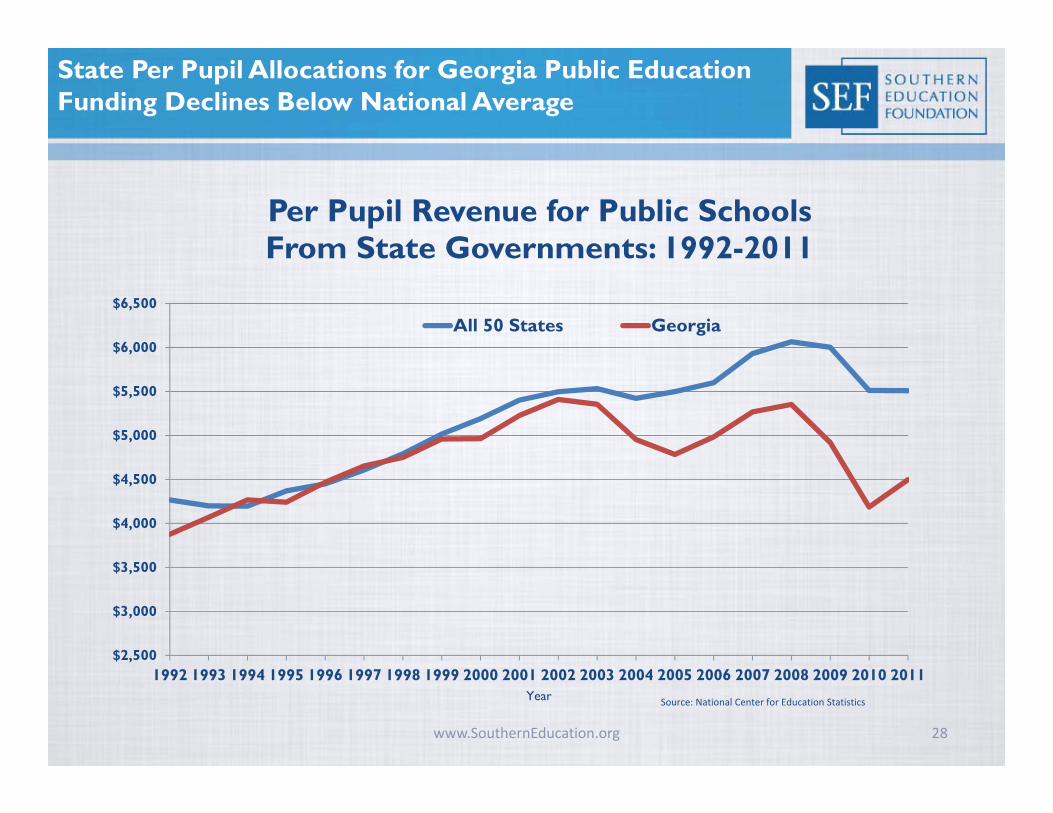
www.SouthernEducation.org 28
Source: National Center for Education Statistics
State Per Pupil Allocations for Georgia Public Education Funding Declines Below National Average
$2,500
$3,000
$3,500
$4,000
$4,500
$5,000
$5,500
$6,000
$6,500
1992 1993 1994 1995 1996 1997 1998 1999 2000 2001 2002 2003 2004 2005 2006 2007 2008 2009 2010 2011Year
Per Pupil Revenue for Public Schools From State Governments: 1992-2011
All 50 States Georgia
www.SouthernEducation.org 29Source: Georgia Department of Education
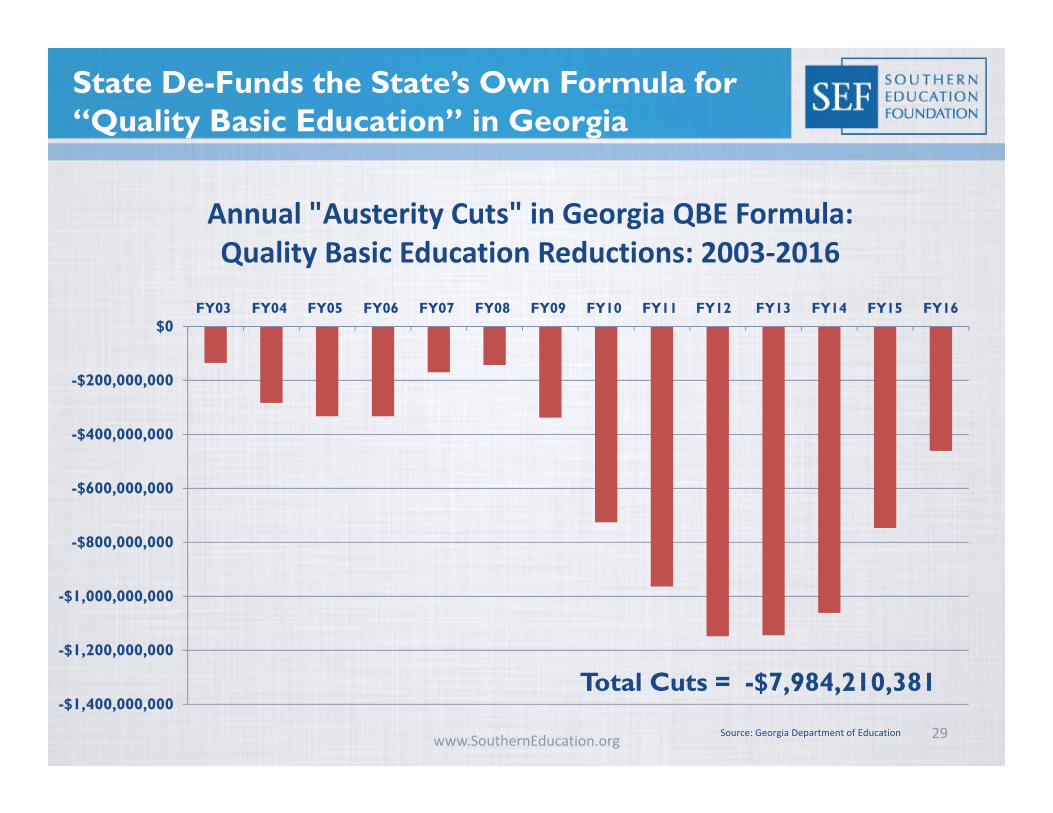
State De-Funds the State’s Own Formula for “Quality Basic Education” in Georgia
-$1,400,000,000
-$1,200,000,000
-$1,000,000,000
-$800,000,000
-$600,000,000
-$400,000,000
-$200,000,000
$0FY03 FY04 FY05 FY06 FY07 FY08 FY09 FY10 FY11 FY12 FY13 FY14 FY15 FY16
Annual "Austerity Cuts" in Georgia QBE Formula:Quality Basic Education Reductions: 2003‐2016
Total Cuts = -$7,984,210,381
www.SouthernEducation.org 30
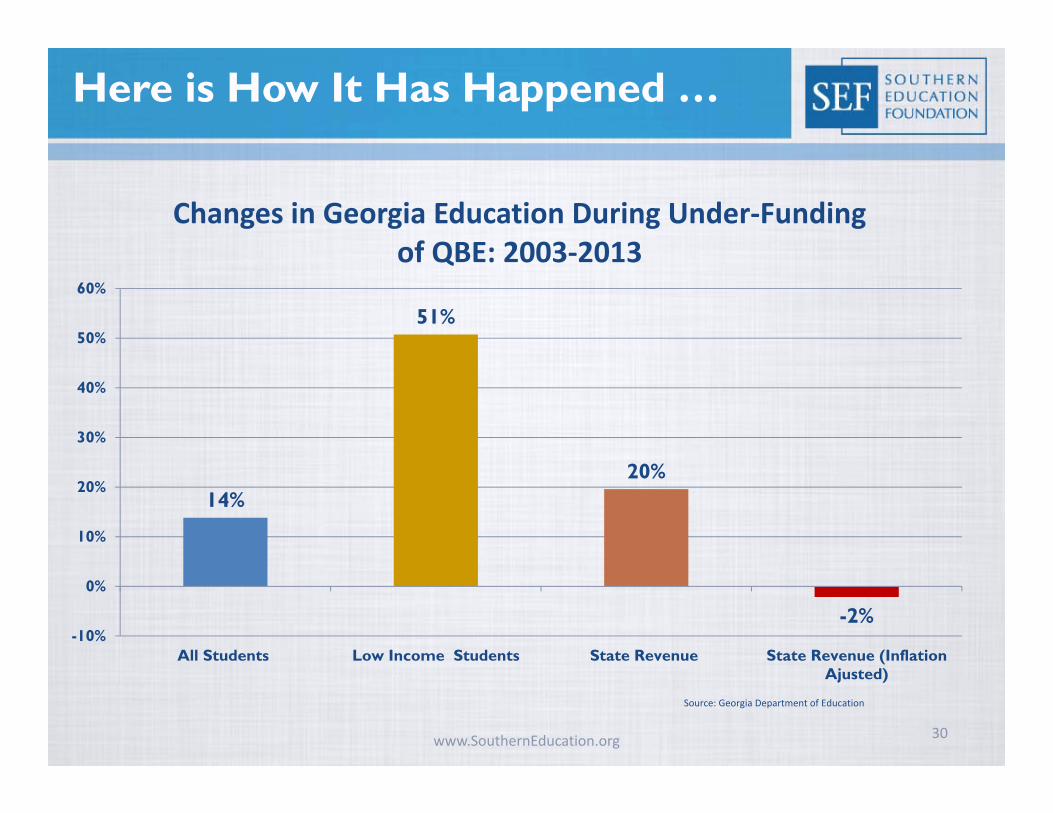
Here is How It Has Happened …
Source: Georgia Department of Education
14%
51%
20%
-2%-10%
0%
10%
20%
30%
40%
50%
60%
All Students Low Income Students State Revenue State Revenue (InflationAjusted)
Changes in Georgia Education During Under‐Funding of QBE: 2003‐2013
www.SouthernEducation.org 31Source: Georgia Department of Education
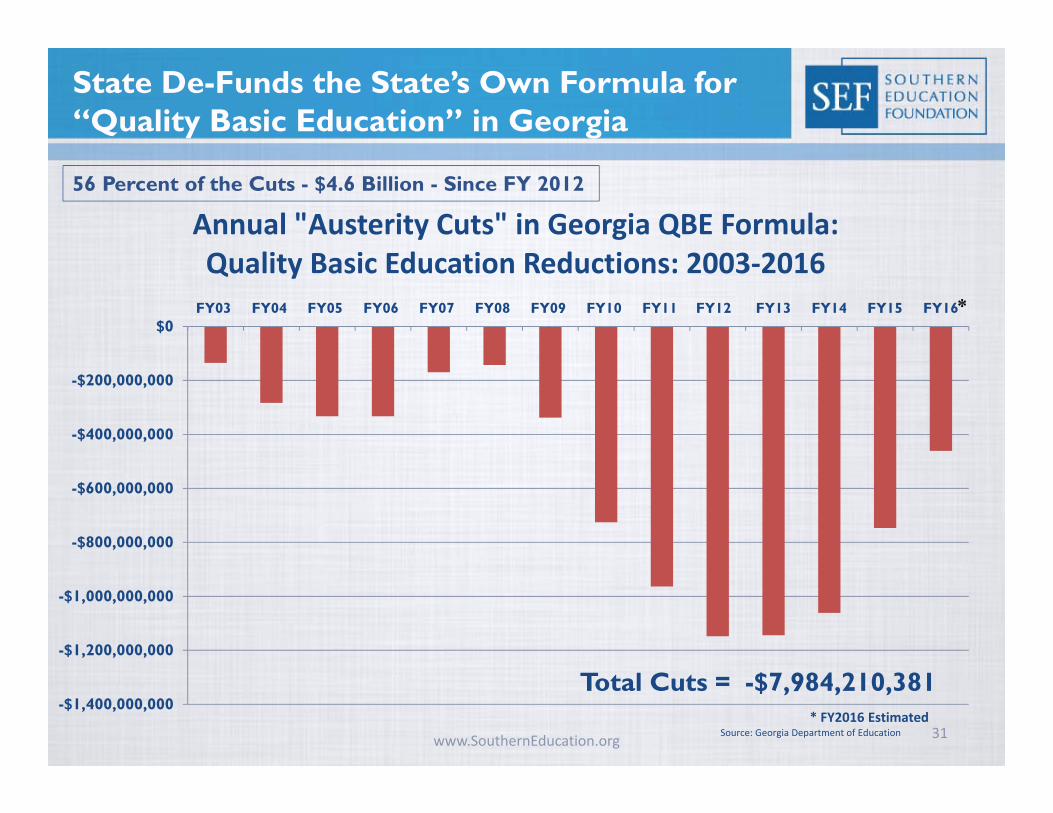
State De-Funds the State’s Own Formula for “Quality Basic Education” in Georgia
-$1,400,000,000
-$1,200,000,000
-$1,000,000,000
-$800,000,000
-$600,000,000
-$400,000,000
-$200,000,000
$0FY03 FY04 FY05 FY06 FY07 FY08 FY09 FY10 FY11 FY12 FY13 FY14 FY15 FY16
Annual "Austerity Cuts" in Georgia QBE Formula:Quality Basic Education Reductions: 2003‐2016
*
* FY2016 Estimated
Total Cuts = -$7,984,210,381
56 Percent of the Cuts - $4.6 Billion - Since FY 2012
www.SouthernEducation.org 32
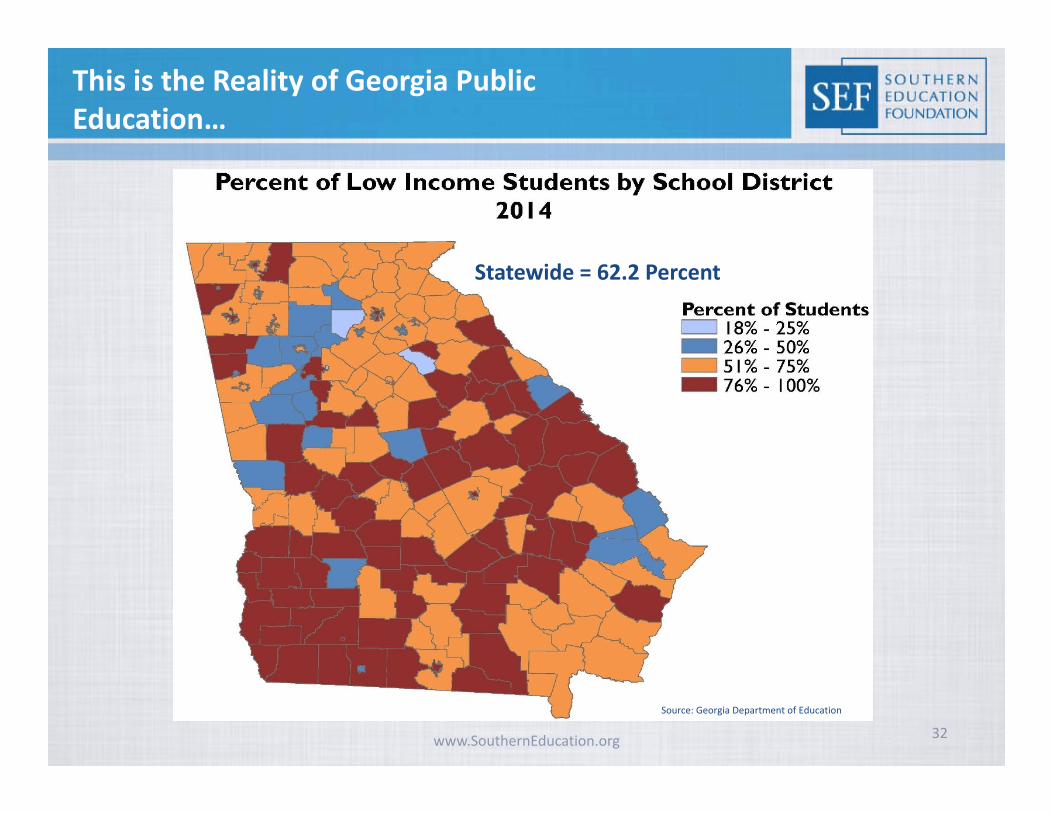
This is the Reality of Georgia Public Education…
Source: Georgia Department of Education
Statewide = 62.2 Percent

www.SouthernEducation.org 33
This is the Reality of Georgia Public Education…
Source: Georgia Department of Education
14%
51%
20%
-2%-10%
0%
10%
20%
30%
40%
50%
60%
All Students Low Income Students State Revenue State Revenue (InflationAjusted)
Changes in Georgia Education During Under‐Funding of QBE: 2003‐2013

www.SouthernEducation.org 34
No Time To Lose… What Are You Going
To Do About It?
“The provision of an adequate public education for the citizens shall be a primary obligation of the State of Georgia.” --- Georgia Constitution
www.SouthernEducation.org 35
A Prosperous State Must Have Schools that Prepare Each Child for a Good Life
High Quality Education for All Children: Issues of Basic Fairness & State Prosperity
“In the joyous days of childhood…Oft they told of wondrous love…Will the circle be unbrokenBy and by, by and by?
Steve Suitts, Senior Fellow, Southern Education [email protected]