No. 009/2020/POM Value Cocreation in New Service ...
32
No. 009/2020/POM Value Cocreation in New Service Development: A Process-based View of Resource Dependency Qiang Wang* Department of Innovation, Entrepreneurship, and Strategy The School of Management, Xi’an Jiaotong University (XJTU) Ilan Oshri The University Auckland Business School, Auckland, New Zealand Xiande Zhao Department of Economics and Decision Sciences China Europe International Business School (CEIBS) April 2020 * Corresponding author: Qiang Wang ([email protected]). Address: Department of Innovation, Entrepreneurship, and Strategy, School of Management, Xi’an Jiaotong University (XJTU), No. 28 Xianning West Road, Beilin District, Xi’an, China 710049.
Transcript of No. 009/2020/POM Value Cocreation in New Service ...
No. 009/2020/POM
Value Cocreation in New Service Development: A Process-based View of
Resource Dependency
Qiang Wang*
Department of Innovation, Entrepreneurship, and Strategy
The School of Management, Xi’an Jiaotong University (XJTU)
Ilan Oshri
The University Auckland Business School, Auckland, New Zealand
Xiande Zhao
Department of Economics and Decision Sciences
China Europe International Business School (CEIBS)
April 2020
*
Corresponding author: Qiang Wang ([email protected]). Address: Department of Innovation, Entrepreneurship, and
Strategy, School of Management, Xi’an Jiaotong University (XJTU), No. 28 Xianning West Road, Beilin District, Xi’an, China
710049.
1
Value Cocreation in New Service Development: A Process-based View of
Resource Dependency
Abstract
Purpose – The purpose of this study is to examine value cocreation between service
firms, their business partners and customers at different stages of the new service
development (NSD) process.
Design/methodology/approach – The study explored hypotheses proposing that due
to different resource dependencies of the focal firm in three NSD stages (ideation,
development, and deployment), customers and partners play different roles in the NSD
process. Empirical data were collected from 200 NSD projects, and structural equation
modeling was used to test the hypothesized relationships.
Findings – The results show that customer value cocreation has a positive effect on
ideation performance and development performance, while business partner value
cocreation has a positive effect on deployment performance, thus supporting the notion
that the contributions of customers and business partners vary across the NSD stages.
Research limitations/implications – Future research may focus on how business
partners can be actively involved in the NSD process and how to safeguard different
parties’ interests during value cocreation. Longitudinal data may be used to better
examine the process dynamics.
Practical implications – The study provides managerial implications for service
managers in acquiring and allocating the resources needed from customers and business
partners across the various NSD processes.
Originality/value – The study contributes to the growing literature on NSD and service
innovation by empirically showing the respective performance contribution of
customers and business partners during different stages of NSD and shedding light on
the value cocreation mechanisms from the perspective of resource dependence theory.
Keywords: Value cocreation; new service development; service innovation; resource
dependency; empirical study
Paper type: Research paper
2
1. Introduction
Value cocreation activities in new service development (NSD) between focal firms
and their business partners and customers have attracted research attention in recent
years. Value cocreation is understood as a symbiotic relationship between an
organization and its primary stakeholders (i.e., its clients or partners) to co-produce and
customize services (Sarker et al., 2012). In this regard, value is co-created through
interactions that are associated with resource exchange and sharing (e.g., Grover and
Kohli, 2012), mutual learning (e.g., See-To and Ho, 2014), relationship building (e.g.,
Luo et al. 2015; Simões and Mason, 2012), and collective governance (e.g., Grover and
Kohli, 2012; Sarker et al., 2012). Indeed, one key aspect of research on value cocreation
is the relative contribution of each party (i.e., focal firm, business partners and
customers) to the success of the NSD. For example, it has been reported that business
partners have more influence on value cocreation in the development stage for tangible
goods (Petersen et al., 2003, 2005; van Echtelt et al., 2008), as compared to their
contribution to NSD (Ordanini and Parasuraman, 2011). Others have argued that
customer participation in NSD is key to its success, and often more significant than
customer contribution to the development of tangible goods (Alam and Perry, 2002).
Rooted in a service-dominant logic (Vargo and Lusch, 2004), the value cocreation
literature suggests that a firm’s value creation often requires resources from its
customers, employees, suppliers, and other network partners (Vargo et al., 2008; Vargo
and Lusch, 2011). While the NSD literature has acknowledged that both customers and
business partners play critical roles in creating value for the focal firm (Ordanini and
Parasuraman, 2011; Melton and Hartline, 2010), the degree to which each party co-
creates value during NSD process is unclear. In this regard, while the extant literature
indeed acknowledges the numerous stages in NSD (Nambisan, 2002), it sheds little
3
light on the changing contribution of business partners and customers to value
cocreation during different NSD stages. Further, each stage in the NSD is likely to
require different resources from the involved parties, therefore subjecting value
cocreation to resource-dependency (Hillman et al., 2009). For example, the early stage
of NSD is likely to be heavily reliant on information as a resource (Nambisan, 2002) to
help in shaping the idea of the service, while specialised expertise (Nambisan, 2002;
Roth and Menor, 2003; Al-Zu’bi and Tsinopoulos, 2012) and physical capital (Froehle
and Roth, 2009) will be required in the later stages to develop and deploy the service.
As such, we frame value cocreation in NSD as a resource-dependency challenge and
seek to unveil the relative effect of customers and business partners, subject to the focal
firm’s needs and behaviours during the innovation.
The focus of this paper is therefore value cocreation in NSD subject to the
involvement of customers and business partners at different NSD stages. Indeed, the
extant literature proposes several similar NSD stage models. For example, Johnson et
al. (2000) present a four-stage NSD model that includes design, analysis, development,
and launch stages. We have chosen to adopt the framing used by Nambisan (2002) and
Melton and Hartline (2010) to focus on ideation, development, and deployment
(including launch and post-launch deployment) as key stages of the NSD process.
Research on value cocreation has traditionally examined the business-to-consumer
context (Lambert and Enz, 2012), with little reference to and therefore limited
understanding of NSD stages and partner involvement in the business-to-business (B2B)
context. Several case studies have supported the necessity to explore value cocreation
in B2B services (e.g., Chowdhury et al., 2016; Komulainen, 2014; Lambert and Enz,
2012). Indeed, the role of customers and partners as co-creators is suggested to be more
evident in relation to industrial products than consumer products (Garvin, 1988;
4
Nambisan, 2002), and there are also cases that companies may oppress value cocreation
by consumers (e.g., Lee and Soon, 2017). As such, this study focuses on the
involvement of business customers and partners in B2B services.
To study value cocreation between focal firms and their customers and business
partners in different stages of the NSD, we tested the stage model using empirical data
collected from 200 NSD projects in various service industries associated with
information and communication technologies. The results generally support our claim
that customer value cocreation is associated with NSD performance in the early stages
and diminishes toward the later stages of NSD, while business partner value cocreation
increases performance toward the later stages of NSD. In this regard, our study
contributes to the growing literature on NSD and service innovation by empirically
showing the respective performance contribution of customers and business partners
during different stages of NSD and shedding light on the value cocreation mechanism
from the perspective of resource dependence theory. Contrary to our expectations,
business partner value cocreation is not associated with NSD performance in the
development stage, yet the effect of customer value cocreation still manifests in the
development stage, which also enriches our understanding of focal firms’ resource
dependencies and critical challenges in the NSD process.
2. Literature review and theoretical framework
2.1. Customers and business partners in NSD
Customers play a range of roles in the development of new services and products
(e.g., Nambisan, 2002; Bonner and Walker, 2004; Fang, 2008). Kristensson, Gustafsson,
and Archer (2004) argue that one important contribution of users applies to the idea
generation phase (as sources of creative ideas) in the process of new product
development (NPD), while Nambisan (2002) points out that “customers can be
5
involved not only in generating ideas for new products but also in co-creating them
with firms, in testing finished products, and in providing end user product support” (p.
392). Furthermore, Nambisan (2002) proposes that in different development stages
(ideation, design and development, product testing and support), customer roles range
from providing resources to being co-creators and users, respectively. In this regard,
Fang (2008) empirically differentiated two roles of the customer—as information
resource and co-developer, while Lusch and Nambisan (2015) identified three broad
roles of the customer, namely ideator, designer, and intermediary. Christensen (1997)
cites the case of the disk drive development, where the idea for smaller-sized hard
drives actually emerged from interactions with personal computer users. Different to
manufactured goods, inseparability is recognized as an important characteristic of
services, which require more intensive interaction between service firms and their
customers (Menor et al., 2002).
Alongside customers, business partners also play a critical role in focal firms’
innovations. Lusch and Nambisan (2015) suggest that innovations such as NSD no
longer develop “from within the confines of an organization; instead, they evolve from
the joint action of a network of actors ranging from suppliers and partners to customers
and independent inventors” (p. 155). Wang et al. (2016) found that collaboration with
suppliers contributes to the innovativeness of firms, and this effect is more significant
for service firms compared to manufacturing firms. Collaboration with customers or
business partners (such as suppliers) in innovation has been widely addressed in the
literature. However, with regard to innovation (or NPD/NSD), prior studies have
focused on the development stage or viewed the different stages as a whole, which
leaves room for a process approach that examines the different roles of customers and
partners in the different stages. Insufficient understanding of the differences across
6
stages when involving customers and business partners in innovation may lead to
inefficient management of the collaborative process by focal firms. For example, the
two roles of the customer – as information resource and co-developer – identified by
Fang (2008) may not be simultaneously exercised at every stage of the development
process for new services. Failures of collaboration initiatives are often reported as due
to a lack of attention to the process dynamics (Fawcett et al., 2012). A more in-depth
view of the process dynamics will enable previous understandings to be extended and
enriched.
2.2. NSD process models
Prior research has also proposed various process models for NPD (e.g., Booz et al.,
1982) and NSD (e.g., Voss, 1992; Johnson et al., 2000). Menor, Tatikonda, and
Sampson (2002) argue that NSD process models have exploited the basic stages of NPD
processes and provided new extensions to extend and enrich understanding of the
process in terms of the facilitating conditions, activities and outcomes. Further, Alam
and Perry (2002) suggest that a major difference between service and product
development is the intensive customer involvement in services.
Among NSD process models, Johnson et al.’s (2000) four-stage model is
commonly adopted. This model “captures the basic steps shared by most process
models in the NSD literature and succinctly reduces process steps to four general stages:
design, analysis, development, and full launch” (Melton and Hartline, 2010, p. 412).
The design stage involves the formulation of new service objectives and strategy, idea
generation and screening, and concept development. In the stage of analysis, the
potential profitability of the project is assessed, specifically with regard to whether the
project team should proceed. The development stage, on the other hand, is more
complex and involves service design and testing, process and system design and testing,
7
marketing program design and testing, operational and frontline personnel training, and
a pilot project. The final stage is the full-scale launch of the service to the targeted
markets. This four-stage process model has been adopted or adapted by numerous
studies including Menor, Tatikonda, and Sampson (2002) and Melton and Hartline
(2015).
In the four-stage model, the design stage is mainly about the generation and
screening of ideas and service concepts, often referred to as the fuzzy front-end in the
innovation process (Alam, 2006). Nambisan (2002) also emphasizes the importance of
idea generation and the resources needed in the ideation stage. From the perspective of
resource dependence (Pfeffer and Salancik, 2003), in this stage firms are dependent on
others and have to form cooperative relationships to gain access to needed external
resources in order to reduce uncertainty (i.e., fuzziness) in innovation. The analysis
stage in the four-stage model does not involve much activity (as it only covers business
analysis and project authorization), thus firms will be less dependent on others in this
stage. Prior research on collaborative innovation has often ignored this stage, or merged
it with the design stage. Further, some claim that the deployment of service innovations
has received insufficient attention (Costa and Dierickx, 2005; Wang et al., 2019). As
such, we include the fuzzy front-end design stage as part of the ideation stage (covering
both design and analysis), and thus focus on three main stages of NSD, namely ideation,
development, and deployment (covering launch and post-launch activities). The
respective value cocreation activities between a focal service firm and its business
partners and customers will be examined across these three stages. This approach
responds to calls for methods to capture how value is created and to understand value
creation processes in service innovation (Patrício et al., 2018).
2.3. Resource dependency in NSD
8
The resource dependence theory suggests that firms’ actions are mainly driven by
their resource considerations, and the resource complementarity among them
determines their relationships and interactions (Pfeffer and Salancik, 2003; Hillman et
al., 2009). The NSD literature has so far provided evidence that value cocreation is an
outcome of resources provided by key players, including customers (Yu and Sangiorgi,
2018). Although value creation may involve both economic value and social value
(Gassenheimer et al., 1998), in the NSD process the value is specific to economic value
in terms of the innovation outcomes (Ordanini and Parasuraman, 2011). In this regard,
we see a resource dependency in how specific value is co-created in the various stages
of NSD. Indeed, resource dependence theory assumes a link between external resources
and the firm’s behaviour, including strategic objectives. As such, the firm’s ability to
procure both tangible and intangible resources from external players is considered key
for its success. For example, Melton and Hartline’s (2010) study showed that resources
contributed by customers during the development stage have little effect on service
marketability, thus suggesting a lower degree of resource dependency by the focal firm
at this stage. On the other hand, resources contributed by customers during the design
stage signal a high degree of resource dependency by the focal firm as these resources
contribute to service marketability. Christensen (1997) also suggests that because
customers provide the resources upon which the firm is dependent, it is the customers
who direct managers’ resource allocation and exert a profound influence on patterns of
innovation. Accordingly, we frame value cocreation as a resource dependency
challenge in which resources contributed during the various stages of NSD co-create
value only when the focal firm depends on them to meet its objectives for different
stages.
9
Past studies that have examined the resources required for NSD highlight the
centrality of information for the design stage (Alam, 2006), expertise for the
development stage (Nambisan, 2002) and capital for the deployment stage (Froehle and
Roth, 2009). The front-end, i.e., the ideation stage, is the most information intensive
(Zahay et al., 2004). To reduce uncertainty in the front-end, information from external
sources (e.g., customer needs and market information) is the most critical resource for
the ideation stage. In the development stage, the expertise and intellectual capital
embedded in people and systems are crucial for the success of new services (Roth and
Menor, 2003; Oke, 2007). In the deployment stage, when the new service is launched
to target markets and/or further deployed, financial capital and marketing resources for
promotion and advertising become more critical (Froehle and Roth, 2009). Therefore,
from the perspective of value cocreation and resource dependency, we propose a staged
research framework to investigate the cocreation outcomes of customer and business
partner involvement in the ideation, development, and deployment stages of the NSD
process.
--- Insert Figure 1 about Here ---
3. Hypotheses development
3.1. Value Cocreation in Ideation
The stage of idea generation is the starting block for an NSD project. We argue
that the value cocreation activities in ideation are mainly information driven, as
information is the key resource the firm is dependent on (Rochford, 1991; Alam, 2006;
Yu and Sangiorgi, 2018). Indeed, the important contributions of customers in the idea
generation phase are acknowledged in prior research (Nambisan, 2002; Kristensson et
al., 2004; Fang, 2008). Alam and Perry (2002) provide support for customer
10
involvement in idea generation influencing the success of new service ideas. They argue
that rather waiting for customers to come forward with ideas, service firms should reach
out to customers to seek their ideas. Indeed, Alam (2006) provided additional support
for the dependency of the focal firm on information provided by customers, quoting a
CEO from one of the case studies stating that: “Our clients have a much better access
to overseas markets’ information. Obtaining that information was easy and quick via
customer interaction” (p. 473).
In addition to customers, partners in the business network are also external sources
of information (Zahay et al., 2004). Network partners with technological collaborations
can provide information including news of technical breakthroughs and new insights to
problems (Ahuja, 2000). Key partners such as suppliers can “provide the technical
expertise to evaluate the feasibility of new product ideas during the early stages of NPD
before large financial investments have been made” (Al-Zu’bi and Tsinopoulos, 2012,
p. 669). Wang et al. (2016) also suggested that suppliers’ roles in both service and
manufacturing innovation may involve consultation on design ideas. However, since
success in the ideation stage is mainly dependent on understanding customers’ needs
(current and potential), we expect that customer involvement in the ideation stage
should make a greater contribution to the innovativeness of new service concepts
generated compared to the involvement of business partners. We thus advance the
following hypothesis:
H1. In the ideation stage of service innovation, due to the dependence on information,
customer value cocreation has a stronger positive effect on service concept newness
than business partner value cocreation.
3.2. Value Cocreation in Development
11
The development stage has been at the centre of many studies on new service or
product development. Indeed, extant literature proposes that in this stage, success is
tightly linked to the ability of the firm to co-develop the service with stakeholders, both
customers and business partners (Fang, 2008). As such, we view resource dependency
in this stage as revolving around the expertise needed for co-development of the service.
Because customers are viewed as predominately providing information (Fang, 2008),
they are involved in testing and customer-relationship training (Melton and Hartline,
2010) rather than actual co-development activities.
The involvement of business partners in the development stage, on the other hand,
is often described as a building block in the delivery of a new service. Indeed, business
partners such as suppliers are frequently responsible for the development of specific
components or even whole systems (Wang et al., 2016). Yu and Sangiorgi (2018)
describe the case of “Partner Zone”, a website designed to enable teachers to easily
access and introduce the work to their students in classes. In this case, the designers
conducted user-centred research and generated service ideas and prototypes, while
collaborating with stakeholders (partners) to develop the website. As such, the focal
firm’s ability to integrate its abilities with business partners’ expertise is critical for the
success of the development stage. While involving customers in the development stage
is key to testing and the development of a customer-friendly service (Edvardsson and
Olsson, 1996), business partners are viewed as offering greater value to the
development stage by contributing expertise when components and service platforms
are co-developed (Al-Zu’bi and Tsinopoulos, 2012; Fu et al., 2017). As such we
advance the following hypothesis:
12
H2: In the development stage of service innovation, due to the dependence on
development expertise, business partner value cocreation has a stronger positive effect
on development performance than does customer value cocreation.
3.3. Value Cocreation in Deployment
The success of the launch and deployment stage is dependent on marketing
resources (Vorhies and Morgan, 2003; Fang, 2008) and financial capital (Froehle and
Roth, 2009). Wang et al. (2019) found that the lack of an appropriate partner involved
in deployment may lead to a market failure. They therefore argue the deployment stage
requires a marketing effort as well as a strategy to mitigate potential risks. In one of
their ten cases, “Synergistic classroom”, the deployment of the new service was actually
undertaken by an external partner with marketing resources to deploy it to the target
market (i.e., local schools in different cities). Customers can support marketing efforts
by providing a word of mouth testimony (Brown et al., 2005). Yet, as markets are
saturated with competing services, firms need to invest in marketing campaigns to
signal their superior abilities compared to competing services, as well as to inform
potential buyers of their services (Petersen et al., 2005; van Echtelt et al., 2008). Thus,
orchestrating a service deployment with business partners requires a joint risk
mitigation approach involving joint investment of capital to ensure that services are
available and potential buyers are informed of the value delivered (Chien and Chen,
2010). As such we expect that business partners play a greater role than customers in
the deployment sage, and accordingly propose that:
H3: In the deployment stage of service innovation, due to the dependence on marketing
resources and the need to share potential risks, partner value cocreation has a stronger
positive effect on deployment performance than does customer value cocreation.
13
4. Method
4.1. Sampling Design and Data Collection
To empirically test the hypotheses, we randomly selected 1000 companies from
the four first-tier cities in China, namely Beijing, Shanghai, Shenzhen and Guangzhou.
The sampling pool consisted of service firms listed in the database of the National
Bureau of Statistics and headquartered in any of the four cities. Based on the
classification of industries in China (national standard GB/T 4754-2011), we selected
“Category I: information communication, software, and IT services”, as these industries
have been the most prosperous in recent years in terms of service innovation.
This study focuses on the value cocreation activities in NSD process, thus the unit
of analysis is the NSD project. Through a pilot test of the questionnaire, feedbacks were
gathered, suggesting that it was better to recruit project leaders as the key informants,
as they are knowledgeable and familiar with NSD activities. The survey was conducted
from 2015 to 2016, and one of the largest professional survey companies in China was
employed to collect the data. First, the survey company trained its data managers about
the data collection criteria and process. Randomly selected companies were then
contacted by data managers via telephone to gather contact information for the most
suitable respondents. Each firm was asked to provide contact information for no more
than two service innovation projects being run by different leaders. Finally, an
appointment with each informant was made by a data manager, who would then take a
printed copy of the questionnaire and conduct an on-site visit to collect the data from
the informant. As the questionnaire surveyed different stages of the NSD process,
before asking questions with regards to each stage, the data managers would explain to
the informants how the three stages are divided and what each stage is mainly about.
Our study uses ideation stage to include both design and analysis activities for new
14
service ideas and concepts (also covering the fuzzy front-end); development stage
covers service design and testing, process and system design and testing, marketing
program design and testing, personnel training, service testing and pilot run;
deployment stage covers full-scale launch of the service to the targeted markets, and
post-launch deployment activities. We also asked the data managers to pause for five
minutes before asking questions about the next stage. Finally, the data collection efforts
resulted in 200 usable questionnaires for service innovation projects from 141
companies, giving a response rate of 14.1%.
4.2. Instrument Development
To measure the constructs in this research, we first reviewed the literature and
involved relevant scholars and practitioners from various service companies.
Specifically, we invited four professors (three in operations management and one in
marketing), who had rich research and teaching experiences in both Chinese and
Western universities, to assist with the design of measurement items. Sixty managers
of service innovation projects were invited to participate in the pilot test. We conducted
face-to-face interviews with them to check the appropriateness of the measurements
and examine if there were any missing aspects. The questionnaire was developed using
languages of both English and Chinese, thus two-way translations were conducted. The
resulting measurement items are listed in Table I.
Ideation performance was measured according to the innovativeness of new
service concepts, as captured by three items for the newness of service (see Table I).
The 7-point Likert scale was used, with ‘1’ indicating ‘strongly disagree’ and ‘7’ for
‘strongly agree’. The question was framed as follows: “Before the actual development
of this innovation, we thought the concept of this new service had the following
characteristics”. The respondent was asked to indicate his/her level of agreement.
15
Development performance was measured by three items regarding speed, and
deployment performance was measured using three items for efficiency in terms of
speed, cost and other objectives, as adapted from previous studies including Melton and
Hartline (2010), Carbonell et al. (2009), and Avlonitis et al. (2001).
Customer value cocreation and business partner value cocreation were measured
by items adapted from Ordanini and Parasuraman (2011) and Gruner and Homburg
(2000). The respondent was asked to indicate his/her degree of agreement regarding
statements about the customer’s or business partner’s involvement and collaborative
activities during the idea generation stage, the development stage, and market launch
and deployment stage, respectively.
4.3. Respondent Profile
A wide variety of service innovation projects were covered. Respondents mainly
included top management and general managers, and the average size of project teams
was 11.86 members. The average project development investment was 2.22 million
RMB, and the average project deployment investment was 0.86 million RMB.
5. Analysis and results
5.1 Common Method Variance
As we collected data from a single informant per project, common method bias
might be a problem (Podsakoff et al., 2003). First, as the appropriate arrangement of
the measurements in a questionnaire could help mitigate informants’ motivation of
consistency and reduce common method bias consequently (Podsakoff and Organ,
1986), this study provided different instructions to different scales, and put adjacent
variables in the theoretical model in distinct questionnaire sections. Second, to confirm
the success of this strategy, a test recommended by Podsakoff et al. (2003) was
16
conducted. In particular, adopting the analysis procedure used by Liang et al. (2007),
we compared two measurement models, with one having all the traits and the other
adding in a method factor. We found that the path coefficients were insignificant and
subtle. Third, the correlation matrix was examined to see whether high correlations
existed, as Pavlou et al. (2007) suggest that in cases without excessively high
correlations (> 0.9) common method bias will be unlikely. Based on these analyses, it
is reasonable to conclude that common method bias does not appear a problem in this
study. We also examined the non-response bias by comparing the late and early
responses for number of employees, number of project team members and some other
variables (Armstrong and Overton, 1977), while the t-tests did not show significant
differences, suggesting that non-response bias is not likely to be a problem.
5.2. Reliability and Validity
This study followed a rigorous process in the development and validation of
instruments. To ensure the content validity of all the constructs, an extensive review of
prior literature and executive interviews and pilot tests were conducted. Then a series
of analyses of the data were conducted to examine constructs reliability and validity.
Exploratory factor analyses (EFA) was conducted using both orthogonal and
oblique rotations, and the results showed that all items loaded well onto the
hypothesized factors and there were no significant cross-loadings. For all the constructs,
Cronbach’s alpha values (Table I) were hinger than 0.7, indicating a good reliability.
Following Hair et al. (2006), the composite reliability (CR) and the average variance
extracted (AVE) were also used to assess construct reliability. When AVE is over 0.5
and CR is over 0.70, it indicates that the variance by the trait is greater than that by
error terms.
17
Then we examined convergent and discriminant validity as recommended by
O’Leary-Kelly and Vokurka (1998). Convergent validity was achieved by showing that
all the factor loadings were over 0.50, with t-values larger than 2.0.
To check the discriminant validity, the square root of each construct’s AVE was
compared against its correlations with all the other constructs. If no correlation is
greater than the square root of AVE, the discriminant validity between constructs will
be achieved (Table II).
--- Insert Table I about Here ---
--- Insert Table II about Here ---
5.3. Structural Equation Modeling and Results
The hypotheses were tested using structural equation modeling (SEM), with the
bootstrapping-based partial least squares (PLS) approach (Hair et al., 2012; Peng and
Lai, 2012; Storey and Larbig, 2018). We adopted SmartPLS 3.2.8 version in this
research to assess the measurement model and structural model (Ringle et al., 2015).
As recommended, 5000 bootstrap samples were derived from the original sample.
In general, the results show that customer value cocreation and business partner
value cocreation activities contribute to service innovation performance, but the effects
vary in different stages (see Table III). Customer value cocreation has been found a
significant positive effect on ideation performance (with a coefficient of 0.204 and p <
0.05), and a significant positive effect on development performance (with a coefficient
of 0.167 and p < 0.05), while its effect on development performance is not significant.
On the other hand, partner value cocreation has been found a significant positive effect
on deployment performance (with a coefficient of 0.172 and p < 0.01), while its effects
on ideation performance and development performance are not significant. To test the
18
hypotheses, the path coefficients for the direct effects in the 5000 bootstrap samples
were compared using subtraction, which generated the difference (in terms of effects
on performance) between customer value cocreation and partner value cocreation in
three stages and respective significance levels as shown in Table III. Specifically,
customer value cocreation was found to have a stronger impact in the ideation stage
than partner value cocreation (difference = 0.201 and p < 0.05, supporting H1), and a
weaker impact in the deployment stage (difference = -0.046 and p < 0.05, supporting
H3). However, customer value cocreation was found to have a stronger impact in the
development stage (difference = 0.190 and p < 0.05), which rejected H2.
6. Discussion and Conclusion
6.1. Major findings
Our empirical results suggest that in different stages of the NSD process,
customers and partners play different roles by providing complementary resources to
the focal service firms across the process, contributing to performance indicators of
different stages. Consistent with our expectations, customer value cocreation is found
to be more crucial in the early stages of NSD, while business partners are more
important toward the later stages. In particular, this study reveals that customer value
cocreation has a positive effect on ideation performance and development performance,
while partner value cocreation has a positive effect on deployment performance.
However, the involvement of business partners in the development stage is not
associated with improved development performance in terms of speed, which is
contrary to our expectations. A possible explanation is that new services are often
difficult to protect by patents (Tufano, 1989), and accordingly focal service firms may
be hesitant to involve business partners (who could also be potential competitors) to a
very great extent. As such, business partners are found to have an insignificant effect.
19
By computing the mean value of partner value cocreation in the development stage and
comparing against customer value cocreation (Table II), it shows that customers were
involved to a greater extent than business partners (4.709 versus 2.711), which partially
supports our explanation.
6.2. Theoretical and managerial implications
The results are consistent with resource dependence theory and provide support to
the notion that the roles of customers and partners in NSD are subject to the resource
dependency of the focal service firm. This research has implications for the NSD
literature. First, it provides empirical support for information from customers as the key
resource dependency in the ideation stage of NSD. We found no significant effect of
business partner value cocreation on ideation performance, which may indicate that
firms do not effectively involve business partners in idea generation, or that information
from customers is the key resource dependency (Patrício et al., 2018). Previous studies
suggest that customers’ key role in innovation is as an information resource (e.g.,
Nambisan, 2002; Fang, 2008). This empirical study further substantiates that for service
innovations, information resource dependency is contingent on the stages of NSD
process, and it is only in the ideation stage that customers act as the information
resource to cocreate value with the focal service firm. Managerially, the findings
suggest that service firms should not just “listen” to customers. Rather, they need to
actively involve customers in ideation so that the sticky information (Hippel, 1994)
about customer needs and context can be acquired to design innovative new services.
Second, although business partners are also believed to cocreate value with the
focal firm by providing their development expertise, the empirical results of this study
only support customers in the role of co-developer, which further highlights the
necessity of involving customers (especially business customers) in service innovation.
20
From the results of their study of public service design, Trischler et al. (2018) suggest
that actively involving customers in service codesign could leverage innovation
performance in the form of user benefit and novelty. Our study echoes this conclusion,
empirically supporting customers’ cocreation role in service codesign. The
inseparability characteristic of service requires more intensive interactions with
customers, while vulnerability to imitation and dysfunctional competition hinder
business partners’ value cocreation in the development stage, as they might be potential
competitors to the focal service firm.
Third, business partners are found to cocreate value in the deployment stage of the
NSD process via joint-investment in capital, which supports the resource dependency
involved in launching and deploying new services. Another interesting finding is that
although customers were involved to quite a great extent in the deployment stage as
well (Mean = 5.153), it did not exhibit a significant impact on deployment performance,
which indicates that the key resource needed for deployment is not offered by customers
(but business partners), regardless of how they are intensively involved. This research
responds to the call for empirical investigation of the deployment of service innovations
(Wang et al., 2019) by extending the process view to cover the after-launch deployment
stage, and examining value cocreation activities at this stage in particular.
In sum, this research contributes to our understanding of value cocreation
processes in service innovation and reveals the effect of each stakeholder’s value
cocreation on NSD performance. Patrício et al. (2018) argue for “the need to develop
methods to capture information when value is created” (p. 8) and “to identify,
understand, and adopt knowledge about the value creational processes” (p. 9). Taking
a process view, this study has used performance indicators for different NSD stages to
capture when value is created, and focused on value cocreation with customers and
21
business partners to understand how external knowledge and resources are adopted in
a value creational process.
The findings also have significant managerial implications for helping service
firms allocate limited resources more efficiently across the NSD process. In recent years,
the development of information and communication technologies has not only enabled
companies to develop new services or transform traditional services, but also
dramatically changed the way in which value is created, from a value chain paradigm,
gradually towards a network paradigm with value created collaboratively. This research
suggests that a collaborative value cocreation approach for service innovation, which
allows different parties in the business network to contribute their specific resources
and knowledge actively across the NSD process, is the most effective. Managers can
benefit from a process-based view of resource dependency by identifying the resource
needs at different stages of the NSD process and facilitating value cocreation with the
parties who possess the needed resources. In the fuzzy front-end stage of ideation,
service designers who actively and collaboratively involve customers can show greater
novelty and creativity by tapping into information about latent customer needs. Further,
in the development stage, incorporating customers’ development knowledge and
expertise can speed up the development process. After the new service has been
developed, service firms with financial resource constraints should involve business
partners to co-deploy it effectively so that the market can be quickly occupied ahead of
competition.
6.3. Limitations and Future Opportunities
The findings of this research have several limitations that also indicate future
research opportunities. First, it used data from IT-related service industries, thus the
results of this research are tentative and subject to the characteristics of these industries.
22
Although these industries are the most prosperous in terms of innovation, these results
might not be equally applicable to some traditional service industries with less IT
features. Second, our sample is limited to Chinese firms. Thus, caution should be
exercised when generalizing our results to other areas beyond China. Third, this
research uses cross-sectional data. It would be better to collect longitudinal data to
examine whether these findings hold over time. Finally, regarding the unsupported role
of business partners in the key development stage of NSD, further efforts should be
made to understand how partners can be actively involved when development expertise
is highly needed, and how to safeguard the different parties’ interests during value
cocreation.
References
Al-Zu’bi, Z. M. F. and Tsinopoulos, C. (2012), “Suppliers versus lead users: examining
their relative impact on product variety”, Journal of Product Innovation
Management, Vol. 29 No. 4, pp.667-680.
Alam, I. (2006), “Removing the fuzziness from the fuzzy front-end of service
innovations through customer interactions”, Industrial Marketing Management, Vol.
35 No. 4, pp.468-480.
Alam, I. and Perry, C. (2002), “A Customer-oriented new service development process”,
Journal of Services Marketing, Vol. 16 No. 6, pp.515-534.
Armstrong, J. S., and Overton, T. S. (1977), “Estimating nonresponse bias in mail
surveys”, Journal of Marketing Research, Vol. 14 No. 3, pp.396-402.
Avlonitis, G. J., Papastathopoulou, P. and Gounaris, S. (2001), “An empirically-based
typology of product innovativeness for new financial services: Success and failure
scenarios”, Journal of Product Innovation Management, Vol. 18 No. 5, pp.324-342.
Bonner, J. M. and Walker, O. C. (2004), “Selecting influential business-to-business
customers in new product development: relational embeddedness and knowledge
heterogeneity considerations”, Journal of Product Innovation Management, Vol. 21
No. 3, pp.155-169.
Booz, Allen & Hamilton (1982). New products management for the 1980s. Booz, Allen
& Hamilton, New York
Brown, T. J., Barry, T. E., Dacin, P. A. and Gunst, R. F. (2005), “Spreading the word:
investigating antecedents of consumers’ positive word-of-mouth intentions and
behaviors in a retailing context”, Journal of the Academy of Marketing Science, Vol.
33 No. 2, pp.123-138.
Carbonell, P., Rodríguez-Escudero, A. I. and Pujari, D. (2009), “Customer involvement
in new Service development: an examination of antecedents and outcomes”,
Journal of Product Innovation Management, Vol. 26 No. 5, pp.536-550.
23
Chien, S. and Chen, J. (2010), “Supplier involvement and customer involvement effect
on new product development success in the financial service industry”, Service
Industries Journal, Vol. 30 No. 2, pp.185-201.
Chowdhury, I. N., Gruber, T. and Zolkiewski, J. (2016), “Every cloud has a silver lining
— Exploring the dark side of value co-creation in B2B service networks”, Industrial
Marketing Management, Vol. 55, pp.97-109.
Christensen, C. (1997), The Innovator’s Dilemma. Harvard Business School Press,
Boston.
Costa, L. A. and Dierickx, I. (2005), “The strategic deployment of quality-improving
innovations”, The Journal of Business, Vol. 78 No. 3, pp.1049-1072.
Edvardsson, B. and Olsson, J. (1996), “Key concepts for new service development”,
Service Industries Journal, Vol. 16 No. 2, pp.140-164.
Enz, Matias Guillermo (2010), Co-creation of Value: Managing Cross-functional
Interactions in Buyer-Supplier Relationships. doctoral dissertation, The Ohio State
University, Ann Arbor.
Fang, E. (2008), “Customer participation and the trade-off between new product
innovativeness and speed to market”, Journal of Marketing, Vol. 72 No. 4, pp.90-
104.
Fawcett, S. E., Fawcett, A. M., Watson, B. J. and Magnan, G. M. (2012), “Peeking
inside the black box: toward an understanding of Supply chain collaboration
dynamics”, Journal of Supply Chain Management, Vol. 48 No. 1, pp.44-72.
Froehle, C. M. and Roth, A. V. (2009), “A Resource-process framework of new service
development”, Production and Operations Management, Vol. 16 No. 2, pp.169-188.
Fu, W., Wang, Q. and Zhao, X. (2017), “The influence of platform service innovation
on value co-creation activities and the network effect. Journal of Service
Management, Vol. 28 No. 2, pp.348-388.
Garvin, D. A. (1988), Managing Quality. New York: Free Press.
Gassenheimer, J. B. , Houston, F. S. and Davis, J. C. (1998), “The role of economic
value, social value, and perceptions of fairness in interorganizational relationship
retention decisions”, Journal of the Academy of Marketing Science, Vol. 26 No. 4,
pp.322-337.
Grover, V. and Kohli, R. (2012), “Cocreating IT value: new capabilities and metrics for
multifirm environments”, MIS Quarterly, Vol. 36 No. 1, pp.225-232.
Gruner, K. E. and Homburg, C. (2000), “Does customer interaction enhance new
product success”, Journal of Business Research, Vol. 49 No. 1, pp.1-14.
Hair, J.F., Black, W.C., Babin, B.J., Anderson, R.E. and Tatham, R.L. (2006),
Multivariate Data Analysis, 6th ed. Prentice-Hall, Inc., New Jersey.
Hair, J. F., Sarstedt, M., Ringle, C. M. and Mena, J. A. (2012), “An assessment of the
use of partial least squares structural equation modeling in marketing research”,
Journal of the Academy of Marketing Science, Vol. 40 No. 3, pp.414-433.
Hillman, A. J., Withers, M. C. and Collins, B. J. (2009), “Resource dependence theory:
a review”, Journal of Management, Vol. 35 No. 6, pp.1404-1427.
Hippel, E. V. (1994), “Sticky information and the locus of problem solving:
implications for innovation”, Management Science, Vol. 40 No. 4, pp.429-439.
Johnson, S. P., Larry, J. M., Aleda, V. R. and Richard, B. C. (2000), A critical evaluation
of the new service development process. in New Service Development, J. A.
Fitzsimmons & M. J. Fitzsimmons (eds). Thousand Oaks, CA: Sage Publications.
Komulainen, H. (2014), “The role of learning in value co-creation in new technological
B2B services”, Journal of Business & Industrial Marketing, Vol. 29 No. 3, pp.238-
252.
24
Kristensson, P., Gustafsson, A. and Archer, T. (2004), “Harnessing the creative potential
among users”, Journal of Product Innovation Management, Vol. 21 No. 1, pp.4-14.
Lambert, D. M. and Enz, M. G. (2012), “Managing and measuring value co-creation in
business-to-business relationships”, Journal of Marketing Management, Vol. 28 No.
13-14, pp.1588-1625.
Lee, M.S. and Soon, I. (2017), “Taking a bite out of Apple: Jailbreaking and the
confluence of brand loyalty, consumer resistance and the co-creation of value”,
Journal of Product & Brand Management, Vol. 26 No. 4, pp.351-364.
Liang, H., Saraf, N., Hu, Q. and Xue, Y. (2007), “Assimilation of enterprise systems:
the effect of institutional pressures and the mediating role of top management”, MIS
Quarterly, Vol. 31 No. 1, pp.59-87.
Luo, N., Zhang, M. and Liu, W. (2015), “The effects of value co-creation practices on
building harmonious brand community and achieving brand loyalty on social media
in China”, Computers in Human Behavior, Vol. 48, pp.492-499.
Lusch, R. F. and Nambisan, S. (2015), “Service innovation: a service-dominant logic
perspective”, MIS Quarterly, Vol. 39 No. 1, pp.155-176.
Melton, H. L. and Hartline, M. D. (2015), “Customer and employee co-creation of
radical service innovations. Journal of Services Marketing, Vol. 29 No. 2, pp.112-
123.
Melton, H. L. and Hartline, M. D. (2010), “Customer and frontline employee influence
on new service development performance. Journal of Service Research, Vol. 13 No.
4, pp.411-425.
Menor, L. J., Tatikonda, M. V. and Sampson, S. E. (2002), “New service development:
areas for exploitation and exploration. Journal of Operations Management, Vol. 20
No. 2, pp.135-157.
Nambisan, S. (2002), “Designing virtual customer environments for new product
development: toward a theory. Academy of Management Review, Vol. 27 No. 3,
pp.392-413.
O’Leary-Kelly, S. W. and Vokurka, R. J. (1998), “The empirical assessment of construct
validity. Journal of Operations Management, Vol. 16 No. 4, pp.387-405.
Oke, A. (2007), “Innovation types and innovation management practices in service
companies. International Journal of Operations & Production Management, Vol.
27 No. 6, pp.564-587.
Ordanini, A. and Parasuraman, A. (2011), “Service innovation viewed through a
service-dominant logic lens: a conceptual framework and empirical analysis.
Journal of Service Research, Vol. 14 No. 1, pp.3-23.
Ostrom, A. L., Parasuraman, A., Bowen, D. E., Patricio, L. and Voss, C. A. (2015),
“Service research priorities in a rapidly changing context. Journal of Service
Research, Vol. 18 No. 2, pp.127-159.
Pavlou, P. A., Liang, H. and Xue, Y. (2007), “Understanding and mitigating uncertainty
in online exchange relationships: a principal- agent perspective”, MIS Quarterly,
Vol. 31 No. 1, pp.105-136.
Patrício, L., Gustafsson, A. and Fisk, R. P. (2018), “Upframing service design and
innovation for research impact”, Journal of Service Research, Vol. 21 No. 1, pp.3-
16.
Peng, D. X. and Lai, F. (2012), “Using partial least squares in operations management
research: a practical guideline and summary of past research”, Journal of
Operations Management, Vol. 30 No. 6, pp.467-480.
Petersen, K. J., Handfield, R. B. and Ragatz, G. L. (2003), “A model of supplier
integration into new product development”, Journal of Product Innovation
25
Management, Vol. 20 No. 4, pp.284-299.
Petersen, K. J., Handfield, R. B. and Ragatz, G. L. (2005), “Supplier integration into
new product development: coordinating product, process and supply chain design”,
Journal of Operations Management, Vol. 23 No. 3, pp.371-388.
Pfeffer, J. and Salancik, G. R. (2003), The External Control of Organizations: A
Resource Dependence Perspective, Stanford University Press, Palo Alto, CA.
Podsakoff, P. M. and Organ, D. W. (1986), “Self-reports in organizational research:
problems and prospects”, Journal of Management, Vol. 12 No. 4, pp.531-544.
Podsakoff, P. M., Mackenzie, S. B., Lee, J. and Podsakoff, N. P. (2003), “Common
method biases in behavioral research: A critical review of the literature and
recommended remedies”, Journal of Applied Psychology, Vol. 88 No. 5, pp.879-
903.
Ringle, C. M., Wende, S., Becker, J. M. (2015), SmartPLS 3. Boenningstedt: SmartPLS
GmbH, http://www.smartpls.com.
Rochford, L. (1991). Generating and screening new product ideas”, Industrial
Marketing Management, Vol. 20 No. 4, pp.287-296.
Roth, A. V. and Menor, L. J. (2009), “Insights into service operations management: a
research agenda”, Production and Operations Management, Vol. 12 No. 2, pp.145-
164.
Sarker, S., Sarker, S., Sahaym, A. and Bjornandersen, N. (2012), “Exploring value
cocreation in relationships between an ERP vendor and its partners: a revelatory
case study”, MIS Quarterly, Vol. 36 No. 1, pp.317-338.
See-To, E. W. and Ho, K. K. (2014), “Value co-creation and purchase intention in social
network sites: the role of electronic word-of-mouth and trust - a theoretical
analysis”, Computers in Human Behavior, Vol. 31, pp.182-189.
Simões, C. and Mason, K.J. (2012), “Informing a new business-to-business relationship:
Corporate identity and the emergence of a relationship identity”, European Journal
of Marketing, Vol. 46 No. 5, pp.684-711.
Storey, C. and Larbig, C. (2018), “Absorbing customer knowledge: how customer
involvement enables service design success”, Journal of Service Research, Vol. 21
No. 1, pp.101-118.
Trischler, J., Pervan, S. J., Kelly, S. J. and Scott, D. (2018), “The value of codesign :
the effect of customer involvement in service design teams”, Journal of Service
Research, Vol. 21 No. 1, pp.75-100.
Tufano, P. (1989), “Financial innovation and first-mover advantages”, Journal of
Financial Economics, Vol. 25 No. 2, pp.213-240.
van Echtelt, F., Wynstra, F., Van Weele, A. J. and Duysters, G. (2008), “Managing
supplier involvement in new product development: a multiple-case study”, Journal
of Product Innovation Management, Vol. 25 No. 2, pp.180-201.
Vargo, S. L. and Lusch, R. F. (2004), “Evolving to a new dominant logic for marketing”,
Journal of Marketing, Vol. 68 No. 1, pp.1-17.
Vargo, S. L. and Lusch, R. F. (2011), “It’s all B2B…and beyond: toward a systems
perspective of the market”, Industrial Marketing Management, Vol. 40 No. 2,
pp.181-187.
Vargo, S. L., Maglio, P. P. and Akaka, M. A. (2008), “On value and value co-creation:
a service systems and service logic perspective”, European Management Journal,
Vol. 26 No. 3, pp.145-152.
Vorhies, D. W. and Morgan, N. A. (2003), “A configuration theory assessment of
marketing organization fit with business strategy and its relationship with marketing
performance”, Journal of Marketing, Vol. 67 No. 1, pp.100-115.
26
Voss, C. (1992), “Applying service concepts in manufacturing”, International Journal
of Operations & Production Management, Vol. 12 No. 4, pp.93-99.
Wang, Q., Voss, C. A. and Zhao, X. (2019), “Deployment strategies for service
innovation”, IEEE Transactions on Engineering Management, Vol. 66 No. 4,
pp.514-528.
Wang, Q., Zhao, X. and Voss, C. (2016), “Customer orientation and innovation: a
comparative study of manufacturing and service firms”, International Journal of
Production Economics, Vol. 171 No. 2, pp.221-230.
Yu, E. and Sangiorgi, D. (2018), “Service design as an approach to implement the value
cocreation perspective in new service development”, Journal of Service Research,
Vol. 21 No. 1, pp.40-58.
Zahay, D., Griffin, A. and Fredericks, E. (2004), “Sources, uses, and forms of data in
the new product development process”, Industrial Marketing Management, Vol. 33
No. 7, pp.657-666.
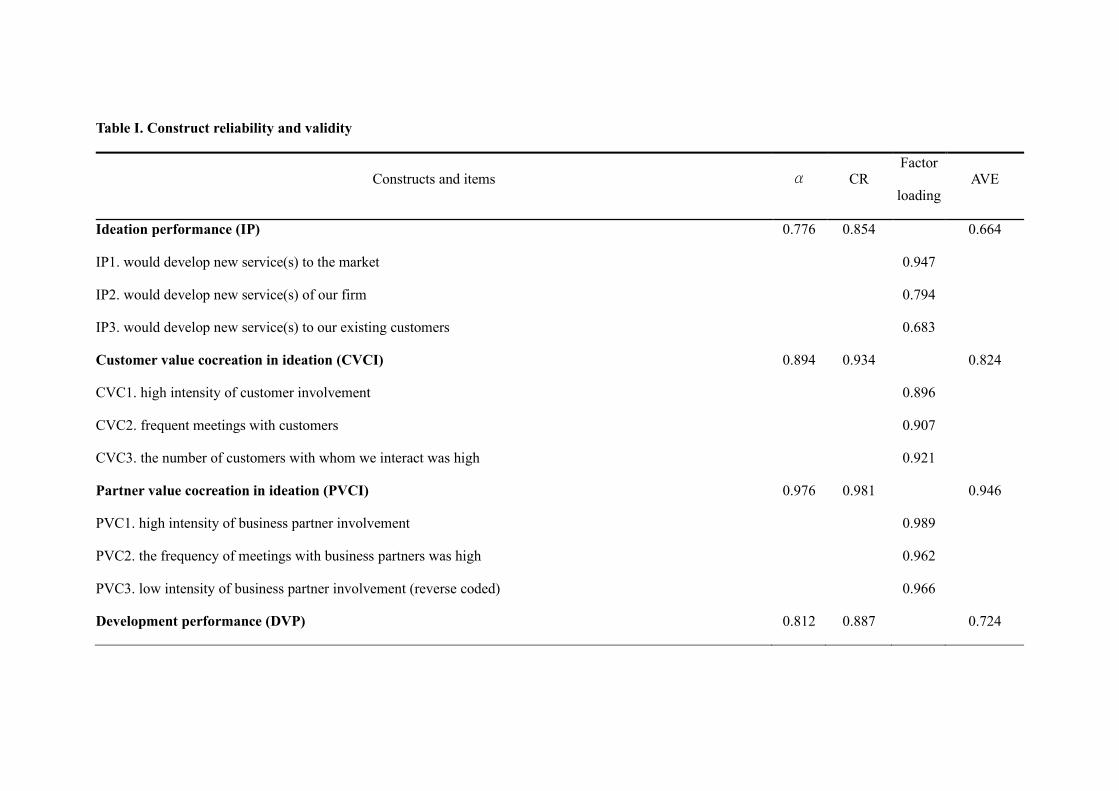
Table I. Construct reliability and validity
Constructs and items α CR Factor
loading
AVE
Ideation performance (IP) 0.776 0.854 0.664
IP1. would develop new service(s) to the market 0.947
IP2. would develop new service(s) of our firm 0.794
IP3. would develop new service(s) to our existing customers 0.683
Customer value cocreation in ideation (CVCI) 0.894 0.934 0.824
CVC1. high intensity of customer involvement 0.896
CVC2. frequent meetings with customers 0.907
CVC3. the number of customers with whom we interact was high 0.921
Partner value cocreation in ideation (PVCI) 0.976 0.981 0.946
PVC1. high intensity of business partner involvement 0.989
PVC2. the frequency of meetings with business partners was high 0.962
PVC3. low intensity of business partner involvement (reverse coded) 0.966
Development performance (DVP) 0.812 0.887 0.724
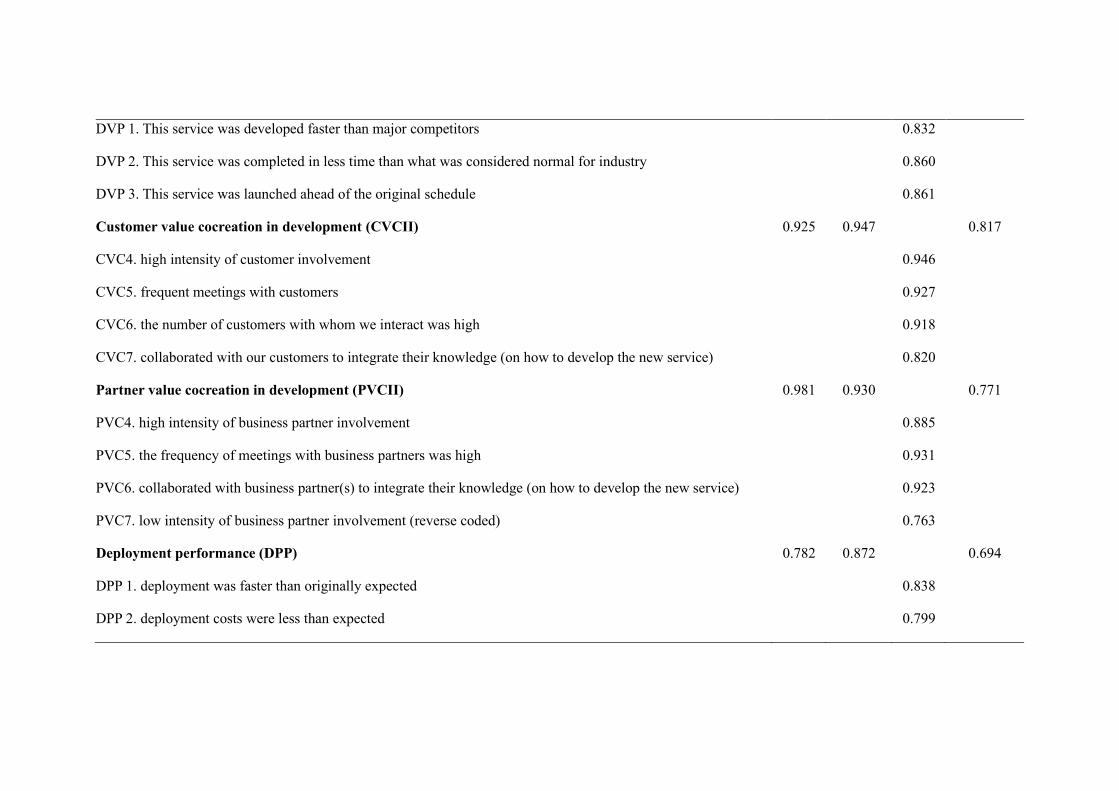
DVP 1. This service was developed faster than major competitors 0.832
DVP 2. This service was completed in less time than what was considered normal for industry 0.860
DVP 3. This service was launched ahead of the original schedule 0.861
Customer value cocreation in development (CVCII) 0.925 0.947 0.817
CVC4. high intensity of customer involvement 0.946
CVC5. frequent meetings with customers 0.927
CVC6. the number of customers with whom we interact was high 0.918
CVC7. collaborated with our customers to integrate their knowledge (on how to develop the new service) 0.820
Partner value cocreation in development (PVCII) 0.981 0.930 0.771
PVC4. high intensity of business partner involvement 0.885
PVC5. the frequency of meetings with business partners was high 0.931
PVC6. collaborated with business partner(s) to integrate their knowledge (on how to develop the new service) 0.923
PVC7. low intensity of business partner involvement (reverse coded) 0.763
Deployment performance (DPP) 0.782 0.872 0.694
DPP 1. deployment was faster than originally expected 0.838
DPP 2. deployment costs were less than expected 0.799
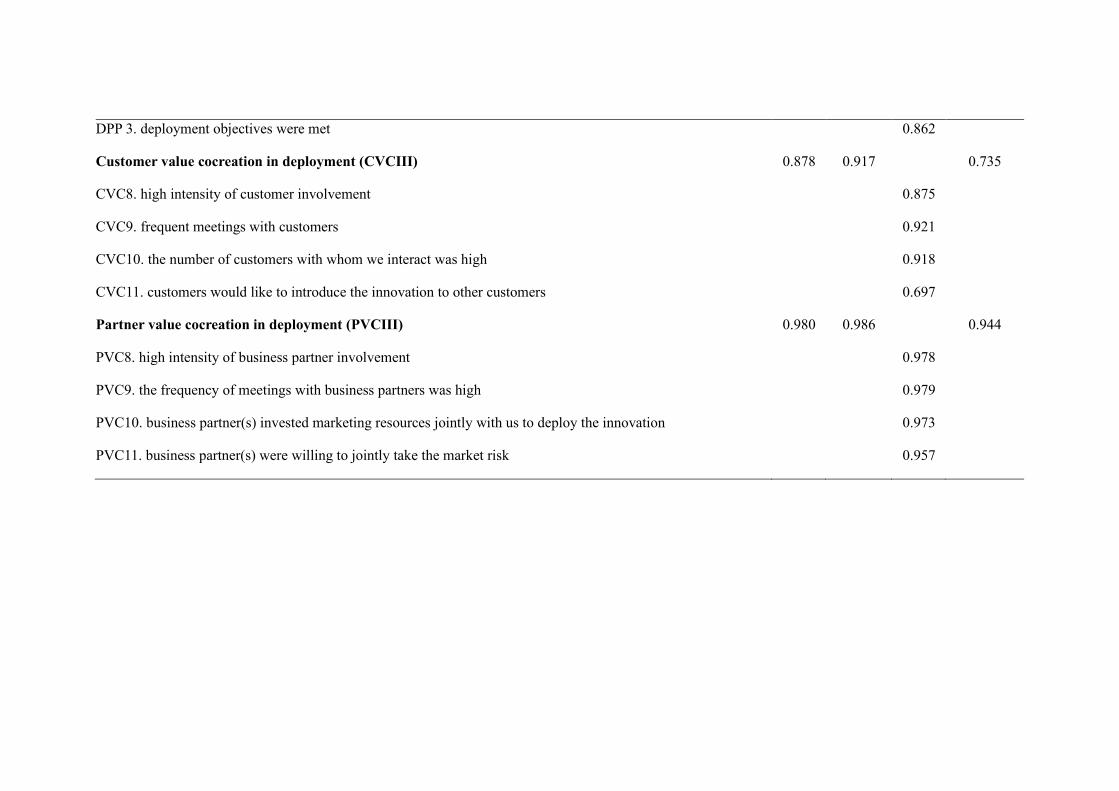
DPP 3. deployment objectives were met 0.862
Customer value cocreation in deployment (CVCIII) 0.878 0.917 0.735
CVC8. high intensity of customer involvement 0.875
CVC9. frequent meetings with customers 0.921
CVC10. the number of customers with whom we interact was high 0.918
CVC11. customers would like to introduce the innovation to other customers 0.697
Partner value cocreation in deployment (PVCIII) 0.980 0.986 0.944
PVC8. high intensity of business partner involvement 0.978
PVC9. the frequency of meetings with business partners was high 0.979
PVC10. business partner(s) invested marketing resources jointly with us to deploy the innovation 0.973
PVC11. business partner(s) were willing to jointly take the market risk 0.957
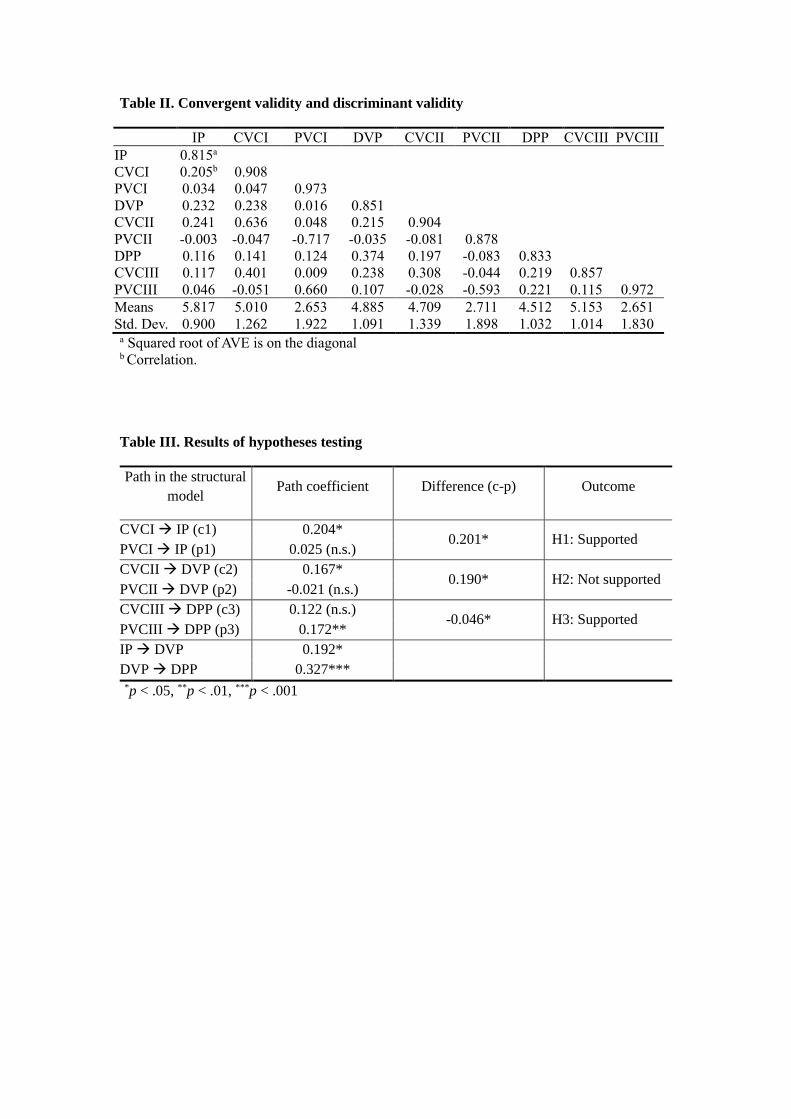
Table II. Convergent validity and discriminant validity
IP CVCI PVCI DVP CVCII PVCII DPP CVCIII PVCIII
IP 0.815a
CVCI 0.205b 0.908
PVCI 0.034 0.047 0.973
DVP 0.232 0.238 0.016 0.851
CVCII 0.241 0.636 0.048 0.215 0.904
PVCII -0.003 -0.047 -0.717 -0.035 -0.081 0.878
DPP 0.116 0.141 0.124 0.374 0.197 -0.083 0.833
CVCIII 0.117 0.401 0.009 0.238 0.308 -0.044 0.219 0.857
PVCIII 0.046 -0.051 0.660 0.107 -0.028 -0.593 0.221 0.115 0.972
Means 5.817 5.010 2.653 4.885 4.709 2.711 4.512 5.153 2.651
Std. Dev. 0.900 1.262 1.922 1.091 1.339 1.898 1.032 1.014 1.830 a Squared root of AVE is on the diagonal b Correlation.
Table III. Results of hypotheses testing
Path in the structural
model Path coefficient Difference (c-p) Outcome
CVCI → IP (c1) 0.204* 0.201* H1: Supported
PVCI → IP (p1) 0.025 (n.s.)
CVCII → DVP (c2) 0.167* 0.190* H2: Not supported
PVCII → DVP (p2) -0.021 (n.s.)
CVCIII → DPP (c3) 0.122 (n.s.) -0.046* H3: Supported
PVCIII → DPP (p3) 0.172**
IP → DVP 0.192*
DVP → DPP 0.327*** *p < .05, **p < .01, ***p < .001
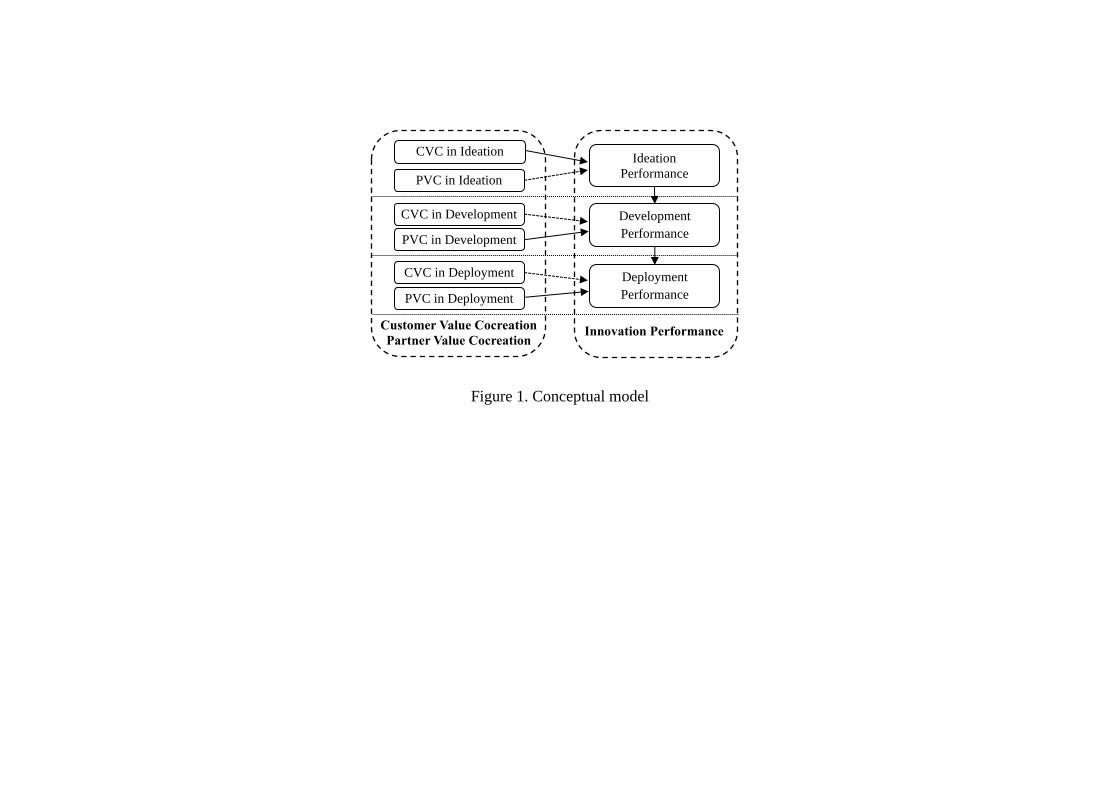
Figure 1. Conceptual model
Customer Value Cocreation
Partner Value Cocreation
Deployment
Performance
Innovation Performance
Ideation
Performance
Development
Performance
PVC in Ideation
CVC in Ideation
CVC in Development
PVC in Development
CVC in Deployment
PVC in Deployment