
NMFA 091820 Item 3 Renewable Energy Growth Case
33
RENEWABLE ENERGY GROWTH CASE & EXPECTED ECONOMIC BENEFITS Presentation to New Mexico Finance Authority Oversight Committee September 18, 2020 Rikki Seguin Executive Director 1
Transcript of NMFA 091820 Item 3 Renewable Energy Growth Case

RENEWABLE ENERGY
GROWTH CASE &
EXPECTED ECONOMIC
BENEFITS
Presentation to New Mexico Finance Authority Oversight
Committee
September 18, 2020
Rikki Seguin
Executive Director
1

PRESENTATION OVERVIEW
Interwest Introduction
What is Driving Demand?
Can New Mexico Projects Win Bids?
Economic Impacts of Renewable Development
Increased Business Opportunities
Looking Forward
2

INTERWEST
ENERGY ALLIANCE
Regional non-profit trade
association representing
nation’s leading developers and
manufacturers of wind, solar,
geothermal, and storage
technologies, working with
environmental NGOs
Mission is to make the
Intermountain West a leader in
deployment of reliable, cost-
effective, and diverse
renewable energy resources.
New Mexico, Colorado, Wyoming, Utah, Nevada, Arizona3
INTERWEST ENERGY ALLIANCE
4

WHAT IS DRIVING
DEMAND?
5

COST REDUCTIONS
6
Source: Lazard’s Levelized Cost of Energy Analysis 13.0

COST REDUCTIONS
7
Source: Lazard’s Levelized Cost of Energy Analysis 13.0
LCOE Comparison Across Technologies

IN-STATE POLICY DRIVERS
Energy Transition Act in 2019
100% carbon-free by 2045
50% RPS by 2040
Goal of 80% renewable by 2040
New Mexico Load is Small
NM electricity demand makes up just 3.5% of total WECC demand
PNM System Peak: 7/10/20 = 1,935 MW demand
Total renewables online in NM:
Wind 1,952 MW
Solar 1,068 MW
8
Source: Peak load data: PNM 2020-2040 Integrated Resource Plan presentation Aug. 25, 2020; Wind data: AWEA; Solar data: SEIA Source: WECC

REGIONAL POLICY DRIVERS
80% of energy use in the
West is now aligned on
decarbonization
9
Source: AWEA

INCREASED DEMAND FOR RENEWABLES
Existing policies in the West require ~9 GW new renewables per year starting in 2026
NM has ~3GW installed today
By 2050 the total demand in the West is upwards of 150 GW
10
Source: Energy Strategies, “Western Flexibility Assessment” (2019)

CAN NM
PROJECTS
WIN BIDS?
11

12
REGIONAL DRIVERS
2016 Net Interchange by Balancing Area
Red = Export
Blue = Import
YES - New Mexico can sell clean energy to
these states, but we need to win in
competitive solicitations.
Standard steps:
Utility issues RFP for clean energy resource
Companies bid in from around the region
Utility selects the best project (considering
cost, resource type, etc.)
If bid is not selected,
project does not get built.
Source: WECC “State of the Interconnection Digest” (Summer 2018)
13
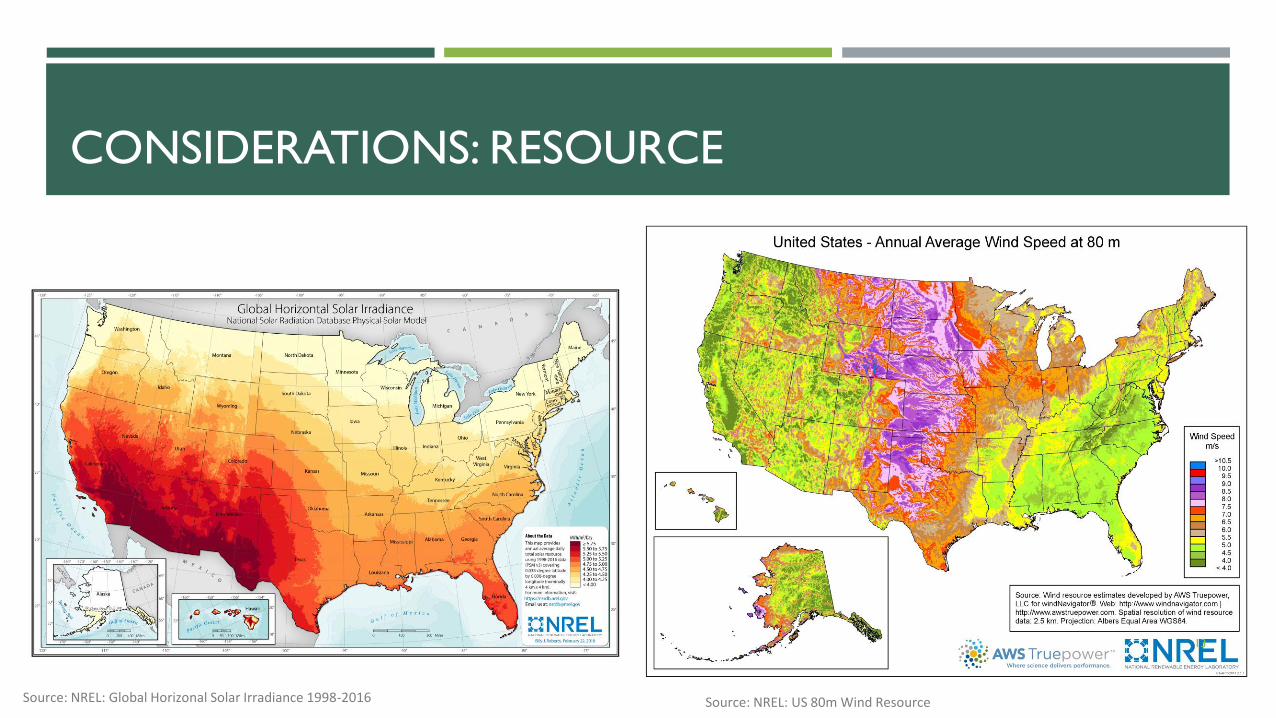
Source: NREL: Global Horizonal Solar Irradiance 1998-2016 Source: NREL: US 80m Wind Resource
CONSIDERATIONS: RESOURCE

CONSIDERATIONS: RESOURCE
14
Capacity Factors Determined for Each WECC State Source: Univ. of Wyoming, “Estimating the Impact of State Taxation Policies on the Cost of Wind Development in the West” (March 2019) Source: NREL: US 80m Wind Resource

CONSIDERATIONS: RESOURCE
15
Source: Pattern Energy
Regional Electricity markets
benefit from geographic diversity
“Duck Curve” challenges are
affecting many markets with high
renewable penetration
Regional coordination enables
least cost, highly efficient pairing of
wind and solar resources

CONSIDERATIONS: COST
16
Source: Univ. of Wyoming, “Estimating the Impact of State Taxation Policies on the Cost of Wind Development in the West” (March 2019)

MUST REMAIN COMPETITIVE TO WIN BIDS
NV Energy 2018 RFP Shortlist (9 projects):
Approx. difference between highest and lowest bid = $0.50/MWh
Black Hills Energy 2019 RFP Shortlist
Approx. difference between highest and lowest bid = $0.87/MWh
17
Source: Calculations based on PWRR values published in each utility’s RFP response filing with outliers removed. Source: Univ. of Wyoming, “Estimating the Impact of State Taxation
Policies on the Cost of Wind Development in the West” (March 2019)

ECONOMIC
IMPACTS
18

TAXES FROM RENEWABLE ENERGY DEVELOPMENT
Gross Receipts Tax (direct and induced) on:
Construction
Operations (example: any purchased services like maintenance)
Consumed electricity and other purchased commodities
Corporate Income Tax
Personal Income Tax on:
Payroll
Land Lease Payments to Property Owners
Operating revenue of vendors providing contract services
Property Taxes, if a non-IRB project, or Payment in lieu of taxes (PILT) to each county and school district touched by the project with an IRB 19

20
CASE STUDY
“Construction receipts also propped up MTGR in FY20-Q4, posting double-digit growth each month despite the pandemic, largely due to large wind projects in Roosevelt and Torrance Counties, border wall construction in Luna and Doña Ana Counties, and other ongoing projects in Sandoval County.”
Source: NM Legislative Fiscal Committee “General Fund Revenue Tracking Report: Accruals through May 2020” (9/4/20)

CASE STUDY
“Rio Arriba County’s budget for the new fiscal year avoids any major cuts to public services or employees’ hours and pay because of a windfall from a major solar energy development…
But the County made a deal with the Chicago-based energy company Hecate Energy around the construction of a solar array on the Jicarilla Apache Nation, and through that agreement, the County will receive $800,000 in two installments, one in August and one in February 2021.”
“Rio Arriba County Avoids Large Budget
Cuts with Solar Deal”
August 13, 2020
Source: Rio Grande Sun (August 2020)

REVENUE SHARING ON STATE TRUST LANDS
According to the New Mexico State Land Office, there exists about nine million acres of land
in the state available for lease to renewable energy companies.
Current wind and solar leases bring in ~$1 million per year in lease payments to the state.
9 Active Wind leases = 345 MW
6 Active Solar leases = 221 MW
More revenue on the horizon:
19 Wind Lease Applications = 1,835 MW
27 Solar Lease Applications = 2,917 MW 22
Source: NM State Land Office

ECONOMIC DEVELOPMENT
Landowner Payments: $12 million annually
Consistent income that flattens peaks and valleys
Keeps local farmers and ranchers on their land consistent income that flattens peaks and
valleys
Jobs: 4,000-5,000 wind and solar jobs in the state
Employment numbers highest during construction
Additional jobs in Engineering, Tech, Law
23
Source: AWEA and SEIA

ECONOMIC DEVELOPMENT
24
Source: “US Energy + Employment Report, New Mexico” (2020)

0
5,000
10,000
2020 2025 2030
MW
RPS Market Demand
$0
$50
$100
$150
2020 2025 2030
Indirect and Induced Tax Revenue
$0
$5
$10
$15
2020 2025 2030
$ B
illio
n
Local Economic Benefits(Direct, Indirect, Induced)
0
500
1,000
1,500
2,000
2,500
3,000
3,500
4,000
Job
Consutruction Jobs Permanent Jobs
Lost Market
Growth
7,000 MW
Growth
Case: Current Policy
Drives market
Limited
Case: WY-Style tax
Constrains
market
Lost State and Local Tax
Revenue
$104.4 Million
Annual
Wind and Solar
Installations
State & Local RevenueLocal Economic Impact &
Direct Renewable Job
Creation
Lost Jobs
4,830
• Gross Receipts Tax (GRT): $65.4 Million
• Local Economic Benefits: $6.7 Billion
• Clean Electricity Tax Revenue: $55.6 Million
• Employment and Labor: 4,830 Jobs
Discussion Draft – New Mexico
Renewable Energy Development Impacts
$0
$50
$100
$150
2020 2025 2030
Indirect and Induced Tax Revenue
$0
$5
$10
$15
2020 2025 2030
$ B
illio
n
Local Economic Benefits(Direct, Indirect, Induced)
0
500
1,000
1,500
2,000
2,500
3,000
3,500
4,000
Job
Consutruction Jobs Permanent Jobs
Lost Local Economic Benefits
$6.7 Billion
0
500
1,000
1,500
2,000
1999 2009 2019
Installed Wind Capacity (MW)Before and After Wyoming "Wind Tax"
New Mexico Wyoming
Wyoming “Wind Tax” Enacted
Renewable Tax Policy Impacts:
$0
$50
$100
$150
2020 2025 2030
$ M
illio
n
State Tax Revenue PILOT
$0
$50
$100
$150
2020 2025 2030
$ M
illio
n
State Tax Revenue PILOT
0
5,000
10,000
2020 2025 2030
MW
RPS Market Demand
Net Loss to NM
from a WY-style
Clean Electricity
Generation Tax:$6.71 Billion
Clean Electricity Generation Tax
2020 2025 2030
2020 2025 2030

INCREASED
BUSINESS
OPPORTUNITY
26

27
STRONG DEMAND FOR WIND POWERPPAs by Type of Purchaser
Source: AWEA Wind Powers America Annual Report 2019
Nationally, power purchasers of wind announced record 8,726 MW of PPAs in 2019

28
Source: RE 100 Annual Report (2019)
“RE 100” has 223 companies publicly committed to 100% renewable electricity
2028 is average target year for RE100 companies to reach 100% renewable electricity
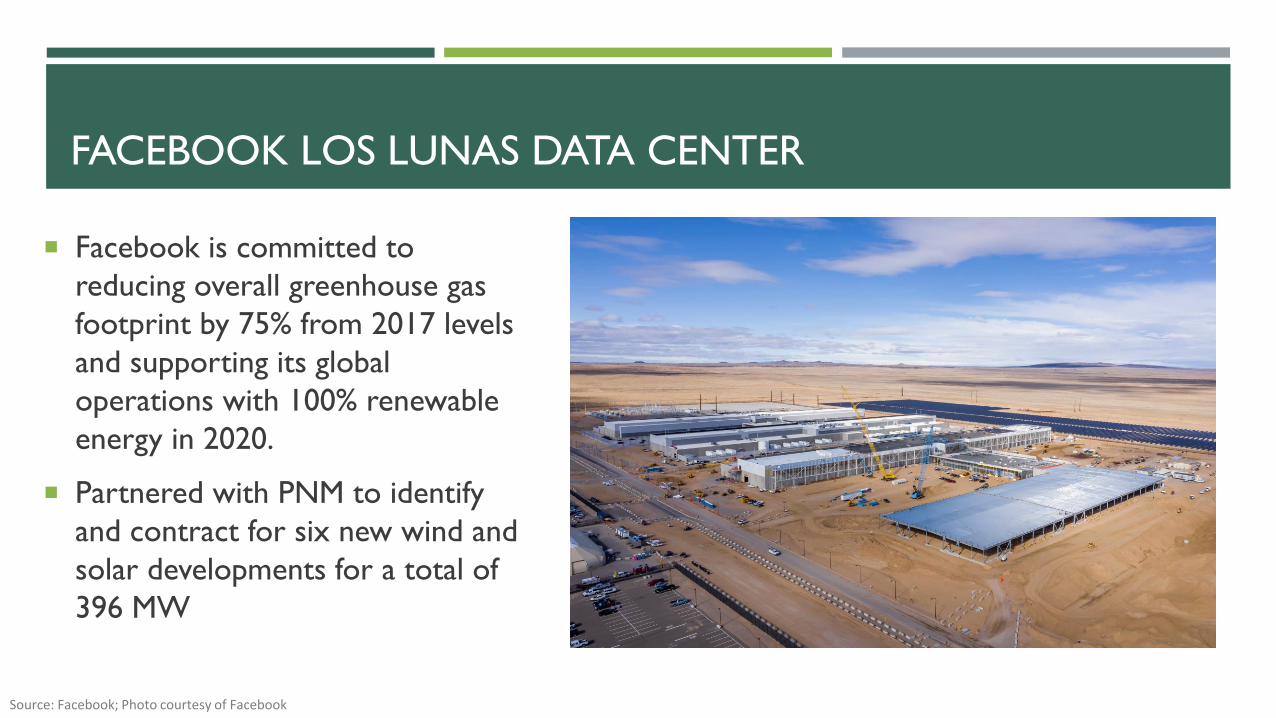
FACEBOOK LOS LUNAS DATA CENTER
Facebook is committed to
reducing overall greenhouse gas
footprint by 75% from 2017 levels
and supporting its global
operations with 100% renewable
energy in 2020.
Partnered with PNM to identify
and contract for six new wind and
solar developments for a total of
396 MW29
Source: Facebook; Photo courtesy of Facebook

FACEBOOK LOS LUNAS DATA CENTER
Projects expected to
bring approximately $800 million of investment to the state
Support over 1,300 construction jobs
Economic development in Valencia, Bernalillo, Quay, Torrance, Cibola, and Sandoval
Counties
Data Center itself represents more than $1 billion investment in NM
30
Source: Facebook

LOOKING
FORWARD
31

NM WILL BENEFIT FROM GROWTH SCENARIO
Need to stay competitive in order to win bids
Projects generally will not be built if they cannot win bids
Additional development means additional revenue for the state
Bulk of state tax collection comes during construction phase
Transmission expansion/grid modernization
NM project must be able to compete regionally
Renewables can help attract new business
Low-cost power and green opportunities 32

QUESTIONS?
Rikki Seguin
Executive Director
678-634-1945
400 Gold Ave. SW Suite 700
Albuquerque, NM 87102
33


![[PPT]Chapter 18 Renewable Energy 18-1 Renewable …environmentalscienceclass.weebly.com/.../ch_18_notes.ppt · Web viewChapter 18 Renewable Energy 18-1 Renewable Energy Today Renewable](https://static.fdocuments.net/doc/165x107/5b029fb97f8b9a6a2e900bdf/pptchapter-18-renewable-energy-18-1-renewable-envir-viewchapter-18-renewable.jpg)