Nitrogen uptake of saprotrophic basidiomycetes and bacteria · Nitrogen uptake of saprotrophic...
98
Nitrogen uptake of saprotrophic basidiomycetes and bacteria Dipl.-Ing. Petra Weißhaupt BAM-Dissertationsreihe • Band 87 Berlin 2012
Transcript of Nitrogen uptake of saprotrophic basidiomycetes and bacteria · Nitrogen uptake of saprotrophic...

Nitrogen uptake
of saprotrophic basidiomycetes
and bacteria
Dipl.-Ing. Petra Weißhaupt
BAM-Dissertationsreihe • Band 87
Berlin 2012

Impressum
Nitrogen uptake ofsaprotrophic basidiomycetesand bacteria
2012
Herausgeber:
BAM Bundesanstalt für Materialforschung und -prüfung
Unter den Eichen 87
12205 Berlin
Telefon: +49 30 8104-0
Telefax: +49 30 8112029
E-Mail: [email protected]
Internet: www.bam.de
Copyright © 2012 by
BAM Bundesanstalt für Materialforschung und -prüfung
Layout: BAM-Referat Z.8
ISSN 1613-4249
ISBN 978-3-9815134-2-4
Die vorliegende Arbeit entstand an der BAM Bundesanstalt für Materialforschung und -prüfung.

Nitrogen uptake of saprotrophic basidiomycetes
and bacteria
vorgelegt von Diplom-Biotechnologin
Petra Weißhaupt aus Aachen
von der Fakultät III – Prozesswissenschaften
der Technischen Universität Berlin zur Erlangung des akademischen Grades
Doktorin der Naturwissenschaften
- Dr. rer. nat. -
genehmigte Dissertation
Promotionsausschuss: Vorsitzender: Prof. Dr. Sven-Uwe Geißen Berichter: Prof. Dr. Ulrich Szewzyk Berichter: Prof. Dr. Wolfgang Rotard Berichter: Prof. Dr. Matthias Noll Tag der wissenschaftlichen Aussprache: 29.05.2012
Berlin 2012 D 83
bforkert
Schreibmaschinentext
bforkert
Schreibmaschinentext
bforkert
Schreibmaschinentext
bforkert
Schreibmaschinentext
bforkert
Schreibmaschinentext
bforkert
Schreibmaschinentext
bforkert
Schreibmaschinentext
bforkert
Schreibmaschinentext
bforkert
Schreibmaschinentext
bforkert
Schreibmaschinentext
bforkert
Schreibmaschinentext
bforkert
Schreibmaschinentext
bforkert
Schreibmaschinentext
bforkert
Schreibmaschinentext
bforkert
Schreibmaschinentext
bforkert
Schreibmaschinentext
bforkert
Schreibmaschinentext


Zusammenfassung
V
Zusammenfassung Saprotrophe Basidiomyceten können unter aeroben Bedingungen Holz abbauen und
wirtschaftliche Schäden verursachen. Die Stickstoffverfügbarkeit ist für diesen Abbau
entscheidend, und diazotrophe Bakterien können durch Fixierung von atmosphärischem N2
Stickstoff auf Holz anreichern. Der gemeinsame Abbau durch Basidiomyceten und
Diazotrophe könnte zu hohen Abbauraten führen, da N2-Fixierung große Mengen an ATP
benötigt, welche durch Celluloseabbau regeneriert werden. In dieser Arbeit wurde diese
Interaktion durch Messungen des Stickstoffanteils sowie der δ15N-Werte in der Biomasse
untersucht. Außerdem wurde die Aktivität der Basidiomyceten unter Einfluss
unterschiedlicher Stickstoffquellen bestimmt.
Die Messungen des Stickstoffanteils in der Biomasse der Basidiomyceten Oligoporus
placenta und Trametes versicolor bewiesen die Aufnahme organischen Stickstoffs, sogar
wenn nur Spuren verfügbar waren. Darüber hinaus förderten Harnstoff und
Ammoniumchlorid das Wachstum von T. versicolor. In Experimenten unter einer 15N2/O2-
Atmosphäre wurde ermittelt, dass die diazotrophen Bakterien Azotobacter croococcum,
Beijerinckia acida und Novosphingobium nitrogenifigens etwa 1–13% ihres Stickstoffbedarfs
durch N2-Fixierung decken. Wurden Diazotrophe und Basidiomyceten gemeinsam kultiviert,
konnte nur von B. acida N2 fixiert und an beide Basidiomyceten übertragen werden. A.
croococcum und N. nitrogenifigens wiesen keine Aktivität auf.
Die Effekte der drei Stickstoffquellen, organischer Stickstoff im Medium, organischer
Stickstoff in Splintholz sowie N2 aus der Luft, auf die Biomasse der Basidiomyceten wurden
in Experimenten nach einem statistischen Versuchsplan bestimmt. Organischer Stickstoff als
Medienbestandteil förderte das Wachstum beider Basidiomyceten signifikant. In zwei
weiteren Versuchsreihen wurde die Stickstoffquelle im Medium durch das Bakterium B. acida
ersetzt. Luftstickstoff begünstigte das Bakterienwachstum, so dass die Biomassen der
Basidiomyceten gegenüber N2-freien Bedingungen verringert wurden. Das Vorhandensein
von B. acida hatte einen geringfügig fördernden Effekt auf die Biomasse von T. versicolor
aber keinen Effekt auf die Biomasse von O. placenta.
Im Gegensatz zu den zuvor genannten Organismen kommen Hypholoma fasciculare und
einige, teils isolierte und charakterisierte Proteobakterien gemeinsam in der Natur vor. Das
Wachstum der Biomasse von H. fasciculare und von Proteobakterien wurde durch
organischen Stickstoff, Harnstoff und Ammoniumchlorid gefördert. Die N2-Fixierung der
Proteobakterien war zwar signifikant jedoch geringfügig, so dass sie mit Adsorption an Stelle
von Nitrogenaseaktivität interpretiert wurde. Die Konkurrenz von H. fasciculare und
Proteobakterien um die gleichen Stickstoffquellen wurde als wahrscheinlicher betrachtet als
die Stickstoffanreicherung durch Diazotrophie.

Summary
VI
Summary
Saprotrophic basidiomycetes decompose wood in aerobic environments and can cause
economic damage. The availability of nitrogen is determining for decomposition, and
diazotrophic bacteria might enhance the nitrogen availability by fixation of atmospheric N2.
Simultaneous decomposition by basidiomycetes and diazotrophs may intensify
decomposition, because N2 fixation requires ATP, which could be provided during cellulose
decomposition. In this study, the interaction was analysed by measurements of the nitrogen
content and the δ15N values in biomass. Besides, the activity of basidiomycetes, influenced
by different nitrogen sources, was determined.
The analysis of the nitrogen content in biomass of Oligoporus placenta and Trametes
versicolor proved the efficient uptake of organic nitrogen by wood-decomposing fungi even if
only traces were available. In the presence of urea and ammonium chloride, the growth of T.
versicolor was intensified. At cultivations in a 15N2/O2 atmosphere, the diazotrophic bacteria
Azotobacter croococcum, Beijerinckia acida and Novosphingobium nitrogenifigens covered 1
to 13% of the nitrogen in their biomass by N2 fixation. If basidiomycetes and diazotrophs
were co-cultivated, only B. acida fixed N2 and transferred it to both fungi. A. croococcum and
N. nitrogenifigens did not coexist with the fungi.
The effects of the nitrogen sources, i.e., organic nitrogen in the medium, organic nitrogen
in sapwood and N2 from air, on the biomass of the mentioned basidiomycetes were
determined in experiments according to full-factorial experimental plans. Organic nitrogen in
the medium increased the growth of both basidiomycetes significantly. In additional
experiments, the nitrogen source in the medium was replaced by an inoculum of B. acida.
Then, atmospheric N2 supported the bacterial growth, which caused a significant decrease of
basidiomycetal biomass compared to N2-free conditions. The presence of B. acida increased
the biomass of T. versicolor to a low extent, but had no effect on the biomass of O. placenta.
In contrast to the previously mentioned organisms, Hypholoma fasciculare and
proteobacteria occur together in nature. In experiments, the growth of biomass of H.
fasciculare and proteobacteria was supported by organic nitrogen, urea and ammonium
chloride. The N2 fixation of the bacteria was significant but amounted to a low extent and was
therefore explained by adsorption and not by nitrogenase activity. Competition between H.
fasciculare and proteobacteria for the same nitrogen sources appeared more probable than
N enrichment by diazotrophic activity.

Table of contents
VII
Table of contents
Abbreviations IX
List of figures XI
List of tables XIII
1. Introduction 1
1.1. Wood decomposition by basidiomycetes 1
1.2. Diazotrophs in forest ecosystems and wood-decomposing bacteria 2
1.3. Symbiosis and interaction 4
1.4. Isotope ratio mass spectrometry in environmental sciences 5
1.5. Natural 15N abundance and fractionation 7
1.6. Design of experiments (DOE) 8
1.7. Objectives 9
2. Materials and Methods 12
2.1. Sterilisation 12
2.2. Cultivation of basidiomycetes 12
2.3. Cultivation of bacteria 13
2.4. Fungal-bacterial co-cultivations under 15N2/O2 atmosphere 18
2.5. Cultivations according to full-factorial experimental plans 19
2.6. Aqueous soil and wood extracts 21
2.7. Measurement of biomass and enzyme activities 21
2.8. Elemental analysis isotope ratio mass spectrometry (IRMS) 22
2.9. Gas analysis of O2, N2 and CO2 23
2.10. Statistical analysis 24
3. Results 27
3.1. Wood decomposition by O. placenta and T. versicolor 27
3.2. Elemental analysis of medium compounds 27
3.3. Elemental analysis of basidiomycetes and of aqueous wood and soil extracts 29
3.4. Nitrogen uptake of O. placenta, T. versicolor and H. fasciculare 30
3.5. Nitrogen uptake of bacterial isolates coexisting with H. fasciculare 33
3.6. N2 fixation by A. croococcum, B. acida and N. nitrogenifigens as well as bacterial isolates coexisting with H. fasciculare 35
3.7. N2 fixation of bacteria in co-cultivation with basidiomycetes 39
3.8. Cultivation of O. placenta and T. versicolor at different N sources 42

Table of contents
VIII
3.9. Co-cultivation of O. placenta and T. versicolor with the diazotroph B. acida 47
4. Discussion 53
4.1. Ecology of wood decomposition 53
4.2. Sapwood decomposition and elemental composition of microbial biomass 53
4.3. Nitrogen uptake of saprotrophic basidiomycetes 55
4.4. Nitrogen uptake of diazotrophs 57
4.5. Fungal-bacterial interactions investigated by 15N tracing 59
4.6. Nitrogen uptake of O. placenta and T. versicolor determined by DOE 62
4.7. Fungal-bacterial interactions determined by DOE 64
4.8. Fungal-bacterial interactions in wood decomposition 66
4.9. Uncertainty treatment 69
4.10. Implications for applied wood protection 71
5. Conclusion 72
6. Outlook 74
7. References 75
8. Acknowledgements 84

Abbreviations
IX
Abbreviations
ABTS 2,2'-azino-bis-(3-ethylbenzthiazoline)-6-sulphonate
ANOVA analysis of variance
ADP adenosine-5’-diphosphate
ATP adenosine-5’-triphosphate
ATR attenuated total reflection
CRM certified reference material
CTB Centre Technique du Bois
DSM German Collection of Microorganisms
DSMZ German Collection of Microorganisms and Cell Cultures
DIN German Institute for Standardization
DOE design of experiments
EA elemental analysis
EN European Norm
F- value Parameter of F-distibution test
(F = between-group variability / within-group variability)
FTIR Fourier transformed infrared spectroscopy
FPRL Forest Products Research Laboratory
GC gas chromatography
IAEA International Atomic Agency
ID isotope dilution
IRMS isotope ratio mass spectrometry
ISO International Standardization Organization
JCGM Joint Committee for Guides in Metrology
LC liquid chromatography
MEA 5%-malt-extract medium
MES 2-(N-morpholino)ethanesulfonic acid
n number of replicates
N number of experiments
nifH gene encoding nitrogen fixation
Pi phosphate
pH pondus hydrogenii
P-value probability between 0 and 1 (null hypothesis), significance if P < 0.05
PCR polymerase chain reaction
R² coeffictient of determination
RBA diazotrophic medium
Abbreviations
X
rpm rounds per minute
SD experimental standard deviation of the mean
TSB tryptone soy broth
TCD thermal conductivity detector
UV-Vis ultraviolet-visible spectroscopy
VPDB Vienna Pee Dee Belemnite
°C degree Celsius
d days
g gram
g L–1 gram per litre
L litre
mL millilitre
mM millimol
mm millimetre
m z –1 mass to charge ratio
MW molecular weight
U Unit, i.e., enzyme activity (µmol substrate · min–1)
C carbon
Fe iron
N nitrogen
S sulphur
O oxygen
δ15N 14N/15N ratio referred to the standard air N2 in ‰
δ13C 12C/13C ratio referred to the standard VPDB in ‰

List of figures
XI
List of figures
Fig. 1: Elemental analysis (1) combined with isotope ratio mass spectrometry (2) (Hoefs
2009). 6
Fig. 2: Hypothesis of increased wood decomposition during fungal-bacterial interaction. 10
Fig. 3: Cultivation of A. croococcum, B. acida and N. nitrogenifigens as well as bacterial
isolates coexisting with H. fasciculare under a 15N2/O2 atmosphere and under air. Under both
atmospheres, bacteria were cultivated on RBA and on recommended medium. 16
Fig. 4: Co-cultivations of A. croococcum, B. acida and N. nitrogenifigens with O. placenta
and T. versicolor under a 15N2/O2 atmosphere and under air. 18
Fig. 5: Wood and wood decomposed by fungi: (A) sapwood of P. sylvestris, (B) sapwood of
P. sylvestris decomposed by O. placenta, (C) sapwood of F. sylvatica, (D) sapwood of F.
sylvatica decomposed by T. versicolor. 27
Fig. 6: Biomass of O. placenta and T. versicolor cultivated on RBA amended with 10 mM N
of urea (▲), NH4Cl (○), NaNO3 (∆) or deionised water as reference cultivation (●). Linear
approximations of the measured values are indicated. 30
Fig. 7: Biomass of H. fasciculare cultivated on RBA amended with 10 mM N from urea (▲),
NH4Cl (○), NaNO3 (∆) or deionised water as reference cultivation (●). Linear approximations
of the measured values are indicated. 32
Fig. 8: C/N ratio (grey), N content in % (m/m) (dark grey) and 15N abundance in % (black) in
biomass of A. croococcum after 14 d of incubation (n = 9, mean values ± SD). The results of
the two-way ANOVA are given in the table. 35
Fig. 9: C/N ratio (grey), N content in % (m/m) (dark grey) and 15N abundance in % (black) in
biomass of B. acida after 14 d of incubation (n = 9, mean values ± SD). The results of the
two-way ANOVA are given in the table. 36
Fig. 10: C/N ratio (grey), N content in % (m/m) (dark grey) and 15N abundance in % (black) in
biomass of N. nitrogenifigens after 14 d of incubation (n = 9, mean values ± SD). The results
of the two-way ANOVA are given in the table. 37
Fig. 11: N contents and δ15N values of biomass of bacterial isolates coexisting with H.
fasciculare. The 27 bacteria were cultivated on RBA and on TSB under air and under a 15N2/O2 atmosphere (n = 1). Significances of the effects of medium and 15N2/O2 treatment
were calculated by two-way ANOVA (0.05 level). 38
Fig. 12: Effects of the factors (peptone (x1), wood of P. sylvestris (x2), N2 in air (x3)) and their
linear combination (x1x2, x1x3, x2x3 and x1x2x3) on the indicators of fungal activity of O.
placenta. Effects on six indicators are outlined in bars in different designs. The confidence

List of figures
XII
intervals of the indicators of fungal activity were determined according to the 95% criterion
and are given in the legend. 43
Fig. 13: Effects of the factors (peptone (x1), wood of F. sylvatica (x2), N2 in air (x3)) and their
linear combination (x1x2, x1x3, x2x3 and x1x2x3) on the indicators of fungal activity of T.
versicolor. Effects on seven indicators are outlined as bars in different designs. The
confidence intervals of the indicators of fungal activity were determined according to the 95%
criterion and are given in the legend. 45
Fig. 14: Effects in % of the factors (B. acida (x1), wood of P. sylvestris (x2), N2 in air (x3)) and
their linear combination (x1x2, x1x3, x2x3 and x1x2x3) on the indicators of fungal activity of O.
placenta. Effects on six indicators are outlined as bars in different designs. The confidence
intervals of the indicators of fungal activity were determined according to the 95% criterion
and are given in the legend. 49
Fig. 15: Effects in % of the factors (B. acida (x1), wood of F. sylvatica (x2), N2 in air (x3)) and
their linear combination (x1x2, x1x3, x2x3 and x1x2x3) on the indicators of fungal activity of T.
versicolor. Effects on seven indicators are outlined as bars in different designs. The
confidence intervals of the indicators of fungal activity were determined according to the 95%
criterion and are given in the legend. 51
List of tables
XIII
List of tables
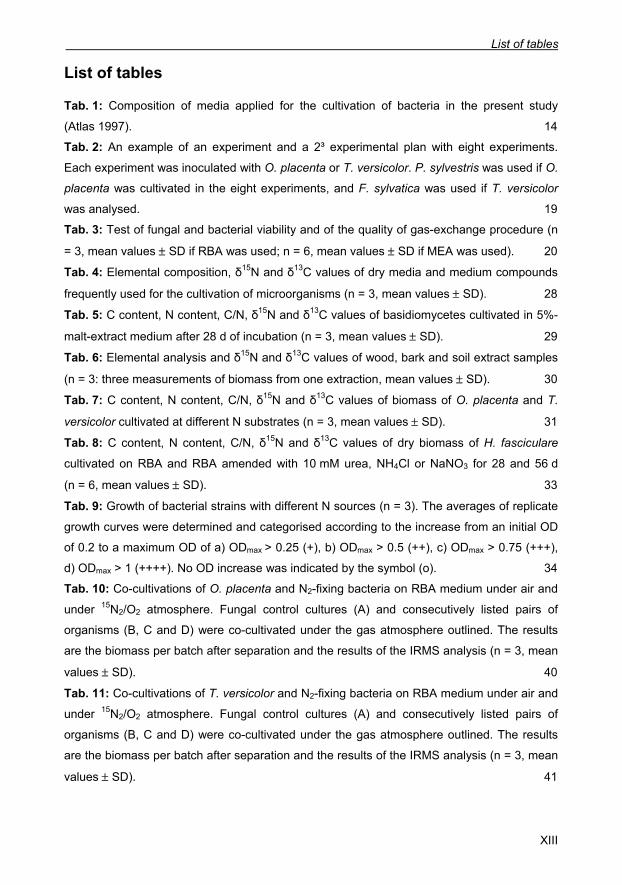
Tab. 1: Composition of media applied for the cultivation of bacteria in the present study
(Atlas 1997). 14
Tab. 2: An example of an experiment and a 2³ experimental plan with eight experiments.
Each experiment was inoculated with O. placenta or T. versicolor. P. sylvestris was used if O.
placenta was cultivated in the eight experiments, and F. sylvatica was used if T. versicolor
was analysed. 19
Tab. 3: Test of fungal and bacterial viability and of the quality of gas-exchange procedure (n
= 3, mean values ± SD if RBA was used; n = 6, mean values ± SD if MEA was used). 20
Tab. 4: Elemental composition, δ15N and δ13C values of dry media and medium compounds
frequently used for the cultivation of microorganisms (n = 3, mean values ± SD). 28
Tab. 5: C content, N content, C/N, δ15N and δ13C values of basidiomycetes cultivated in 5%-
malt-extract medium after 28 d of incubation (n = 3, mean values ± SD). 29
Tab. 6: Elemental analysis and δ15N and δ13C values of wood, bark and soil extract samples
(n = 3: three measurements of biomass from one extraction, mean values ± SD). 30
Tab. 7: C content, N content, C/N, δ15N and δ13C values of biomass of O. placenta and T.
versicolor cultivated at different N substrates (n = 3, mean values ± SD). 31
Tab. 8: C content, N content, C/N, δ15N and δ13C values of dry biomass of H. fasciculare
cultivated on RBA and RBA amended with 10 mM urea, NH4Cl or NaNO3 for 28 and 56 d
(n = 6, mean values ± SD). 33
Tab. 9: Growth of bacterial strains with different N sources (n = 3). The averages of replicate
growth curves were determined and categorised according to the increase from an initial OD
of 0.2 to a maximum OD of a) ODmax > 0.25 (+), b) ODmax > 0.5 (++), c) ODmax > 0.75 (+++),
d) ODmax > 1 (++++). No OD increase was indicated by the symbol (o). 34
Tab. 10: Co-cultivations of O. placenta and N2-fixing bacteria on RBA medium under air and
under 15N2/O2 atmosphere. Fungal control cultures (A) and consecutively listed pairs of
organisms (B, C and D) were co-cultivated under the gas atmosphere outlined. The results
are the biomass per batch after separation and the results of the IRMS analysis (n = 3, mean
values ± SD). 40
Tab. 11: Co-cultivations of T. versicolor and N2-fixing bacteria on RBA medium under air and
under 15N2/O2 atmosphere. Fungal control cultures (A) and consecutively listed pairs of
organisms (B, C and D) were co-cultivated under the gas atmosphere outlined. The results
are the biomass per batch after separation and the results of the IRMS analysis (n = 3, mean
values ± SD). 41
List of tables
XIV
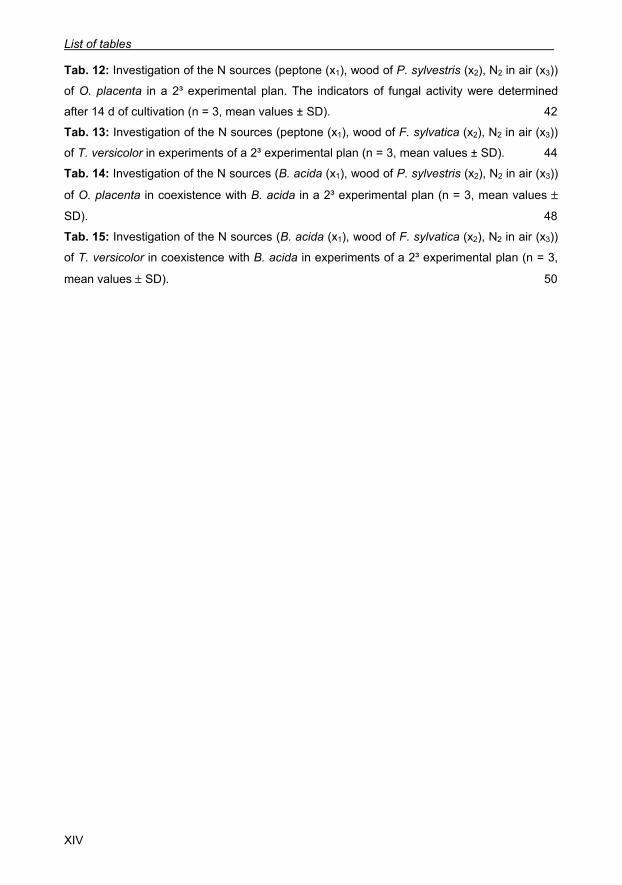
Tab. 12: Investigation of the N sources (peptone (x1), wood of P. sylvestris (x2), N2 in air (x3))
of O. placenta in a 2³ experimental plan. The indicators of fungal activity were determined
after 14 d of cultivation (n = 3, mean values ± SD). 42
Tab. 13: Investigation of the N sources (peptone (x1), wood of F. sylvatica (x2), N2 in air (x3))
of T. versicolor in experiments of a 2³ experimental plan (n = 3, mean values ± SD). 44
Tab. 14: Investigation of the N sources (B. acida (x1), wood of P. sylvestris (x2), N2 in air (x3))
of O. placenta in coexistence with B. acida in a 2³ experimental plan (n = 3, mean values ±
SD). 48
Tab. 15: Investigation of the N sources (B. acida (x1), wood of F. sylvatica (x2), N2 in air (x3))
of T. versicolor in coexistence with B. acida in experiments of a 2³ experimental plan (n = 3,
mean values ± SD). 50

Introduction
1
1. Introduction
1.1. Wood decomposition by basidiomycetes
Fungi are important decomposers, plant-associated symbionts and spoilage organisms of
manufactured materials (Gadd 2007). Ascomycetes and basidiomycetes decompose wood
and plant litter, and their activity is essential for the functioning of forest ecosystems (Boddy
et al. 2008). Fungal timber decomposition, which is described as white rot or brown rot,
needs to be prevented for reasons of stability (Jakobs-Schönwandt et al. 2010, Schmidt
2006). Several fungal species can infect sapwood and decrease the stability of construction
elements (Schmidt 2006). The initial durability, temperature, moisture and nutrient availability
of wood affect the decomposition (Lilly and Barnett 1951). In particular, the availability of
nitrogen (N), which occurs in soils but only to a limited amount in sapwood, is a prerequisite
for microbial decomposition (Watkinson et al. 2006, Boyle 1998). Freshly felled sapwood has
a C/N ratio of approximately 350 to 500 (Boddy and Jones 2008), and a C/N ratio of 40 was
found as being critical for fungal development in in vitro cultivations using low-molecular
weight carbon (C) and N sources (Levi and Cowling 1969). During wood decomposition,
basidiomycetes recycle N from wood and plant litter and this N capture results in an N
enrichment in the residual biomass after decay (Watkinson et al. 2006, 1981). Spatially
inhomogenic N availability may be bridged by mycelial transport (Lindahl and Olsson 2004,
Tlalka et al. 2002), efficiency of uptake (Read and Perez-Moreno 2003), local and temporal
changes in nutrient addition, e.g., by plant material such as pollen or leaves (Perez-Moreno
and Read 2001) or by symbiotic partners (Ahmadjian 1993). Apart from the multiple
parameters determining wood decomposition, the combination of parameters may determine
fungal growth. Since the assimilation of N by saprotrophic fungi is very efficient, fungal
growth can already occur at a low availability of N. A similar efficiency in N uptake is
described for mycorrhiza fungi (Read and Perez-Moreno 2003).
On wood, decomposition is traceable by visual detection of mycelium or by a typical
decomposition pattern, such as brown rot accompanied with cubic rot, white rot or soft rot
(Schmidt 2006). In experiments with defined specimens, wood decomposition can be
quantified by mass loss (DIN EN 113), bending elasticity (DIN 52186, Stephan et al. 2000)
and FTIR spectroscopy with an attenuated-total-reflection (ATR) device (Naumann et al.
2005). Fungal activity is investigated by measurements of spatial growth, i.e., radial or linear
expansion (Lilly and Barnett 1951, Ryan et al. 1943) or by measurements of dry biomass if
the fungal biomass is separable from the medium. Other indicators of fungal activity are CO2
formation and O2 consumption (White and Boddy 1992), a pH decrease in the reaction
medium (Schmidt 2006) and specific enzyme activities (Baldrian 2008). These indicators are

Introduction
2 BAM-Dissertationsreihe
measured by gas chromatography, pH measurements or by chemical analysis combined with
UV-VIS spectroscopy. Wood-decomposing enzyme activities are either oxidative, i.e.,
laccase, manganese peroxidase and phenoloxidase activity (Elisashvili and Kachlishvili
2009, Baldrian 2008, Hofrichter 2002, Kirk 1987) or hydrolytic, i.e., cellulase and cellubio-
hydrolase activity (Baldrian and Valášková 2008). Alternatively, decomposition is caused by
the Fenton reaction (Eastwood et al. 2011, Martínez et al. 2009). If oxidative activities prevail,
lignin in wood is decomposed, and the visual appearance of decomposition is white rot.
Hydrolytic activities or Fenton reactions predominantly attack cellulose and cause brown rot.
The basidiomycetes Trametes versicolor and Oligoporus placenta are examples for a
white-rot and a brown-rot causing fungus, respectively. T. versicolor occurs on soft- and
hardwood and decomposes wood by a set of oxidative enzymes (Valášková and Baldrian
2006). O. placenta more frequently occurs on softwood and causes decomposition by Fenton
reaction (Martínez et al. 2009). Nevertheless, both fungi decompose wood completely. The
third fungus Hypholoma fasciculare (Blaich and Esser 1975) occurs on hard- and softwood in
natural ecosystems, but is neither a frequently-found spoilage organism on manufactured
materials nor used as test organism for standardised materials testing (e.g., DIN EN 113,
DIN 839). It is a white-rot fungus with oxidative activity and was described to coexist with
defined proteobacteria (Valášková et al. 2009).
1.2. Diazotrophs in forest ecosystems and wood-decomposing bacteria
Forest soil comprises a broad diversity of bacteria, and some of these bacteria are
diazotrophs with the ability of atmospheric N2 fixation. The importance of bacterial N2 fixation
in forest ecosystems is still under investigation and was recently evaluated in a global
modelling approach (Houlton et al. 2008). In temperate regions, diazotrophs were discussed
as soil-fertilising mycorrhiza helper bacteria (MHB) with antagonistic effects on bacterial
phytopathogens (Frey-Klett et al. 2007, Garbaye 1994). Diazotrophs are more frequently
found in ecosystems of a warm climate, such as tropical forests or warm deserts (Houlton et
al. 2008, Virginia et al. 1988). Atmospheric N2-fixing bacteria occur in decomposing plant
litter (Streichan and Schink 1986, Aho et al. 1974), are described as cyanobionts in lichens
(Bates et al. 2011, Antoine 2004, Ahmadjian 1993) or are associated to mycorrhizae. Fungal-
bacterial interactions including diazotrophic bacteria and saprotrophic basidiomycetes were
reviewed (de Boer and van der Wal 2008, de Boer et al. 2005).
Aho et al. investigated an interaction between wood-decomposing fungi and diazotrophs
in situ by testing the acetylene-reduction activity (Aho et al. 1974, Hardy et al. 1968).
Acetylene-reduction activity was frequently found in the vicinity of white-rot (Jurgensen et al.
Introduction
3
1989), and bacteria affiliated to Azospirillum sp. were identified. Consequently, the soil
bacterium Azospirillum was explored in more detail (e.g., de Boer and van der Wal 2008,
Jurgensen et al. 1984). Following studies focused on a nifH gene screening in soil and plant
litter in forests. The nifH genes are key-genes, which encode for nitrogenase enzymes that
are essential for diazotrophic activity. A great variety of nifH gene-comprising bacterial
species occurred in Douglas fir forest soils (Widmer et al. 1999, Li et al. 1992). The N2-fixing
species in plant litter included members of the genera Rhizobium, Sinorhizobium and
Azospirillum and differed from the soil-inhabiting N2-fixing bacteria, which include members
of the genera Bradyrhizobium, Azorhizobium, Herbaspirillum and Thiobacillus (Widmer et al.
1999). The detection method could be optimised by nested PCR (Duc et al. 2009, Bürgmann
et al. 2004). In the soil of a European forest, diazotrophs were found to a similar extent like
denitrifying bacteria (Rösch and Bothe 2005). Cellulytic or lignolytic activity of the diazotrophs
was not described. Further nifH gene-containing bacteria were found on P. sylvestris
ectomycorrhiza (Timonen and Hurek 2006). The association of diazotrophs on saprotrophs
was not described, but a detailed description of the bacterial community in the mycosphere of
the white-rot fungus Hypholoma fasciculare exists (Valášková et al. 2009). These bacteria
were predominantly affiliated to the Alpha-, Beta- and Gammaproteobacteria, and their C
sources were investigated (de Boer et al. 2010, Valášková et al. 2009, Folman et al. 2008).
Further, these bacteria were not able to decompose cellulose, but they metabolised wood-
decomposition products provided by the fungus. Interestingly, the bacterial number increased
after prolonged wood decomposition (Valášková et al. 2009), which parallels to the increased
N availability created by N-recycling basidiomycetes in the late stage of decomposition
(Watkinson et al. 2006, 1981).
In N-limited environments, N2 fixation could increase the concentration of biologically
available N and support fungal growth. On the one hand, the presence of N2-fixing bacteria
could explain why saprotrophs exist even on N-deficient sapwood without soil or litter
contact, on the other hand, their mere existence could increase fungal wood decomposition.
The latter could bring N2-fixing bacteria in the focus of materials protection. The increase in
wood decomposition is probable, because N2 fixation requires considerable amounts of
adenosine-5'-triphosphate (ATP, Burgess and Lowe 1996). The reduction of N2 to NH4+ is
catalysed by the nitrogenase enzyme and the hydrolysis of 16 mol ATP per one mol N2. The
postulated N2 reduction in an eight-electron reaction (Burgess and Lowe 1996, Thorneley
and Lowe 1985, Lowe and Thorneley 1984) was proven by detecting the intermediates
diazene and hydrazine but no N oxides (Hoffman et al. 2009, Barney et al. 2007).
Consequently, regeneration of ATP by glucose catabolism could intensify cellulose
decomposition. Moreover, further inorganic trace elements are needed, since the catalytic

Introduction
4 BAM-Dissertationsreihe
centre of the nitrogenase enzyme consists of a Fe-S cluster with a molybdenum or vanadium
atom in the centre. So far, it is not known if wood provides these elements. Separated
nitrogenase enzymes cannot catalyse N2 reduction.
Living bacterial cells are a prerequisite for nitrogenase activity. In addition, diazotrophic
bacteria are not described to have lignolytic or cellulytic activity. For these reasons, there are
many open questions on the mechanism of saprotrophic-diazotrophic interactions during
wood decomposition.
Lignolytic or cellulytic bacteria without nitrogenase activity were found on archaeological
wood stored under humid, anoxic conditions in soil (Blanchette 2000, Paajanen and Viitanen
1988), on waterlogged timber (Jordan and Schmidt 2000) or on wood piles in soils with a
varying groundwater level (Grinda 1997). These bacteria live predominantly under anoxic
conditions. The appearance of these bacteria on wood was classified according to the type of
damage (Clausen 1996, Nilsson and Daniel 1983, Greaves 1971). The damage was
visualised using light microscopy (Gelbrich et al. 2008), scanning and transmission electron
microscopy (Blanchette 2000, Daniel and Nilsson 1986) and FTIR spectroscopy (Gelbrich et
al. 2008). Particular organisms were isolated separately by laser techniques (Nilsson et al.
2008); some were identified (Landy et al. 2008). Other bacteria were described as
decomposers of natural and artificial compounds, which have inhibitory effects on fungal
decomposers (Jakobs-Schönwandt et al. 2010, Gelbrich et al. 2008).
In the present approach on tracing N2-fixation by instrumental means, diazotrophs from
strain collections were investigated. These well-described bacteria were supposed as
suitable for achieving first data by instrumental measurements. The diazotrophs Azotobacter
croococcum (Claus and Hempel 1970) and Beijerinckia acida (Hilger 1964) are examples of
free-living soil bacteria with diazotrophic activity. In soil, the bacteria coexist with fungi.
Novosphingobium nitrogenifigens was isolated from pulp and paper wastewater, which is a
substrate with a high C/N ratio. The bacterium contains nifH genes (Addison et al. 2007). In
this study, the fixation of atmospheric N2 of the bacteria was quantified by tracing the uptake
of N2, which was artificially enriched with the isotope 15N. In addition, the bacterial isolates
coexisting with Hypholoma fasciculare (Valášková et al. 2009) were analysed by the same
method.
1.3. Symbiosis and interaction
The term symbiosis was originally defined as “the living together of differently named
organisms” (de Bary 1879) that comprises mutualism, commensalism, competition and anta-
gonism (Ahmadjian 1986). Sometimes, these types of symbiosis cannot be distinguished,
because their morphologies are similar. Competition and mutualism may be characterised by

Introduction
5
similar physiological effects, e.g., the bacterially induced protein expression during nodulation
of legumes partly coincides with the protein release after pathogenic infections (Deakin and
Broughton 2009), and commensalism can change to antagonism (Kaldorf et al. 2006) and
vice versa. The environmental conditions can also influence the kind of interaction, but the
exact interrelations are manifold and a wild field for environmental studies. Although the
original definition of symbiosis includes all types of living together, the term often appears as
a synonym for mutualism. Therefore, the neutral term “interaction” was preferred in several
recent studies on fungal-bacterial coexistence (Frey-Klett et al. 2011, Miransari 2011, de
Boer and van der Wal 2008).
In many environments, fungal-bacterial interactions have important effects on the biology of
both partners (Frey-Klett et al. 2011). Mycorrhiza-fungi may benefit from ectomycelial
associations of bacteria, which compete with pathogens or provide additional nutrients (Frey-
Klett et al. 2007), and endomycelial associations of bacteria are a prerequisite for the
existence of lichens (Ahmadjian 1993). Bacteria living within the fungal hyphae are protected
in the mycelium, and these fungal-bacterial interactions imply a very close association.
Similar to mycorrhiza fungi, saprotrophic fungi may be affected by bacterial partners as well
(de Boer and van der Wal 2008). Fungal-bacterial studies include bacteria with the ability to
suppress fungi (de Boer et al. 2004) as well as fungi with the ability to reduce the number of
bacteria (Folman et al. 2008).
1.4. Isotope ratio mass spectrometry in environmental sciences
Isotopes are atoms with nuclei of the same number of protons but a different number of
neutrons. In nature, N occurs as two stable isotopes: 14N and 15N. Approximately 99% of the
global N is present as atmospheric N2 with a composition of 99.63% 14N and 0.37% 15N (De
Laeter et al. 2003, Junk and Svec 1958). Solid N occurs predominately as inorganic ions
(NH4+, NO3
– or NO2–), as NH3 or as organic N in biomass, e.g., amino acids, aminated
carbohydrates and nucleotides. The variances in natural relative isotope abundance in
biomass or salts can be analysed by isotope ratio mass spectrometry (IRMS).
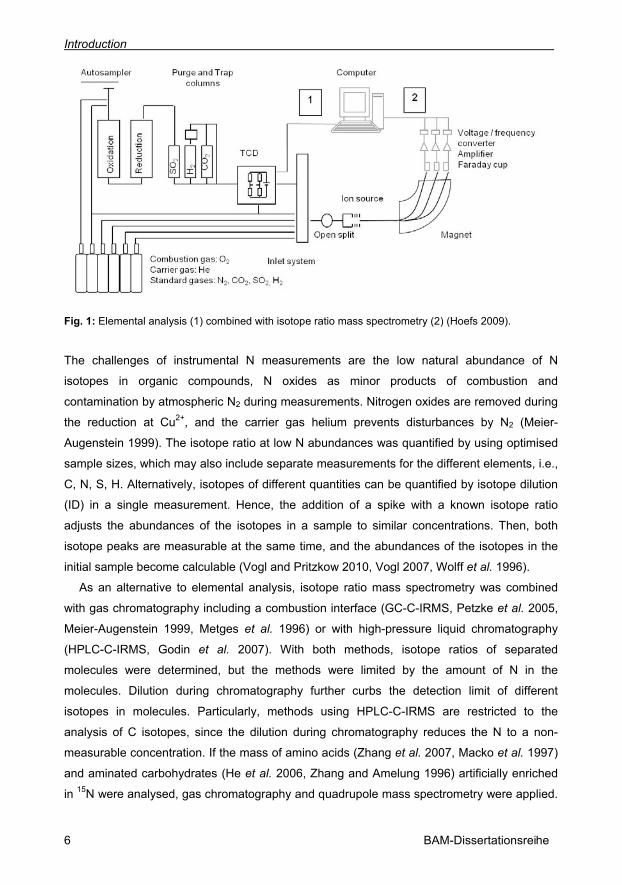
Isotope ratio mass spectrometry combined with elemental analysis (EA, Fig. 1) allows C,
N, S and H to be analysed simultaneously. Dried samples are combusted under O2, reduced
by Cu2+ and desiccated. While N2 directly passes the instrument, CO2 and SO2 are retarded
at purge-and-trap columns and heated out consecutively. The gases are quantified by a
thermal conductivity detector, which is a Wheatstone bridge (Fig. 1, 1), and further analysed
in a magnetic sector-field mass spectrometer (Fig. 1, 2). N is detected as N2 with a mass to
charge ratio (m z–1) of 28 and 29 (Hoefs 2009).
Introduction
6 BAM-Dissertationsreihe
Fig. 1: Elemental analysis (1) combined with isotope ratio mass spectrometry (2) (Hoefs 2009).
The challenges of instrumental N measurements are the low natural abundance of N
isotopes in organic compounds, N oxides as minor products of combustion and
contamination by atmospheric N2 during measurements. Nitrogen oxides are removed during
the reduction at Cu2+, and the carrier gas helium prevents disturbances by N2 (Meier-
Augenstein 1999). The isotope ratio at low N abundances was quantified by using optimised
sample sizes, which may also include separate measurements for the different elements, i.e.,
C, N, S, H. Alternatively, isotopes of different quantities can be quantified by isotope dilution
(ID) in a single measurement. Hence, the addition of a spike with a known isotope ratio
adjusts the abundances of the isotopes in a sample to similar concentrations. Then, both
isotope peaks are measurable at the same time, and the abundances of the isotopes in the
initial sample become calculable (Vogl and Pritzkow 2010, Vogl 2007, Wolff et al. 1996).
As an alternative to elemental analysis, isotope ratio mass spectrometry was combined
with gas chromatography including a combustion interface (GC-C-IRMS, Petzke et al. 2005,
Meier-Augenstein 1999, Metges et al. 1996) or with high-pressure liquid chromatography
(HPLC-C-IRMS, Godin et al. 2007). With both methods, isotope ratios of separated
molecules were determined, but the methods were limited by the amount of N in the
molecules. Dilution during chromatography further curbs the detection limit of different
isotopes in molecules. Particularly, methods using HPLC-C-IRMS are restricted to the
analysis of C isotopes, since the dilution during chromatography reduces the N to a non-
measurable concentration. If the mass of amino acids (Zhang et al. 2007, Macko et al. 1997)
and aminated carbohydrates (He et al. 2006, Zhang and Amelung 1996) artificially enriched
in 15N were analysed, gas chromatography and quadrupole mass spectrometry were applied.

Introduction
7
The molecules were ionised by electron impact ionisation (EI) or chemical ionisation (CI).
HPLC combined with electro-spray ionisation triple quadrupole mass spectrometry (ESI-MS-
MS) was used as well (Thiele et al. 2008). Proteins labelled with 15N were separated by two-
dimensional gel electrophoresis, trypsin digested and finally analysed with matrix-assisted
laser desorption ionisation time-of-flight mass spectrometry (MALDI-TOF), similar to peptide
sequencing approaches. As a result, mass spectra from 15N-labelled peptides slightly differed
from non-labelled control experiments (Jehmlich et al. 2008). The proteome of the N2-fixing
lichen Lobaria pulmonaria was investigated by a similar instrumental approach: Isolated
peptides without any labelling were analysed by one-dimensional gel electrophoresis
combined with LC-MS-MS (Schneider et al. 2011).
N analysis in biomass by EA-IRMS included the determination of the natural isotope ratio
and the recovering of substances artificially enriched in the isotope 15N. The natural isotope
ratio was determined for biomass from laboratory cultivations and N substrates as well as for
environmental samples. Tracing experiments of substances artificially enriched in 15N have
been frequently used to investigate the effect of artificial fertilisers or of bacterial N2 fixation
on plant roots (Shearer and Kohl 1993, Hardarson et al. 1984). The IRMS approach was
supposed to be the best available method to directly quantify the 15N2 fixation by root-
associated bacteria (Warembourg 1993). However, there are limitations regarding the
experimental setup and the time of exposure of biomass to 15N2. Particularly, the
measurement of low levels of N is accompanied with a high uncertainty (Danso et al. 1993).
1.5. Natural 15N abundance and fractionation
The natural δ15N values vary between – 20 and + 20‰ (Hoefs 2009). The variance of N
isotopes in biogeochemical matter is a result of fractionation, which occurs during physical or
chemical reactions (Hoefs 2009, Shearer and Kohl 1989). Since the reaction rates of the N
isotopes differ to a low extent, reactions discriminate against heavier isotopes. A fractionation
by atomic decay is negligible for stable N isotopes. Isotope fractionation is predominantly
caused by equilibrium exchange reactions, e.g., ammonia volatilisation (equation (1)). In the
process of volatilisation, the gaseous ammonia becomes 15N-depleted compared to the
aqueous ammonia (Hoefs 2009).
NH4aq+ <-> NH4gas (1)
Accordingly, temperature and climate are the most important parameters determining
fractionation. The measurable δ15N values in biomass comprise the sum of fractionation from
subsequent physical and chemical reactions. Additionally, the molecular weight of the N
source effects fractionation. In experiments, fractionation was more pronounced during

Introduction
8 BAM-Dissertationsreihe
uptake of ammonia (NH4+) than of amino acids. The N-fractionation rate of nitrate NO3
– in
biochemical reactions is usually lower than the fractionation of NH4+ (Hoefs 2009).
N transfer in mycorrhiza fungi in forests soils was investigated (Hobbie and Hobbie 2008).
In studies on soil, plants and fungi of the same ecosystem, fungi discriminated against 15N if
they transferred N into the plants. Thus, mycorrhiza plants are depleted whereas mycorrhiza
fungi are enriched in 15N (Högberg et al. 2011, Hobbie and Hobbie 2008, Högberg 1997). For
example, roots of F. sylvatica were depleted in 15N by almost 6.4‰ compared to the
ectomycorrhiza mantle (Högberg et al. 1999, Högberg et al. 1996). Non-mycorrhiza plants
had δ15N values similar to soil (Hobbie and Hobbie 2006). Interestingly, in ericoid mycorrhiza
penetrating the plant cell wall, the difference in δ15N values between fungi and plants was
less significant than in ectomycorrhiza plants and fungi (Emmerton et al. 2001a). Particularly,
plants and fungi of arctic ecosystems have been frequently used for studies on isotope
fractionation in biological reactions, since fractionation by equilibrium exchange is reduced at
low and constant temperatures (Emmerton et al. 2001a, b).
In biomass of saprotrophic basidiomycetes, higher N contents and δ15N values were found
than in wood, but both were lower than the δ15N values in soil of the particular ecosystem
(Gebauer and Taylor 1999). The δ15N values of soil differ according to soil origin and usually
increase in deeper soil horizons (Högberg et al. 1996). In several tested ecosystems, mycelia
were depleted in 15N compared to their fruiting bodies (Zeller et al. 2007), and within fruiting
bodies proteins usually had higher δ15N values than chitin (Taylor et al. 1997). Additionally,
fruiting bodies of ectomycorrhiza fungi were enriched in 15N compared to saprotrophic fungi
(Gebauer and Taylor 1999, Hobbie et al. 1999, Taylor et al. 1997, Högberg et al. 1996). In
laboratory studies, saprotrophic and mycorrhiza fungi fractionated N to a similar extent, and
the δ15N values of the substrates were determining for the final δ15N values in biomass
(Hobbie et al. 2004). In nature, differences among mycorrhiza and saprotrophic fungi result
from the uptake of 15N-rich N from soil or 15N-depleted N from plant material. The δ15N values
of the substrates determine the δ15N values in the fungal biomass to a greater extent than
strain specific fractionation.
1.6. Design of experiments (DOE)
To determine multiple factors of fungal wood decomposition, full-factorial experimental plans
were implemented. Experimental plans comprise a set of parallel experiments, which allow
the calculation of effects of different factors and their linear combinations (Kleppmann 2008,
Retzlaff et al. 1978). This design of experiments was invented by R. A. Fisher (Fisher 1935)
and was later optimised for a randomised parameter screening at a high number of factors
(Plackett and Burman 1946). Recently, experimental plans were used in biological studies for

Introduction
9
parameter evaluation (White and Gadd 1996), optimisation of analytical tests (Olsson et al.
2006) and processes in applied microbiology (Jacques et al. 1999).
A full-factorial experimental plan comprises experiments for all factor combinations, which
determine the measured value, and can be designed in a matrix of the type of Hadamard
matrices (Hedayat and Wallis 1978). The initial factors have to be chosen by a sound guess.
Microbial interactions can be analysed under a small number of different conditions.
Fractional-factorial plans (Plackett and Burman 1946) are useful if a high number of factors
has to be considered. Hence, the matrix of factor combinations is established as well, but
only a randomised fraction is carried out experimentally. The randomisation is realised by
software packages such as Statistica (StatSoft GmbH, Hamburg) or Minitab (Additive GmbH,
Friedrichsdorf).
In this study, the N sources of wood-decomposing basidiomycetes and the symbiosis with
the diazotroph B. acida were investigated in four full-factorial experimental plans. The test
organisms were T. versicolor and O. placenta in the vegetative growth phase, which is
generally regarded as the stage of wood decomposition. B. acida was found in the vicinity of
decomposing coniferous wood (Streichan and Schink 1986), was able to coexist with both
fungi and transferred fixed N2 to them (Weißhaupt et al. 2011). Experimental plans were
applied to quantify and compare the effects of different N sources and to evaluate if particular
combinations of parameters are determining. The intention was to reveal if different N
sources affect fungal activity and if fungi benefit from fungal-bacterial interactions. Two full-
factorial experimental plans were applied to investigate the effects of organic N from
peptone, N2 from air and ultimately N from wood on the growth of O. placenta and T.
versicolor. In two further plans, peptone was replaced by an inoculum of B. acida, and the
growth of the fungi was investigated again. The indicators of fungal activity were the
biomass, O2 consumption, CO2 formation, the elemental composition of the biomass and
laccase activity (Weißhaupt et al. 2012).
1.7. Objectives
Wood is decomposed by diverse organisms including fungi and bacteria. Since sapwood is
an N-deficient substrate, N amendment is a prerequisite for decomposition. Initial N could be
provided by minor spoilage with anthropogenic N or by diazotrophic bacteria. Both aspects
could be of interest for materials protection. This study focused on the microbial N
assimilation and on the relevance of diazotrophs, i.e., bacteria with the ability to assimilate
N2. If glucose from cellulose is the main C and energy source and if the bacterial nitrogenase
reaction is the bottleneck of N availability on wood, an increase in decomposition activity is
possible. Bacterial N2 fixation is energy demanding, and in microbial cells energy is provided
Introduction
10 BAM-Dissertationsreihe
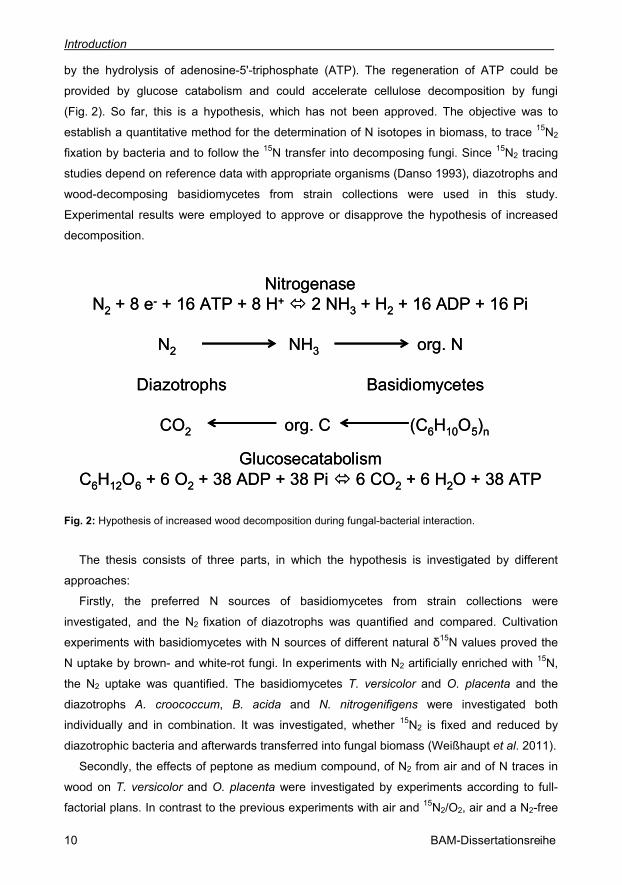
by the hydrolysis of adenosine-5'-triphosphate (ATP). The regeneration of ATP could be
provided by glucose catabolism and could accelerate cellulose decomposition by fungi
(Fig. 2). So far, this is a hypothesis, which has not been approved. The objective was to
establish a quantitative method for the determination of N isotopes in biomass, to trace 15N2
fixation by bacteria and to follow the 15N transfer into decomposing fungi. Since 15N2 tracing
studies depend on reference data with appropriate organisms (Danso 1993), diazotrophs and
wood-decomposing basidiomycetes from strain collections were used in this study.
Experimental results were employed to approve or disapprove the hypothesis of increased
decomposition.
NitrogenaseN2 + 8 e- + 16 ATP + 8 H+ 2 NH3 + H2 + 16 ADP + 16 Pi
N2 NH3 org. N
Diazotrophs Basidiomycetes
CO2 org. C (C6H10O5)n
GlucosecatabolismC6H12O6 + 6 O2 + 38 ADP + 38 Pi 6 CO2 + 6 H2O + 38 ATP
NitrogenaseN2 + 8 e- + 16 ATP + 8 H+ 2 NH3 + H2 + 16 ADP + 16 Pi
N2 NH3 org. N
Diazotrophs Basidiomycetes
CO2 org. C (C6H10O5)n
GlucosecatabolismC6H12O6 + 6 O2 + 38 ADP + 38 Pi 6 CO2 + 6 H2O + 38 ATP
Fig. 2: Hypothesis of increased wood decomposition during fungal-bacterial interaction.
The thesis consists of three parts, in which the hypothesis is investigated by different
approaches:
Firstly, the preferred N sources of basidiomycetes from strain collections were
investigated, and the N2 fixation of diazotrophs was quantified and compared. Cultivation
experiments with basidiomycetes with N sources of different natural δ15N values proved the
N uptake by brown- and white-rot fungi. In experiments with N2 artificially enriched with 15N,
the N2 uptake was quantified. The basidiomycetes T. versicolor and O. placenta and the
diazotrophs A. croococcum, B. acida and N. nitrogenifigens were investigated both
individually and in combination. It was investigated, whether 15N2 is fixed and reduced by
diazotrophic bacteria and afterwards transferred into fungal biomass (Weißhaupt et al. 2011).
Secondly, the effects of peptone as medium compound, of N2 from air and of N traces in
wood on T. versicolor and O. placenta were investigated by experiments according to full-
factorial plans. In contrast to the previous experiments with air and 15N2/O2, air and a N2-free
Introduction
11
O2/Ar atmosphere were applied. In addition, the experiments of the experimental plan
included wood as a substrate. Since B. acida transferred fixed N into fungi, this bacterium
was chosen for further tests of fungal-bacterial interaction. The indicators of fungal activity
were biomass formation, CO2 formation, O2 consumption, C and N contents, δ15N values in
the biomass and laccase activity. These indicators were measured in order to show if fungal
growth and the increase of decomposition activity are affected in the same way by the N
sources. Moreover, gas measurements ensured the quality of the experimental conditions
after gas-replacement, and IRMS measurements proved the uptake of N sources (Weißhaupt
et al. 2012).
Thirdly, the results of the previous studies were compared to the N uptake of Hypholoma
fasciculare and coexisting bacterial isolates, which occurred together on decomposing wood
in nature. The bacteria were isolated, identified, and their C utilisation was investigated in
another study (Valášková et al. 2009). H. fasciculare and coexisting bacterial isolates were
cultivated with different N sources, and the 15N2-tracing methods were applied. The preferred
N species were determined, and the bacterial 15N2 fixation was quantified. Analysis was
conducted to determine if bacteria increase the N availability and affect wood decomposition.
The three approaches focused on different methods and aspects of fungal-bacterial
interactions during decomposition. Two experimental approaches were applied and
compared: stable-isotope tracing by means of 15N2 and experimental plans including an N-
free O2/Ar atmosphere. The results of both approaches were critically reviewed by statistical
means to exclude artefacts and to test the significance of experimental datasets. Firstly,
wood decomposers and diazotrophs from strain collections were used to obtain basic
information on N concentrations in microbial biomass and N2-fixation rates. Secondly, the
comparison with the natural-occurring community gave evidence on the role of bacteria in
situ.

Materials and Methods
12 BAM-Dissertationsreihe
2. Materials and Methods
2.1. Sterilisation
All experiments were carried out under sterile conditions. Tools, media and also wastes were
steam sterilised according to a standardised method (DIN EN ISO 17665), i.e., 20 min at
2 × 10⁵ Pa and 120 °C in a laboratory autoclave (Varioklav Dampfsterilisator, H + P
Labortechnik GmbH, Oberschleißheim). Wood specimens were steam sterilised at 100 °C for
20 min on two consecutive days in a steam-raising unit (Fritz Gössner GmbH, Hamburg).
During sterilisation, the specimens were placed either on Petri dishes or in bags. Afterwards,
all tools or wood samples were dried at 60 °C in a drying cabinet (Heraeus 6000, Thermo
Fisher Scientific GmbH, Bremen). Microorganisms were transferred under sterile conditions
in laminar airflow cabinets (Nalgene Nunc International GmbH, Wiesbaden).
2.2. Cultivation of basidiomycetes
2.2.1. Cultivation media Basidiomycetes are usually cultivated on 5%-barley-malt-extract medium (MEA, Villa Natura
Gesundprodukte, Kirn). Occasionally, the medium was amended with 15 or 20 g L–1 agar
(Merck KGaA). This medium was also used for long-term cultivations.
In most of the experiments of this study, the basidiomycetes were cultivated on
diazotrophic medium (RBA, Tab. 1, Atlas 1997). This N-free medium was modified according
to experimental requirements (see 2.2.2. and 2.2.3. as well as 2.4. and 2.5.). Generally, the
vitamin solution (solution D) was not added as recommended (Atlas 1997) to prevent the
dilution of N isotopes.
2.2.2. Long-term cultivations and cultivations on complex substrates Trametes versicolor (CTB 863A, Centre Technique du Bois, Paris, France), Oligoporus
placenta (FPRL 280, Forest Products Research Laboratory, Watford, United Kingdom) and
Hypholoma fasciculare (DSM 1010, German Collection of Microorganisms and Cell Cultures
GmbH, Brunswick) were used. In preliminary experiments, Serpula lacrimans (BAM
Ebw. 315, BAM Federal Institute for Materials Research and Testing, Berlin), Coniophora
puteana (BAM Ebw. 15) and Antrodia vaillantii (BAM h2) were investigated. For pre-cultures
and long-term cultivations on Petri dishes (94/16, PS, w/vents, Paul Boettger OHG,
Bodenmais) with MEA were used. Fungal inocula (excisions of 5 mm × 5 mm) were monthly
transferred to new medium. To maintain the virulence, i.e., the wood-decomposing activity,
fungi were cultivated on MEA with two wood blocks (sapwood, 5 mm × 10 mm × 32.5 mm).
O. placenta was cultivated on wood of Pinus sylvestris. T. versicolor and H. fasciculare were
Materials and Methods
13
cultivated on wood of Fagus sylvatica. Hence, the wood blocks were co-transferred to the
new media. Before conducting the experiments, fungi were pre-cultivated without wood on
5%-barley-malt-extract medium or RBA medium for 14 d.
In preliminary cultivation experiments, the basidiomycetes were grown in 50 mL MEA
without agar in Erlenmeyer flasks. The fungal inocula were excisions of 5 mm × 5 mm of
each basidiomycete, which was pre-cultivated in solid medium. Cultivations proceeded in a
dark room with a constant temperature of 21 ± 2 °C at a humidity of 70 (± 5)%. The
cultivations were not shaken to prevent any pellet formation.
2.2.3. Cultivations at defined N sources If the uptake of specific N sources by fungi was tested, N-free RBA medium (without solution
D, Atlas 1997) was applied. For these experiments, fungi were pre-cultivated on agar-
containing RBA medium on Petri dishes and transferred twice on new RBA medium to
prohibit the transfer of N from residual MEA in the inoculum. For experiments in Erlenmeyer
flasks, 50 mL agar-free RBA was amended with 1 mL of 50% D-glucose solution and 250 µL
of (a) 60 g L−1 urea, (b) 117 g L−1 NaNO3, (c) 107 g L−1 NH4Cl or (d) deionised water as N-
free control. The final N concentration of (a)–(c) was adjusted to 10 mM N, and each of the
experiments was carried out three times (Weißhaupt et al. 2011). The cultivation was carried
out at 21 ± 2 °C at a humidity of 70 (± 5)%. O. placenta and T. versicolor were cultivated for
7, 14, 21, 28 and 35 d with each of the N sources (a)–(d). H. fasciculare was cultivated for
14, 28, 42, 56 and 70 d with each of the N sources (a)–(d). After cultivation, fungal biomass
was separated from the medium by filtration (No. 1, Whatman International Ltd., Maidstone,
United Kingdom), rinsed with sterile, deionised water and lyophilised (as mentioned in
section 2.7.). Dried samples of biomass were analysed by EA and IRMS (section 2.8.).
2.3. Cultivation of bacteria
2.3.1. Cultivation media RBA (without solution D, Atlas 1997) was used for the cultivation of diazotrophs, bacterial
isolates coexisting with H. fasciculare and for fungal-bacterial co-cultivations. The medium is
supposed to be suitable for the cultivation of a broad diversity of diazotrophs. It contains
several C-sources and trace elements that are necessary for the nitrogenase reaction. The
recommended vitamin solution (Solution D) was not added to prevent N isotope dilution. RBA
medium contained 0.005 g L–1 N, which can be traced back to yeast extract (0.05 g L–1 with
an N content of 11.16 (± 0.1)%). If agar (15 g L–1 with an N content of 0.28 (± 0.01)%) was
applied, the N content was approximately 0.05 g L–1.

Materials and Methods
14 BAM-Dissertationsreihe
In addition, the purchased bacteria were cultivated on recommended media. The specific
media were Azotobacter medium for A. croococcum, Beijerinckia medium for B. acida and
nutrient medium for N. nitrogenifigens (recommendation by DSMZ, Atlas 1997; Tab. 1).
Tab. 1: Composition of media applied for the cultivation of bacteria in the present study (Atlas 1997).
Diazotrophic medium
pH 7.3
Azotobacter medium
pH 7.3
Beijerinckia medium
pH 6.5
Nutrient medium
pH 7.0
Tryptone soy broth (1:10)
pH 5
D-Glucose 2.0 g L–1
D-Mannitol 2.0 g L–1
K2HPO4 0.9 g L–1
KH2PO4 0.1 g L–1
MgSO4 x 7 H2O 0.1 g L–1
FeSO4 x 7 H2O 0.01 g L–1
MnSO4 x H2O 0.005 g L–1
Na2MoO4 x 2 H2O 0.005 g L–1
NaVO3 x H2O 0.005 g L–1
CaCl2 x 2 H2O 0.10 g L–1
NaCl 0.1 g L–1
Na-pyruvate 1.0 g L–1
DL-malate 2.0 g L–1
Na2-succinate 1.0 g L–1
Yeast extract 0.05 g L–1
Trace elements
D-Glucose 5.0 g L–1
D-Mannitol 5.0 g L–1
K2HPO4 0.9 g L–1
KH2PO4 0.1 g L–1
MgSO4 x 7 H2O 0.1 g L–1
FeSO4 x 7 H2O 0.01 g L–1
Na2MoO4 x 2 H2O 0.005 g L–1
CaCl2 x 2 H2O 0.10 g L–1 CaCO3 5 g L–1
D-Glucose 10.0 g L–1
K2HPO4 0.8 g L–1
KH2PO4 0.2 g L–1
MgSO4 x 7 H2O 0.1 g L–1
FeSO4 x 7 H2O 0.02 g L–1
MnSO4 x 6 H2O 0.002 g L–1
Na2MoO4 x 2 H2O 0.005 g L–1 ZnSO4 x 6 H2O 0.005 g L–1
CuSO4 x 6 H2O 0.004 g L–1
Peptone (casein) 5 g L–1 Meat extract 3 g L–1
D-Glucose 0.25 g L–1
MES 1.95 g L–1
K2HPO4 0.25 g L–1 NaCl 1.5 g L–1
Peptone (casein) 1.7 g L–1 Peptone (soy meal) 0.3 g L–1
0.005 g L–1 No N No N 1.1 g L–1 0.28 g L–1

Materials and Methods
15
Azotobacter medium and Beijerinckia medium are N-free. Nutrient medium contains organic
N from complex sources, i.e., peptone and meat extract. TSB, which also contains N, was
used for the cultivation of bacteria coexisting with H. fasciculare (Valášková et al. 2009,
Folman et al. 2008). It was diluted 1:10 and adjusted to pH 5 by adding 2-(N-
morpholino)ethanesulfonic acid (MES) and NaCl (Folman et al. 2008). TSB medium
comprised 0.33 g L–1 N, which was provided by peptone from casein (1.7 g L–1 with an N
content of 14.88 (± 0.01)%), peptone from soy meal (0.3 g L–1 with an N content of
10.34 (± 0.01)%) and agar (15 g L–1 with an N content of 0.28 (± 0.01)%). The N
concentrations of each medium were calculated after measuring the medium ingredients by
elemental analysis.
2.3.2. Cultivation of diazotrophic bacteria and bacterial isolates coexisting with H. fasciculare Azotobacter croococcum (DSM 281), Beijerinckia acida (DSM 1714) and Novosphingobium
nitrogenifigens (DSM 19370) were cultivated on recommended media and on RBA amended
with 15 g L–1 agar (Tab. 1). Bacteria were cultivated on Petri dishes (94/16, PS, w/vents, Paul
Boettger OHG) containing 20 mL medium or in glass reaction tubes containing either 10 mL
or 20 mL solidified or liquid medium. The cultivation proceeded at room temperature in a
sterile box or at 30 ± 3 °C in an incubation room. For long-term storage, bacteria were
cultivated in Erlenmeyer flasks for 21 d, harvested by centrifugation in 1.5 mL-reaction-tubes
(10000 rpm, 3 min, Model 5424, Eppendorf AG, Hamburg) and stored at –20 °C.
The proteobacterial isolates coexisting with H. fasciculare (Netherlands Institute of
Ecology NIOO-KNAW, Heteren, The Netherlands) were affiliated to Sphingomonas sp. (WH
5, 6 and 29), Acetobacteraceae b. (WH 150), Burkholderia sp. (WH 27, 10, 11, 12, 20, 22,
24, 25, 26 and 8), Dyella sp. (WH 3, 32, 33, 34 and 35), Xanthomonadaceae b. (WH 1, 2, 7,
30 and 38), Rahnella sp. (WH 9 and 28) and Pedobacter sp. (WH 4, Valášková et al. 2009).
The bacterial isolates were cultivated on 20 mL agar-containing tryptone soy broth (TSB) at
pH 5 (Folman et al. 2008; Atlas 1997) or on RBA at pH 5 (Atlas 1997) on Petri dishes (94/16,
PS, w/vents, Paul Boettger OHG). The initial pH of RBA was adjusted by changing the
amounts of KH2PO4 to 0.6 g L–1 and K2HPO4 to 0.4 g L–1 (Sørensen 1909). The cultivations
proceeded either at 30 ± 3 °C and a humidity of 70 ± 5% or at room temperature of 21 ± 3 °C
in the dark. Cultures at TSB medium were stored at 8 ± 2 °C in a refrigerator.
2.3.3. Cultivation on micro plates with different N sources The preferences of bacteria towards N species were tested on micro plates (96-well, pure
Grade™, Brand GmbH & Co KG, Wertheim) in 250 µL RBA at pH 7 or RBA at pH 7 amended
Materials and Methods
16 BAM-Dissertationsreihe
with 10 mM N from urea, NH4Cl or NaNO3. The medium suspensions with different N sources
were prepared in 50 mL RBA in Erlenmeyer flasks (as mentioned in section 2.2.2. but without
additional glucose), and then 250 µL of the suspension were transferred into the wells of the
micro plate. The inocula were 50 µL of a pre-culture of bacteria in 1.5 mL-reaction-tubes in
RBA. Optical density at 600 nm was determined in a plate reader (30 °C, every 2 h, for 72 h,
Synergy HT, BioTek Instruments GmbH, Bad Friedrichshall). Growth curves were monitored
by the instrument’s Software. Three replicate growth curves for each of the 27 bacterial
isolates coexisting with H. fasciculare on each N source were monitored, and Excel Software
(Microsoft GmbH, Unterschleißheim) was used to determine the mean curves. The averages
of replicate growth curves were determined and categorised according to the increase from
an initial OD of 0.2 to a maximum OD of a) ODmax > 0.25 (+), b) ODmax > 0.5 (++), c) ODmax >
0.75 (+++), d) ODmax > 1 (++++). No OD increase was indicated by the symbol (o).
2.3.4. Cultivation of bacteria under a 15N2/O2 atmosphere The diazotrophs A. croococcum (DSM 281), B. acida (DSM 1714) and N. nitrogenifigens
(DSM 19370) as well as the bacterial isolates coexisting with H. fasciculare were cultivated
under an atmosphere of 15N2/O2 and under air. The cultivations proceeded in two parallel
batches in desiccators (6071, with a volume of approximately 6 L and tested to 2 × 10⁵ Pa,
Glaswerke Wertheim, Wertheim). The first desiccator was filled with 15N2/O2, and the second
desiccator was filled with air. Each desiccator contained a glass vial with 10 mL of sterile
water to maintain humid conditions during cultivation (Fig. 3). The experiment included
cultivations of each bacterium under four conditions: (a) RBA under 15N2/O2 atmosphere, (b)
respective media in Tab. 1 under 15N2/O2 atmosphere, (c) RBA under air and (d) respective
media in Tab. 1 under air.
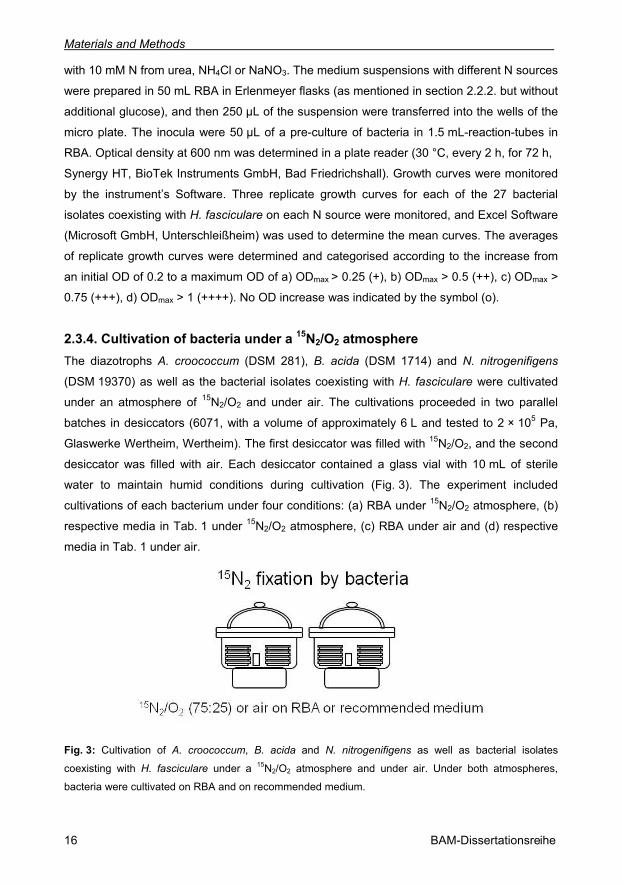
Fig. 3: Cultivation of A. croococcum, B. acida and N. nitrogenifigens as well as bacterial isolates
coexisting with H. fasciculare under a 15N2/O2 atmosphere and under air. Under both atmospheres,
bacteria were cultivated on RBA and on recommended medium.
Materials and Methods
17
Each of the two batches included the three diazotrophs cultivated on the recommended
medium (two replicates of A. croococcum on Azotobacter medium, two replicates of B. acida
on Beierinckia medium and two replicates of N. nitrogenifigens on nutrient medium) and on
RBA medium (two replicates of A. croococcum, B. acida and N. nitrogenifigens). The
bacterial isolates coexisting with H. fasciculare were cultivated on TSB (Folman et al. 2008)
and RBA medium at pH 5. Three strains of the 27 isolates (described in 2.3.2) were
cultivated together on one Petri dish, and each strain was distributed on a third of the
medium’s surface. Cultivations were carried out on Petri dishes (94/16, PS, w/vents, Paul
Boettger OHG) containing 20 mL medium with 15 g L–1 agar. The Petri dishes had to be
equipped with vents to stand the gas-replacement procedure (see below). Finally, each
desiccator included 31 Petri dishes.
The bacterial isolates coexisting with H. fasciculare were pre-cultured on TSB at pH 5
(Atlas 1997; 1:10 diluted according to Folman et al. 2008) and transferred with an inoculation
loop. Each diazotroph was pre-cultured in RBA medium. During transfer, the co-transfer of
medium was prevented as far as possible. The Petri dishes were then transferred into the
two sterilised desiccators. The transfer proceeded under a laminar-flow working bench.
For gas-replacement, the desiccators were evacuated for 15 min with a vacuum pump
(CVC 2000II, Vacuubrand GmbH & Co. KG, Wertheim) to 4 × 10³ Pa and then refilled with
sterile-filtered air or a gas mixture of 75 vol.-% 15N2 (98 atom-% 15N) and 25 vol.-% O2
(672793-SPEC, Sigma-Aldrich Chemie GmbH). The equipment was surface-sterilised
(Meliseptol®, B. Braun Melsungen AG, Melsungen). The gas bottle, the vacuum-pump and
the desiccator were connected by a three-way valve (glass, NS 18, D = 2.5 mm, Duran
Group GmbH, Wertheim) and with silicone and PVC tubes. The connections were made
gastight by interference-fit and hose clamps. After evacuation, the valve was switched to
connect the gas bottle, the pump was switched off, and the valve of the gas bottle was
carefully opened in exactly this order. The complete refilling was indicated by a movement of
the desiccator lid. After that step, a gas container of 5 L of the mentioned gas (672793-
SPEC, Sigma-Aldrich Chemie GmbH) was empty. The desiccator was disconnected, and the
connection-opening was immediately sealed with rubber.
Consecutively, the incubation at 21 ± 3 °C proceeded for 21 d. The increase of bacterial
biomass was observed, and the bacteria were harvested from the surface with a spatula. The
samples were transferred to 1.5 mL-reaction-tubes, lyophilised (as mentioned in section 2.7.)
and analysed by IRMS (as mentioned in section 2.8.).

Materials and Methods
18 BAM-Dissertationsreihe
2.4. Fungal-bacterial co-cultivations under 15N2/O2 atmosphere
Each of the two basidiomycetes O. placenta and T. versicolor was co-cultivated with each of
the three diazotrophs A. croococcum, B. acida and N. nitrogenifigens in 20 mL liquid RBA
medium on Petri dishes (94/16, PS, w/vents, Paul Boettger OHG) for 21 d and in three
replicate cultivations, i.e., two basidiomycetes × three diazotrophs × three replicates = 18
cultivations. Moreover, the fungi were cultivated individually under both atmospheres (three
replicates). The bacterial inocula consisted of approximately 20 mg cells harvested from pre-
cultures on favoured solid media as mentioned above. The co-cultivations were carried out in
two desiccators: one was filled with air and the other one was filled with a gas mixture of 15N2/O2 (Fig. 4). The experiment included the following co-cultivations on RBA: (a) three
individual cultivations of T. versicolor and nine co-cultivations with T. versicolor under 15N2/O2
atmosphere, (b) three individual cultivations of O. placenta and nine co-cultivations with O.
placenta under 15N2/O2 atmosphere, (c) three individual cultivations of T. versicolor and nine
co-cultivations with T. versicolor under air, (d) three individual cultivations of O. placenta and
nine co-cultivations with O. placenta under air.
Fig. 4: Co-cultivations of A. croococcum, B. acida and N. nitrogenifigens with O. placenta and T.
versicolor under a 15N2/O2 atmosphere and under air.
At the beginning of the incubation time, the desiccator was evacuated for 15 min with a
vacuum pump (CVC 2000II) to 4 × 10³ Pa and then refilled with air or a gas mixture of
75 vol.-% 15N2 (98 atom-% 15N) and 25 vol.-% O2 (672793-SPEC, as mentioned in section
2.3.4.). After incubation, each mycelium was separately removed with a spatula and rinsed
with sterile deionised water to separate attached bacteria. The mycelium was put into a
reaction vial, while the medium suspension and the washing water were centrifuged at
8000 rpm for 10 min (Labofuge M, Heraeus Instruments GmbH, Berlin) to collect the bacterial
biomass. The resulting biomass samples (bacterial and fungal) were lyophilised, weighed
and analysed by IRMS (as mentioned in section 2.7. and 2.8.).
Materials and Methods
19
2.5. Cultivations according to full-factorial experimental plans
Two full-factorial experimental plans were designed to test the growth of O. placenta and T.
versicolor at varying N sources (Weißhaupt et al. 2012). The factors were x1: organic N as
part of the medium (1.9 g L–1 peptone or no N source), x2: N traces in a wood specimen
(presence or absence of sapwood, 5 mm × 32.5 mm × 10 mm) and x3: N2 content in the gas
atmosphere (air or O2/Ar atmosphere, Tab. 2). O. placenta was tested on wood of P.
sylvestris, and in experiments with T. versicolor wood of F. sylvatica was applied. All
experiments comprised 20 mL of liquid RBA (without solution D and without agar, Atlas
1997). To prevent any bacterial growth, 100 µL antibiotics solution (2 g L–1 tetracycline and
8 g L–1 streptomycin, Merck KGaA) was added to 20 mL of RBA medium. Peptone from
casein (Merck KGaA) was added to RBA medium in an amount of 1.9 g L–1 (380 µL of a
sterile solution of 0.1 g mL–1) which was approximately the protein concentration in 5%-malt-
extract medium, since a protein content of 3.8% was outlined in the nutrition panel of malt
extract (Villa Natura Gesundprodukte GmbH).
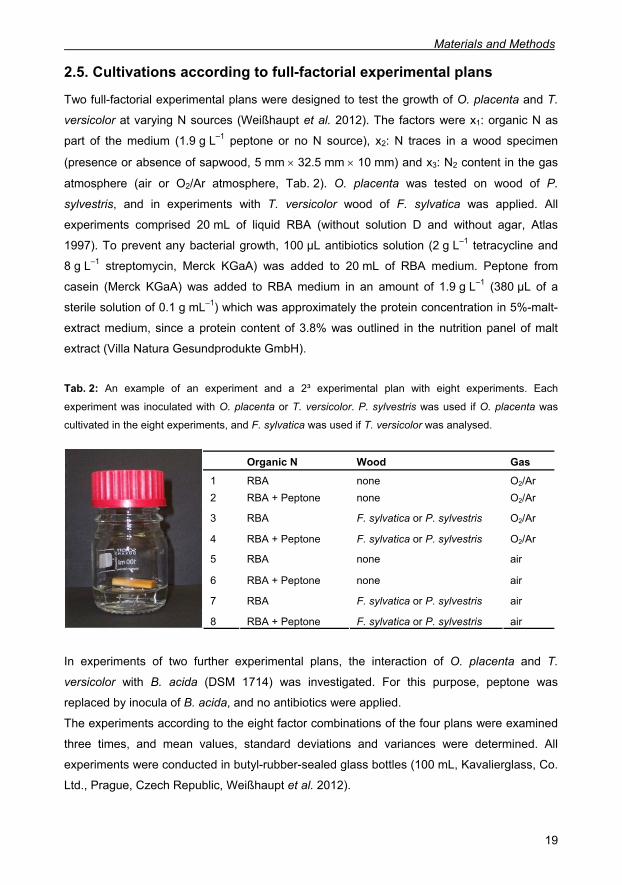
Tab. 2: An example of an experiment and a 2³ experimental plan with eight experiments. Each
experiment was inoculated with O. placenta or T. versicolor. P. sylvestris was used if O. placenta was
cultivated in the eight experiments, and F. sylvatica was used if T. versicolor was analysed.
Organic N Wood Gas
1 RBA none O2/Ar 2 RBA + Peptone none O2/Ar
3 RBA F. sylvatica or P. sylvestris O2/Ar
4 RBA + Peptone F. sylvatica or P. sylvestris O2/Ar
5 RBA none air
6 RBA + Peptone none air
7 RBA F. sylvatica or P. sylvestris air
8 RBA + Peptone F. sylvatica or P. sylvestris air In experiments of two further experimental plans, the interaction of O. placenta and T.
versicolor with B. acida (DSM 1714) was investigated. For this purpose, peptone was
replaced by inocula of B. acida, and no antibiotics were applied.
The experiments according to the eight factor combinations of the four plans were examined
three times, and mean values, standard deviations and variances were determined. All
experiments were conducted in butyl-rubber-sealed glass bottles (100 mL, Kavalierglass, Co.
Ltd., Prague, Czech Republic, Weißhaupt et al. 2012).

Materials and Methods
20 BAM-Dissertationsreihe
Sterilised sapwood blocks were placed on spacers (netting wire, mesh 10 mm2, wire
diameter 1 mm, X5CrNi18-10, Kaldenbach KG, Berlin) at the gas-liquid interface. The fungal
and bacterial inocula were pre-cultivated on solid RBA. The atmosphere was sterile air or a
mixture of 20.23 mol-% O2 in Ar (CRM No.: BAM-G035, BAM Federal Institute for Materials
Research and Testing, Berlin).
For gas-replacement, the bottles were evacuated three times for 10 min to 1000 Pa with a
vacuum pump (CVC 2000II) and refilled with the respective gas mixture. The gastightness
and the reproducibility of gas-replacement procedure were tested in pre-experiments without
inocula (Tab. 3). After 14 d of incubation at 21 °C, the gas phase was investigated by gas
chromatography (section 2.9.). Then, the fungus was separated from the medium by filtration
(Whatman No. 1, Whatman International Ltd.). Fungal biomass of experiments containing B.
acida was separated with a spatula and washed with deionised water. The washing
suspensions and the residual medium was centrifuged (10 min, 8000 rpm, Labofuge M) to
collect the bacterial biomass. Biomass was lyophilised and weighed immediately. Afterwards,
the biomass was analysed by IRMS (section 2.8.).
Tab. 3: Test of fungal and bacterial viability and of the quality of gas-exchange procedure (n = 3, mean
values ± SD if RBA was used; n = 6, mean values ± SD if MEA was used).
medium wood gas O2/Ar
in %
N2
in %
CO2
in %
organism biomass
in mg
C
in %
N
in %
δ15N
in ‰
MEA none O2 /Ar 70.33 (± 4.1)
0.90 (± 0.6)
28.77 (± 4.5)
O. placenta 52.37 (± 9.2)
47.63 (± 14.6)
5.18 (± 2.0)
4.29 (± 0.4)
MEA none air 2.91 (± 2.0)
78.15 (± 1.5)
18.94 (± 0.9)
O. placenta 43.45 (± 3.4)
42.54 (± 0.7)
3.34 (± 0.2)
4.61 (± 1.4)
MEA none O2 /Ar 68.13 (± 15.0)
1.35 (± 0.8)
30.52 (± 14.8)
T. versicolor 58.17 (± 4.1)
48.09 (± 11.7)
4.00 (± 1.9)
4.29 (± 0.5)
MEA none air 0.84 (± 0.1)
64.20 (± 1.6)
34.96 (± 1.6)
T. versicolor 42.08 (± 7.5)
44.77 (± 0.9)
4.53 (± 0.5)
4.21 (± 0.5)
RBA none O2 /Ar 99.55 (± 0.1)
0.39 (± 0.1)
0.04 (± 0.1)
RBA none air 20.15 (± 0.1)
79.79 (± 0.1)
0.07 (± 0.1)
no inoculum and no biomass analysis no inoculum and no biomass analysis
RBA + B. acida
none O2 /Ar 94.86 (± 0.4)
0.34 (± 0.1)
4.80 (± 0.4)
B. acida 1.23 (± 0.1)
32.26 1) 2.121) 1.191)
RBA + B. acida
none air 11.26 (± 2.0)
76.16 (± 1.6)
12.59 (± 0.5)
B. acida 4.6 (± 1.4)
33.931) 2.941) –0.061)
1) One measurement of the biomass collected from three replicates.
In preliminary experiments, the fungal viability was tested by cultivating T. versicolor and O.
placenta in 20 mL of a 5%-malt-extract medium without agar (Atlas 1997) and by determining
the indicators of fungal activity (Tab. 3). Bacterial viability of B. acida was investigated on

Materials and Methods
21
RBA and unravelled a positive but not mandatory effect of N2 (Tab. 3). Gas analysis and
IRMS analysis were conducted as described (sections 2.8. and 2.9.). The results (in Tab. 3)
are a reference for the results of the experiments in section 3.8. and 3.9. and underline that
the organisms are cultivable under the chosen conditions and that the glass bottles were
gastight during experiments.
2.6. Aqueous soil and wood extracts
Deionised water was added to a volume of 500 mL soil (collected from BAM Test Site
Technical Safety, Baruth/Mark), 500 mL bark fragments from Betula pendula and 500 mL
sawdust from P. sylvestris to a final volume of 800 mL. The mixtures were put into an
autoclave for optimised aqueous extraction (sterilisation procedure as mentioned in section
2.1.). Afterwards, the solid particles were separated by filtration. The permeate was collected,
and 40 mL permeate were filled in round bottom flasks, which were dipped in liquid N2 until
the content was frozen. Subsequently, the samples were freeze-died in a lyophilisation unit
(section 2.7.). Approximately 2 to 15 mg of each sample was analysed by IRMS.
2.7. Measurement of biomass and enzyme activities
Microbial growth was analysed by measurements of dry biomass. Therefore, fungi were
cultivated in liquid medium, then separated by filtration (Whatman No 1), rinsed with sterile,
deionised water and finally dried (20 h at 10 Pa plus 4 h at 1 Pa, Lyophilisator Alpha 2-4,
Martin Christ Gefriertrocknungsanlagen GmbH, Osterode). Bacterial suspensions were either
centrifuged (10 min, 8000 rpm, Labofuge M) or harvested from the medium’s surface with a
spatula. Fungal-bacterial co-cultivations in liquid medium were separated by removing the
fungal biomass with a spatula and by centrifugation of bacterial suspensions. For
lyophilisation, samples were either filled in round bottom flasks or in 1.5 mL-reaction tubes.
These samples were frozen in liquid N and immediately connected to the lyophilisator.
Afterwards, the lyophilised samples were weighed (PM 4000, Mettler Instrumente AG,
Greifensee, Switzerland) and stored in a glass desiccator amended with silica gel (Merck
KGaA) to prevent intrusion of moisture.
The pH decrease in the media during cultivation and on infested wood surfaces was
measured with pH indicator paper (Acilit, Merck KGaA) and by surface pH measurements
(InLab 426, Knick Elektronische Messgeräte GmbH & Co. KG, Berlin), respectively.
Laccase activity, i.e., the sum of all peroxidative enzyme activity, was quantified by the
oxidation of 2,2'-azino-bis-(3-ethylbenzthiazoline)-6-sulphonate (ABTS, Sigma-Aldrich
Chemie GmbH) in 100 mM sodium acetate buffer (Merck KGaA) at pH 5 (Bourbonnais and
Paice 1990, Wolfenden and Willson 1982). These experiments were realised on micro plates
Materials and Methods
22 BAM-Dissertationsreihe
(96-well, pureGrade™, Brand GmbH & Co KG) and analysed in a micro plate reader
(Synergy HT, BioTek Instruments GmbH). Each well contained 160 µL sodium acetate buffer,
20 µL sample, i.e., cultivation medium after the organisms were removed, and 20 µL 50 mM
ABTS in sodium acetate buffer. The extinction at 420 nm increased according to laccase-
catalysed oxidation of ABTS and was measured every 10 min during a period of 8 h. After
linear approximation of the exponential curves, the gradient was determined and used to
calculate the increase in concentration according to Lambert-Beer’s law. The molar extinction
coefficient for ABTS was ελ = 36000 L mol–1 cm–1, and d was determined as 0.33 cm. The
enzyme activity is determined in enzyme unit per litre (U L–1), which is defined as µmol
substrate per min and litre.
2.8. Elemental analysis isotope ratio mass spectrometry (IRMS)
The C and N contents as well as the δ13C and the δ15N values of fungal and bacterial
biomass were investigated by elemental analysis (Vario EL III, Elementar Analysensysteme
GmbH) combined with isotope ratio mass spectrometry (Isoprime, GV Instruments Ltd.,
Manchester, United Kingdom). Lyophilised samples were weighed in tin cases (Elementar
Analysensysteme GmbH, Hanau) on a microbalance (XP6, Mettler-Toledo GmbH, Giessen).
The tin cases were closed tightly to prevent the enclosure of residual N2. The exact mass of
the sample was written manually into working sheets of the instrument’s software and used
to calculate mass related values, i.e., C, N, S, H contents in %. The sample sizes were
optimised for N measurements. If bacterial biomass was measured, the sample size was 0.5
to 3 mg depending on the labelling with 15N. If fungal biomass was focused, 3 to 10 mg was
used, and 10 to 15 mg biomass was measured if the fungal biomass was grown under limited
conditions or if aqueous wood extracts were analysed.
In a measurement, the combustion proceeded in O2 (purity: 99.9999 vol.-%, AirLiquide
Deutschland GmbH, Düsseldorf) for 90 s, and the carrier gas was He (purity: 99.9999 vol.-%,
AirLiquide). The reference gases CO2 (purity: 99.998 vol.-%, AirLiquide) and N2 (purity:
99.9999 vol.-%, AirLiquide) were used as gas standards for IRMS. If samples enriched in 15N
are measured, the m z–1 = 29 is difficult to determine, because the relevant Faraday cup is
adjusted to a low ion current. That problem was solved by low sample sizes. Reducing the
amplifier resistance of the Faraday cup or isotope dilution are further alternatives.
The elemental analyser was calibrated with sulphanilic acid (C6H7NO2S, MW:
173.18 g mol−1, 41.6% C, 8.1% N, Merck KGaA) for C and N in the range of 0.1 to 20.0 mg,
and the mass spectrometer was calibrated with an IAEA secondary standard (L-glutamic acid
with δ13CVPDB = 26.39 (± 0.04)‰ and δ15NAIR N2 = –4.5 (± 0.1)‰, USGS 40, International
Atomic Agency, Vienna, Austria; Qi et al. 2003). The δ13C and δ15N values were referred to
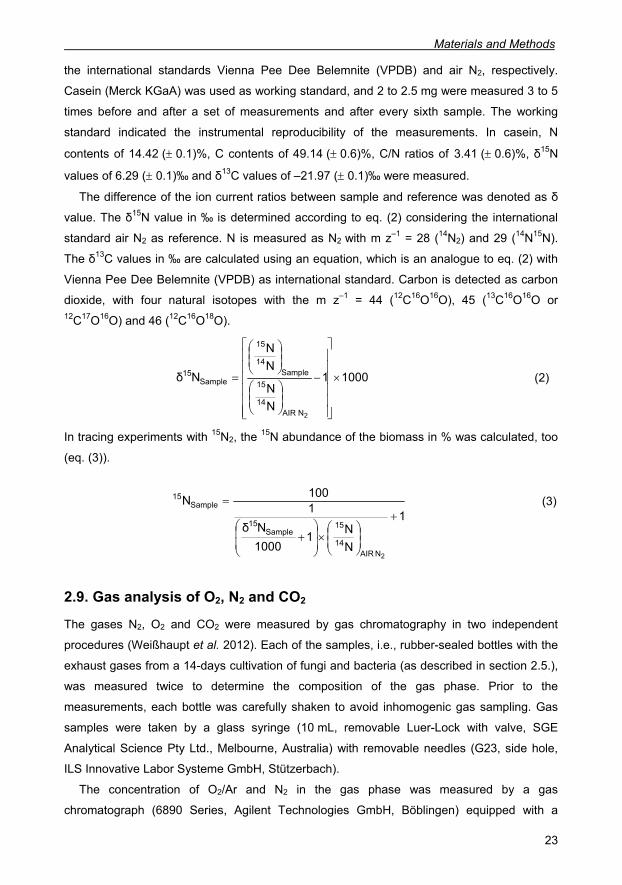
Materials and Methods
23
the international standards Vienna Pee Dee Belemnite (VPDB) and air N2, respectively.
Casein (Merck KGaA) was used as working standard, and 2 to 2.5 mg were measured 3 to 5
times before and after a set of measurements and after every sixth sample. The working
standard indicated the instrumental reproducibility of the measurements. In casein, N
contents of 14.42 (± 0.1)%, C contents of 49.14 (± 0.6)%, C/N ratios of 3.41 (± 0.6)%, δ15N
values of 6.29 (± 0.1)‰ and δ13C values of –21.97 (± 0.1)‰ were measured.
The difference of the ion current ratios between sample and reference was denoted as δ
value. The δ15N value in ‰ is determined according to eq. (2) considering the international
standard air N2 as reference. N is measured as N2 with m z–1 = 28 (14N2) and 29 (14N15N).
The δ13C values in ‰ are calculated using an equation, which is an analogue to eq. (2) with
Vienna Pee Dee Belemnite (VPDB) as international standard. Carbon is detected as carbon
dioxide, with four natural isotopes with the m z–1 = 44 (12C16O16O), 45 (13C16O16O or 12C17O16O) and 46 (12C16O18O).
10001
NN
NN
Nδ
2NAIR14
15Sample
14
15
Sample15 ×
⎥⎥⎥⎥⎥⎥
⎦
⎤
⎢⎢⎢⎢⎢⎢
⎣
⎡
−
⎟⎟⎠
⎞⎜⎜⎝
⎛
⎟⎟⎠
⎞⎜⎜⎝
⎛
= (2)
In tracing experiments with 15N2, the 15N abundance of the biomass in % was calculated, too
(eq. (3)).
1
NN1
1000Nδ
1100N
2N AIR14
15Sample
15
Sample15
+
⎟⎟⎠
⎞⎜⎜⎝
⎛×⎟⎟⎠
⎞⎜⎜⎝
⎛+
= (3)
2.9. Gas analysis of O2, N2 and CO2
The gases N2, O2 and CO2 were measured by gas chromatography in two independent
procedures (Weißhaupt et al. 2012). Each of the samples, i.e., rubber-sealed bottles with the
exhaust gases from a 14-days cultivation of fungi and bacteria (as described in section 2.5.),
was measured twice to determine the composition of the gas phase. Prior to the
measurements, each bottle was carefully shaken to avoid inhomogenic gas sampling. Gas
samples were taken by a glass syringe (10 mL, removable Luer-Lock with valve, SGE
Analytical Science Pty Ltd., Melbourne, Australia) with removable needles (G23, side hole,
ILS Innovative Labor Systeme GmbH, Stützerbach).
The concentration of O2/Ar and N2 in the gas phase was measured by a gas
chromatograph (6890 Series, Agilent Technologies GmbH, Böblingen) equipped with a

Materials and Methods
24 BAM-Dissertationsreihe
molecular-sieve column (molecular sieve, 60–80 mesh, 4 m, 1/8 inch, Perkin Elmer GmbH,
Rodgau) and a thermal conductivity detector. The analysis parameters were 20 min at 60 °C
with helium as carrier gas (Alphagaz 2, purity: 99.9999 vol.-%, AirLiquide). O2 and Ar were
not separable and measured as a single peak. The mean values and standard deviations of
three replicate samples were determined. The N2 as well as O2 measurement was calibrated
with air, and the abundances of the gases were given as ratio in vol.-%.
CO2 analysis was carried out with the same gas chromatograph equipped with a second
molecular-sieve column (GC Porapak R, 100–120 mesh, 2 m, 1/8 inch, Perkin Elmer). These
measurements were carried out at 60 °C and a total analysis time of 7 min. CO2 calibration
included the measurement of two reference gases containing 10.006 mol-% and 25.021 mol-
% CO2 in N2 (CRM No.: BAM-G050, BAM). A thermal conductivity detector (TCD) was
applied for the analysis of both measurements.
The ratio of N2 and O2 was applied to the difference between the CO2 concentration in
mol-% and 100 mol-%. With this calculation, the content of O2 and N2 in mol-% was
approximated. So, the sum of O2/Ar, N2 and CO2 amounted to 100 mol-%. This result allowed
comparing the experiments of the experimental plans.
2.10. Statistical analysis
2.10.1. Mean value and experimental standard deviation of the means All fungal or bacterial cultivations were conducted three times. Subsequently, the analysis of
biomass by IRMS or medium suspensions in enzyme tests included two or three replicates.
The arithmetical averages were determined for the replicate tests and replicate cultivations.
The experimental standard deviations of the means (SD) were calculated to reflect the
uncertainty of measurements and sample preparation. This particular standard deviation
does not correspond to the standard error of the means (SE), which is the experimental
standard deviation divided by n (for a detailed discussion see JCGM 100: 2008).
2.10.2. Two-way ANOVA, mean value comparison and linear approximation In the present study, it was of particular importance to find out if a measured difference was
significant. In most cases, two factors affected the measured values, and therefore, the two-
way analysis of variance (two-way ANOVA) was applied. The 0.05 level, which is the level
that includes 95% of the results of replicate measurements, was the criterion for significance
(Origin software, Additive GmbH, Friedrichsdorf). Parameters of growth curves of the fungal
biomass were determined by linear approximation of the measured biomass in a logarithmic
plot. The variability was tested by the coefficient of determination R² (Origin software).

Materials and Methods
25
2.10.3. Design of experiments DOE According to the four experimental plans (cultivation of O. placenta and T. versicolor at
different N sources and co-cultivation of O. placenta and T. versicolor with the diazotroph B.
acida), the indicators of fungal activity were measured in three independent replicate
measurements, i.e., 96 experiments = four experimental plans à eight experiments and three
replicates. Seven indicators of fungal activity were investigated, and mean values (y),
variances (v) and standard deviations (s) of the three replicates were determined. The
indicators of fungal activity were the biomass ( )1811 yy − , O2 ( )2821 yy − as well as CO2
content ( )3831 yy − in the gas phase, N content ( )4841 yy − , C content ( )5851 yy − and δ15N
value ( )6861 yy − of the biomass and finally the laccase activity ( )7871 yy − .
In addition, the mean value of the variances of the eight factor combinations of each
experimental plan was determined. The mean variances )(v were used to determine the
95% confidence intervals according to t-test recommendation. The mean standard deviation
was determined by equation (4), considering N = 24 samples (eight factor combinations,
three replicates) and a factor multiplicity of four (Kleppmann 2008).
2×4
= vN
sd (4)
For 16 degrees of freedom, t-factor tables recommend t = 2.21 according to the 95% criterion
(DIN 1319-3). The two sided confidence interval (ci) was calculated by equation (5).
stci ×= (5)
Since the effects on all indicators of fungal activity had to be considered, matrix notation was
useful. The result matrix Y had seven rows according to seven indicators and eight columns
for the results of the eight factor combinations (equation (6)).
(6)
⎟⎟⎟⎟⎟⎟⎟⎟⎟⎟
⎠
⎞
⎜⎜⎜⎜⎜⎜⎜⎜⎜⎜
⎝
⎛
=
7877767574737271
6867666564636261
5857565554535251
4847464544434241
3837363534333231
2827262524232221
1817161514131211
yyyyyyyyyyyyyyyyyyyyyyyyyyyyyyyyyyyyyyyyyyyyyyyyyyyyyyyy
Y

Materials and Methods
26 BAM-Dissertationsreihe
The matrix of factor combinations X (equation (7)) comprised the experimental plan in the
first three columns. The presence of the factors x1, x2 or x3 was indicated by 1 and absence
by –1. The interaction of the factors x1x2, x1x3, x2x3 and x1x2x3 were the linear combinations of
the factors from the same line and were listed in the columns 4 to 7. The last column allowed
the determination of the blank value or the indicator performance, which was not dependent
of the chosen influencing factors x1, x2 and x3 in equation (7). In column number eight, 1 is
replaced by 0.5 as the factor multiplicity amounts to eight instead of four.
⎟⎟⎟⎟⎟⎟⎟⎟⎟⎟⎟
⎠
⎞
⎜⎜⎜⎜⎜⎜⎜⎜⎜⎜⎜
⎝
⎛
−−−−−−−
−−−−−−−−−−
−−−−−−−−
−−−−
=
5.011111115.011111115.011111115.011111115.011111115.011111115.011111115.01111111
Χ
(7)
The effects of the influencing factors X on the indicators of fungal activity Y is calculated by
equation (8).
YX41
=A (8)
The factor 0.25 resulted from the factor multiplicity of four. A is the matrix of effects and
permitted an approximation of the indicator performance. All calculations regarding the 2³
experimental plans were implemented in Excel Software.

Results
27
3. Results
3.1. Wood decomposition by O. placenta and T. versicolor
Wood specimens were incubated with T. versicolor and O. placenta for ten months and
transferred once per month to new malt-extract medium. If wood of P. sylvestris (Fig. 5A)
was decomposed by O. placenta, the colour turned into dark brown and cracks right-angle to
the wood fibre appeared (Fig. 5B). Wood of F. sylvatica (Fig. 5C) displayed white rot after
decomposition by T. versicolor (Fig. 5D). The colour of the wood faded, and the structure
disintegrated. The types of wood rot can be distinguished by visual analysis.
Fig. 5: Wood and wood decomposed by fungi: (A) sapwood of P. sylvestris, (B) sapwood of P. sylvestris
decomposed by O. placenta, (C) sapwood of F. sylvatica, (D) sapwood of F. sylvatica decomposed by T.
versicolor.
3.2. Elemental analysis of medium compounds
Media preparations and compounds, which were used for cultivation of fungi and bacteria,
were investigated by IRMS (Tab. 4). The N contents of dry medium components allowed to
calculate the N contents in suspended media even if just N traces were prevalent (see also
Tab. 1). However, only the substances from the particular charges, which were used in this
study, were investigated, which means that the elemental composition of the same
compounds but from other sources, production lots or manufacturers can differ. Low amounts
of N were found in agar. If agar is amended to the medium, it is a source of N traces, and
isotope dilution in the cultivated biomass has to be expected. Therefore, agar-free medium
was favoured in experiments with subsequent isotope analysis. Yeast extract, which is a
component of RBA medium, comprised 11.16% N. Hence, agar-free RBA medium comprised
approximately 0.005 g L–1 N (see also Tab. 1).

Results
28 BAM-Dissertationsreihe
Tab. 4: Elemental composition, δ15N and δ13C values of dry media and medium compounds frequently
used for the cultivation of microorganisms (n = 3, mean values ± SD).
Medium compounds
N
in %
C
in %
S
in %
C/N δ15NAIR N2
in ‰
δ13CVPDB
in ‰
Gelatine 17.07 (± 0.1)
44.40 (± 0.7)
0.33 (± 0.3)
2.60 (± 0.1)
4.47 (± 0.1)
–21.58 (± 0.1)
Peptone from casein 15.36 (± 0.1)
44.22 (± 0.4)
1.39 (± 0.5)
2.88 (± 0.1)
4.56 (± 0.1)
–27.25 (± 0.1)
Casein (Hammarsten) 14.88 (± 0.1)
49.92 (± 0.2)
0.08 (± 0.1)
3.35 (± 0.1)
5.96 (± 0.1)
–22.19 (± 0.1)
Lab Lemco Broth 13.62 (± 0.1)
40.86 (± 0.1)
0.17 (± 0.1)
3.00 (± 0.1)
5.42 (± 0.1)
–14.55 (± 0.1)
Meat extract 12.38 (± 0.1)
40.95 (± 0.4)
0.32 (± 0.2)
3.31 (± 0.1)
3.76 (± 0.1)
–25.28 (± 0.1)
Yeast extract 11.16 (± 0.1)
40.73 (± 0.3)
0.37 (± 0.1)
3.65 (± 0.1)
–0.71 (± 0.1)
–25.27 (± 0.1)
Peptone from meat 10.87 (± 3.0)
34.97 (± 9.6)
0.58 (± 0.1)
3.22 (± 0.1)
16.40 (± 11.3)
–22.93 (± 0.1)
Peptone from soy 10.34 (± 0.1)
40.74 (± 1.4)
1.14 (± 0.4)
3.94 (± 0.1)
6.46 (± 7.0)
–24.27 (± 0.1)
Caseinpeptone lecithin polysorbat B
10.51 (± 0.2)
48.03 (± 0.2)
0.14 (± 0.1)
4.57 (± 0.1)
5.54 (± 0.1)
–27.61 (± 0.1)
Tryptone soy broth 7.71 (± 0.3)
29.99 (± 1.3)
0.27 (± 0.2)
3.89 (± 0.1)
1.58 (± 0.1)
–23.57 (± 0.1)
Tryptone soy agar 6.23 (± 0.3)
37.10 (± 1.3)
0.18 (± 0.2)
5.96 (± 0.1)
1.65 (± 0.1)
–22.30 (± 0.1)
Standard medium 5.40 (± 0.2)
34.27 (± 0.8)
0.41 (± 0.1)
6.35 (± 0.1)
1.94 (± 0.3)
–22.42 (± 0.1)
Malt extract agar 1.61 (± 0.1)
41.02 (± 0.1)
0.13 (± 0.1)
25.45 (± 0.3)
0.83 (± 0.1)
–16.63 (± 0.1)
Malt extract 1.41 (± 0.1)
40.48 (± 0.5)
0.09 (± 0.2)
28.79 (± 1.3)
0.68 (± 0.7)
–20.60 (± 0.1)
Potato glucose agar 0.83 (± 0.1)
37.59 (± 1.2)
0.10 (± 0.1)
45.13 (± 1.1)
–0.30 (± 0.4)
–17.22 (± 0.1)
Agar 0.28 (± 0.1)
41.21 (± 0.2)
0.34 (± 0.1)
144.7 (± 1.1)
4.20 (± 0.6)
–18.96 (± 0.1)
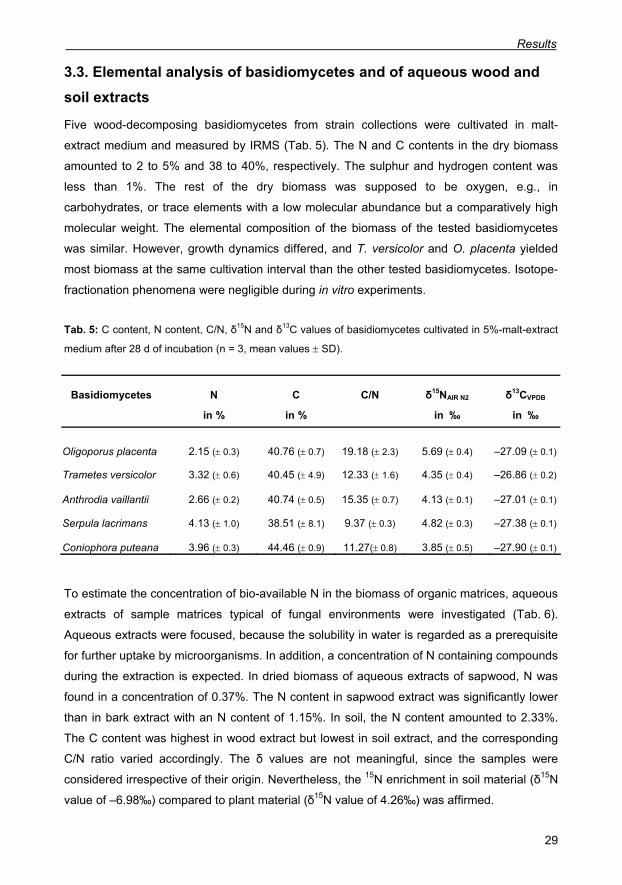
Results
29
3.3. Elemental analysis of basidiomycetes and of aqueous wood and soil extracts
Five wood-decomposing basidiomycetes from strain collections were cultivated in malt-
extract medium and measured by IRMS (Tab. 5). The N and C contents in the dry biomass
amounted to 2 to 5% and 38 to 40%, respectively. The sulphur and hydrogen content was
less than 1%. The rest of the dry biomass was supposed to be oxygen, e.g., in
carbohydrates, or trace elements with a low molecular abundance but a comparatively high
molecular weight. The elemental composition of the biomass of the tested basidiomycetes
was similar. However, growth dynamics differed, and T. versicolor and O. placenta yielded
most biomass at the same cultivation interval than the other tested basidiomycetes. Isotope-
fractionation phenomena were negligible during in vitro experiments.
Tab. 5: C content, N content, C/N, δ15N and δ13C values of basidiomycetes cultivated in 5%-malt-extract
medium after 28 d of incubation (n = 3, mean values ± SD).
Basidiomycetes N
in %
C
in %
C/N δ15NAIR N2
in ‰
δ13CVPDB
in ‰
Oligoporus placenta 2.15 (± 0.3) 40.76 (± 0.7) 19.18 (± 2.3) 5.69 (± 0.4) –27.09 (± 0.1)
Trametes versicolor 3.32 (± 0.6) 40.45 (± 4.9) 12.33 (± 1.6) 4.35 (± 0.4) –26.86 (± 0.2)
Anthrodia vaillantii 2.66 (± 0.2) 40.74 (± 0.5) 15.35 (± 0.7) 4.13 (± 0.1) –27.01 (± 0.1)
Serpula lacrimans 4.13 (± 1.0) 38.51 (± 8.1) 9.37 (± 0.3) 4.82 (± 0.3) –27.38 (± 0.1)
Coniophora puteana 3.96 (± 0.3) 44.46 (± 0.9) 11.27(± 0.8) 3.85 (± 0.5) –27.90 (± 0.1)
To estimate the concentration of bio-available N in the biomass of organic matrices, aqueous
extracts of sample matrices typical of fungal environments were investigated (Tab. 6).
Aqueous extracts were focused, because the solubility in water is regarded as a prerequisite
for further uptake by microorganisms. In addition, a concentration of N containing compounds
during the extraction is expected. In dried biomass of aqueous extracts of sapwood, N was
found in a concentration of 0.37%. The N content in sapwood extract was significantly lower
than in bark extract with an N content of 1.15%. In soil, the N content amounted to 2.33%.
The C content was highest in wood extract but lowest in soil extract, and the corresponding
C/N ratio varied accordingly. The δ values are not meaningful, since the samples were
considered irrespective of their origin. Nevertheless, the 15N enrichment in soil material (δ15N
value of –6.98‰) compared to plant material (δ15N value of 4.26‰) was affirmed.

Results
30 BAM-Dissertationsreihe
Tab. 6: Elemental analysis and δ15N and δ13C values of wood, bark and soil extract samples (n = 3: three
measurements of biomass from one extraction, mean values ± SD).
Organic sample
N
in %
C
in %
C/N δ 15N AIR N2
in ‰
δ 13C VPDB
in ‰
Pine wood extract
0.37 (± 0.1) 49.48 (± 0.5) 133.73 (± 10.5) nm 1) –25.74 (± 0.1)
Birch bark extract
1.18 (± 0.1) 43.08 (± 0.4) 36.51 (± 0.2) 4.26 (± 0.4) –26.48 (± 0.1)
Soil extract 2.33 (± 0.1) 15.69 (± 0.3) 6.73 (± 0.2) –6.98 (± 0.2) –26.19 (± 0.1)
1) nm: not measurable, value below the detection limit
3.4. Nitrogen uptake of O. placenta, T. versicolor and H. fasciculare
The brown-rot fungus O. placenta and the white-rot fungus T. versicolor were cultivated on
RBA medium amended with 10 mM N from urea, NH4Cl, NaNO3 or without additional N
(Weißhaupt et al. 2011). Interestingly, both of the tested basidiomycetes developed a low
amount of biomass in medium without N addition. Therefore, efficient uptake of N traces was
assumed. In RBA medium, the medium component yeast extract may be the source for N
traces. On NaNO3, the growth rates were low compared to other N-enriched media, and
therefore, NaNO3 was regarded as a non-favourite N substrate for both fungi. In the
presence of urea or NH4Cl, T. versicolor produced more biomass compared to cultivation on
RBA without N addition. O. placenta had a similar biomass production over time at all tested
N sources (Fig. 6).
Fig. 6: Biomass of O. placenta and T. versicolor cultivated on RBA amended with 10 mM N of urea (▲),
NH4Cl (○), NaNO3 (∆) or deionised water as reference cultivation (●). Linear approximations of the
measured values are indicated.

Results
31
To test the effect of yeast extract, the previously mentioned set of experiments was repeated
with RBA that contained no yeast extract. While T. versicolor did not grow after 70 d of
incubation, biomass of O. placenta developed very weak on all added N substrates but also
in the N-free control culture (data not shown).
In addition to the biomass itself (Fig. 6), the elemental composition of the fungal biomass
was measured after 14 and 28 d of cultivation (Tab. 7). The C content was almost constant at
all cultivations and in both fungi. The N content of the mycelia of both fungi was lower if they
were cultivated on RBA instead of a medium containing bio-available N. These results
underlined that both basidiomycetes adjusted their metabolism to N-limited conditions, which
was also mirrored in the C/N ratios. In addition, the N content decreased over time (compare
the N contents after 14 and 28 d), indicating N-limitation after prolonged cultivation.
Tab. 7: C content, N content, C/N, δ15N and δ13C values of biomass of O. placenta and T. versicolor
cultivated at different N substrates (n = 3, mean values ± SD).
O. placenta T. versicolor
N in %
C in %
C/N δ15NAIR N2
in ‰
δ13CVPDB in ‰
N in %
C in %
C/N δ15NAIR N2
in ‰
δ13CVPDB in ‰
N substrate 1)
14 d of incubation 14 d of incubation
N traces –0.71 (± 0.01)
1.66 (± 0.1)
35.70 (± 0.9)
21.51 (± 3.1)
–0.05 (± 0.1)
–16.14 (± 0.2)
1.75 (± 0.4)
41.17 (± 0.9)
23.53 (± 5.3)
–0.40 (± 0.4)
–16.02 (± 0.3)
urea 2.55 (± 0.01)
2.98 (± 0.1)
36.81 (± 0.7)
12.35 (± 0.4)
1.29 (± 2.0)
–15.53 (± 0.1)
3.26 (± 0.9)
41.18 (± 1.4)
12.63 (± 3.2)
1.60 (± 1.1)
–13.93 (± 0.5)
NH4Cl –0.59 (± 0.1)
2.79 (± 0.2)
38.53 (± 1.6)
13.81 (± 0.4)
–2.89 (± 0.5)
–15.84 (± 0.1)
4.61 (± 0.5)
41.04 (± 0.8)
8.09 (± 0.9)
–4.48 (± 0.1)
–13.08 (± 0.3)
NaNO3 1.39 (± 0.4)
2.20 (± 0.4)
34.95 (± 0.6)
15.89 (± 2.3)
–1.71 (± 0.2)
–16.04 (± 0.2)
1.99 (± 0.3)
40.51 (± 0.7)
20.36 (± 3.4)
–1.90 (± 0.2)
–15.81 (± 0.3)
28 d of incubation 28 d of incubation
N traces –0.71 (± 0.01)
0.98 (± 0.3)
36.01 (± 1.1)
36.74 (± 9.7)
–0.12 (± 0.3)
–15.92 (± 0.2)
0.56 (± 0.5)
36.17 (± 0.8)
64.59 (± 5.8)
0.23 (± 1.0)
–16.12 (± 0.4)
urea 2.55 (± 0.01)
2.47 (± 1.0)
36.87 (± 0.4)
14.93 (±10.6)
1.97 (± 1.9)
–15.43 (± 0.1)
2.48 (± 0.4)
39.03 (± 1.4)
15.74 (± 3.0)
3.10 (± 1.1)
–12.95 (± 0.6)
NH4Cl –0.59 (± 0.1)
2.18 (± 0.2)
36.63 (± 0.4)
16.80 (± 1.7)
–0.88 (± 1.0)
–15.62 (± 0.1)
2.82 (± 0.3)
39.75 (± 0.5)
14.10 (± 1.2)
–0.22 (± 0.9)
–13.39 (± 0.2)
NaNO3 1.39 (± 0.4)
1.82 (± 0.4)
34.73 (± 0.5)
19.08 (± 4.2)
–2.22 (± 0.6)
–16.10 (± 0.2)
1.79 (± 0.3)
37.03 (± 1.5)
20.69 (± 3.6)
–2.23 (± 0.1)
–15.24 (± 0.2)
1) Amended N substrates in RBA were adjusted to 10 mM N. The δ15N values of the amended N substrates and N traces are listed below.

Results
32 BAM-Dissertationsreihe
The δ15N values of the basidiomycetal biomass, after growth on the respective substrates,
and the substrates prior usage were measured and compared. The δ15N values of the
biomass were very similar to those of the respective N source. However, the uptake of the
source cannot be approved, since the differences in the δ15N values among the biomass of
different cultivations were not significant. If the δ15N values of the biomass differed from the N
substrates (Tab. 7), this difference indicated that a mix of N sources from urea or ammonia
and yeast extract from the RBA were metabolised.
The white-rot fungus H. fasciculare was also cultivated on different N sources. Biomass
production of H. fasciculare was significantly enhanced by urea or NH4Cl but not by NaNO3
(Fig. 7). Biomass formation was consistent with exponential growth. In RBA medium, a low
amount of biomass was produced. Growth curves of H. fasciculare in RBA without and with
NaNO3 amendment were visually identical after linear approximation (Fig. 7).
Fig. 7: Biomass of H. fasciculare cultivated on RBA amended with 10 mM N from urea (▲), NH4Cl (○),
NaNO3 (∆) or deionised water as reference cultivation (●). Linear approximations of the measured values
are indicated.
The elemental composition of biomass cultivated with different N sources showed that the
N content increased if urea or NH4Cl was fed. The C content increased as well but to a lower
extent. Accordingly, the C/N ratio decreased (Tab. 8). Unlike NaNO3, the presence of urea
and NH4Cl in the medium significantly affected the N contents, C contents, C/N ratios and
δ15N values in fungal biomass. The effect of the incubation time between the interval of 28
and 56 d was marginal for all N sources.
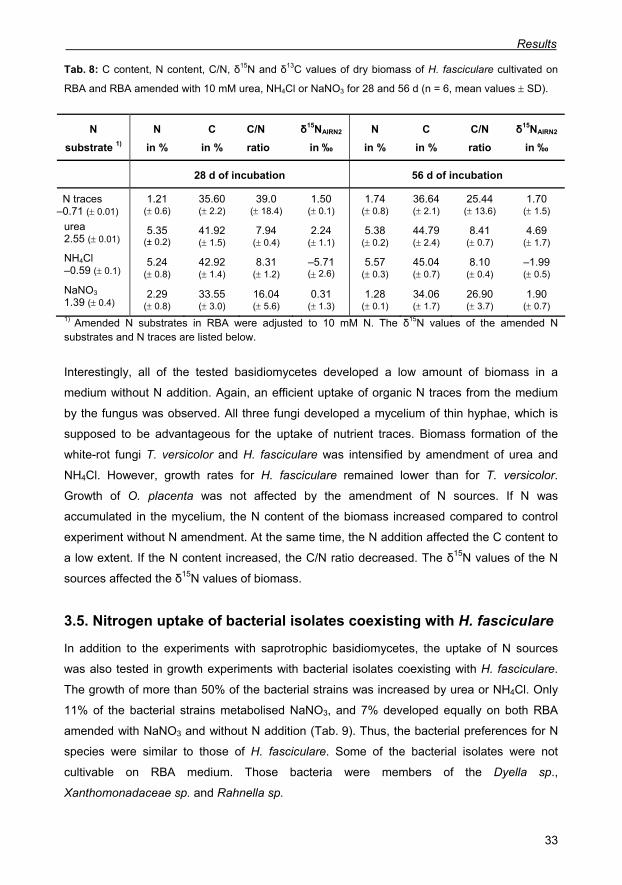
Results
33
Tab. 8: C content, N content, C/N, δ15N and δ13C values of dry biomass of H. fasciculare cultivated on
RBA and RBA amended with 10 mM urea, NH4Cl or NaNO3 for 28 and 56 d (n = 6, mean values ± SD).
1) Amended N substrates in RBA were adjusted to 10 mM N. The δ15N values of the amended N substrates and N traces are listed below.
Interestingly, all of the tested basidiomycetes developed a low amount of biomass in a
medium without N addition. Again, an efficient uptake of organic N traces from the medium
by the fungus was observed. All three fungi developed a mycelium of thin hyphae, which is
supposed to be advantageous for the uptake of nutrient traces. Biomass formation of the
white-rot fungi T. versicolor and H. fasciculare was intensified by amendment of urea and
NH4Cl. However, growth rates for H. fasciculare remained lower than for T. versicolor.
Growth of O. placenta was not affected by the amendment of N sources. If N was
accumulated in the mycelium, the N content of the biomass increased compared to control
experiment without N amendment. At the same time, the N addition affected the C content to
a low extent. If the N content increased, the C/N ratio decreased. The δ15N values of the N
sources affected the δ15N values of biomass.
3.5. Nitrogen uptake of bacterial isolates coexisting with H. fasciculare
In addition to the experiments with saprotrophic basidiomycetes, the uptake of N sources
was also tested in growth experiments with bacterial isolates coexisting with H. fasciculare.
The growth of more than 50% of the bacterial strains was increased by urea or NH4Cl. Only
11% of the bacterial strains metabolised NaNO3, and 7% developed equally on both RBA
amended with NaNO3 and without N addition (Tab. 9). Thus, the bacterial preferences for N
species were similar to those of H. fasciculare. Some of the bacterial isolates were not
cultivable on RBA medium. Those bacteria were members of the Dyella sp.,
Xanthomonadaceae sp. and Rahnella sp.
N substrate 1)
N in %
C in %
C/N ratio
δ15NAIRN2 in ‰
N in %
C in %
C/N ratio
δ15NAIRN2 in ‰
28 d of incubation 56 d of incubation
N traces –0.71 (± 0.01)
1.21 (± 0.6)
35.60 (± 2.2)
39.0 (± 18.4)
1.50 (± 0.1)
1.74 (± 0.8)
36.64 (± 2.1)
25.44 (± 13.6)
1.70 (± 1.5)
urea 2.55 (± 0.01)
5.35 (± 0.2)
41.92 (± 1.5)
7.94 (± 0.4)
2.24 (± 1.1)
5.38 (± 0.2)
44.79 (± 2.4)
8.41 (± 0.7)
4.69 (± 1.7)
NH4Cl –0.59 (± 0.1)
5.24 (± 0.8)
42.92 (± 1.4)
8.31 (± 1.2)
–5.71 (± 2.6)
5.57 (± 0.3)
45.04 (± 0.7)
8.10 (± 0.4)
–1.99 (± 0.5)
NaNO3 1.39 (± 0.4)
2.29 (± 0.8)
33.55 (± 3.0)
16.04 (± 5.6)
0.31 (± 1.3)
1.28 (± 0.1)
34.06 (± 1.7)
26.90 (± 3.7)
1.90 (± 0.7)
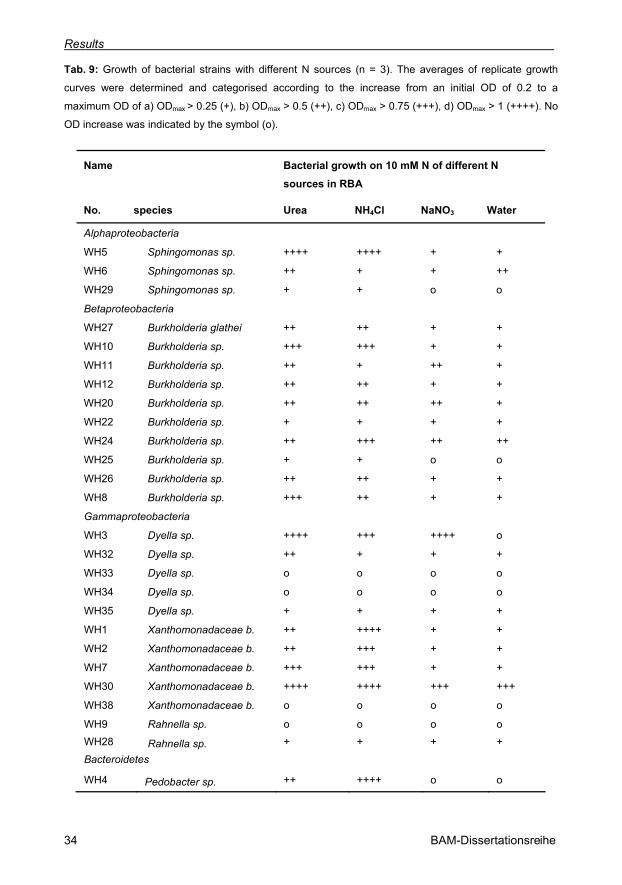
Results
34 BAM-Dissertationsreihe
Tab. 9: Growth of bacterial strains with different N sources (n = 3). The averages of replicate growth
curves were determined and categorised according to the increase from an initial OD of 0.2 to a
maximum OD of a) ODmax > 0.25 (+), b) ODmax > 0.5 (++), c) ODmax > 0.75 (+++), d) ODmax > 1 (++++). No
OD increase was indicated by the symbol (o).
Name Bacterial growth on 10 mM N of different N sources in RBA
No. species Urea NH4Cl NaNO3 Water
Alphaproteobacteria
WH5 Sphingomonas sp. ++++ ++++ + +
WH6 Sphingomonas sp. ++ + + ++
WH29 Sphingomonas sp. + + o o
Betaproteobacteria
WH27 Burkholderia glathei ++ ++ + +
WH10 Burkholderia sp. +++ +++ + +
WH11 Burkholderia sp. ++ + ++ +
WH12 Burkholderia sp. ++ ++ + +
WH20 Burkholderia sp. ++ ++ ++ +
WH22 Burkholderia sp. + + + +
WH24 Burkholderia sp. ++ +++ ++ ++
WH25 Burkholderia sp. + + o o
WH26 Burkholderia sp. ++ ++ + +
WH8 Burkholderia sp. +++ ++ + +
Gammaproteobacteria
WH3 Dyella sp. ++++ +++ ++++ o
WH32 Dyella sp. ++ + + +
WH33 Dyella sp. o o o o
WH34 Dyella sp. o o o o
WH35 Dyella sp. + + + +
WH1 Xanthomonadaceae b. ++ ++++ + +
WH2 Xanthomonadaceae b. ++ +++ + +
WH7 Xanthomonadaceae b. +++ +++ + +
WH30 Xanthomonadaceae b. ++++ ++++ +++ +++
WH38 Xanthomonadaceae b. o o o o
WH9 Rahnella sp. o o o o WH28 Rahnella sp. + + + +
Bacteroidetes
WH4 Pedobacter sp. ++ ++++ o o

Results
35
3.6. N2 fixation by A. croococcum, B. acida and N. nitrogenifigens as well as bacterial isolates coexisting with H. fasciculare
The diazotrophs A. croococcum, B. acida and N. nitrogenifigens (Weißhaupt et al. 2011) as
well as the bacteria coexisting with H. fasciculare were cultivated on solid RBA medium and
on recommended media (Tab. 1) under air and under a 15N2/O2 atmosphere (Figs. 8 to 11).
A. croococcum was cultivated on RBA as well as on Azotobacter medium (Fig. 8). Under
all conditions, the bacteria developed separated, round colonies. The N content of the dry
bacterial biomass was in both media and under both atmospheres approximately 10% with a
C/N ratio of 4 to 5. Under air, the 15N abundance was in the range of the natural 15N
abundance. If the bacterium was cultivated under a gas mixture of 15N2/O2, the 15N
abundance in the bacterial biomass was 12 to 13%, indicating bacterial fixation of N2. The
effect of the gas atmosphere on the 15N abundance in the bacterial biomass was significant
(see ANOVA in Fig. 8). The effects of medium, gas atmosphere and the combination of both
on C/N and N content of the biomass were not significant. The diazotrophic activity of A.
croococcum was approved, and effects of the medium on the biomass were not detected.
Azotobacter medium and RBA medium were supposed to comprise a similar amount of N
traces (Tab. 3).
Fig. 8: C/N ratio (grey), N content in % (m/m) (dark grey) and 15N abundance in % (black) in biomass of
A. croococcum after 14 d of incubation (n = 9, mean values ± SD). The results of the two-way ANOVA
are given in the table.
ANOVA
F P 0.05 level
C/N Medium 1.6 0.23 Not sig. Atmosphere 2.1 0.17 Not sig. Combination 1.4 0.25 Not sig. N content Medium 0.31 0.58 Not sig. Atmosphere 2 × 10⁻⁴ 0.99 Not sig. Combination 3.5 0.09 Not sig. 15N abundance Medium 0.05 0.83 Not sig. Atmosphere 81.9 1.04 Sig. Combination 0.05 0.84 Not sig.

Results
36 BAM-Dissertationsreihe
B. acida was cultivated on Beijerinckia medium and on RBA medium (Fig. 9). On both media
and under both atmospheres, it developed a sort of mucilage that covered the entire
mediums’ surface. On RBA medium, B. acida developed a biomass with an N content of 7 to
8%, and on Beijerinckia medium the bacterial biomass had an N content of 3 to 4%. The 15N
abundance in biomass produced under 15N2/O2 atmosphere was 7 to 9% indicating a
significant fixation of atmospheric N2. However, the fixation rates were lower than at A.
croococcum cultivated under 15N2/O2. The effects of the medium on the C/N ratio, the N
content and the 15N abundance were significant. Besides, the combination of medium and
atmosphere also affected the C/N ratio, N content and δ15N value. However, the effect of the
atmosphere on the C/N ratio was not significant. The diazotrophic activity of B. acida was
approved, and an effect of the medium was detected. Beijerinckia medium was supposed to
contain less N traces than RBA (Tab. 3).
ANOVA
F P 0.05 level
C/N Medium 315.2 5.6 ×10⁻¹⁰ Sig.
Atmosphere 0.006 0.938 Not sig.
Combination 18.06 0.001 Sig.
N content Medium 171.7 1.8 ×10⁻⁸ Sig. Atmosphere 9.42 0.01 Sig. Combination 21.23 6.0 ×10⁻⁴ Sig. 15N abundance Medium 13.52 3.6 ×10⁻³ Sig. Atmosphere 511.4 3.3 ×10⁻¹¹ Sig. Combination 13.54 3.5 ×10⁻³ Sig.
Fig. 9: C/N ratio (grey), N content in % (m/m) (dark grey) and 15N abundance in % (black) in biomass of
B. acida after 14 d of incubation (n = 9, mean values ± SD). The results of the two-way ANOVA are given
in the table.
N. nitrogenifigens was cultivated on RBA and nutrient medium (Fig. 10). In cultivation
experiments, N. nitrogenifigens had a higher N content if it was cultivated on nutrient medium
than on RBA. The N content in the bacterial biomass amounted to 10 to 12% and 4% on
nutrient medium and on RBA, respectively. If the biomass of N. nitrogenifigens was cultivated
on RBA medium and under a gas mixture of 15N2/O2, the 15N abundance in the bacterium
was generally less than 2%. If nutrient medium was applied instead of RBA, the 15N
abundance increased only to 0.38%. The effect of the medium was significant on the C/N
ratio and the 15N abundance in the biomass. The atmosphere affected the N content and the

Results
37
15N abundance but not the C/N ratio. Nutrient medium contained approximately 1.1 g L–1 N
from organic sources (Tab. 3).
ANOVA
F P 0.05 level
C/N Medium 1071.45 4.2×10⁻³ Sig.
Atmosphere 2.89 0.115 Not sig.
Combination 14.44 0.003 Sig. N content Medium 920.02 1.1×10⁻¹² Sig. Atmosphere 8.90 0.011 Sig. Combination 13.62 0.003 Sig. 15N abundance Medium 44.88 2.2×10⁻⁵ Sig. Atmosphere 50.20 1.3×10⁻⁵ Sig. Combination 45.60 2.1×10⁻⁵ Sig.
Fig. 10: C/N ratio (grey), N content in % (m/m) (dark grey) and 15N abundance in % (black) in biomass of
N. nitrogenifigens after 14 d of incubation (n = 9, mean values ± SD). The results of the two-way ANOVA
are given in the table.
IRMS results confirmed that all tested diazotrophs fixed atmospheric N2, although their
fixation rates differed depending on species and media. None of the bacteria assimilated
100% of its N content from the gas atmosphere. Therefore, the availability of additional N
sources is essential for the growth of diazotrophic bacteria. Traces of N in the medium can
provide enough initial N for the growth of diazotrophs. In addition, at higher concentrations of
organic N, such as in nutrient medium, the N2-fixation activity is inhibited. In situ,
environmental conditions and particularly N concentrations determine bacterial N2 fixation.
Similar to the diazotrophic bacteria, bacterial isolates coexisting with H. fasciculare were
cultivated on RBA and on TSB medium under 15N2/O2 atmosphere and under air (Fig. 11).
The N contents of bacterial biomass cultivated on TSB medium (N concentration of the
medium of 0.33 g L–1) differed significantly from the N content in bacterial biomass cultivated
on RBA medium (N concentration of the medium of 0.05 g L–1). The N contents amounted to
1 to 8% and 7 to 13% on RBA and TSB, respectively. The effect of the medium on the N
content in the bacterial biomass was significant.

Results
38 BAM-Dissertationsreihe
The δ15N values of bacterial biomass were significantly affected by the 15N2/O2 atmosphere.
This was found on both media but the effect was more pronounced if RBA and 15N2/O2
atmosphere were combined (Fig. 11). Nevertheless, the δ15N values had a maximum of 30‰
for the majority of the bacteria, and diazotrophic activity was low compared to the previous
results (Figs. 8 to 10). Exceptionally, the δ15N values of some isolates affiliated to the
Betaproteobacteria, i.e., Burkholderia sp. WH 11, WH 12 and WH 8, were enhanced to
values above 40‰ in case of cultivation on RBA under 15N2/O2 atmosphere. The effects of
the atmosphere and the combination of atmosphere and medium were significant.
Fig. 11: N contents and δ15N values of biomass of bacterial isolates coexisting with H. fasciculare. The
27 bacteria were cultivated on RBA and on TSB under air and under a 15N2/O2 atmosphere (n = 1).
Significances of the effects of medium and 15N2/O2 treatment were calculated by two-way ANOVA (0.05
level).
If the bacteria were cultivated on TSB medium, the variance of the N content as well as the
δ15N value of some bacteria were remarkably low (triangles in Fig. 11). Bacteria, which were
characterised by high N contents of 10 to 13% and average δ15N values from 0 to 10 ‰,
were predominantly affiliated to the Gammaproteobacteria (WH 32, WH 33, WH 34, WH 1,
WH 28, WH 38 and WH 9) and to Sphingomonas sp. and Burkholderia sp. (WH 6, WH 11
and WH 12). Interestingly, the δ15N values increased less if the bacteria were cultivated on

Results
39
TSB. Obviously, the presence of N in the medium suppressed the 15N2 fixation. On RBA
medium, most of the bacteria suffered from N limitation and produced a biomass with a
reduced N content. Most of the bacteria adsorbed 15N2 particularly at N-limited conditions.
3.7. N2 fixation of bacteria in co-cultivation with basidiomycetes
Bacterial N2 fixation and the N transfer to fungi were tested by co-cultivating O. placenta
(Tab. 10, A) and T. versicolor (Tab. 11, A) with each of the diazotrophs A. croococcum (B), B.
acida (C) and N. nitrogenifigens (D) under air and under a 15N2/O2 atmosphere. The
cultivations proceeded on RBA medium without additional N or C sources. This medium was
chosen to provide optimal conditions for bacterial N2 fixation. These conditions include the
presence of trace-elements and the absence of N sources. After cultivation, fungal biomass
was recoverable at all co-cultivations and yielded enough biomass for IRMS measurements.
Biomass of A. croococcum and of N. nitrogenifigens was difficult to recover, whereas
biomass of B. acida was found at high abundances in both co-cultivations (Tabs. 10 and 11;
Weißhaupt et al. 2011).
Firstly, O. placenta was cultivated alone (A) and with each of the bacteria (B, C and D)
under air and under 15N2/O2 atmosphere (Tab. 10). The fungal biomass amounted 6.3 to
15.8 mg in 20 mL cultivation medium cultivated for 21 d. In all co-cultivations, more fungal
than bacterial biomass was harvested, and the bacterial biomass of A. croococcum and N.
nitrogenifigens was low compared to the biomass of B. acida. The last mentioned bacterium
was able to compete with O. placenta, and the bacterium reduced the biomass of O. placenta
compared to cultivations without bacteria.
In all co-cultivations with O. placenta, the fungal biomass had a remarkable low N content
(Tab. 10). In the biomass of O. placenta, the N content was lower than in biomass from
cultivations on medium which contained an N source, e.g., malt-extract, urea, NH4Cl (Tabs. 5
and 7). The presence of bacteria affected the fungal N content to a low extent. The N content
in bacterial biomass was between 2 and 2.5% and between 7 and 9% in the biomass of A.
croococcum (B) as well as N. nitrogenifigens (D) and B. acida (C), respectively.
The δ15N values in fungal and bacterial biomass were increased at cultivations under a 15N2/O2 atmosphere compared to air (Tab. 10). However, in biomass of O. placenta, A. croo-
coccum and N. nitrogenifigens the δ15N values increased only to a low extent (Tab. 10, A, B
and D). In biomass of B. acida and O. placenta in co-cultivation, the δ15N values increased
significantly, which indicated 15N2 fixation and transfer into fungal biomass (Tab. 10, C).
In addition to the δ15N values, the 15N abundances were calculated (Tab. 10). In most
samples, the 15N abundance amounted to 0.37% and just increased the natural 15N
abundance to a low extent. If O. placenta and B. acida were co-cultivated under 15N2/O2

Results
40 BAM-Dissertationsreihe
atmosphere, the 15N abundance amounted to 9 and 13.5%, respectively (C). 15N uptake and
transfer to the fungus was approved.
Tab. 10: Co-cultivations of O. placenta and N2-fixing bacteria on RBA medium under air and under 15N2/O2 atmosphere. Fungal control cultures (A) and consecutively listed pairs of organisms (B, C and D)
were co-cultivated under the gas atmosphere outlined. The results are the biomass per batch after
separation and the results of the IRMS analysis (n = 3, mean values ± SD).
Gas
atmosphere
Organism Biomass in
mg (20 mL)–1
N content
in %
δ15N AIR N2
in ‰
15N abundance
in %
A air O. placenta 7.43 (± 0.5) 0.16 (± 0.01) 3.21 (± 2,3) 0.37 (± 3·10–3) 15N2/O2 O. placenta 13.10 (± 2.4) 0.06 (± 0.002) 8.66 (± 6.0) 0.37 (± 2·10–3) B air O. placenta 8.70 (± 0.7) 0.48 (± 0.3) 5.54 (± 4.8) 0.37 (± 2·10–3) A. croococcum 8.50 (± 0.3) 2.05 (± 0.12) 4.76 (± 2.1) 0.37 (± 1·10–3) 15N2/O2 O. placenta 9.10 (± 0.0) 1.03 (± 0.71) 362.8 (± 283.2) 0.50 (± 0.1) A. croococcum 1.40 1) 2.83 1) 56.79 1) 0.36 1) C air O. placenta 7.17 (± 0.3) 0.29 (± 0.07) 6.09 (± 2.1) 0.37 (± 0.01) B. acida 13.47 (± 1.4) 7.04 (± 0.63) –0.19 (± 2.1) 0.37 (± 3·10–5) 15N2/O2 O. placenta 6.3 (± 0.5) 0.27 (± 0.15) 26335.50
(± 9664.7) 9.13 (± 2.9)
B. acida 12.67 (± 1.4) 9.14 (± 1.16) 40989.26 (± 7376.8)
13.37 (± 2.1)
D air O. placenta 8.75 (± 0.1) 0.46 (± 0.2) 14.86 (± 1.6) 0.37 (± 1·10–3) N. nitrogenifigens 2.55 (± 0.1) 1.71 (± 0.1) 13.24 (± 4.0) 0.37 (± 1·10–3) 15N2/O2 O. placenta 15.83 (± 1.6) 2.34 (± 0.4) 241.6 (± 137.5) 0.45 (± 0.1) N. nitrogenifigens too less biomass for a measurement
1) The biomass from three cultivations was collected for a single measurement. Secondly, T. versicolor was co-cultivated with each of the bacteria under air and under 15N2/O2 atmosphere (Tab. 11). The fungal biomass amounted to 6.3 to 16.8 mg in 20 mL
cultivation medium at comparatively high standard deviations similar to experiments with O.
placenta. The bacterial biomass of A. croococcum (Tab. 11, B) and N. nitrogenifigens (0.5 to
6.3 mg (20 mL)–1; B and D) was low compared to biomass of B. acida (11.1 to
13.8 mg (20 mL)–1; C).
The N content in biomass of T. versicolor was particularly low compared to cultivations at
non-limited conditions (see results in sections 3.3. and 3.4.). The bacterial N content was
usually higher than the fungal N content (Tab. 11 B, C, D), but low compared to pure
bacterial cultivations (see results in section 3.6.). This result may indicate N limitations
regarding bacterial growth. The highest N contents were found in biomass of B. acida (C).
If the cultivations proceeded under 15N2/O2 atmosphere, the δ15N value in the biomass
increased compared to cultivations under air. The δ15N value just increased to a low extent in
co-cultivations with A. croococcum (Tab. 11, B) and N. nitrogenifigens (Tab. 11, D). A

Results
41
significant increase of the δ15N value was found in co-cultivation with B. acida and included
fungal and bacterial biomass. So, N2 fixation and transfer into fungal biomass was approved
for B. acida but not for the other diazotrophs.
If the 15N abundance was calculated, 12.5 to 13.1% of the total N in the biomass of B.
acida and T. versicolor, respectively, was initially fixed from 15N2 (Tab. 11, C). The 15N
abundances increased only to a low extent in the other co-cultivations under 15N2/O2
atmosphere (Tab. 11, B and D).
Tab. 11: Co-cultivations of T. versicolor and N2-fixing bacteria on RBA medium under air and under 15N2/O2 atmosphere. Fungal control cultures (A) and consecutively listed pairs of organisms (B, C and D)
were co-cultivated under the gas atmosphere outlined. The results are the biomass per batch after
separation and the results of the IRMS analysis (n = 3, mean values ± SD).
Gas
atmosphere
organism Biomass in
mg (20 mL)–1
N content
in %
δ15N
in ‰
15N abundance
in %
A air T. versicolor 16.80 (± 0.8) 0.09 (0.006) 4.37 (± 4.4) 0.37 (± 1·10–3) 15N2/O2 T. versicolor 15.50 (± 3.0) 0.16 (0.001) 1.57 (± 0.8) 0.37 (± 3·10–4) B air T. versicolor 16.23 (± 1.4) 1.72 (± 0.1) –0.15 (± 0.6) 0.37 (± 4·10–4) A. croococcum 3.73 (± 1.0) 2.51 (± 0.3) 7.39 (± 4.5) 0.39 (± 2·10–3) 15N2/O2 T. versicolor 7.77 (± 0.3) 1.62 (± 0.6) 101.40 (± 92.8) 0.40 (± 3.4·10–2) A. croococcum 6.30 (± 0.9) 2.54 (± 0.1) 22.66 (± 6.1) 0.37 (± 2·10–3) C air T. versicolor 6.93 (± 1.6) 1.43 (± 0.5) 6.20 (± 2.5) 0.37 (± 9·10–4) B. acida 13.80 (± 1.2) 6.41 (± 0.7) –0.17 (± 2.3) 0.37 (± 6·10–5) 15N2/O2 T. versicolor 8.07 (± 0.4) 0.83 (± 0.5) 40291.08
(± 5935.1) 13.18 (± 1.6)
B. acida 11.13 (± 0.4) 8.91 (± 1.2) 37922.17 (± 10024.7)
12.52 (± 2.8)
D air T. versicolor 15.23 (± 0.6) 0.78 (± 0.2) 6.19 (± 1.1) 0.37 (± 4·10–4) N. nitrogenifigens too less biomass for a mesurement 15N2/O2 T. versicolor 16.13 (± 1.1) 1.15 (± 0.3) 14.80 (± 6.4) 0.37 (± 4·10–4) N. nitrogenifigens 3.03 (± 0.9) 2.27 (± 1.3) 103.40 (± 50.0) 0.40 (± 4·10–4)
In experiments with both fungi, i.e., O. placenta (Tab. 10) and T. versicolor (Tab. 11), the
δ15N values increased at all co-cultivations with bacteria under 15N2/O2 atmosphere. In co-
cultivation with A. croococcum (B) and N. nitrogenifigens (D), the increase in δ15N values in
the fungal and bacterial biomass was marginally due to high standard deviations. The small
increase in δ15N values was either explained by strongly reduced diazotrophic activity
(compared to the results in Figs. 8, 9 and 10) or by adsorption of 15N2. Only in case of B.
acida (C), the bacterium coexisted with both fungi, and diazotrophic activity was approved as
well as the transfer of fixed 15N into fungal biomass. The δ15N values increased significantly
in fungal and bacterial biomass if it was co-cultivated under 15N2/O2 atmosphere.

Results
42 BAM-Dissertationsreihe
3.8. Cultivation of O. placenta and T. versicolor at different N sources
The effects of different N sources on T. versicolor as well as on O. placenta were
investigated in experiments according to experimental plans (Weißhaupt et al. 2012). The
effects of the organic N source peptone (x1), of the residual N in sapwood (x2) and N2 in air
(x3) as well as their synergistic effects (x1x2, x1x3, x2x3 and x1x2x3) on the fungal activity were
determined. After 14 d of incubation in closed bottles (Fig. 2), the concentration of O2/Ar (gas
chromatography gave one peak, since O2 and Ar were not separable with the employed
method), N2 and ultimately CO2 in the gas phase was measured. Afterwards, the fungal
biomass was determined. Finally, the C content, N content and δ15N value of dried biomass
were measured (Tabs. 12 and 13).
Tab. 12: Investigation of the N sources (peptone (x1), wood of P. sylvestris (x2), N2 in air (x3)) of O.
placenta in a 2³ experimental plan. The indicators of fungal activity were determined after 14 d of
cultivation (n = 3, mean values ± SD).
no. medium x1
wood x2
gas x3
O2/Ar in
vol.-%
N2
in vol.-%
CO2
in vol.-%
biomass
in mg (20 mL)–1
C
in %
N
in %
δ15NAIR N2 in ‰
1 RBA none O2 /Ar
92.30 (± 2.1)
1.42 (± 0.1)
6.29 (± 2.1)
8.07 (± 2.7)
35.08 (± 0.4)
0.40 (± 0.1)
1.59 (± 0.8)
2 RBA + Peptone
none O2 /Ar
80.00 (± 0.4)
1.26 (± 0.4)
18.74 (± 0.2)
11.47 (± 3.6)
37.55 (± 1.3)
2.02 (± 0.4)
4.93 (± 0.4)
3 RBA P. sylvestris
O2 /Ar
93.99 (± 1.3)
0.85 (± 0.3)
5.16 (± 0.9)
8.27 (± 0.6)
38.79 (± 1.0)
0.67 (± 0.3)
–1.89 (± 0.4)
4 RBA + Peptone
P. sylvestris
O2 /Ar
89.39 (± 5.7)
0.58 (± 0.1)
10.03 (± 5.7)
15.47 (± 6.8)
42.04 (± 0.2)
6.28 (± 0.1)
3.43 (± 0.6)
5 RBA none air 14.12 (± 0.1)
82.60 (± 0.1)
3.28 (± 0.1)
5.07 (± 1.4)
37.44 (± 0.6)
0.88 (± 0.4)
–0.58 (± 0.4)
6 RBA + Peptone
none air 1.27 (± 0.3)
84.44 (± 0.4)
14.29 (± 0.5)
15.4 (± 1.8)
42.51 (± 0.4)
3.81 (± 0.7)
6.40 (± 0.6)
7 RBA P. sylvestris
air 8.25 (± 0.3)
86.63 (± 0.8)
5.12 (± 1.1)
4.43 (± 0.6)
37.06 (± 0.6)
0.82 (± 0.2)
–2.93 (± 0.6)
8 RBA + Peptone
P. sylvestris
air 1.07 (± 0.1)
80.79 (± 0.1)
18.14 (± 0.1)
10.67 (± 0.7)
42.50 (± 1.3)
2.96 (± 0.9)
3.61 (± 0.9)
In the experiments of the first experimental plan, O. placenta was cultivated at different N
sources (peptone (x1), wood of P. sylvestris (x2), N2 in air (x3)). In experiments containing
peptone (Tab. 12, nos. 2, 4, 6 and 8), fungal biomass increased compared to cultivations on
pure RBA medium (Tab. 12, nos. 1, 3, 5 and 7). However, the biomass was less than at
similar cultivations on MEA medium (Tab. 3). The addition of wood marginally influenced the

Results
43
biomass, and N2 had no effect (Tab. 12, nos. 3, 4, 7 and 8). CO2 formation and O2
consumption paralleled the biomass development. If peptone was in the medium, the N
content in fungal biomass increased. In addition, the δ15N value was similar to the one of
peptone, which was 4.56 (± 0.1)%. In the presence of wood, the C content marginally
increased, but not the N content, indicating that N traces in wood only marginally affected the
biomass formation. After 14 d of incubation, the pH value decreased from 7 to 3.5.
Fig. 12: Effects of the factors (peptone (x1), wood of P. sylvestris (x2), N2 in air (x3)) and their linear
combination (x1x2, x1x3, x2x3 and x1x2x3) on the indicators of fungal activity of O. placenta. Effects on six
indicators are outlined in bars in different designs. The confidence intervals of the indicators of fungal
activity were determined according to the 95% criterion and are given in the legend.
Based on the measured values (Tab. 12), the effects of the N sources were calculated
(Fig. 12). The effects of the factors x1, x2 and x3 as well as factor combinations on the
indicators of fungal activity are displayed in bars. The indicators and their specific confidence
intervals are listed in the legend. If an effect is within the two-sided confidence interval
(specific values are given in the legend), it is not significant. Consequently, the factor does
not affect the indicator of fungal activity.

Results
44 BAM-Dissertationsreihe
Firstly, the effects on O. placenta were investigated (Fig. 12). If the biomass is targeted, the
confidence level is ± 3.21 mg. If the first factor peptone (x1) is analysed, the effect amounts to
almost 7 mg and is significant. The effects of P. sylvestris (x2), N2 in air (x3) and the linear
combinations (x1x2, x1x3, x2x3 and x1x2x3) on the biomass formation of O. placenta are not
significant.
The effect of peptone (x1) on O2 consumption and CO2 formation is significant as well. The
effects of peptone go beyond the confidence intervals of 2.33 and 2.36%, respectively.
Moreover, the CO2 formation is significantly affected by the combination of P. sylvestris and
air (x2x3). If both factors occur together, the CO2 formation increases significantly, although
the fungal biomass does not increase. This could imply increased decomposition activity
without biomass development. In addition, the atmosphere has an effect on O2 consumption,
which means that in air the O2 consumption is more pronounced than in O2/Ar atmosphere.
The indicators C content, N content and δ15N value were all significantly affected by
peptone (x1). The other factors, i.e., P. sylvestris (x2), air (x3) and the combinations (x1x2,
x1x3, x2x3 and x1x2x3) had minor effects on the elemental composition of the biomass. The
addition of wood of P. sylvestris affected the C content and δ15N value in the fungal biomass
significantly, which indicates that wood was used as a substrate, although it did not increase
fungal growth immediately.
Tab. 13: Investigation of the N sources (peptone (x1), wood of F. sylvatica (x2), N2 in air (x3)) of T.
versicolor in experiments of a 2³ experimental plan. The indicators of fungal activity were determined
after 14 d of cultivation (n = 3, mean values ± SD).
no. medium x1
wood x2
gas x3
O2/Ar in
vol.-%
N2 in
vol.-%
CO2 in
vol.-%
laccase
in U L–1
biomass in
mg (20 mL)–1
C in %
N in %
δ15N in ‰
1 RBA none O2 /Ar
86.10 (± 5.7)
1.37 (± 0.8)
8.36 (± 0.3)
0.18 (± 0.1)
7.00 (± 1.0)
38.44 (± 2.5)
2.24 (± 1.2)
2.37 (± 2.3)
2 RBA + Peptone
none O2 /Ar
83.18 (± 4.9)
1.04 (± 0.1)
12.33 (± 0.1)
0.50 (± 0.7)
5.35 (± 0.6)
39.64 (± 0.8)
3.63 (± 0.3)
3.70 (± 0.3)
3 RBA F. sylvatica
O2 /Ar
87.36 (± 0.5)
0.45 (± 0.1)
12.18 (± 0.6)
15.12 (± 2.5)
4.23 (± 0.2)
41.75 (± 2.1)
0.67 (± 0.3)
nm
4 RBA + Peptone
F. sylvatica
O2 /Ar
78.32 (± 1.6)
0.79 (± 0.8)
20.89 (± 0.9)
45.07 (± 9.4)
23.27 (± 1.4)
46.29 (± 0.4)
8.36 (± 0.3)
3.75 (± 0.1)
5 RBA none air 6.94 (± 3.4)
77.27 (± 0.7)
15.79 (± 4.1)
0.19 (± 0.2)
5.73 (± 0.5)
40.57 (± 0.5)
1.46 (± 0.4)
–0.51 (± 0.3)
6 RBA + Peptone
none air 1.02 (± 0.1)
77.97 (± 0.1)
21.01 (± 0.1)
2.25 (± 0.4)
13.90 (± 1.1)
42.21 (± 0.9)
3.57 (± 0.8)
3.73 (± 0.3)
7 RBA F. sylvatica
air 6.25 (± 0.7)
78.55 (± 0.1)
15.20 (± 0.6)
2.59 (± 0.4)
4.60 (± 0.2)
39.91 (± 0.7)
0.56 (± 0.4)
–2.91 (± 0.7)
8 RBA + Peptone
F. sylvatica
air 1.01 (± 0.1)
77.13 (± 0.1)
21.87 (± 0.1)
9.32 (± 2.4)
14.53 (± 3.7)
45.33 (± 1.8)
5.28 (± 1.4)
3.02 (± 0.4)

Results
45
In experiments of a second experimental plan, T. versicolor was investigated at different N
sources (peptone (x1), wood of F. sylvatica (x2), N2 in air (x3); Tab. 13). The presence of
peptone (nos. 2, 4, 6 and 8) enhanced the formation of fungal biomass significantly, but
sapwood (nos. 3, 4, 7 and 8) increased the biomass only to a low extent. The fungal laccase
activity was activated by wood (Tab. 13, nos. 3, 4, 7 and 8) and increased threefold on
sapwood plus peptone (Tab. 13, nos. 4, 8) indicating a synergistic effect. Interestingly, this
effect was not as intensive under air as under the O2/Ar atmosphere.
CO2 formation and O2 consumption also increased on sapwood (x2) and peptone (x1), and
CO2 formation was highest in the presence of air. The N2 concentration did not change
during incubation. In experiments under O2/Ar atmosphere, a residual N concentration of a
maximum of 1.4 vol.-% N2 was measured, while zero vol.-% was expected. In experiments
under air, the expected N2 concentration corresponded to the N2 concentration in air.
However, the measured values differ from the N2 concentration of 78.8 vol.-% (DIN ISO
2533), because the results of the CO2 and O2 as well as N2 measurement were combined (as
described in section 2.9.).
Fig. 13: Effects of the factors (peptone (x1), wood of F. sylvatica (x2), N2 in air (x3)) and their linear
combination (x1x2, x1x3, x2x3 and x1x2x3) on the indicators of fungal activity of T. versicolor. Effects on
seven indicators are outlined as bars in different designs. The confidence intervals of the indicators of
fungal activity were determined according to the 95% criterion and are given in the legend.

Results
46 BAM-Dissertationsreihe
If wood (Tab. 13, nos. 3, 4, 7 and 8) and peptone (nos. 2, 4, 6 and 8) were added, the C and
N contents in fungal biomass increased, and the δ15N values indicated the uptake of
peptone. N contents in the fungal biomass remained low if peptone was not added (Tab. 13).
The results summarised in Tab. 13 were used to calculate the effects of the factors on the
indicators of fungal activity (Fig. 13). The biomass of T. versicolor was significantly affected
by peptone (x1), F. sylvatica (x2) and the combination of both (x1x2). Consequently, wood
amendment as well as peptone amendment increased the growth of this fungus, and in
particular, if both factors occur at the same time, the growth of T. versicolor is pronounced. In
contrast to O. placenta (Fig. 12), the effect of wood on biomass formation of T. versicolor
(Fig. 13) is significant. However, if wood is combined with N2 in the gas phase (x2x3 and
x1x2x3), the biomass is rather reduced.
If the effect on the laccase activity was measured, it was found that peptone (x1) and wood
of F. sylvatica (x2) significantly enhanced that particular enzyme activity. In addition, the
combination of peptone and wood (x1x2) resulted in high laccase activity. Interestingly, the
presence of air N2 (x3) reduced this activity. The reduction of activity was also found for
combinatory effects including air N2 (x1x3, x2x3 and x1x2x3). Since the enzyme test itself was
done under air, this result shows that the presence of N2 reduces the production of the
laccase enzyme. The inhibitory effects of N2 on biomass and laccase activity are remarkable,
since they were not described before.
If the O2 consumption and CO2 formation were examined, peptone significantly affected
the O2 consumption. The CO2 formation was increased by all factors (x1 peptone, x2 F.
sylvatica, x3 air N2), but not by the factor combinations (x1x2, x1x3, x2x3 and x1x2x3). The
elemental composition of the fungal biomass was affected only to a low extent by the factors
and factor combinations. The C content increased after amendment of peptone (x1) as well
as wood (x2). Peptone (x1) affected the N content in T. versicolor and increased the δ15N
value. Thus, N was assimilated not only from peptone but also from wood.
Consequently, the results of the full-factorial experimental plans indicated that peptone
amendment (x1) increased the activity of O. placenta and T. versicolor, and that wood
amendment (x2) increased the laccase activity of T. versicolor. The effects of N2 in air (x3)
and wood (x2) on the biomass formation and their factor combinations were not significant or
of minor intensity. The effect of N2 of the activity of T. versicolor was rather inhibitory. The N
content and the δ15N values in the biomass of T. versicolor and O. placenta increased if
peptone was amended to the cultivation medium. It can be concluded that in RBA and in
RBA amended with wood the limitation in N limits fungal activity. The limitation is more
pronounced if wood of P. sylvestris is applied, while wood of F. sylvatica seems to contain a
higher initial N content. Peptone bridges the N-limitation, which prevails in both cases.
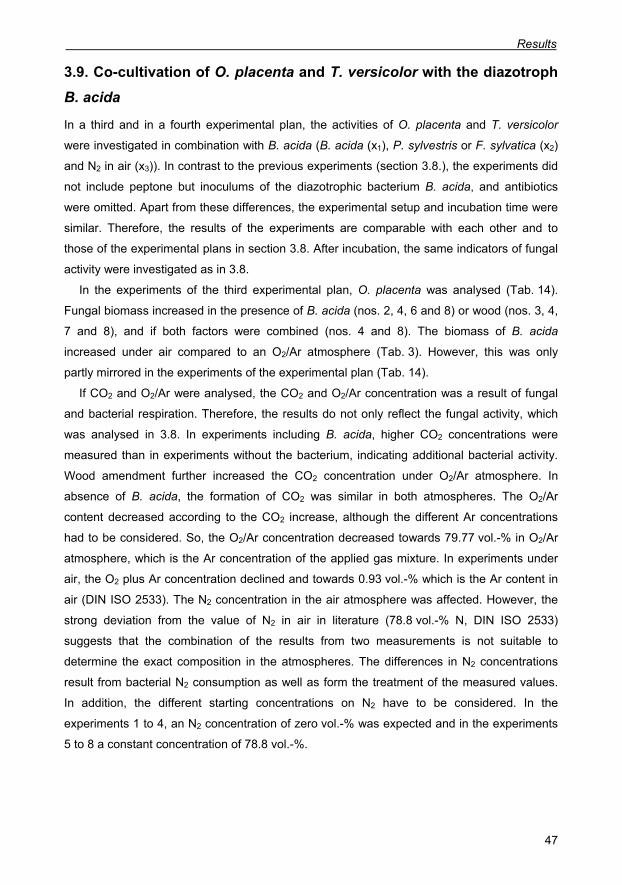
Results
47
3.9. Co-cultivation of O. placenta and T. versicolor with the diazotroph B. acida
In a third and in a fourth experimental plan, the activities of O. placenta and T. versicolor
were investigated in combination with B. acida (B. acida (x1), P. sylvestris or F. sylvatica (x2)
and N2 in air (x3)). In contrast to the previous experiments (section 3.8.), the experiments did
not include peptone but inoculums of the diazotrophic bacterium B. acida, and antibiotics
were omitted. Apart from these differences, the experimental setup and incubation time were
similar. Therefore, the results of the experiments are comparable with each other and to
those of the experimental plans in section 3.8. After incubation, the same indicators of fungal
activity were investigated as in 3.8.
In the experiments of the third experimental plan, O. placenta was analysed (Tab. 14).
Fungal biomass increased in the presence of B. acida (nos. 2, 4, 6 and 8) or wood (nos. 3, 4,
7 and 8), and if both factors were combined (nos. 4 and 8). The biomass of B. acida
increased under air compared to an O2/Ar atmosphere (Tab. 3). However, this was only
partly mirrored in the experiments of the experimental plan (Tab. 14).
If CO2 and O2/Ar were analysed, the CO2 and O2/Ar concentration was a result of fungal
and bacterial respiration. Therefore, the results do not only reflect the fungal activity, which
was analysed in 3.8. In experiments including B. acida, higher CO2 concentrations were
measured than in experiments without the bacterium, indicating additional bacterial activity.
Wood amendment further increased the CO2 concentration under O2/Ar atmosphere. In
absence of B. acida, the formation of CO2 was similar in both atmospheres. The O2/Ar
content decreased according to the CO2 increase, although the different Ar concentrations
had to be considered. So, the O2/Ar concentration decreased towards 79.77 vol.-% in O2/Ar
atmosphere, which is the Ar concentration of the applied gas mixture. In experiments under
air, the O2 plus Ar concentration declined and towards 0.93 vol.-% which is the Ar content in
air (DIN ISO 2533). The N2 concentration in the air atmosphere was affected. However, the
strong deviation from the value of N2 in air in literature (78.8 vol.-% N, DIN ISO 2533)
suggests that the combination of the results from two measurements is not suitable to
determine the exact composition in the atmospheres. The differences in N2 concentrations
result from bacterial N2 consumption as well as form the treatment of the measured values.
In addition, the different starting concentrations on N2 have to be considered. In the
experiments 1 to 4, an N2 concentration of zero vol.-% was expected and in the experiments
5 to 8 a constant concentration of 78.8 vol.-%.
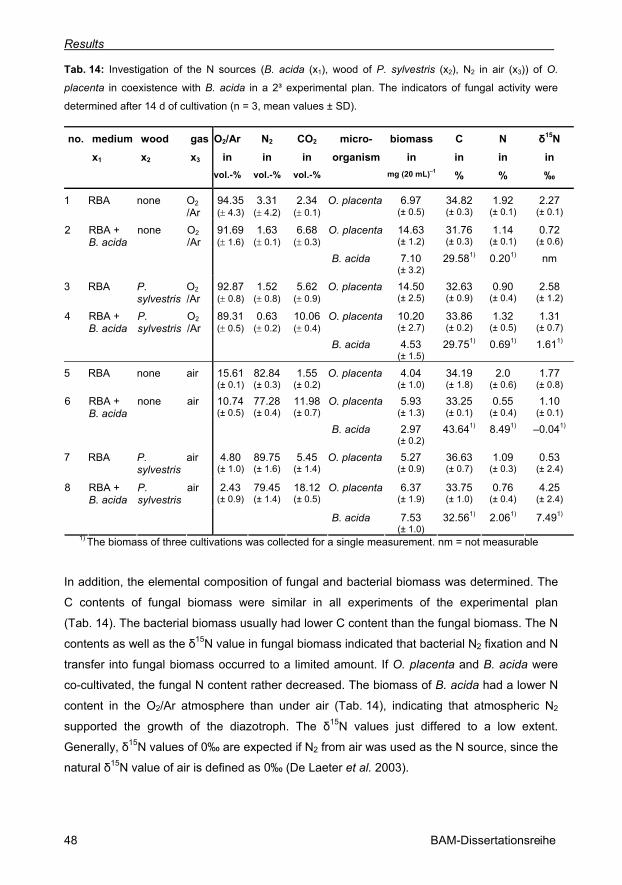
Results
48 BAM-Dissertationsreihe
Tab. 14: Investigation of the N sources (B. acida (x1), wood of P. sylvestris (x2), N2 in air (x3)) of O.
placenta in coexistence with B. acida in a 2³ experimental plan. The indicators of fungal activity were
determined after 14 d of cultivation (n = 3, mean values ± SD).
no. mediumx1
wood x2
gas x3
O2/Ar in
vol.-%
N2 in
vol.-%
CO2 in
vol.-%
micro-organism
biomass in
mg (20 mL)–1
C in %
N in %
δ15N in ‰
1 RBA none O2 /Ar
94.35 (± 4.3)
3.31 (± 4.2)
2.34 (± 0.1)
O. placenta 6.97 (± 0.5)
34.82 (± 0.3)
1.92 (± 0.1)
2.27 (± 0.1)
O. placenta 14.63 (± 1.2)
31.76 (± 0.3)
1.14 (± 0.1)
0.72 (± 0.6)
2 RBA + B. acida
none O2 /Ar
91.69 (± 1.6)
1.63 (± 0.1)
6.68 (± 0.3)
B. acida 7.10 (± 3.2)
29.581) 0.201) nm
3 RBA P. sylvestris
O2 /Ar
92.87 (± 0.8)
1.52 (± 0.8)
5.62 (± 0.9)
O. placenta 14.50 (± 2.5)
32.63 (± 0.9)
0.90 (± 0.4)
2.58 (± 1.2)
O. placenta 10.20 (± 2.7)
33.86 (± 0.2)
1.32 (± 0.5)
1.31 (± 0.7)
4 RBA + B. acida
P. sylvestris
O2 /Ar
89.31 (± 0.5)
0.63 (± 0.2)
10.06 (± 0.4)
B. acida 4.53 (± 1.5)
29.751) 0.691) 1.611)
5 RBA none air 15.61 (± 0.1)
82.84 (± 0.3)
1.55 (± 0.2)
O. placenta 4.04 (± 1.0)
34.19 (± 1.8)
2.0 (± 0.6)
1.77 (± 0.8)
O. placenta 5.93 (± 1.3)
33.25 (± 0.1)
0.55 (± 0.4)
1.10 (± 0.1)
6 RBA + B. acida
none air 10.74 (± 0.5)
77.28 (± 0.4)
11.98 (± 0.7)
B. acida 2.97 (± 0.2)
43.641) 8.491) –0.041)
7 RBA P. sylvestris
air 4.80 (± 1.0)
89.75 (± 1.6)
5.45 (± 1.4)
O. placenta 5.27 (± 0.9)
36.63 (± 0.7)
1.09 (± 0.3)
0.53 (± 2.4)
O. placenta 6.37 (± 1.9)
33.75 (± 1.0)
0.76 (± 0.4)
4.25 (± 2.4)
8 RBA + B. acida
P. sylvestris
air 2.43 (± 0.9)
79.45 (± 1.4)
18.12 (± 0.5)
B. acida 7.53 (± 1.0)
32.561) 2.061) 7.491)
1) The biomass of three cultivations was collected for a single measurement. nm = not measurable
In addition, the elemental composition of fungal and bacterial biomass was determined. The
C contents of fungal biomass were similar in all experiments of the experimental plan
(Tab. 14). The bacterial biomass usually had lower C content than the fungal biomass. The N
contents as well as the δ15N value in fungal biomass indicated that bacterial N2 fixation and N
transfer into fungal biomass occurred to a limited amount. If O. placenta and B. acida were
co-cultivated, the fungal N content rather decreased. The biomass of B. acida had a lower N
content in the O2/Ar atmosphere than under air (Tab. 14), indicating that atmospheric N2
supported the growth of the diazotroph. The δ15N values just differed to a low extent.
Generally, δ15N values of 0‰ are expected if N2 from air was used as the N source, since the
natural δ15N value of air is defined as 0‰ (De Laeter et al. 2003).
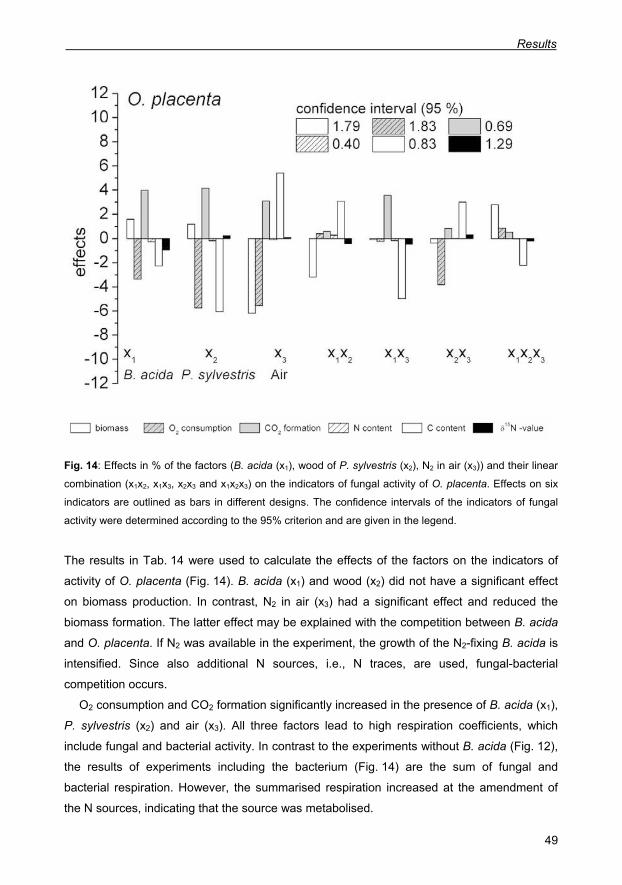
Results
49
Fig. 14: Effects in % of the factors (B. acida (x1), wood of P. sylvestris (x2), N2 in air (x3)) and their linear
combination (x1x2, x1x3, x2x3 and x1x2x3) on the indicators of fungal activity of O. placenta. Effects on six
indicators are outlined as bars in different designs. The confidence intervals of the indicators of fungal
activity were determined according to the 95% criterion and are given in the legend.
The results in Tab. 14 were used to calculate the effects of the factors on the indicators of
activity of O. placenta (Fig. 14). B. acida (x1) and wood (x2) did not have a significant effect
on biomass production. In contrast, N2 in air (x3) had a significant effect and reduced the
biomass formation. The latter effect may be explained with the competition between B. acida
and O. placenta. If N2 was available in the experiment, the growth of the N2-fixing B. acida is
intensified. Since also additional N sources, i.e., N traces, are used, fungal-bacterial
competition occurs.
O2 consumption and CO2 formation significantly increased in the presence of B. acida (x1),
P. sylvestris (x2) and air (x3). All three factors lead to high respiration coefficients, which
include fungal and bacterial activity. In contrast to the experiments without B. acida (Fig. 12),
the results of experiments including the bacterium (Fig. 14) are the sum of fungal and
bacterial respiration. However, the summarised respiration increased at the amendment of
the N sources, indicating that the source was metabolised.
Results
50 BAM-Dissertationsreihe
The effects on elemental composition of the fungal biomass were also investigated. The N
content and δ15N values of the biomass were not affected by any factor or factor
combination. Thus, N transfer did not occur. Nevertheless, the fungal C content was minored
if B. acida (x1) or P. sylvestris (x2) was added, which may hint to fungal-bacterial competition.
The fungal C content increased in the presence of air compared to O2/Ar.
Tab. 15: Investigation of the N sources (B. acida (x1), wood of F. sylvatica (x2), N2 in air (x3)) of T.
versicolor in coexistence with B. acida in experiments of a 2³ experimental plan. The indicators of fungal
activity were determined after 14 d of cultivation (n = 3, mean values ± SD).
no medium
x1 wood
x2 gas
x3 O2/Ar
in vol.-
%
N2 in
vol.-%
CO2 in
vol.-%
laccase in
U L–1
micro- organism
biomass in
mg (20 mL)–1
C in %
N in %
δ15N in ‰
1 RBA none O2 /Ar
87.54 (± 0.7)
0.40 (± 0.1)
12.03 (± 0.7)
4.67 (± 0.2)
T. versicolor
6.87 (± 0.6)
37.51 (± 0.5)
2.51 (± 0.4)
1.08 (± 0.9)
T. versicolor
12.03 (± 5.1)
34.93 (± 2.3)
1.68 (± 0.5)
1.02 (± 0.6)
2 RBA + B. acida
none O2 /Ar
86.78 (± 2.5)
0.26 (± 0.1)
12.96 (± 2.4)
3.51 (± 0.5)
B. acida 2.871) (± 1.8)
29.31) 0.71) nm
3 RBA F. sylvatica
O2 /Ar
83.34 (± 1.4)
0.26 (± 0.1)
16.41 (± 1.3)
27.67 (± 3.9)
T. versicolor
16.93 (± 2.0)
32.16 (± 0.3)
0.70 (± 0.1)
1.83 (± 0.4)
T. versicolor
13.70 (± 1.8)
31.15 (± 0.8)
0.95 (± 0.1)
0.45 (± 0.1)
4 RBA + B. acida
F. sylvatica
O2 /Ar
80.62 (± 0.6)
0.24 (± 0.1)
19.14 (± 0.5)
32.36 (± 6.7)
B. acida 7.97 (± 4.8)
28.9 (± 1.3)
0.64 (± 0.2)
3.8 (± 2.3)
5 RBA none air 12.37 (± 0.5)
78.39 (± 0.3)
9.24 (± 0.7)
0.08 (± 0.1)
T. versicolor
4.53 (± 1.1)
42.71 (± 1.0)
2.09 (± 0.4)
1.60 (± 1.0)
T. versicolor
3.77 (± 0.8)
34.59 (± 0.6)
0.75 (± 0.1)
nm 6 RBA + B.acida
none air 11.76 (± 0.2)
76.71 (± 0.4)
11.54 (± 0.7)
0.67 (± 0.1)
B. acida 1.70 (± 1.3)
42.71) 7.421) –0.81)
7 RBA F. sylvatica
air 7.79 (± 0.3)
77.88 (± 0.1)
14.33 (± 0.3)
4.80 (± 0.6)
T. versicolor
4.2 (± 0.4)
38.79 (± 0.6)
1.03 (± 0.1)
3.94 (± 0.8)
T. versicolor
16.57 (± 2.0)
32.41 (± 2.8)
1.05 (± 0.3)
–0.12 (± 0.1)
8 RBA + B.acida
F. sylvatica
air 2.08 (± 1.3)
77.49 (± 0.6)
20.43 (± 1.8)
17.75 (± 1.2)
B. acida 4.27 (± 3.2)
30.011) 0.871) nm
1) The biomass of three cultivations was collected for a single measurement. nm = not measurable
In the fourth experimental plan, T. versicolor was investigated in combination with B. acida
(B. acida (x1), wood of F. sylvatica (x2), N2 in air (x3)). The experiments revealed that biomass
of T. versicolor increased in the presence of wood (Tab. 15, nos. 3, 4, 7 and 8) or B. acida
(Tab. 15, nos. 2, 4, 6 and 8). The laccase activity increased after addition of wood (nos. 3, 4,
7 and 8), while the presence of B. acida (nos. 2, 4, 6 and 8) did rather not affected the
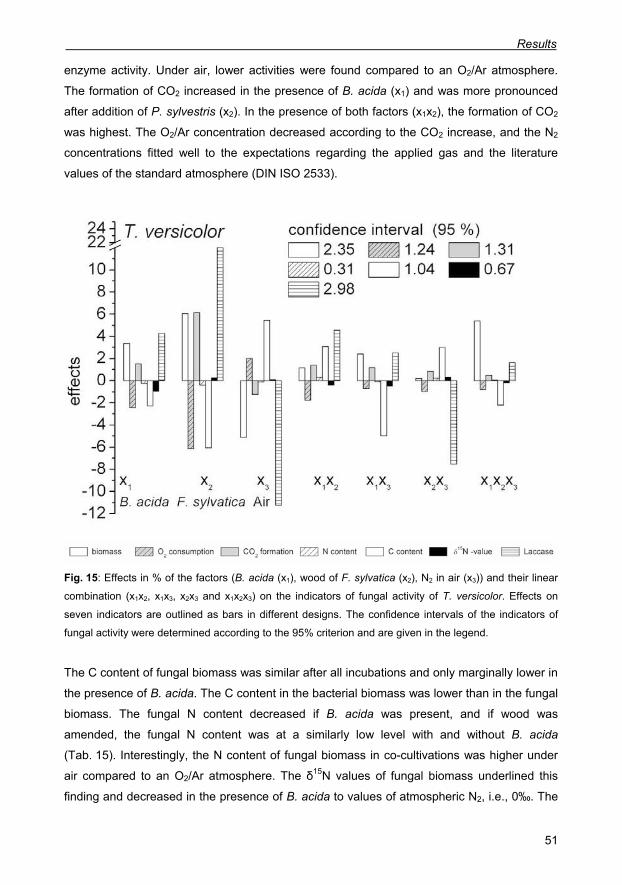
Results
51
enzyme activity. Under air, lower activities were found compared to an O2/Ar atmosphere.
The formation of CO2 increased in the presence of B. acida (x1) and was more pronounced
after addition of P. sylvestris (x2). In the presence of both factors (x1x2), the formation of CO2
was highest. The O2/Ar concentration decreased according to the CO2 increase, and the N2
concentrations fitted well to the expectations regarding the applied gas and the literature
values of the standard atmosphere (DIN ISO 2533).
Fig. 15: Effects in % of the factors (B. acida (x1), wood of F. sylvatica (x2), N2 in air (x3)) and their linear
combination (x1x2, x1x3, x2x3 and x1x2x3) on the indicators of fungal activity of T. versicolor. Effects on
seven indicators are outlined as bars in different designs. The confidence intervals of the indicators of
fungal activity were determined according to the 95% criterion and are given in the legend.
The C content of fungal biomass was similar after all incubations and only marginally lower in
the presence of B. acida. The C content in the bacterial biomass was lower than in the fungal
biomass. The fungal N content decreased if B. acida was present, and if wood was
amended, the fungal N content was at a similarly low level with and without B. acida
(Tab. 15). Interestingly, the N content of fungal biomass in co-cultivations was higher under
air compared to an O2/Ar atmosphere. The δ15N values of fungal biomass underlined this
finding and decreased in the presence of B. acida to values of atmospheric N2, i.e., 0‰. The

Results
52 BAM-Dissertationsreihe
δ15N values in the biomass of B. acida were not measurable due to the low biomass
formation and the low N content in the biomass. Occasionally, the measured values were
below the detection limit of the IRMS instrument (Tab. 15, no. 2, 6 and 8).
The measured values (Tab. 15) were used to calculate the effects on the indicators of
fungal activity (Fig. 15). The biomass of T. versicolor increased if wood was added (x2) and
decreased under air containing N2 (x3). If all factors were combined (x1x2x3), the fungal
biomass increased. This increase in fungal biomass was not found for O. placenta.
Therefore, the positive effect of diazotrophs on fungal growth is more probable for the white-
rot fungus T. versicolor than for the brown-rot fungus O. placenta. The laccase activity
increased significantly if wood (x2) was added and decreased if the atmosphere contained N2
(x3). Wood (x2) induced the enzyme formation, but N2 (x3) reduced it. The latter effect of N2
was also found in the results in section 3.8. (see Tab. 13 and Fig. 13), and it is regarded as a
physiological effect rather than an artefact of this particular experimental setup. In
combination of wood and N2 (x2x3), the enzyme activity was rather reduced. The presence of
B. acida increased the laccase activity significantly but to a low extent (x1, x1x2 and x1x3).
In addition, the effects of the CO2 formation and O2 consumption were determined. O2
consumption and CO2 formation increased if F. sylvatica was added (x2), which indicates that
T. versicolor used wood as a nutrient source. The other factors (x1 and x3) as well as the
factor combinations (x1x2, x1x3, x2x3 and x1x2x3) marginally effected CO2 formation and O2
consumption. The elemental composition showed that the N content and δ15N value were not
affected by any factor or factor combination. Interestingly, the C content was decreased by
wood (x2), increased by air N2 (x3) and decreased by the combination of B. acida and air
(x1x3). A reduction of the C content can be regarded as a consequence of limited nutrient
conditions including N limitation.
In the experiments of the experimental plans including B. acida, the effects of the N
sources on the indicators of fungal activity were low. B. acida, wood and N2 in air affected the
indicators of fungal activity less than organic N sources like peptone, which was investigated
before (see section 3.8.). The bacterial biomass increased in the presence of air, whereas
the diazotroph was suppressed if an O2/Ar atmosphere replaced air. Therefore, the presence
of air had a rather negative effect on fungal biomass, whereas the presence of the bacterium
was not determining. Under air, O. placenta and B. acida competed for the same N sources
in wood and RBA medium, whereas T. versicolor and B. acida partly shared the N2 fixed by
B. acida. The positive effect of the addition of B. acida on the biomass of T. versicolor was
low but significant.
Discussion
53
4. Discussion
4.1. Ecology of wood decomposition
Sapwood and timber are ecosystems with a lower nutrient availability than plant litter on
forest grounds (Schmidt 2006), and therefore, decomposition proceeds in different intensities
and at different rates. If wood is in contact with soil or plant litter, a higher abundance and
diversity of microorganisms is expected, and wood is decomposed faster than wood without
any contact except exposition to air (Schmidt 2006). In addition, soil and litter can provide N,
and the individual types of soil affect microbial decomposition rates. For example,
decomposition usually proceeds faster in N-rich arable soils than in podzolic soils (van der
Wal et al. 2007). Limitations of organic N predominantly occur on sapwood without any
contact except to air. If N2 is the only N source, diazotrophic activity could provide fixed N,
which is a prerequisite for the development of saprotrophic fungi. So far, rather little is known
about the importance of diazotrophs on wood without soil contact. In addition, it is not known
if pure sapwood provides the nutrient and cofactors for diazotrophic activity and if
diazotrophs can exist in the environment of fungi.
If diazotrophs immediately intensified decomposition, the inhibition of this interaction
would be a target for new wood preservatives and possibilities for protection. To estimate the
impact of diazotrophic bacteria on wood-decomposing basidiomycetes, the fungal-bacterial
interaction was investigated by quantitative, instrumental means. The focus was on in vitro
studies on material spoilage organisms from strain collections (Weißhaupt et al. 2011, 2012),
which are of economic interest and applied for material-testing procedures (Schmidt 2006).
Moreover, a fungal-bacterial community which occurs in natural forest ecosystems was
investigated. The experimental results were compared with findings from environmental
studies published earlier and allowed to estimate the impact of cooperative decomposition.
4.2. Sapwood decomposition and elemental composition of microbial biomass and media
The brown-rot fungus O. placenta and the white-rot fungus T. versicolor were cultivated on
5%-malt-extract medium amended with wood specimens. After cultivation of O. placenta on
specimens of P. sylvestris, the wood structure corresponded to brown and cubic rot, because
cellulose was decomposed and other wood components remained. If wood of F. sylvatica
was incubated with T. versicolor, white rot of the wood was visible. Decomposition by H.
fasciculare also caused white rot, but the decomposition did not proceed as fast as with T.
versicolor. Since oxidative decomposition targets the lignin structure, cellulose fibres
disintergrate, become visible, and the volume of the wood block increases. The appearance

Discussion
54 BAM-Dissertationsreihe
of decomposition by the same basidiomycetes differs if the incubation time changes or if
additional nutrient sources are provided. The intensity of decomposition may change and
may be accompanied with fungal fruiting-bodies in the late stage of decomposition.
In further experiments, five basidiomycetes were cultivated on malt-extract medium, prior
to IRMS analysis. In the biomass of the basidiomycetes, the C and N contents as well as
δ15N and δ13C values were similar to each other. Thus, the basidiomycetes were supposed to
have a similar demand in N and to cause negligible N isotope fractionation during growth in
in vitro cultivations. The δ15N value of the substrates determined the δ15N value in the fungal
biomass. Nevertheless, growth dynamics differed, and the fast-growing fungi O. placenta and
T. versicolor were employed in further experiments. In further experiments on RBA, the
biomass had a lower N content than in these pre-experiments. Therefore, in all further tested
media, i.e., RBA and RBA amended with urea, NH4Cl, NaNO3 or peptone, the N supply was
worse than in the complex medium.
Since the medium composition affects the composition of laboratory-grown microbial
biomass, the analysis of the media compounds is a prerequisite for further investigations by
elemental analysis and IRMS (Weißhaupt et al. 2011). Several frequently used media and
medium components were analysed for their elemental compositions and δ15N values. The
same production lots of the analysed substances were applied in this study. The elemental
composition of each of the substances can further differ according to production lots and
manufacturer. Since most of the components are products of plants or animals, their
composition and δ values differ according to cultivation or breeding conditions. Differences in
N contents and δ15N values beyond the given standard deviations (Tab. 3) are possible. If the
N content of a medium preparation is analysed, it is recommended to analyse the individual
components instead of the suspensions. Drying of suspended media for elemental analysis
was also disadvantageous. The lyophilised material was hygroscopic, and the water content
affected the measurement. In addition, N traces in RBA were below the detection limit if they
were mixed with the other medium compounds and subsequently dried. If the medium
components were measured separately, the N contents in the single compounds were
measureable, and the N concentration was calculable. In yeast extract and agar, N was
measured as well. Both substances provide N traces in prepared media.
With regard to the N sources in the natural environment of saprotrophic fungi, examples of
prevalent matrices were analysed. The N content in aqueous extracts of soil, bark and
sawdust showed that these matrices are not completely N-free. The highest N concentrations
were found in soil extract, which is a frequently used N source for saprotrophic fungi in
nature. The N content in bark extract underlined that plant litter is another N source in the
environment of sapwood, although sapwood itself comprises only traces of N. It is denied
that the initial N content in sapwood provides enough N for fungal development. The result

Discussion
55
further showed that the N-containing substances, such as functional enzymes of a tree, are
rather in the bark than in the sapwood.
4.3. Nitrogen uptake of saprotrophic basidiomycetes
The uptake of different N sources by T. versicolor, O. placenta and H. fasciculare was
analysed by elemental analysis and IRMS (Weißhaupt et al. 2011). In parallel cultivations,
the fungi were exposed to different N species and after cultivation, the biomass was
harvested, dried and weighed. Elemental analysis by means of an elemental analyser was
preferred to the Kjeldahl method (e.g., DIN EN ISO 3188), because it allows low sample
sizes of 1.5 to 10 mg to be analysed, and because it is directly combined to IRMS. The
biomass measurements revealed that all tested fungi showed a strong preference to organic
N species, and N traces at an amount of 0.005 g L–1 N were mandatory for any fungal
growth. The biomass formation in laboratory experiments and the elemental composition
further proved the uptake of urea and NH4Cl by T. versicolor and H. fasciculare. O. placenta
did not assimilate the added N sources. Preferences for particular N sources were partly
explained by the size and molecular weight of the N substrates, e.g., NH4+ is smaller than
NO3– and could more easily pass the cell membrane. Besides, several basidiomycetes
contain ammonia transporter proteins (Lucic et al. 2008), but the described organisms did not
include the fungi tested in this study. The presence of such transporter proteins could explain
the uptake of ammonia by T. versicolor and H. fasciculare in contrast to O. placenta. The
uptake of amino acids and their transport along the mycelium of saprotrophic fungi was
described as well (Lindahl and Olsson 2004, Tlalka et al. 2002, Emmerton et al. 2001a). In
early studies, the differences in N utilisation among fungi were even used to categorise
ascomycetes (Robbins 1937, cited in Lilly and Barnett 1951). Organic N was consumed by
the majority of fungi, whereas NH4+ and NO3
– were used with decreasing frequency. The high
affinity to organic N and reduced N of NH4Cl and urea of the tested basidiomycetes
corresponded to these results. The uptake of traces of organic N was supported by the
surface-optimised growth in a mycelium of thin hyphae. With this mycelium, fungi cover the
substrate without producing much biomass and collect N traces from a wide surface. As a
result of simultaneous transformation of organic C to CO2, decomposing fungi create an N-
enriched environment in the late stage of decomposition in situ (Watkinson et al. 2009). The
δ15N values in fungal biomass usually mirrored the δ15N values of substrates. However, in
the experiments of this study, the δ15N values could not prove the uptake of an N source,
since N traces with different δ15N values may dilute the isotope ratio. This is indeed a
phenomenon that occurs in fungal biomass with a low N content. In addition, δ15N values
differed according to incubation time. Generally, it is recommended to use the biomass of the

Discussion
56 BAM-Dissertationsreihe
late phase of the logarithmic part of the growth curve for isotope studies. The cultivation
volume of 50 mL medium was appropriate. At smaller volumes, the problem of isotope
dilution by N traces and variable δ15N values could increase. Fractionation was supposed to
be negligible during cultivations of a maximum of 70 d. Previous studies on fractionation
suggested that more detailed experiments with variable cultivation times and N
concentrations have to be applied to distinguish strain specific isotope fractionation from
interference of different N sources.
The mycelia of saprotrophic basidiomycetes have been previously investigated by IRMS.
In these studies, the N contents amounted to 1 to 6% (Taylor 1997) with a comparatively high
variation between fungal origin and species. The biomass produced in the present study had
a similar N content including variations according to nutrient conditions. The comparison with
the natural samples showed that the N concentrations in the in vitro experiments were similar
to those in nature. Therefore, the tested N concentrations in the substrate were appropriate
and the results were meaningful. In several studies on N isotopes in biomass, e.g., some of
those mentioned in section 1.4. and 1.5., the N content in the biomass neglected and just the
δ15N values were discussed. This is explained with the high uncertainty in the measurements
of the N content. Firstly, the natural N content in the same species of fungi or bacteria can
differ according to nutrient conditions. This was also found in experiments on N-containing
and N-limited medium (Weißhaupt et al. 2012). Secondly, the water content in the samples
may differ significantly, and different drying procedures may also affect the residual water
contents. In the experiments of the present study, the cultivation and drying procedure
followed the same method. So, the results are comparable with each other, but in other
studies and under other flaking conditions different N contents may be measured. If only the
δ15N values are considered, the ratio of 15N and 14N is focused irrespective of the absolute N
concentration. This information is sufficient to trace N transfer (Hobbie and Hobbie 2008), but
if the increase of biomass formation as a consequence of N addition is focused, the absolute
N content includes additional information. However, exact mass balance studies require
defined experimental conditions and therefore, laboratory studies are regarded as
appropriate tool to investigate fungal responses on N amendment. The δ15N values of fungal
mycelia usually varied between –10 to 10‰ (Hobbie and Hobbie 2006, Högberg 1999,
Gebauer and Taylor 1999 etc.). The natural δ15N values in all types of natural matter are
between –20 to 20 ‰, and air N2 has a δ15N value of 0‰ (Hoefs 2009). In most studies, the
δ15N values of fungal mycelia were compared with the δ15N values of soil and plants of the
same ecosystem or between different compartments of the fungi, such as fruit bodies vs.
mycelium (Zeller et al. 2007) or protein vs. chitin (Taylor et al. 1997). Comparisons between
different ecosystems are rare and the results are not comparable. Unlike δ13C values, δ15N
Discussion
57
values differ on a small scale, and differences of biomass from different ecosystems are not
always significant (Hoefs 2009).
4.4. Nitrogen uptake of diazotrophs
The diazotrophic activity of A. croococcum, B. acida and N. nitrogenifigens was quantified by 15N measurements in bacterial biomass, which was cultivated under a 15N2/O2 atmosphere
(Weißhaupt et al. 2011). The 15N abundance of 1 to 13% of the N content in biomass proved
the fixation of atmospheric N2. Nevertheless, the result implied that most of the N in biomass
was not assimilated by N2 fixation, but by the uptake of N sources from the medium. Further
N sources were presumably provided by the media ingredients, impurities or by the inoculum.
The main sources for N contaminations were supposed to be agar in all media, yeast extract
in RBA medium and CaCO3 in Azotobacter medium. Agar must be considered as a source,
since it is added in high amount to the medium. In CaCO3, the N traces were below the
detection limit of the EA. However, this compound was added in a high concentration of
5 g L–1 to the medium and was presumably a source of N traces.
A prerequisite for N2 fixation and N2 reduction by free-living diazotrophs is the ability to
provide ATP for the nitrogenase reaction (Burgess and Lowe 1996). If the full demand in N
was provided by N2 fixation, ATP regeneration implied a high carbon, e.g., a high glucose
consumption. This dependence on ATP may explain why the full bacterial demand in N is
usually not provided by diazotrophic activity. Atmospheric N2 is usually only an additional N
source for diazotrophs. In parallel experiments, different species of diazotrophs exhibited
different 15N2 fixation rates. The 15N2-fixation rates were higher in biomass of A. croococcum
than in biomass of B. acida, but the latter bacterium developed a kind of mucilage, which
optimised spatial growth. This surface-optimised growth supported the nutrient uptake and
transport into bacterial cells. Presumably, N traces were used more efficiently, and the ATP-
demanding N2 fixation was not as intensive as found in A. croococcum. The spatial growth on
mucilage is regarded as a possibility to deal with limited N availability and is an alternative to
the uptake via the mycelium of fungi. Just the kind of mass transport differs: In fungal
mycelium, transport is driven by the turgor in the fungal mycelium (Lindahl and Olsson 2004,
Tlalka et al. 2002), whereas nutrient diffusion prevails in mucilage. In biomass of N.
nitrogenifigens, the 15N2 uptake was significant, but amounted to less than 1.5% if it was
cultivated on RBA medium under 15N2/O2 atmosphere. Although the presence of nifH genes
was described (Addison et al. 2007), diazotrophic activity is of minor relevance for N fixation
of this particular bacterium. This bacterium further reduced biomass production at N-limited
environments, and if N. nitrogenifigens was cultivated on N-containing nutrient medium,
diazotrophic activity was suppressed to 0.39%.

Discussion
58 BAM-Dissertationsreihe
Proteobacteria coexisting with H. fasciculare were also tested for their N2 fixation rates. In all
incubations under 15N2/O2, the δ15N values increased significantly but to a low extent. The 15N abundances were lower than 0.39%, while the natural average 15N abundance is 0.364%
(De Laeter et al. 2003). The increase in 15N abundance in the tested proteobacteria cultivated
under 15N2/O2 compared to the same bacteria cultivated under air was explained by
adsorption phenomena. Low amounts of N2 were fixed in the bacterial matrix, which is
supposed to provide enough electron negativity for N2 capture. However, the reduction of N2,
which is catalysed by nitrogenase reaction, did not occur. This artefact was reproducible and
resulted in a significant difference if biomass was cultivated at 15N2/O2 compared to air, but it
was not referred to diazotrophic activity.
At low N2-fixation rates, nitrogenase activity cannot be distinguished from adsorption of N2.
Therefore, the method of 15N2 tracing is suitable at high assimilation rates, but it must be
accompanied with further molecular biological studies to clearly distinguish weak nitrogenase
activity from adsorption at low 15N2 assimilation rates. The increase in δ15N values found in
the biomass of the bacterial isolates coexisting with H. fasciculare was regarded as an
artefact and was explained by 15N2 adsorption phenomena. It is assumed that the
concentration of ions in the bacterial biomass can provide enough electronegativity to fix a
limited amount of N2, which is not reduced to ammonia. In addition, it cannot be excluded
that the purchased 15N2/O2 gas contained traces of ammonia that was enriched in 15N. These
traces could be easily absorbed by biomass and may also explain the artefact found in the
experiments with the bacterial isolates coexisting with H. fasciculare. The presence of
ammonia traces in 15N2 gas preparation is regarded as possible. Usually, 15N2 gas is
produced by oxidation of an ammonium salt, e.g., (NH4)2SO4, which is either realised by
oxidation on hot copper oxide after generation with sodium hydroxide (Bergersen 1980, cited
in Warembourg 1993) or with alkaline hypobromide (Ohyama and Kumazawa 1981, cited in
Warembourg 1993). Although purification steps are described, e.g., passing the 15N2 gas
through a liquid air trap or solutions of KMnO4-KOH and H2SO4, residual traces of ammonia
cannot be excluded. The information on the purchased gas mixture did neither contain
information on ammonia traces nor on the exact preparation procedure.
Since the diazotrophs (A. croococcum, B. acida and N. nitrogenifigens) as well as the
bacterial isolates coexisting with H. fasciculare were cultivated in parallel experiments under
the same 15N2/O2 atmosphere, equal conditions can be assumed. It can be concluded that
the importance of N2 fixation differs among species, and that there is a gap between the
presence of functional genes and the appearance of N2 fixation. However, even if the small
increase in 15N abundances indicated weak nitrogenase activity, N2 fixation contributed to a
low extent to the N supply of the bacterial isolates. Presumably, the competition for
mineralised N sources prevails in situ. Regarding the assumption of enhanced wood

Discussion
59
decomposition during diazotrophic-basidiomycetal interaction, it is concluded that the impact
of diazotrophs is lower than expected. The ATP-consuming N2-reduction reaction occurs to a
lower extent than the N content suggests. Similar to fungal growth, growth of diazotrophs
depended on initial solid N sources, and the problem of limitation on wood surface is similar.
Therefore, the ATP regeneration and cellulose decomposition is triggered to a lower extent
than assumed in section 1.7.
4.5. Fungal-bacterial interactions investigated by 15N tracing
The experiments on the N uptake of basidiomycetes and diazotrophs (Weißhaupt et al. 2011)
and of H. fasciculare and its coexisting bacteria showed that the demand in N of fungi is low,
and that the 15N2 fixation rates of diazotrophs are limited. In further experiments, the 15N2
fixation in coexistence of basidiomycetes and diazotrophs was tested. Either O. placenta or
T. versicolor was co-cultivated with each of the three diazotrophs under air and 15N2/O2
atmosphere (Weißhaupt et al. 2011). As a result, bacterial growth of A. croococcum and N.
nitrogenifigens was reduced in the acidic and oxidative conditions in the mycosphere. B.
acida developed biomass in co-cultivation and fixed and transferred 15N2 into both fungi
under 15N2/O2 atmosphere. However, the fungal biomass was minored compared to
cultivations without bacteria. This growth-limiting interaction rejects the hypothesis of
intensified decomposition by basidiomycetes combined with diazotrophs.
The results of the co-cultivation experiments are ambiguous. On the one hand, the
transfer of N from diazotrophs to basidiomycetes was approved, but on the other hand, the
experiments underlined that the fungal-bacterial coexistence is limited. For this reason, H.
fasciculare and the coexisting bacterial isolates were considered as well. The mycosphere of
H. fasciculare was supposed to be more suitable for coexisting bacteria. It was less acidic
than the mycosphere of O. placenta and not as oxidative as the mycosphere of T. versicolor.
However, H. fasciculare also reduced the bacterial number on pre-colonised wood (Folman
et al. 2008, Valášková et al. 2009), but the bacterial number increased again at prolonged
time of decomposition. This alternating community structure suggested a competitive
interaction. Since the 15N assimilation rates were low among the bacteria coexisting with H.
fasciculare, fungal wood decomposition is rather not triggered by diazotrophic N enrichment.
In addition, organic sources, urea and NH4Cl were metabolised by most of the bacteria.
These results suggest that H. fasciculare and bacteria use the same N sources in situ.
Further co-cultivating experiments of H. fasciculare and coexisting bacterial isolates under 15N2/O2 atmosphere were not examined, since the low N2 assimilation rates were already
approved.

Discussion
60 BAM-Dissertationsreihe
The experimental approach of direct quantification of 15N2 fixation was suitable for tracing the
uptake of N2 and transfer into both fungi. The experiments approved that some diazotrophs
maintain their diazotrophic activity in co-cultivation with fungi. However, there is a high
uncertainty regarding the detection limit of N2-fixation activity. On account of the description
in section 4.4., low adsorption rates cannot be distinguished from experimental artefacts.
This problem even increases in co-cultivation or in situ studies, where also dilution
phenomena have to be considered (Danso et al. 1993). Nevertheless, bacterial N2 fixation in
association to plants, fungi or lichens has been frequently analysed by 15N2-tracing, and
several methods and experimental setups were suggested. First tracing experiments were
applied by Burris and Miller (1941). This direct and quantitative 15N2-tracing method is
regarded as the method to which all other methods, e.g., acetylene-reduction assays or N
enrichment studies focusing on the N content, should be referred to (Warembourg 1993,
Shearer and Kohl 1993). The method was preferred to the acetylene-reduction assay, in
which the reduction of acetylene to ethene is quantified and related to the N2 reduction
(Hardy et al. 1968). Similar to the advantages, the limitations of the 15N2-tracing method were
discussed as well (Danso et al. 1993). The particular experimental setup during 15N2
exposure and the reaction time affect the results. One difficulty is to find an appropriate
chamber which allows the cultivation and the gas-replacement at the same time. That
chamber must have an optimised volume to cover the whole experimental setup, to minimise
the costs of 15N2 gas, but to ensure sample supply with gases for gas reactions, such as
respiration or CO2 fixation. In addition, the chamber must be gastight to prevent the loss or
dilution of 15N2 and must stand the gas-replacement procedure. In the present study, a
desiccator was used, cultivations were carried out on Petri dishes, and many Petri dishes
(30 dishes) were put into the same desiccators before 15N-enriched gas was applied. The
method was appropriate for the parallel cultivation of the tested fungi and bacteria. The gas
in the desiccator was replaceable, and the gastight sealing was provided by the grinding of
the lid and a rubber-sealing. Besides, it was possible to treat the desiccator in a laboratory
autoclave to provide sterile cultivation conditions. The Petri dishes provided a huge surface
compared to other cultivation flasks, which ensured optimised exposure of the
microorganisms to the gas phase. Petri dishes were used including their lids, which had to be
equipped with vents to ensure the gas-replacement in the Petri dishes. For the purpose of
bacterial and fungal cultivations on different media, this method was suitable. It allowed
isotope tracing experiments at comparatively low expenses.
It is particularly recommended to use a single batch for experiments that are intended to be
compared. The gas-replacement and the gastightness of the desiccator were regarded as
most critical issues during the entire procedure. Parallel cultivations in the same desiccator
and at the same time were the easiest way to provide equal conditions. In this study, only two

Discussion
61
batches with a 15N2/O2 atmosphere were investigated: Firstly, all bacteria were cultivated in
the same desiccator (results section 3.6.), and secondly, all fungal-bacterial co-cultivations
were carried out in another desiccator (results section 3.7.). So, the comparisons of the
experiments in this study are feasible, although the results may differ from other studies.
Nevertheless, the presence of N2-fixing organisms in both batches was a positive control and
approved the presence of the 15N2 gas. (In the first batch, A. croococcum and B. acida fixed 15N2 and gave evidence for the presence of 15N gas in the desiccator. In the second batch, B.
acida in co-cultivation with both fungi assimilated 15N.) All experiments under 15N2/O2
atmosphere were also done under air. These experiments are important control experiments,
which cover all disturbances that may affect the experiments apart from the gas atmosphere.
These disturbances may include variations in the temperature during the cultivation time,
small differences in the elemental composition of media, the resistance of the
microorganisms towards the gas-replacement procedure etc. The control experiments helped
to find out if other N sources than N2 affected the growth of fungi and bacteria. The
disadvantages of the setup in desiccators are the uncertainty of the composition of the gas
phase and the inconvenience with placing the dishes in the desiccators under sterile
conditions. Therefore, further containers, i.e., rubber-sealed reaction bottles were applied in
experiments under O2/Ar atmosphere (sections 3.8. and 3.9.). In these flasks, the gas phase
can be replaced several times to ensure that air is completely removed. This procedure is not
applicable to 15N2-enriched gas, since a high volume of gas would be required.
The experimental setup in this study was much simpler than the experiments on living
plants (Warembourg 1993, Shearer and Kohl 1993) or lichens (Millbank and Olsen 1981).
Since plants or lichens have to be cultivated in soil for a long period, tracing experiments
under 15N2 gas are challenging. In several approaches, plants were cultivated in soil, taken
out from the soil and then exposed to a 15N2-containing atmosphere or just the root ball was
exposed to 15N2. Then, the bacteria on the root surface assimilated traceable amounts of 15N.
However, in these experiments, the previously mentioned artefacts as a result of adsorption
can occur as well (Danso et al. 1993). Another difficulty is to find appropriate reference
plants, to which the measured values can be referred to. Considering the problem of
appropriate reference data, laboratory experiments under defined conditions are a
prerequisite and should accompany all environmental studies. Since almost all 15N2-tracing
methods have limitations at low N2-fixation rates, an alternative method was developed, and
the co-cultivations proceeded under an N2-free O2/Ar atmosphere (sections 3.8. and 3.9.). In
these experiments, the fungal activity at different conditions was measured. The method is
not transferable to in situ studies, which is a disadvantage compared to the 15N2-tracing
method.
Discussion
62 BAM-Dissertationsreihe
4.6. Nitrogen uptake of O. placenta and T. versicolor determined by DOE
The N uptake of O. placenta and T. versicolor was further analysed in experiments of full-
factorial experimental plans (Weißhaupt et al. 2012). The effects of the most frequent N
sources, namely organic N in the medium (x1), N traces in wood (x2) and N2 in air (x3), were
tested. Since fungal growth and decomposition activity responded in different magnitude to
the amendment of the N sources, several indicators of fungal activity were investigated. This
approach enabled a detailed evaluation of the effects (Figs. 12 and 13). Combinations of
factors (x1x2, x1x3, x2x3 and x1x2x3) revealed synergistic effects, which occur if the effect of
combined factors was higher than the sum of the individual factor’s effects. The 95%
confidence interval was used to determine whether an effect was significant or negligible.
The indicators were the fungal biomass, the O2, N2 and CO2 content in the gas phase, the
elemental composition of the fungal biomass and the laccase activity in case of T. versicolor.
The growth of biomass of O. placenta was triggered by the presence of peptone (x1),
whereas the effects of N from sapwood of P. sylvestris (x2) and gaseous N2 (x3) were within
the confidence interval (Fig. 12). Linear combinations of these factors were not significant,
indicating no synergistic effects. The C sources in RBA, i.e., glucose, mannitol, malate,
pyruvate and succinate, were supposed to be preferred to the C polymers of wood, i.e.,
cellulose, hemicelluloses, lignin. Therefore, the C addition by wood amendment did not
cause the increase in fungal biomass. If wood amendment had increased the biomass, this
would have approved that wood provides enough N for fungal development. However, the
latter was not approved in the experiments, and therefore, the initial N in wood did not
support fungal growth under these conditions. In contrast, peptone decreased the C/N ratio in
the medium and enhanced fungal growth. This fact approves that N limitation in the
experiments prevailed, and that this limitation was coverable by the amendment of an
organic N source. Nevertheless, peptone had to be considered as an additional C source.
Elemental analysis of peptone revealed a C content of 44.06 (± 0.5)% and an N content of
15.24 (± 0.1)%. Anyway, the amendment of C was not determining, since the initial RBA was
not C-limited. Further indicators, such as the CO2 formation and O2 consumption as well as
the C content, N content and the δ15N value in the fungal biomass, affirmed the enhancing
effect of peptone on fungal activity. Since O2 and Ar are not separable by the gas
chromatographic method, both gases were measured as one peak. The Ar/O2 peak declined
towards a minimum of 0.93%, which is the natural abundance of Ar in air (DIN ISO 2533). If
the air atmosphere was replaced by the O2/Ar mixture, the O2/Ar peak declined towards
79.77 vol.-%, which resembled the Ar content of the mixture. The O2 consumption and CO2
production increased after peptone amendment, but not after amendment of wood or N2 in
air, and this showed that wood and N2 did not intensify fungal activity. In experiments with O.

Discussion
63
placenta, laccase activity was not representative, since O. placenta decomposes wood by
oxalic acid and Fenton reaction (Martinez et al. 2009). Consequently, after 14 d of incubation,
the pH value decreased significantly, and the laccase activity was below the detection limit.
The biomass of T. versicolor was significantly enhanced by peptone (x1), by wood of F.
sylvatica (x2), and the combination of both (x1x2) was synergistic (Fig. 13). In contrast, the
combination of wood and air (x2x3) and of wood, air and peptone (x1x2x3) suppressed the
formation of biomass significantly. These findings paralleled the findings from applied timber
protection, where clean and aerated sapwood is supposed to be more resistant to microbial
attack than wood in soil contact (Schmidt 2006). Interestingly, wood of F. sylvatica in contrast
to P. sylvestris provided initial N and activated the fungus to a low extent. The CO2 formation
paralleled the development of biomass. Wood (x2) and peptone (x1) further enhanced laccase
activity significantly, whereas the presence of N2 (x3) and the combinations of air and wood
(x2x3) and of air and peptone (x1x2) inhibited the enzyme activities (Fig. 13). Previous studies
affirmed these results, since laccase was found to be activated by plant litter (Elisashvili and
Kachlishvili 2009) or organic N sources, such as peptone (Mikiashvili et al. 2005). Less is
known about inhibiting effects of N2 on laccase production. A similar increasing effect on
laccase activities was found if N2 in the cultivation atmosphere was replaced by O2 and CO2
(White and Boddy 1992). This finding was not further explained or investigated in literature.
The C and N contents in the fungal biomass were marginally affected by the different N
sources, but the δ15N value in biomass of T. versicolor increased in the presence of peptone
(x1) and wood (x2), indicating N uptake from these sources.
The activity (growth and decomposition activity) of both basidiomycetes increased if
peptone was added to the medium. The presence of N2 and N traces in wood affected the
fungal biomass formation marginally. Previous studies on O. placenta and Gloeophyllum
trabeum confirmed that CO2 formation was enhanced as a result of the addition of N sources
(Niemenmaa et al. 2008). It was further suggested that low amounts of N are scavenged
from substrate (Watkinson et al. 2006, Bebber et al. 2011) or from N-containing organic
matter (Perez-Moreno and Read 2001). Considering the indicators of fungal activity, which
were measured apart from biomass, the results found for the biomass production were
supported. Moreover, the amendment of wood significantly increased the laccase activity of
T. versicolor. In contrast, laccase activity was significantly minored in experiments containing
atmospheric N2. The activity of the enzyme was tested in separate tests with samples of the
medium after cultivation. All tests were carried out under air atmosphere. Therefore, enzyme
inhibition by N2 did not cause the reduction in enzyme activity. Instead, the production of the
enzymes during growth under air was reduced. This is a new finding, which has not been
described in detail in literature.

Discussion
64 BAM-Dissertationsreihe
4.7. Fungal-bacterial interactions determined by DOE
The impact of B. acida (x1) on both fungi (O. placenta and T. versicolor) was investigated in
experiments of two further experimental plans. B. acida was chosen according to the results
of the co-cultivation experiments under 15N2/O2 atmosphere. In contrast to A. croococcum
and N. nitrogenifigens, this bacterium fixed 15N2, coexisted with both fungi and transferred 15N to the fungal biomass all at the same time (Weißhaupt et al. 2011). Atmospheric N2 in the
gas phase positively affected the growth of the diazotroph B. acida, but N2 was not
mandatory for the development of bacterial biomass. Even under O2/Ar atmosphere the
bacterium developed biomass, which fitted well to the results from the cultivation experiments
under 15N2/O2 atmosphere that also suggested that further sources were used. On account of
the results of the experiments of the experimental plan, N2 had a significant negative effect
on fungal biomass, which underlines the fungal-bacterial competition. Interestingly, the
presence of N2, but not of B. acida itself, was the significant factor, and the combination of
both did not affect fungal growth significantly either.
Fungal activity was different in co-cultivation of O. placenta and B. acida (Fig. 14)
compared to experiments including peptone (Fig. 12). The biomass of O. placenta was only
marginally affected by B. acida (x1) and sapwood (x2) under O2/Ar atmosphere, but it was
significantly negatively affected by the presence of N2 (x3, Tab. 14). If gaseous N2 was
present, the diazotroph prevailed in the co-cultivation and caused reduced fungal biomass,
while in an O2/Ar atmosphere O. placenta prevailed. CO2 formation and O2 consumption
were not as representative as in experiments without B. acida, because B. acida contributed
significantly to CO2 formation. Nevertheless, the experiments revealed that all three
influencing factors positively affected CO2 formation. The effect of bacteria as nutrient source
was not discussed, but glucose, amended or as mineralisation product of cellulose, allowed
respiration of both B. acida and O. placenta. The combination of air and B. acida (x1x3) was
synergistic in terms of CO2 formation and can be traced back to a better N availability after
bacterial N2 fixation (Fig. 14). However, enhanced wood decomposition is questionable,
because other indicators did not confirm this synergistic effect. During the initial stage of
wood decomposition, the C sources from the medium were more frequently used than wood
(Tab. 14), which was similar to findings on decomposition of flakes of P. sylvestris (Jin et al.
1990). If O. placenta was employed, the addition of wood of P. sylvestris and B. acida
affected fungal growth marginally. Further indicators revealed that except for CO2 formation
none of the effects was significant and, since CO2 was also produced by the bacterium, B.
acida did not increase fungal activity. B. acida competed with O. placenta for the N sources
in the cultivation medium. If T. versicolor was combined with B. acida, the bacterium
increased the biomass production of the fungus (Fig. 15). This effect on the fungal biomass

Discussion
65
was higher than the confidence interval, which was not found for the biomass of O. placenta
in combination with B. acida (Fig. 14). In addition, wood positively affected the formation of
fungal biomass, whereas air inhibited fungal biomass (Fig. 15). Air N2 (x3) supported the
growth of B. acida in such a way that both organisms coexisted. The combinations of factors
marginally affect biomass production except if all factors were combined. In that case, the
fungal biomass was increased. These results were also mirrored in an increasing formation
of CO2 and consumption of O2. In addition, the fungal laccase activity was enhanced by B.
acida (x1) and indeed increased by sapwood (x2). However, air (x3) inhibited the laccase
activity, which was also found in the experiments of the experimental plan excluding B. acida
(see section 4.6.). Combinations of air and sapwood (x2x3) rather reduced the laccase
activity. Effects on the elemental composition were not significant. The results in co-
cultivations displayed high standard deviations probably caused by insufficient separation of
fungal and bacterial biomass. Maybe the spatial heterogeneity of fungal and bacterial species
on wood caused different patterns of fungal-bacterial interactions. A positive effect of bacteria
on white rot rather than on brown rot was expected, because T. versicolor increased in the
presence of NH4Cl (Weißhaupt et al. 2011), and because NH4+ is a product of nitrogenase-
catalysed N2 fixation (Burgess and Lowe 1996).
The significance of the effects was estimated by the confidence intervals. These
confidence intervals were calculated for all indicators of fungal activity, and effects within
these limits were insignificant. However, the tested parameters are not the only factors for
fungal activity. In order to reveal any effects of N, deviations were minimised by using
chemicals from the same purchased charge. This enabled effects to be measured, because
all experiments contained exactly the same medium. This was of particular importance
regarding IRMS measurements. As a result of initial C sources, the effect of wood
amendment on fungal growth may be underestimated, but an inducing effect of wood on
laccase activity was found. Peptone is also an additional C source, and an impact of C on the
effect attributed to organic N cannot be excluded. The N contents in fungal biomass and the
δ15N values proved the utilisation of peptone as N source. Moreover, experiments without
peptone are not C-limited due to RBA medium. The similar C contents in fungal biomass in
all experiments of the experimental plan approved the C supply. In addition to the C and N
content in biomass, the C/N ratio is discussed. The C/N ratio underlines the close association
of C and N, but it does not give any evidence of the absolute contents of the elements. If the
C content is almost constant, the discussion of the N content gives evidence on the effects.
In conclusion, the experiments of the experimental plans revealed that organic N rather
than N from sapwood determined fungal activity. This result underlined that sapwood
decomposition increased after addition of organic N. In case of decomposition of P.
sylvestris, N addition even seemed to be mandatory. Diazotrophic activity of B. acida

Discussion
66 BAM-Dissertationsreihe
marginally affected the initial phase of wood decomposition by O. placenta, and the
bacterium even inhibited fungal growth if gaseous N2 was present. In contrast, the activity of
T. versicolor was enhanced in the presence of B. acida. Biomass formation of B. acida was
supported in the presence of wood and gaseous N2. Therefore, this bacterium was able to
compete with O. placenta and to coexist with T. versicolor. Moreover, the presence of
gaseous N2 reduced laccase activity significantly and affected wood decomposition
negatively. These results affirmed that aeration combined with dry and clean storage of wood
is advantageous for timber durability. Interestingly, wood of F. sylvatica was an N source for
T. versicolor, while wood of P. sylvestris was not an N source for O. placenta. It is assumed
that the wood of F. sylvatica contains a higher initial N concentration than the wood of P.
sylvestris.
4.8. Fungal-bacterial interactions in wood decomposition
The amendment of urea or NH4Cl supported white rot, and organic N increased brown- and
white-rot fungi. The effect of N on the biomass of saprotrophic basidiomycetes was found for
a concentration of 10 mM N in both experimental approaches: the IRMS measurements
(Weißhaupt et al. 2011) and the experiments according to experimental plans (Weißhaupt et
al. 2012). In preliminary experiments, growth on RBA medium amended with 1 to 100 mM N
was tested, and the growth increase was most pronounced at 100 mM (data not shown). If
the N concentration was further increased, a further increase in growth rates is expected.
However, at very high concentrations, an inhibition of growth rates is expected as well. The
concentration for maximum growth rates was not determined, because it depends on the
availability of further nutrient conditions and is not a constant value. The growth of bacteria
was also increased in N-containing media, but the N2 assimilation was reduced if organic or
reduced N was available. These results of experiments on fungal growth underlined that the
demand in N of saprotrophs is very low. The effect of bacteria was ambiguous. On the one
hand, it was approved that N2 can be fixed and transferred to saprotrophs, but on the other
hand, growth limitations during fungal-bacterial interactions were observed. So, bacteria
seemed not to be mandatory for fungal wood decomposition.
The initial existence of endosymbiotic or ectosymbiotic bacteria in basidiomycetes from
strain collections was neither approved nor disapproved in experiments of this study. Fungal
growth in experiments with and without antibiotics (streptomycin, tetracycline) was similar,
and fungal growth was not minored in experiments without N2. The presence of ectosym-
biotic bacteria in the outer mycosphere of the fungus was not probable, because the
treatment with antibiotics had no effect. Endomycelial bacteria within the hyphae would be
protected against antibiotics. Their presence cannot be excluded, but they are probably not
Discussion
67
diazotrophs, because the absence of N2 during cultivation had no effect and because in 15N2-
tracing experiments, 15N2 was not assimilated. Therefore, the cultures of O. placenta and T.
versicolor from strain collections did rather not contain diazotrophs.
The impact of N2-assimilating bacteria on fungal growth was analysed with two
independent methods: 15N2-tracing (Weißhaupt et al. 2011) and cultivation with and without
atmospheric N2 (Weißhaupt et al. 2012). The results of the experiments with both methods
suggested that apart from N2 fixation fungal-bacterial competition for the same N-containing
substrates in the cultivation media prevailed. In particular, organic N was used which
underlined the importance of microbial amino acid transfer. While N oxidation, nitrification,
denitrification and N2-fixation are in the focus of the bacterial N cycle (Jetten 2008), terrestrial
ecosystems including plants and fungi are affected by transfer reactions of amino acids,
amino sugars and small peptides. These reactions are supposed to control the C and N
mineralisation in soil (Gärdenäs et al. 2011). Atmospheric N2-fixation by bacteria and transfer
into fungi proceeded in co-cultivation with B. acida (Weißhaupt et al. 2011). However, the
postulated effect of increased wood decomposition as a consequence of mutualism between
basidiomycetes and diazotrophs was not affirmed. Fungal-bacterial cooperation which
intensifies wood decomposition could occur during decomposition in natural ecosystems and
could explain high decomposition rates in soil. On pure sapwood, the association of
diazotrophs to saprotrophic basidiomycetes is questionable. Sapwood combined with minor
spoilage can provide enough N for the growth of decomposing saprotrophs. Spoilage may be
caused by N-containing particles from air, e.g., bacteria, spores, pollen or dust, since
saprotrophic fungi collect and scavenge N.
The high number of studies describing fungi in temperate regions suggested two
principles of efficient N assimilation during wood decomposition in forest ecosystems. Firstly,
fungi collect and recycle organic N from substrates in temperate forests. Even traces of
organic N are captured in the soil organic matter and protected against wash-out. Secondly,
bacteria fix N2, but they require high amounts of ATP. Interestingly, diazotrophs occurred
more frequently in tropical forests (Houlton et al. 2008). Presumably, high temperature and
diurnal climate with a constant amount of C-rich plant litter throughout the whole year support
the bacterial fixation of atmospheric N2. Mandatory associations of ascomycetes and
diazotrophs related to wood were only found among lichens, such as Lobaria lichens (Bates
et al. 2011, Antoine 2004). These lichens are not cultivable and have not been described as
spoilage organism on materials. It occurs on trees affiliated to Pseudotsuga in natural
environments that are protected against pollution. The lichens usually grow very slowly, but
their existence on the wood of Pseudotsuga indicates that they can even mineralise the
structure of very persistent wood. Decomposition of wood by basidiomycetal-diazotrophic
interactions cannot be exactly predicted. The results suggest the growth-enhancing effect of

Discussion
68 BAM-Dissertationsreihe
fixed N sources on both bacteria and fungi. However, a mandatory association of diazotrophs
and saprotrophs is estimated to occur rarely. On sapwood, fungal species and flanking
nutrient conditions determine decomposition rates. Further factors include physical
properties, i.e., temperature, texture, as well as chemical properties, such as moisture,
aeration and nutrient availability.
Previous studies showed that the amendment of N to forest soils can activate enzyme
activities for plant litter decomposition (Waldrop et al. 2004, Sinsabaugh et al. 2002, Carreiro
et al. 2000). However, the amendment of NH4NO3 led to increased cellulose decomposition
in cellulose-rich material, but to reduced phenol oxidase activity in lignine-rich oak litter
(Waldrop et al. 2004, Carreiro et al. 2000, Fog 1988). The second finding contrasts to our
result of laccase activation after amendment of organic N (Weißhaupt et al. 2012). Since
natural ecosystems are multi-factorial systems, the effects of N amendment on litter
decomposition cannot be predicted and generalized. It has to be considered that N
amendment can lead to a community shift in soil and may support organisms which are not
lignolytic. So, N deposition can explain both increased and decreased decomposition activity
(Carreiro et al. 2000). These experiments on enzyme activities reveal the effects of
deposition of anthropogenic N to forest ecosystems. Since the increased deposition of
anthropogenic N is one of the most frequently discussed environmental risks of the present
time (Galloway et al. 2004), several approaches tried to estimate the impact on forest
ecosystems (Aber and Magill 2004, Gundersen et al. 1998). Apart from the mentioned
changes in the soil enzyme activity, changes in the community structure were observed (Frey
et al. 2004). In N-rich soil, the fungal-bacterial biomass ratio was lower than in soils without N
amendment. This finding fits well to the fact that bacterial biomass usually has a higher N
content than fungal biomass (referred to the dry weight). Since fungal biomass is decreased
as a consequence of N amendment in environmental studies (Frey et al. 2004), increased
decomposition rates do rather not occur. This contrasts to the finding that N addition to
sapwood is a prerequisite for its decomposition (Bebber et al. 2011, Boddy et al. 2008,
Watkinson et al. 2006). The latter results correspond to the results of the experiments
according to experimental plans (section 4.6. and 4.8.) and the increased fungal growth on N
amendment. Considering the inhibition and activation of decomposing organisms, we can
conclude that there exists a narrow range in N concentrations that increases fungal growth
on wood. If soil or plant litter is present, these substances provide so much N that the further
amendment of N can lead to an N concentration that suppresses decomposing saprotrophs.
High N concentrations support different fungal and bacterial species which are not lignolytic.
This could explain the suppression of decomposition by N amendment, but does not give
evidence on the ecological relevance. Even if wood decomposition is reduced, this may be
disadvantageous if the C cycle is blocked. The results showed that it is very difficult to

Discussion
69
estimate consequences of anthropogenic N deposition in forests. Besides, there is certainly a
gap between deposition experiments and N amendment as a result of pollution. If pollution
prevails, the episodic amendment over a longer period must be considered. Corresponding
experiments are difficult to design. This difficulty includes wood litter decomposition in forests
as well as wooden materials exposed to N deposition.
4.9. Uncertainty treatment
Measurements by instrumental means are affected by several parameters, which include the
calibration of the instrument, the parameters during a measurement and further operating
conditions. Measured values are usually not identical, and the uncertainty must be minimized
and at least described. Moreover, the sample preparations, e.g., the microbiological
experiments, bear the risk of further variations. Therefore, careful considerations on the
uncertainty and detailed information on its treatment are mandatory to distinguish effects
from artefacts. Reliable measurements must include information which parameters were
considered and were excluded. Generally, the Guide to the Expression of Uncertainty in
Measurement (JCGM 100: 2008) recommends how to treat measured values, but the applied
uncertainty expression usually varies according to the particular method and subject.
In this study, arithmetical averages and standard deviations of replicate tests were
calculated. For fungal and bacterial cultivation-tests, usually three replicates were carried out,
and the elemental composition of each biomass was measured one to three times. The
standard deviations reflected minor disturbances during cultivation, biomass recovering,
lyophilisation and instrumental measurements. These deviations were calculated from
measured values of biomass and elemental analysis but did not comprise the differences in
δ15N and δ13C values that result if different compounds for media preparation were applied.
Replicate EA and IRMS measurements of the same sample of biomass usually had a lower
standard deviation than measurements of biomass from replicate cultivations under the same
conditions, which ensured the reproducibility of the methods. The reproducibility of the
instrumental measurement was supported by the standard deviations of the working standard
casein, which were usually the lowest.
In this study, the uncertainty was predominantly described by the SD of the measured
values. This was regarded as the most suitable treatment, since the parallel experiments
were focused and a comparison with results from further studies was not intended. Under the
chosen laboratorial conditions, many sources of uncertainty were suppressed and did not
enter the uncertainty treatment. However, this applied uncertainty treatment does not corres-
pond to metrological recommendations to determine the standard deviation of each para-
meter and to summarise these standard deviations to estimate the full uncertainty of a pro-

Discussion
70 BAM-Dissertationsreihe
cedure (JCGM 100: 2008). In the present example of consecutive cultivating, harvesting,
drying and measuring, the summarised deviations would correspond to more pronounced
uncertainties than the simple calculation of the standard deviation from measurements of
replicates. If all uncertainties were summarised, some of the investigated physiological
effects could be no longer significant. To detect morphological differences as a result of
different cultivation conditions, disturbances were minimised, and appropriate control
experiments were of particular importance. The experiments in this study and in particular the
experiments of the experimental plans provided all necessary control experiments to approve
the conclusions.
Apart from the standard deviations, the significances and confidence intervals were
calculated. Firstly, confidence intervals were calculated using the variances and tabulated t-
values. Secondly, the computer-based P-value approach and two-way ANOVA was applied.
For these calculations, a normal distribution of the values was assumed. Both approaches
helped to determine significances of effects on the performance of the bacterium under
laboratory conditions. However, even if the significance of an effect is calculable, the effect
may still be an artefact. In case of an artefact, the experimental setup was not appropriate.
For example, the bacteria coexisting with H. fasciculare assimilated 15N2 significantly but only
to a low extent. These bacteria were supposed to adsorb 15N2 but not to fix and reduce 15N2
to ammonia by nitrogenase reaction. Significant 15N enrichment was prevalent, since the
adsorption was reproducible in the experiments. At low N2 assimilation rates, molecular
biological studies are mandatory to distinguish weak diazotrophic activity from adsorption. 15N2-tracing experiments and experiments of the experimental plans were suitable
approaches and resulted in similar conclusions. The quality and reproducibility of the results
were almost the same at similar operating expenses. However, many of the measured
effects in this study were low and thus difficult to approve. The conclusions from the two
approaches were similar, which underlines again that the conclusions are sound. Regarding
the experiments of the experimental plans, many results were gained from the biomass as
the only measured indicator of fungal activity. Nevertheless, it was advantageous to consider
several indicators, since decomposition activity does not necessarily increase under the
same conditions like fungal growth. The intention was to find characteristics as a result of
different cultivation conditions. The data are a reference for any in situ studies using stable N
isotopes. Under laboratory conditions in limited medium, the 15N fixation rates of well-
described organisms from strain collection can be regarded as a positive control. These data
ensured that the experimental setup was appropriate.
Discussion
71
4.10. Implications for applied wood protection
Experiments revealed that the N availability is a critical issue for the development of
saprotrophs and bacteria on wood. Nevertheless, it is not the only factor that affects the
development of spoilage organisms. Further nutrients and in particular moisture determine
decomposition. Generally, the protection of wood from N and nutrient sources is recommend-
ed. This conclusion is drawn, since the addition of organic N, e.g., peptone (Fig. 12 to 15) or
yeast extract (Fig. 9 to 11), supported the growth of the tested saprotrophs. The preferences
for N sources may differ according to fungal species. Besides, wood initially comprises traces
of N, which was approved by the elemental composition of aqueous wood extracts.
The tested basidiomycetes had a low N content compared to bacteria. This underlines,
that the specific N demand of wood-decomposing fungi is low. The amount of N, which is
required for growth, can be provided by minor spoilage after a prolonged time of usage or
exposure to N sources. Numerous sources can be imagined. To protect wood from spoilage
with N, an appropriate surface treatment could be advantageous. Aeration may further be
advantageous for wood protection, since the experiments showed that N2 in the gas
atmosphere reduced the laccase activity of T. versicolor, but aeration may also be
disadvantageous, because the exposure to air may include exposure to N-containing
particles, such as dust or pollen. Another important parameter for the growth of fungi on
wood is the moisture. In experiments, equal and high moisture was provided, but in situ the
moisture could affect the fungal activity significantly independent of the N concentration.
Although several bacteria species can decompose wood, the present study did not
approve the particular importance of diazotrophic bacteria. The hypothesis of enhanced
wood decomposition during fungal-bacterial co-existence was not supported. There are
several reasons: Firstly, fungi and bacteria use several N sources, and N2 is usually not the
only source. Thus, fungal-bacterial competition is prevalent. Secondly, the environment of
fungi usually reduces the number of bacteria, and therefore bacteria need a sort of protection
if they coexist with fungi. Diazotrophs could be protected within the hyphae of the fungal
mycelium. So far, such endomycelial bacteria have not been found for the chosen organisms
from strain collections. Since the effect of diazotrophs was only marginally in the test
experiments, the protection against bacteria is not recommended. It can be denied that the
durability of wood is improved if bacterial decomposition is prevented. Antibacterial wood
repellents can prevent any bacterial growth, but they can also support bacteria with
resistance to antibiotics including those that are prevalent but not relevant for the material’s
decomposition. These resistant bacteria must be considered as a risk for human health.
Therefore, the treatment of wood with antibacterial repellents includes disadvantages apart
from the protection against decay.
Conclusion
72 BAM-Dissertationsreihe
5. Conclusion
In this work, the N uptake during fungal-bacterial interactions was investigated. Saprotrophic
basidiomycetes and diazotrophic bacteria from strain collections were analysed to gain
elementary information on microbial N uptake. Elemental analysis combined with isotope
ratio mass spectrometry allowed to quantify N isotopes in dry biomass and to determine δ15N
values. Such reference data from laboratory studies are useful for any environmental 15N
tracing studies, including more advanced instrumental approaches. In addition, experiments
according to experimental plans revealed the effects of different N sources which occur at the
same time. With both approaches, the N sources of fungi were investigated, and the impact
of diazotrophs on fungi was estimated.
The first finding was that the N content in fungal biomass is usually low compared to
bacterial biomass and variable according to the nutrient availability. Regarding 15N-tracing
experiments, these low N concentrations in fungal biomass are challenging. The applied
method of elemental analysis and subsequent IRMS was optimised for correct isotope
quantification in fungal biomass. Methods which include more purification steps bear the risk
of isotope dilution. Secondly, diazotrophic bacteria fixed N2 at different rates and used N
sources in addition to N2. If organic N is available, N2 fixation is usually reduced compared to
N-limited conditions. Consequently, the bacterial N2 fixation contributes less to the
bioavailability of N on decomposing wood than expected according to the hypothesis
described (Fig. 1). In situ further N sources may be provided by soil, plant litter spoilage or by
initial N of particular wood species. Thirdly, diazotrophic-saprotrophic interactions just
occurred under particular conditions, and the interaction was not mandatory for both species.
Although bacterial N2 fixation and transfer into fungal biomass was possible, a significant
increase in fungal activity and wood decomposition was not affirmed. A prerequisite for
fungal-bacterial interactions is the physiological ability of bacteria to survive in the acidic and
oxidative environment of fungi. For example, the bacterium B. acida developed biomass in
the presence of either O. placenta or T. versicolor and transferred fixed N2 to both fungi.
Because of its strong spatial growth, the fungal growth was inhibited and the increase of
wood decomposition was not approved.
Environmental studies suggested that diazotrophic bacteria predominantly coexist with
white-rot fungi and in particular, the bacterial community, which coexisted with H. fasciculare,
was analysed. H. fasciculare and the coexisting bacteria were well adjusted to N-limited
environments and even developed biomass on traces of organic N in RBA medium.
Interestingly, H. fasciculare and coexisting bacteria preferred the same N sources for the
formation of their biomass, and the bacteria fixed atmospheric N2 only to a low extent without
further reduction to ammonia. Thus, fungal-bacterial competition for the same N sources is
Conclusion
73
supposed to prevail in nature. As a consequence, wood decomposition is not intensified at
coexistence of fungi and bacteria.
If bacteria with strong diazotrophic activity existed in the environment of saprotrophs,
acceleration of decomposition was possible. In in vitro experiments, the composition of the
media determined the N content in bacteria and the N2-fixation activity of diazotrophs. Even
in diazotrophs with high N2-assimilation rates, the abundance of N assimilated from
atmospheric N2 did not exceed 13% of the N in the bacterial biomass. So, the hypothesis of
an increase of wood decomposition by fungal-bacterial interaction was not approved. The
effect of the increased demand in ATP was smaller than expected, since further N sources
were assimilated. The high demand in ATP, which is needed for the nitrogenase-catalysed
reaction, explains why N2 fixation usually does not cover the full bacterial demand in N. In
addition, the mycosphere of strong decomposers limited bacterial growth, and an exomycelial
association is improbable. Therefore, a stable interaction of wood-decomposing fungi and
diazotrophs would require endomycelial diazotrophs. Such associations occur among lichen,
e.g., Lobaria sp., and isotope tracing techniques would be appropriate to quantify the N2
fixation by endomycelial diazotrophs if an appropriate experimental setup for the exposure to 15N was found (e.g., Millbank and Olsen 1981).
In conclusion, the impact of diazotrophs on saprotrophic fungi might be of particular
importance in natural ecosystems and forest soils, but it is of minor relevance for applied
sapwood or timber protection. Frequently found material spoilage organisms are adapted to
N traces, which can be provided by minor spoilage. The fixation of atmospheric N2 is thus of
minor relevance for the N supply in domestic environments and on materials. Regarding
applied timber protection, the exposure of wood to N is usually one of several conditions that
determine the decomposability. Generally, it is advantageous to protect wood against N
sources, such as soil, plant litter, contaminated water or atmospheric deposition. Since N
from several sources is assimilated, the critical concentration for the initiation of
decomposition is very low. Appropriate surface treatments are advantageous if they prevent
nutrient enrichment but do not capture humidity. A protection against bacteria is not
recommended for wood without contact to soil, since the decomposition activity by bacteria is
marginal, and a strong effect of bacteria on wood decomposition by fungi was not approved
in experiments.
Outlook
74 BAM-Dissertationsreihe
6. Outlook
This study underlined that the elemental composition and isotope ratios in microbial biomass
can provide information that are not available by molecular biological analysis. The results
allow to study ecological food webs and to identify nutrient sources. Elemental analysis and
isotope ratio mass spectrometry are applicable to any kind of biomass, and experiments can
be further supported by the utilization of 15N-labelled substrates. EA combined with IRMS is
optimised for the correct quantification of N isotopes in biomass. If more detailed information
on the target molecules in fungal or bacterial biomass was of interest, chromatographic
methods could provide the necessary separation. The combination of gas chromatography or
high-pressure liquid chromatography to IRMS via a combustion interface allows determining
δ15N values of molecules. Nevertheless, limitations must be considered, since N occurs in
low quantities in microbial biomass and biomolecules. N-tracing methods could target on
amino acids or amino carbohydrates, such as chitin.
Applied wood or materials protection could benefit from measurements on the N contents
on and in materials if the N source can be identified. Materials which provide nutrients and
high N concentrations must be considered as susceptible to microbial decomposition. The
decomposability should be taken into consideration during the choice of the raw material,
since fast decomposing materials are not suitable for many applications. If necessary,
appropriate ways of materials protection should be considered or more durable materials
should be applied.
Regarding forest ecosystems and forest soil quality, further investigations of fungal-
bacterial interactions could be of high value for understanding the N cycle in natural
ecosystems. Since forests are of high ecologic and economic value, a detailed knowledge on
the soil quality could help to ensure the functioning of ecosystems on the background of
increasing deposition of anthropogenic N. Further studies could target on the identification of
relevant bacterial species, changes in the microbial structure or by applying the 15N-tracing
technique to environmental samples. Derelict land becoming a forest ecosystem could be
another interesting site for N-tracing studies. In particular, studies on diazotrophic, soil-
fertilising bacteria as part of diverse fungal-bacterial communities could be of interest.
References
75
7. References
Aber, J.D., Magill, A.H., 2004. Chronic nitrogen additions at the Harvard Forest (USA): the first 15 years of a nitrogen saturation experiment. Forest Ecology and Management, 196,1–5. Addison, S.L., Foote, S.M., Reid, N.M., Lloyd-Jones, G., 2007. Novosphingobium nitrogenifigens sp. nov., a polyhydroxyalkanoate-accumulating diazotroph isolated from a New Zealand pulp and paper wastewater. International Journal of Systematic and Evolutionary Microbiology, 57, 2467–2471. Ahmadjian, V., 1993. The Lichen Symbiosis. Wiley, New York. Ahmadjian, V., Paracer, S., 1986. Symbiosis - An Introduction to Biological Associations. University Press of New England, London. Aho, P.E., Seidler, R.J., Evans, H.J., Raju, P.N., 1974. Distribution, enumeration, and identification of nitrogen-fixing bacteria associated with decay in living white fir trees. Phytopathology, 64, 1413–1974. Antoine, M.E., 2004. An ecophysiological approach to quantifying nitrogen fixation by Lobaria oregana. Bryologist, 107, 82–87. Atlas, R.M., (ed.), 1997. Handbook of microbiological media. 2nd ed. CRC Press, New York. Baldrian, P., 2008. Enzymes of saprotrophic basidiomycetes. In: Boddy, L., Frankland, J.C., van West, P. (eds.), Ecology of saprotrophic basidiomycetes, 1st ed. Elsevier, Amsterdam, pp. 143–153. Baldrian, P., Valášková, V., 2008. Degradation of cellulose by basidiomycetous fungi. FEMS Microbiological Reviews, 32, 501–521. Barney, B.M., McClead, J., Lukoyanov, D., Laryukhin, M., Yang, T.-C., Dean, D.R., Hoffmann, B.M., Seefeldt, L.C., 2007. Diazene (HN=NH) is a substrate for nitrogenase: Insights into the pathway of N2 reduction. Biochemistry, 46, 6784–6794. Bates, S.T., Cropsey, G.W.G., Caporaso, J.G., Knight, R., Fierer, N., 2011. Bacterial communities associated with the lichen symbiosis. Applied and Environmental Microbiology, 77, 1309–1314. Bebber, D.P., Watkinson, S.C., Boddy, L., Darrah, P.R., 2011. Simulated nitrogen deposition affects wood decomposition by cord-forming fungi. Oecologia, 167, 1177–1184. Bergersen, F.J., 1980. Measurement of nitrogen fixation by direct means. In: Bergersen, F.J. (ed.), Methods for evaluating Biological Nitrogen Fixation. John Wiley and Sons, Chichester, pp. 65–110. Blaich, R., Esser, K., 1975. Function of enzymes in wood destroying fungi. II. Multiple forms of laccase in white rot fungi. Archives of Microbiology, 103, 271–277. Blanchette, R.A., 2000. A review of microbial deterioration found in archaeological wood from different environments. International Biodeterioration and Biodegradation, 46, 189–204. Boddy, L., Frankland, J.C., van West, P., 2008. Ecology of saprotrophic basidiomycetes, 1st ed. Elsevier, Amsterdam. Boddy, L., Jones, T.H., 2008. Interactions between basidiomycota and invertebrates. In: Boddy, L., Frankland, J.C., van West, P. (eds.), Ecology of saprotrophic basidiomycetes, 1st ed. Elsevier, Amsterdam, pp. 155–179. Bourbonnais, R., Paice, M.G., 1990. Oxidation of non-phenolic substrates. An expanded role for laccase in lignin biodegradation. FEBS Letters, 267, 99–102. Boyle, D., 1998. Nutritional factors limiting the growth of Lentinula edodes and other white-rot fungi in wood. Soil Biology and Biochemistry, 30, 817–823.

References
76 BAM-Dissertationsreihe
JCGM 100, 2008. Evaluation of measurement data – Guide to the expression of uncertainty in measurement (GUM). Bureau International des Poids et Mesures (BIPM), Paris. Burgess, B.K., Lowe, D.J., 1996. Mechanism of molybdenum nitrogenase. Chemical Reviews, 96, 2983–3011. Bürgmann, H., Widmer, F., von Sigler, W., Zeyer, J., 2004. New molecular screening tools for analysis of free-living diazotrophs in soil. Applied Environmental Microbiology, 70, 240–247. Burris, R.H., Miller, C.E., 1941. Application of 15N to the study of biological nitrogen fixation. Science, 93, 114–115. Carreiro, M.M., Sinsabaugh, R.L., Repert, D.A., Parkhurst, D.F., 2000. Microbial enzyme shifts explain litter decay responses to simulated nitrogen deposition. Ecology, 81, 2359–2365. Claus, D., Hempel, W., 1970. Specific substrates for isolation and differentiation of Azotobacter vinelandii. Archives of Microbiology, 73, 90–96. Clausen, C.A., 1996. Bacterial associations with decaying wood: a Review. International Biodeterioration and Biodegradation, 37, 101–107. Daniel, G., Nilsson, T., 1986. Ultrastructural observations on wood – degrading erosion bacteria. The International Research Group on Wood Preservation, Document No.: IRG/WP 86–1283. Danso, S.K.A., Hardarson, G., Zapata, F., 1993. Misconceptions and practical problems in the use of 15N soil enrichment techniques for estimating N2 fixation. Plant and Soil, 152, 25–52. Deakin, W.J., Broughton, W.J., 2009. Symbiotic use of pathogenic strategies: rhizobial protein secretion systems. Nature Reviews Microbiology, 7, 312–320. de Bary, A.H., 1879. Die Erscheinung der Symbiose, Verlag Karl J. Trubner, Strasbourg. de Boer, W., Folman, L.B., Klein Gunnewiek, P.J.A., Svensson, T., Bastviken, D., Oeberg, G., del Rio, J.C., Boddy, L., 2010. Mechanism of antibacterial activity of the white-rot fungus Hypholoma fasciculare colonizing wood. Canadian Journal of Microbiology, 56, 380–388. de Boer, W., Folman, L.B., Summerbell, R.C., Boddy, L., 2005. Living in a fungal world: impact on fungi on soil bacterial niche development. FEMS Microbiology Reviews, 29, 795–811. de Boer, W., van der Wal, A., 2008. Interactions between saprotrophic basidiomycetes and bacteria. In: Boddy, L., Frankland, J.C., van West, P. (eds.), Ecology of saprotrophic basidiomycetes, 1st ed. Elsevier, Amsterdam, pp. 143–153. De Laeter, J.R., Böhlke, J.K., De Bièvre, P., Hidaka, H., Peiser, H.S., Rosman, K.J.R., Taylor, P.D.P., 2003. Atomic weights of the elements: Review 2000 (IUPAC Technical Report). Pure and Applied Chemistry, 75, 683–800. Deutsches Institut für Normung e.V., 1996. DIN EN 113 Wood preservatives - Method of test for determining the protective effectiveness against wood destroying basidiomycetes - Determination of the toxic values. Beuth Verlag GmbH, Berlin. Deutsches Institut für Normung e.V., 2008. DIN CEN/TS 839 Wood preservatives - Determination of the protective effectiveness against wood destroying basidiomycetes - Application by surface treatment. Beuth Verlag GmbH, Berlin. Deutsches Institut für Normung e.V., 1996. DIN 1319-3 Fundamentals of metrology - Part 3: Evaluation of measurements of a single measurand, measurement uncertainty. NATG 152 Normenausschuss Technische Grundlagen (eds.), Beuth Verlag GmbH, Berlin. Deutsches Institut für Normung e.V., 1979. DIN ISO 2533 Standard Atmosphere. Beuth Verlag GmbH, Berlin.

References
77
Deutsches Institut für Normung e.V., 1979. DIN EN ISO 3188 Starches and derived products - Determination of nitrogen content by the Kjeldahl method - Titrimetric method (ISO 3188:1978), Beuth Verlag GmbH, Berlin. Deutsches Institut für Normung e.V., 2006. DIN EN ISO 17665-1 Sterilization of health care products - Moist heat - Part 1: Requirements for the development, validation and routine control of a sterilization process for medical devices, Beuth Verlag GmbH, Berlin. Deutsches Institut für Normung e.V., 1978. DIN 52186 Testing of wood; bending test. Fachnormenausschuss Materialprüfung (FNM) im DIN, Beuth Verlag GmbH, Berlin. Duc, L., Noll, M., Meier, B.E., Bürgmann, H., Zeyer, J., 2009. High diversity of diazotrophs in the forefield of a receding alpine glacier. Microbiology Ecology, 57, 179–190. Eastwood, D.C., Floudas, D., Binder, M., Majcherczyk, A., Schneider, P., Aerts, A., Asiegbu, F.O., Baker, S.E., Barry, K., Bendiksby, M., Blumentritt, M., Coutinho, P.M., Cullen, D., de Vries, R.P., Gathman, A., Goodell, B., Henrissat, P.M., Ihrmark, K., Kauserud, H., Kohler, A., LaButti, K., Lapidus, A., Lavin, J.L., Lee, Y.-H., Linquist, E., Lilly, W., Lucas, S., Morin, E., Murat, C., Oguiza, J.A., Park, J., Pisabarro, A.G., Riley, R., Rosling, A., Salamov, A., Schmidt, O., Schmutz, J., Skrede, J., Stenlid, J., Wiebenga, A., Xie, X., Kües, U., Hibbett, D.S., Hoffmeister, D., Högberg, N., Martin, F., Grigoriev, I.V., Watkinson, S.C., 2011. The plant cell wall-decomposing machinery underlies the functional diversity of forest fungi, Science, 333, 762–765. Elisashvili, V., Kachlishvili, E., 2009. Physiological regulation of laccase and manganese peroxidase production by white-rot basidiomycetes. Journal of Biotechnology, 144, 37–42. Emmerton, K.S., Callaghan, T.V., Jones, H.E., Leake, J.R., Michelsen, A., Read, D.J., 2001a. Assimilation and isotopic fractionation of nitrogen by mycorrhizal fungi. New Phytologist, 151, 503–511. Emmerton, K.S., Callaghan, T.V., Jones, H.E., Leake, J.R., Michelsen, A., Read, D.J., 2001b. Assimilation and isotopic fractionation of nitrogen by mycorrhizal and nonmycorrhizal subarctic plants. New Phytologist, 151, 513–524. Fisher, R.A., 1935. The Design of Experiments. Oliver and Boyd, Edinburgh. Folman, L.B., Klein Gunnewiek, P.J.A., Boddy, L., de Boer, W., 2008. Impact of white-rot fungi on numbers and community composition of bacteria colonizing beech wood from forest soil. FEMS Microbiology Ecology, 63, 181–191. Fog, K., 1988. The effect of added nitrogen on the rate of decomposition of organic-matter. Biological Reviews of the Cambridge Philosophical Society, 63, 433–462. Frey, S.D., Knorr, M., Parrent, J.L., Simpson, R.T., 2004. Chronic nitrogen enrichment affects the structure and function of the soil microbial community in temperate hardwood and pine forests, Forest Ecology and Management, 196, 159–171. Frey-Klett, P., Garbaye, J., Tarkka, M., 2007. The mycorrhiza helper bacteria revisited. New Phytologist, 176, 22–36. Frey-Klett, P., Burlinson, P., Deveau, A., Barret, M., Tarkka, M., Sarniguet, A., 2011. Bacterial-fungal interactions: Hyphens between agricultural, clinical, environmental, and food microbiologists. Microbiology and Molecular Biological Research, 75, 583–609. Gadd, G.M., 2007. Geomycology: biogeochemical transformations of rocks, minerals, metals and radionuclides by fungi, bioweathering and bioremediation. Mycological Research, 111, 3–49. Galloway, J.N., Dentener, F.J., Capone, D.G., Boyer, E.W., Howarth, R.W., Seitzinger, S.P., Asner, G.P., Cleveland, C.C., Green, P.A., Holland, E.A., Karl, D.M., Michaels, A.F., Porter, J.H., Townsend, A.R., Vörösmarty, C.J., 2004. Nitrogen cycles: past, present, and future Biogeochemistry, 70, 153–226.
References
78 BAM-Dissertationsreihe
Garbaye, J., 1994. Tansley Review No. 76 Helper bacteria: a new dimension to the mycorrhizal symbiosis. New Phytologist, 128, 197–210. Gärdenäs, A.I., Ågren, G.I., Bird, J.A., Clarholm, M., Hallin, S, Ineson, P., Kätterer, T., Knicker, H., Nilsson, S.I., Näsholm, T., Ogle, S., Paustian, K., Persson, T., Stendahl, J., 2011. Knowledge gaps in soil carbon and nitrogen interactions – From molecular to global scale. Soil Biology and Biochemistry, 43, 702–717. Gebauer, G., Taylor, A.F.S., 1999. 15N natural abundance in fruit bodies of different functional groups of fungi in relation to substrate utilization. New Phytologist, 142, 93–101. Gelbrich, J., Mai, C., Militz, H., 2008. Chemical changes in wood degraded by bacteria. International Biodeterioration and Biodegradation, 61, 24–32. Godin, J.-P., Fay, L.-B., Hopfgartner, G., 2007. Liquid chromatography combined with mass Spectrometry for 13C isotopic analysis in life science research. Mass Spectrometry Reviews, 26, 751–774. Greaves, H., 1971. The bacterial factor in wood decay. Wood Science and Technology, 5, 6–16. Grinda, M., 1997. Some experiences with attack of microorganisms on wooden constructions supporting foundations of houses and bridges, The International Research Group on Wood Preservation. Document No.: IRG/WP 97-10232. Gundersen, P., Emmet, B.A., Kjønaas, O.J., Koopmans, C.J., Tietema, A., 1998. Impact of nitrogen deposition on nitrogen cycling in forests: a synthesis of NITREX data. Forest Ecology Management, 101, 37–55. Hardarson, G., Zapata, F., Danso, S.K.A., 1984. Effect of plant genotype and nitrogen fertilizer on symbiotic nitrogen fixation by soybean cultivars. Plant and Soil, 82, 397–405. Hardy, R.W.F., Holsten, R.D., Jackson, E.K., Burns, R.C., 1968. The acetylene-ethylene assay for N2 fixation: Laboratory and field evaluation. Plant Physiology, 43, 1185–1207. He, H., Xie, H., Zhang, X., 2006. A novel GC/MS technique to assess 15N and 13C incorporation into soil amino sugars. Soil Biology and Biochemistry, 38, 1083–1091. Hedayat, A., Wallis, W.D., 1978. Hadamard matrices and their applications. The Annals of Statistics, 6, 1184–1238. Hilger, F., 1964. Comportement des bactéries fixatrices d'azote du genre Beijerinckia a l'égard du pH et du calcium. Annals Institute Pasteur (Paris), 106, 279–291. Hobbie, E.A., Hobbie, J.E., 2008. Natural abundance of 15N in nitrogen-limited forests and tundra can estimate nitrogen cycling through mycorrhizal fungi: A Review. Ecosystems, 11, 815–830. Hobbie, E.A., Macko, S.A., Shugart, H.H., 1999. Insights into nitrogen and carbon dynamics of ectomycorrhizal and saprotrophic fungi from isotopic evidence. Oecologia, 118, 353–360. Hobbie, E.A., Sánchez, F.S., Rygiewicz, P.T., 2004. Carbon use, nitrogen use, and isotopic fractionation of ectomycorrhizal and saprotrophic fungi in natural abundance and 13C-labelled cultures. Mycological Research, 108, 725–736. Hobbie, J.E., Hobbie, E.A., 2006. 15N in symbiotic fungi and plants estimates nitrogen and carbon flux rates in arctic tundra. Ecology, 87, 816–822. Hoefs, J., 2009. Stable Isotope Geochemistry, 6th ed. Springer, Heidelberg. Hoffmann, B.M., Dean, D.R., Seefeldt, L.C., 2009. Climbing nitrogenase: Toward a mechanism of enzymatic nitrogen fixation. Accounts of Chemical Research, 42, 609–619. Hofrichter, M., 2002. Review: lignin conversion by manganese peroxidase (MnP). Enzyme and Microbial Technology, 30, 454–466.
References
79
Högberg, P., 1997. Tansley Review No. 95 - 15N natural abundance in soil-plant systems. New Phytologist, 137, 179–203. Högberg, P., Högberg, M.N., Quist, M.E., Ekblad, A., Näsholm, T., 1999. Nitrogen isotope fractionation during nitrogen uptake by ectomycorrhizal and non-mycorrhizal Pinus sylvestris. New Phytologist, 142, 569–576. Högberg, P., Högbom, L., Schinkel, H., Högberg, M., Johannisson, C., Wallmark, H., 1996. 15N abundance of surface soils, roots and mycorrhizas in profiles of European forest soils. Oecologia, 108, 207–214. Högberg, P., Johannisson, C., Yarwood, S., Callesen, I., Näsholm, T., Myrold, D.D., Högberg, M.N., 2011. Recovery of ectomycorrhiza after ‘nitrogen saturation’ of a conifer forest. New Phytologist, 189, 515–525. Högberg, P., Näsholm, T., Högbom, L., Stahl, L., 1994. Use of 15N labelling and 15N natural abundance to quantify the role of mycorrhizas in N uptake by plants: importance of seed N and of changes in the 15N labelling of available N. New Phytologist, 127, 515–519. Houlton, B.Z., Wang, Y.-P., Vitousek, P.M., Field, C.B., 2008. A unifying framework for dinitrogen fixation in the terrestrial biosphere. Nature, 454, 327–331. Jacques, P., Hbid, C., Destain, J., Razafindralambo, H., Paquot, M., De Pauw, E., Thonart, P., 1999. Optimization of biosurfactant lipopeptide production from Bacillus subtilis S499 by Plackett-Burman Design. Applied Biochemistry and Biotechnology, 77, 223–233. Jakobs-Schönwandt, D., Mathies, H., Abraham, W.-R., Pritzkow, W., Stephan, I., Noll, M., 2010. Biodegradation of a biocide (Cu-N-Cyclohexyldiazenium Dioxide) component of a wood preservative by a defined soil bacterial community. Applied and Environmental Microbiology, 76, 8076–8083. Jehmlich, N., Schmidt, F., von Bergen, M., Richnow, H.-H., Vogt, C., 2008. Protein-based stable isotope probing (Protein-SIP) reveals active species within anoxic mixed cultures. The ISME Journal, 2, 1122–1133. Jetten, M.S.M., 2008. The microbial nitrogen cycle. Environmental Microbiology, 10, 2903–2909. Jin, I., Nicholas, D.D., Kirk, T.K., 1990. Mineralization of the methoxyl carbon of isolated lignin by brown-rot fungi under solid substrate conditions. Wood Science and Technology, 24, 263–276. Jordan, B.A., Schmidt, E.L., 2000. Site characteristics impacting historic waterlogged wood: A review. The International Research Group on Wood Preservation, Document No.: IRG/WP 00-10344. Junk, G., Svec, H.J., 1958. The absolute abundance of the nitrogen isotopes in the atmosphere and compressed gas from various sources. Geochimica et Cosmochimica Acta, 14, 234–243. Jurgensen, M.F., Larsen, M.J., Spano, S.D., Harvey, A.E., Gale, M.R., 1984. Nitrogen fixation associated with increased wood decay in Douglas-fir residue. Forest Science, 30, 1038–44. Jurgensen, M.F., Larsen, M.J., Wolosiewicz, M., Harvey, A.E., 1989. A comparison of dinitrogen fixation rates in wood litter decayed by white-rot and brown-rot fungi. Plant and Soil, 115, 117–122. Kaldorf, M., Koch, B., Rexer, K.H., Kost, G., Varma, A., 2005. Patterns of interaction between Populus Esch5 and Piriformospora indica: A Transition from mutualism to antagonism. Plant Biology, 7, 210–218. Kirk, T.K., 1987. Enzymatic “combustion”: The microbial degradation of lignin. Annual Reviews of Microbiology, 41, 465–505.
References
80 BAM-Dissertationsreihe
Kleppmann, W., 2008. Taschenbuch Versuchsplanung - Produkte und Prozesse optimieren, 5th ed. Carl Hanser Verlag, München. Landy, E.T., Mitchell, J.I., Hotchkiss, S., Eaton, R.A., 2008. Bacterial diversity associated with archaeological waterlogged wood: Ribosomal RNA clone libraries and denaturing gradient gel electrophoresis (DGGE). International Biodeterioration and Biodegradation, 61, 106–116. Levi, M.P., Cowling, E.B., 1969. Role of nitrogen in wood deterioration VII. Physiological adaptation of wood-destroying and other fungi to substrates deficient in nitrogen. Phytopathology, 59, 460–468. Li, C.Y., Massicote, H.B., Moore, L.V.H., 1992. Nitrogen-fixing Bacillus sp. associated with Douglas-fir tuberculate ectomycorrhizae. Plant and Soil, 140, 35–40. Lilly, V.G., Barnett, H.L., 1951. Physiology of the fungi. McGraw-Hill Book Company, New York. Lindahl, B.D., Olsson, S., 2004. Fungal translocation – creating and responding to environmental heterogeneity. Mycologist, 18, 79–88. Lowe, D.J., Thorneley, R.N.F., 1984. The mechanism of Klebsielle pneumonia nitrogenase action, Pre-steady-state kinetics of H2 formation. Biochemical Journal, 224, 877–886. Lucic, E., Fourrey, C., Kohler, A., Martin, F., Chalot, M., Brun-Jacob, A., 2008. A gene repertoire for nitrogen transporters in Laccaria bicolor. New Phytologist, 180, 343–364. Macko, S.A., Uhle, M.E., Engel, M.H., Andrusevich, V., 1997. Stable nitrogen isotope analysis of amino acid enantiomers by gas chromatography/combustion/isotope ratio mass spectrometry. Analytical Chemistry, 69, 926–929. Martínez, D., Challacombe, J., Morgenstern, I., Hibbett, D., Schmoll, M., Kubicek, C.P., Ferreira, P., Ruiz-Dueñas, F.J., Martínez, A.T., Kersten, P., Hammel, K.E., Van den Wymelenberg, A., Gaskell, J., Lindquist, E., Sabat, G., Splinter BonDurant, S., Larrondo, L.F., Canessa, P., Vicuña, R., Yadav, J., Doddapaneni, H., Subramanian, V., Pisabarro, A.G., Lavín, J.L., Oguiza, J.A., Master, M., Henrissat, B., Coutinho, P.M., Harris, P., Magnuson, J.K., Baker, S.E., Bruno, K., Kenealy, W., Hoegger, P.J., Kües, U., Ramaiya, P., Lucas, S., Salamov, A., Shapiro, H., Tu, H., Chee, C.L., Misra, M., Xie, G., Teter, S., Yaver, D., James, T., Mokrejs, M., Pospíšek, M., Grigoriev, I.V., Brettin, T., Rokhsar, D., Berka, R., Cullen, D., 2009. Genome, transcriptome, and secretome analysis of wood decay fungus Postia placenta supports unique mechanisms of lignocelluloses conversion. Proceedings of the National Academy of Science of the United States of America, 106, 1954–1959. Meier-Augenstein, W., 1999. Applied gas chromatography coupled to isotope ratio mass spectrometry. Journal of Chromatography A, 842, 351–371. Metges, C.C., Petzke, K.-J., Hennig, U., 1996. Gas chromatography combustion isotope ratio mass spectrometric comparison of N-acetyl- and N-pivaloyl amino acid esters to measure 15N isotopic abundances in physiological samples: A pilot study on amino acid synthesis in the upper gastro-intestinal tract of minipigs. Journal of Mass Spectrometry, 31, 367–376. Mikiashvili, N., Elisashvili, V., Wasser, S., Nevo, E., 2005. Carbon and nitrogen sources influence the ligninolytic enzyme activity of Trametes versicolor. Biotechnology Letters, 27, 955–959. Miransari, M., 2011. Interactions between arbuscular mycorrhizal fungi and soil bacteria. Applied Microbiology Biotechnology, 89, 917–930. Millbank, J.W., Olsen, J.D., 1981. The assessment of nitrogen fixation and throughput by lichen II. Construction of an enclosed growth chamber for the use of 15N2. New Phytologist, 89, 657–665.

References
81
Naumann, A., Navarro-González, M., Peddireddi, S., Kües, U., Polle, A., 2005. Fourier transform infrared microscopy and imaging: Detection of fungi in wood. Fungal Genetics and Biology, 42, 829–835. Niemenmaa, O., Uusi-Rauva, A., Hatakka, A., 2008. Demethoxylation of [O14CH3]-labelled lignin model compounds by the brown-rot fungi Gloeophyllum trabeum and Poria (Postia) placenta. Biodegradation, 19, 555–565. Nilsson, T., Björdal, C., Fällman, E., 2008. Culturing erosion bacteria: Procedures for obtaining purer cultures and pure strains. International Biodeterioration and Biodegradation, 61, 17–23. Nilsson, T., Daniel, G., 1983. Tunnelling bacteria. The International Research Group on Wood Preservation. Document No.: IRG/WP 83–1183. Ohyama, T., Kumazawa, K., 1981. A simple method for the preparation, purification and storage of (N2)-N-15 gas for biological nitrogen-fixation studies. Soil Science and Plant Nutrition, 27, 263–265. Olsson, I.-M., Johansson, E., Berntsson, M., Eriksson, L., Gottfries, J., Wold, S., 2006. Rational DOE protocols for 96-well plates. Chemometrics and Intelligent Laboratory Systems, 83, 66–74. Paajanen, L., Viitanen, H., 1988. Microbial degradation of wooden piles in building foundations. The International Research Group on Wood Preservation. Document No.: IRG/WP/88–1370. Perez-Moreno, J., Read, D.J., 2001. Exploitation of pollen by mycorrhizal mycelia systems with special reference to nutrient recycling in boreal forests. Proceedings of the Royal Society B, 268, 1329–1335. Petzke, K.J., Boeing, H., Metges, C.C., 2005. Choice of dietary protein of vegetarians and omnivores is reflected in their hair protein 13C and 15N abundance. Rapid Communication in Mass Spectrometry, 19, 1392–1400. Plackett, R.L., Burman, J.P., 1946. The design of optimal multifactorial experiments. Biometrika, 33, 305–325. Qi, H., Coplen, T.B., Geilmann, H., Brand, W.A., Böhlke, J.K., 2003. Two new organic reference materials for δ13C and δ15N measurements and a new value for the δ13C of NBS 22 oil. Rapid Communication in Mass Spectrometry, 17, 2483–2487. Read, D.J., Perez-Moreno, J., 2003. Mycorrhizas and nutrient cycling in ecosystems – a journey towards relevance? New Phytologist, 157, 475–429. Retzlaff, G., Rust, G., Waibel, J., 1978. Statistische Versuchsplanung – Planung naturwissenschaftlicher Experimente und ihre Auswertung mit statistischen Methoden, 2nd ed. Verlag Chemie, Weinheim. Robbins, W.J., 1937. The assimilation by plants of various forms of nitrogen. American Journal of Botany, 24, 243–250. Rösch, C., Bothe, H., 2005. Improved assessment of denitrifying, N2-fixing, and total-community bacteria by Terminal Restriction Fragment Length Polymorphism analysis using multiple restriction enzymes. Applied and Environmental Microbiology, 71, 2026–2035. Ryan, F.J., Beadle, G.W., Tatum, E.L., 1943. The tube method of measuring the growth rate of neurospora. American Journal of Botany, 30, 784–799. Saiya-Cork, K.R., Sinsabaugh, R.L., Zak, D.R., 2002. The effects of long term nitrogen deposition on extracellular enzyme activity in an Acer saccharum forest soil. Soil Biology and Biochemistry, 34, 1309–1315.

References
82 BAM-Dissertationsreihe
Schneider, T., Schmid, E., de Castro Jr., J.V., Cardinale, M., Eberl, L., Grube, M., Berg, G., Riedel, K., 2011. Structure and function of the symbiosis partners of the lung lichen (Lobaria pulmonaria L. Hoffm.) analyzed by metaproteomics. Proteomics, 11, 2752–2756. Schmidt, O., 2006. Wood and Tree Fungi: Biology, Damage, Protection, and Use. Springer, Berlin. Shearer, G., Kohl, D.H., 1989. Estimates of N2 fixation in ecosystems: The need for and basis of the 15N natural abundance method. In: Rundel, P.W., Ehleringer, J.R., Nagy, K.A., (eds.), Stable Isotopes in Ecological Research, Springer, Berlin, pp. 343–374. Shearer, G., Kohl, D.H., 1993. Natural abundance of 15N: Fractional contribution of two sources to a common sink and use of isotope discrimination. In: Knowles, R., Blackburn, T.H., (eds.), Nitrogen Isotope Techniques, Academic Press Inc., San Diego, pp. 89–125. Sinsabaugh, R.L., Carreiro, M., Repert, D., 2002. Allocation of extracellular enzymatic activity in relation to litter composition, N deposition, and mass loss. Biogeochemistry, 60, 1–24. Stephan, I., Göller, S., Rudolph, D., 2000. Improvements of monitoring the effects of soil organisms on wood in ground contact. European Journal of Wood and Wood Products, 58, 115–119. Streichan, M., Schink, B., 1986. Microbial populations in wet wood of European white-fir (Abies alba Mill.). FEMS Microbiology Ecology, 38, 141–150. Sørensen, S.P.L., 1909. Enzymstudien. II: Mitteilung. Über die Messung und die Bedeutung der Wasserstoffionenkonzentration bei enzymatischen Prozessen. Biochemische Zeitschrift, 21, 131–304. Taylor, A.F.S., Högbom, L., Högberg, M., Lyon, A.J.E., Näsholm, T., Högberg, P., 1997. Natural 15N abundance in fruit bodies of ectomycorrhizal fungi from boreal forests. New Phytologist, 136, 713–720. Thiele, B., Füllner, K., Stein, N., Oldiges, M., Kuhn, A.J., Hofmann, D., 2008. Analysis of amino acids without derivatization in barley extracts by LC-MS-MS. Analytical and Bioanalytical Chemistry, 391, 2663–2672. Thorneley, R.N.F., Lowe, D.J., 1985. In: Spiro, T.G., (ed.), Molybdenum Enzymes. Wiley-Interscience, New York, p. 221. Timonen, S., Hurek, T., 2006. Characterization of culturable bacterial populations associating with Pinus sylvestris-Suillus bovinus mycorrhizospheres. Canadian Journal of Microbiology, 52, 769–778. Tlalka, M., Watkinson, S.C., Darrah, P.R., Fricker, M.D., 2002. Continuous imaging of amino-acid translocation in intact mycelia of Phanerochaete velutina reveals rapid, pulsatile fluxes. New Phytologist, 153, 173–184. Valášková, V., de Boer, W., Klein Gunnewiek, P.J.A., Pospíšek, M., Baldrian, P., 2009. Phylogenetic composition and properties of bacteria coexisting with the fungus Hypholoma fasciculare in decaying wood. ISME Journal, 3, 1218–1221. Valášková, V., Baldrian, P., 2006. Estimation of bound and free fractions of lignocellulose-degrading enzymes of wood-rotting fungi Pleurotus ostreatus, Trametes versicolor and Piptoporus betulinus. Research in Microbiology, 157, 119–124. van der Wal, A., de Boer, W., Smant, W., van Veen, J.A., 2007. Initial decay of woody fragments in soil is influenced by size, vertical position, nitrogen availability and soil origin. Plant and Soil, 301, 189–201. Virginia, R.A., Jarrell, W.M., Rundel, P.W., Shearer, G., Kohl, D.H., 1988. The use of variation in the natural abundance of 15N to assess symbiotic nitrogen fixation by woody plants. In: Rundel, P.W., Ehleringer, J.R., Nagy, K.A., (eds.), Stable Isotopes in Ecological Research, 1st ed. Springer-Verlag, Berlin, pp. 375–394.
References
83
Vogl, J., 2007. Characterization of reference materials by isotope dilution mass spectrometry. Journal of Analytical Atomic Spectrometry, 22, 475–492. Vogl, J., Pritzkow, W., 2010. Isotope dilution mass spectrometry – A primary method of measurement and its role for RM certification. Mapan - Journal of Metrology Society of India, 25, 135–164. Waldrop, M.P., Zak, D.R., Sinsabaugh, R.L., 2004. Microbial community response to nitrogen deposition in northern forest ecosystems. Soil Biology and Biochemistry, 36, 1443–1451. Warembourg, F.R., 1993. Nitrogen Fixation in Soil and Plant Systems. In: Knowles, R., Blackburn, T.H., (eds.), Nitrogen Isotope Techniques, Academic Press, Inc., San Diego, pp. 127–155. Watkinson, S., Bebber, D., Darrah, P., Fricker, M., Tlalka, M., Boddy, L., 2006. The role of wood decay fungi in the carbon and nitrogen dynamics of the forest floor. In: Gadd, G.M., (ed.), Fungi in Biogeochemical Cycles, Cambridge University Press, Cambridge, pp. 151–181. Watkinson, S.C., Davison, E.M., Bramah, J., 1981. The effect of nitrogen availability on growth and cellulolysis by Serpula lacrimans. New Phytologist, 89, 295–305. Weand, M.P., Arthur, M.A., Lovett, G.M., McCulley, R.L., Weathers, K.C., 2010. Effects of tree species and N additions on forest floor microbial communities and extracellular enzyme activities. Soil Biology and Biochemistry, 42, 2161–2173. Weißhaupt, P., Pritzkow, W., Noll, M., 2011. Nitrogen metabolism of wood decomposing basidiomycetes and their interaction with diazotrophs as revealed by IRMS. International Journal of Mass Spectrometry, 307, 225–231. Weißhaupt, P., Pritzkow, W., Noll, M., 2012. Nitrogen sources of Oligoporus placenta and Trametes versicolor evaluated in a 2³ experimental plan. Fungal Biology, 116, 81–89. White, C., Gadd, G.M., 1996. Mixed sulphate-reducing bacterial cultures for bioprecipitation of toxic metals: factorial and response-surface analysis of the effects of dilution rate, sulphate and substrate concentration. Microbiology, 142, 2197–2205. White, N.A., Boddy, L., 1992. Differential extracellular enzyme production in colonies of Coriolus versicolor, Phlebia radiata and Phlebia rufa: effect of gaseous regime. Journal of General Microbiology, 138, 2589–2598. Wolfenden, B.S., Willson, R.L., 1982. Radical-cations as reference chromogens in kinetic Studies of one-electron transfer reactions: Pulse radiolysis studies of 2,2’-azinobis-(3-ethylbenzthiazoline-6-sulphonate). Journal of the Chemical Society, Perkin Transactions 2, 7, 805–812. Wolff, J.-C., Dyckmans, B., Taylor, P.D.P., De Bièvre, P., 1996. Certification of a 15N-enriched nitrate species-specific spike isotope reference material IRMM-627. International Journal of Mass Spectrometry and Ion Processes, 156, 67–75. Zeller, B., Brechet, C., Maurice, J.-P., Le Tacon, F., 2007. 13C and 15N isotopic fractionation in trees, soils and fungi in a natural forest stand and a Norway spruce plantation. Annals of Forest Science, 64, 419–429. Zhang, X., Amelung, W., 1996. Gas chromatographic determination of muramic acid, glucosamine, mannosamine, and galactosamine in soils. Soil Biology and Biochemistry, 28, 1201–1206. Zhang, X., He, H., Amelung, W., 2007. A GC/MS method for the assessment of 15N and 13C incorporation into soil amino acid enantiomers. Soil Biology and Biochemistry, 39, 2785–2796.
Acknowledgements
84 BAM-Dissertationsreihe
8. Acknowledgements
This thesis was part of the BAM Federal Institute for Materials Research and Testing
Innovation Program. The financial, structural and professional support is highly appreciated.
Prof. Dr. Ulrich Szewzyk, Technical University of Berlin, is acknowledged for supervising my
thesis. I would like to thank him and Prof. Dr. Wolfgang Rotard for surveying the dissertation.
In addition, I would like to express my gratitude to the chairman of the examination board,
Prof. Dr. Sven-Uwe Geißen.
I wish to offer my sincere thanks to Prof. Dr. Matthias Noll and Dr. Wolfgang Pritzkow for their
mentorship, and also to Dr. Annette Naumann for her support in the later stage of my studies.
Furthermore, I would like to thank Dr. Ina Stephan, Dr. Jochen Vogl and their working groups
for their cooperation and for providing equipment. It was a great experience for me to join
both groups.
I wish to express my gratitude to Dr. Dirk Tuma for his excellent support with the gas
measurements and mixtures and for fruitful discussions and comments to the manuscript.
To Dr. Wietse de Boer, The Netherlands Institute of Ecology (NIOO-KNAW), I am also
grateful for his contributions to this work by bacterial strains, his expertise and the
experimental results of nifH-gene analysis.
Many thanks are offered to Leonie Lang, Lisa Kersting and Dipl.-Ing. Andreas Litzba. They
participated in this project during internships.
Finally, I would like to thank my family for their patience and support during many years of
studies and my doctorate.