NIST MEASUREMENT SERVICES
85
NIST Special Publication 250-37 NIST MEASUREMENT SERVICES: PHOTOMETRIC CALIBRATIONS ————————————————————————— Yoshihiro Ohno Optical Technology Division Physics Laboratory National Institute of Standards and Technology Gaithersburg, MD 20899 Supersedes SP250-15 Reprint with changes July 1997 ————————————————————————— U.S. DEPARTMENT OF COMMERCE William M. Daley, Secretary Technology Administration Gary R. Bachula, Acting Under Secretary for Technology National Institute of Standards and Technology Robert E. Hebner, Acting Director
Transcript of NIST MEASUREMENT SERVICES
NIST Special Publication 250-37
NIST MEASUREMENT SERVICES:PHOTOMETRIC CALIBRATIONS—————————————————————————
Yoshihiro Ohno
Optical Technology DivisionPhysics LaboratoryNational Institute of Standards and TechnologyGaithersburg, MD 20899
Supersedes SP250-15
Reprint with changes
July 1997
—————————————————————————U.S. DEPARTMENT OF COMMERCE William M. Daley, Secretary
Technology AdministrationGary R. Bachula, Acting Under Secretary for Technology
National Institute of Standards and TechnologyRobert E. Hebner, Acting Director
PREFACE
The calibration and related measurement services of the National Institute of Standards andTechnology are intended to assist the makers and users of precision measuring instruments inachieving the highest possible levels of accuracy, quality, and productivity. NIST offers over300 different calibrations, special tests, and measurement assurance services. These servicesallow customers to directly link their measurement systems to measurement systems andstandards maintained by NIST. These services are offered to the public and privateorganizations alike. They are described in NIST Special Publication (SP) 250, NIST CalibrationServices Users Guide.
The Users Guide is supplemented by a number of Special Publications (designated as the“SP250 Series”) that provide detailed descriptions of the important features of specific NISTcalibration services. These documents provide a description of the: (1) specifications for theservices; (2) design philosophy and theory; (3) NIST measurement system; (4) NIST operationalprocedures; (5) assessment of the measurement uncertainty including random and systematicerrors and an error budget; and (6) internal quality control procedures used by NIST. Thesedocuments will present more detail than can be given in NIST calibration reports, or than isgenerally allowed in articles in scientific journals. In the past, NIST has published suchinformation in a variety of ways. This series will make this type of information more readilyavailable to the user.
This document, SP250-37 (1997), NIST Measurement Services: Photometric Calibrations, is arevision of SP250-15 (1987). It covers the calibration of standards of luminous intensity,luminous flux, illuminance, luminance, and color temperature (test numbers 37010C–37100S inSP250, NIST Calibration Services Users Guide). Inquiries concerning the technical content ofthis document or the specifications for these services should be directed to the author or to oneof the technical contacts cited in SP250.
NIST welcomes suggestions on how publications such as this might be made more useful.Suggestions are also welcome concerning the need for new calibrations services, special tests, andmeasurement assurance programs.
Stanley D. Rasberry Katharine B. GebbieDirector DirectorMeasurement Services Physics Laboratory
iii

ABSTRACT
The National Institute of Standards and Technology supplies calibrated standards of luminousintensity, luminance, and color temperature, and provides calibration services for submittedartifacts for luminous intensity, luminance, color temperature, total luminous flux, andluminance. The procedures, equipment, and techniques used to perform these calibrations aredescribed. Detailed estimates and procedures for determining uncertainties of the reported valuesare also presented.
Key words : Calibration; Candela; Color temperature; Illuminance; Lumen; Luminance; Luminousflux; Luminous intensity; Lux; Photometry; Standards; Total flux; Unit
iv
TABLE OF CONTENTS
Abstract ···························································································································· iv
1. Introduction ·················································································································· 11.1 Photometry, physical photometry, and radiometry ······································· 11.2 Photometric quantities and units ··································································· 3
1.2.1 Photometric quantities ···································································· 31.2.2 Relationship between the SI units and English units ······················ 6
1.3 NIST photometric units ················································································· 71.3.1 NIST luminous intensity unit ························································· 71.3.2 NIST luminous flux unit ································································· 9
2. Outline of the calibration services ··············································································· 10
3. Luminous intensity (candela) calibrations ···································································113.1 NIST illuminance unit and the NIST candela ·············································· 11
3.1.1 Principles of the detector-based candela realization ······················· 113.1.2 Design of the NIST standard photometers ····································123.1.3 Calibration of the NIST standard photometers ·······························133.1.4 Spectral mismatch correction ························································133.1.5 Correction for the photometer temperature ·································· 143.1.6 Linearity of the NIST standard photometers ································ 153.1.7 Uncertainty of the NIST illuminance unit and the candela
realization ······················································································ 163.1.8 Long-term stability of the NIST standard photometers ··············· 17
3.2 Artifacts for calibration ················································································ 183.2.1 Type of test lamps and their characteristics ································· 183.2.2 Alignment of test lamps ································································ 203.2.3 Operation and handling of test lamps ·········································· 21
3.3 Equipment for calibration ············································································ 223.3.1 Photometry bench ········································································· 223.3.2 Electrical power supply ································································ 23
3.4 Calibration procedures ················································································· 233.5 Uncertainty of calibration ············································································ 24
v
4. Illuminance calibrations ······························································································· 254.1 Equipment for calibration ············································································· 254.2 Artifacts for calibration ················································································ 25
4.2.1 Types of photometers and illuminance meters ······························ 254.2.2 Operation and handling of photometers and illuminance meters ··· 26
4.3 Calibration procedures ················································································· 264.3.1 Illuminance responsivity of photometers ······································264.3.2 Illuminance meter calibration ························································· 27
4.4 Uncertainty of calibration ·············································································28
5. Total luminous flux calibrations ·················································································· 295.1 NIST luminous flux unit ·············································································· 29
5.1.1 Principles of the Absolute Integrating Sphere Method ················· 305.1.2 Design of the NIST integrating sphere for the lumen realization ··· 315.1.3 Correction for the spatial nonuniformity of the sphere
responsivity ·················································································· 325.1.4 Incident angle dependence correction ············································ 335.1.5 Spectral mismatch correction ······················································· 345.1.6 Calibration of the primary standard lamps ··································· 35
5.2 Artifacts for calibration ················································································ 365.2.1 Types of test lamps ······································································ 365.2.2 Operation and handling of test lamps ··········································· 37
5.3 Equipment for calibration ············································································· 375.3.1 2 m integrating sphere ··································································· 375.3.2 Electrical facility for incandescent lamps ······································ 405.3.3 Electrical facility for fluorescent lamps ········································· 40
5.4 Calibration procedures ················································································· 415.4.1 Correction for the sphere detector temperature ···························· 415.4.2 Self-absorption correction ····························································· 425.4.3 Spectral mismatch correction ·························································425.4.4 Correction for the spatial nonuniformity of the sphere response··· 435.4.5 Determination of luminous flux ····················································· 44
5.5 Uncertainty of calibration ············································································ 45
6. Luminance calibrations ································································································ 466.1 NIST luminance unit ···················································································· 466.2 Artifacts for calibration ·················································································486.3 Equipment for calibration ············································································· 49
TABLE OF CONTENTS (continued)
vi
6.4 Calibration of luminance sources ·································································· 506.5 Calibration of luminance meters ·································································· 516.6 Calibration of opal glass luminance coefficient ··········································· 52
6.6.1 Calibration procedures ····································································526.6.2 Use of opal glass standards for luminance coefficient ···················· 536.6.3 Uncertainty of calibration ·······························································54
7. Color temperature calibrations ···················································································· 557.1 General descriptions ····················································································· 557.2 NIST color temperature scale ······································································ 567.3 Artifacts for calibration ················································································ 577.4 Equipment for calibration ············································································· 577.5 Calibration procedures ················································································· 597.6 Uncertainty of calibration ············································································ 60
8. Future work ··············································································································· 618.1 Total spectral radiant flux scale realization ·················································· 618.2 Total luminous flux calibration of other discharge lamps ····························· 628.3 Issuing calibrated standard lamps ································································· 628.4 Flashing light photometric standards ··························································· 628.5 High illuminance calibration ········································································· 62
Acknowledgments ··········································································································· 63
References ······················································································································· 64
Appendix A - State of the NIST photometric units in international intercomparisons · A1
Appendix B - SP250, Optical Radiation Measurements, Chapter 7 ···························· A2
Appendix C - Samples of calibration reports ······························································· A5
TABLE OF CONTENTS (continued)
vii
LIST OF FIGURES
Figure 1 CIE V(λ) Function ································································································· 2Figure 2 Realization and maintenance of the NIST photometric units ······························ 7Figure 3 Construction of the High Accuracy Cryogenic Radiometer ································· 8Figure 4 Geometry for the detector-based candela realization ·········································· 11Figure 5 Design of the NIST standard photometer ·························································· 13Figure 6 Polynomial fit for the spectral mismatch correction factors ······························· 14Figure 7 The temperature dependence of the photometers’ illuminance responsivity ······ 15 Figure 8 Linearity of one of the NIST standard photometers ··········································· 15Figure 9 Drift of the illuminance responsivity of the NIST standard photometers over
a 5 year period ····································································································· 17Figure 10 Appearance of the luminous intensity standard lamps and their electrical
polarity ················································································································ 18Figure 11 Aging characteristics of a typical Airway Beacon type lamp at 2856 K ············ 19Figure 12 Aging characteristics of a selected FEL type lamp at 2856 K ·····························19Figure 13 Spatial nonuniformity of a typical FEL type lamp ·············································20Figure 14 Alignment of the bi-post base socket using a jig and a laser beam ······················ 21 Figure 15 Alignment of the distance origin ········································································· 21Figure 16 NIST Photometry Bench ····················································································22Figure 17 Basic geometry of the Absolute Integrating Sphere Method ······························· 30Figure 18 Geometry of the integrating sphere for the luminous flux unit realization ········· 31Figure 19 SRDF of the NIST 2 m integrating sphere. (θ = 0 is at the detector. φ = 0 is
the plane passing through the sphere bottom.) ··················································· 33Figure 20 NIST 2 m integrating sphere set up for routine calibrations ······························· 38Figure 21 Spectral characteristics of the NIST integrating sphere ·······································39Figure 22 Spectral mismatch correction factor of the NIST 2 m integrating sphere
as a function of the color temperature of a Planckian source ······························ 39Figure 23 Measurement circuit for a rapid start fluorescent lamp ······································ 41Figure 24 Arrangement for NIST luminance unit realization ·············································· 47Figure 25 Relative spectral responsivity of the reference luminance meter ························ 49Figure 26 Configuration for opal glass calibration ······························································· 53Figure 27 Realization of the NIST spectral irradiance scale and the color temperature
scale ····················································································································· 56Figure 28 Configuration for color temperature calibration ·················································· 58Figure 29 Color temperature correction values for the NIST diode-array
spectroradiometer ································································································ 59
viii
LIST OF TABLES
Table 1 Quantities and units used in photometry and radiometry ···································· 4Table 2 English units and definition ·················································································· 6Table 3 Conversion between English units and SI units ···················································· 6Table 4 NIST Photometric Calibration Services ·······························································10Table 5 Uncertainty budget for the NIST illuminance unit realization ···························· 16Table 6 Uncertainty budget for the NIST candela realization ·········································· 16Table 7 Uncertainty budget for luminous intensity calibrations (typical) ······················· 24Table 8 Uncertainty budget for illuminance responsivity calibrations (typical) ·············28Table 9 Uncertainty budget for the calibration of an illuminance meter (an example) ····· 29Table 10 Uncertainty budget for the NIST 1995 luminous flux unit ································· 36Table 11 Uncertainty budget for total luminous flux calibrations of standard
incandescent lamps (typical) ··············································································· 45Table 12 Uncertainty budget for total luminous flux calibrations of 4 ft linear
fluorescent lamps (typical) ················································································· 46Table 13 Uncertainty budget for the NIST luminance unit realization ······························· 48Table 14 Uncertainty budget for luminance source calibrations (typical) ··························50Table 15 Uncertainty budget for luminance meter calibrations (typical) ··························· 52Table 16 Uncertainty budget for opal glass calibrations ····················································· 54Table 17 The uncertainty of the spectral irradiance calibration with respect to the
NIST spectral radiance scale ·············································································· 60Table 18 The uncertainty budget for the NIST color temperature calibration ·················· 60
ix

1. Introduction
This document supersedes the NBS Special Publication 250-15 (1987). In 1992, a newcandela was realized based on an absolute cryogenic radiometer, and the old NIST gold-pointblackbody-based unit [1] was replaced by the new detector-based unit [2]. A group of eightstandard photometers with calibrations based on the cryogenic radiometer holds the NISTcandela, and replaces the lamp scheme formerly used. Further, the photometric calibrationprocedures have been revised to utilize the detector-based methods [3].
This document describes the new photometric calibration procedures for luminousintensity (candela; cd), illuminance (lux; lx), total luminous flux (lumen; lm), luminance (cd/m2)and color temperature (kelvin; K). Throughout this document, uncertainty statements follow theNIST policy given by Taylor and Kuyatt [4], which prescribes the use of an expandeduncertainty with a coverage factor k = 2 for uncertainties of all NIST calibrations.
Descriptions for the individual standards and calibrations available from NIST, as ofApril 1996, are listed and explained in Section 2. Updated information about calibration servicesand prices are published periodically in the NIST Calibration Services Users Guide (SP250) [5]and Fee Schedule (SP250 Appendix).
The material presented in this document describes photometric calibration facilities andprocedures as they existed at the time of publication. Further improvement of photometriccalibration facilities and procedures are underway. Some of these on-going projects are describedin Section 8.
1.1 Photometry, physical photometry, and radiometry
The primary aim of photometry is to measure visible optical radiation, light, in such away that the results correlate with what the visual sensation is to a normal human observerexposed to that radiation. Until about 1940, visual comparison techniques of measurementswere predominant in photometry, whereby an observer was required to match the brightness oftwo visual fields viewed either simultaneously or sequentially. This method of photometry isso-called visual photometry, and is seldom used today.
In modern photometric practice, measurements are made with photodetectors. This isreferred to as physical photometry. In order to achieve the aim of photometry, one must takeinto account the characteristics of human vision. The relative spectral responsivity of the humaneye was first defined by CIE (Commission Internationale de l’Éclairage) in 1924 [6], andredefined as part of colorimetric standard observers in 1931 [7]. It is called the spectral luminousefficiency function for photopic vision, or the V(λ) function, defined in the domain 360 nm to830 nm, and is normalized to one at its peak, 555 nm (Fig. 1). This model gained wideacceptance, republished by CIE in 1983 [8] and published by CIPM (Comité International desPoids et Mesures) in 1982 [9] to supplement the 1979 definition of candela. The tabulatedvalues of the function at 1 nm increments are available in references [8-10]. In most cases, the
– 1 –

region 380 nm to 780 nm is used for calculation with negligible errors because the V(λ) functionfalls below 10-4 outside this region. Thus, a photodetector having a spectral responsivitymatched to the V(λ) function replaced the role of human eyes in photometry.
0
0.2
0.4
0.6
0.8
1
1.2
350 400 450 500 550 600 650 700 750
valu
e
Wavelength (nm)
Figure 1 CIE V(λ) Function.
Radiometry concerns physical measurement of optical radiation as a function of itswavelength. As specified in the definition of the candela by CGPM (Conférence Générale desPoids et Mesures) in 1979 [11] and CIPM in 1982 [9], a photometric quantity Xv is defined inrelation to the corresponding radiometric quantity Xe,λ by the equation:
Xv = Km Xe, λ V(λ) dλ
360 nm
830 nm
(1)
The constant, Km, relates the photometric quantities and radiometric quantities, and is called themaximum spectral luminous efficacy (of radiation) for photopic vision. The value of Km is givenby the 1979 definition of candela which defines the spectral luminous efficacy of light at thefrequency 540 x 1012 Hz (at the wavelength 555.016 nm in standard air) to be 683 lm/W. Thevalue of Km is calculated as 683 x V(555.000 nm)/V(555.016 nm) = 683.002 lm/W [8]. Km isnormally rounded to 683 lm/W with negligible errors [9]. Various photometric and radiometricquantities are described in the next section.
It should be noted that the V(λ) function is based on the CIE standard photometricobserver for photopic vision, which assumes additivity of sensation and a 2° field of view atrelatively high luminance levels (higher than ~1 cd/m2). The human vision in this level is calledphotopic vision. The spectral responsivity of human vision deviates significantly at very lowlevels of luminance (less than ~10-2 cd/m2). This type of vision is called scotopic vision. Its
– 2 –
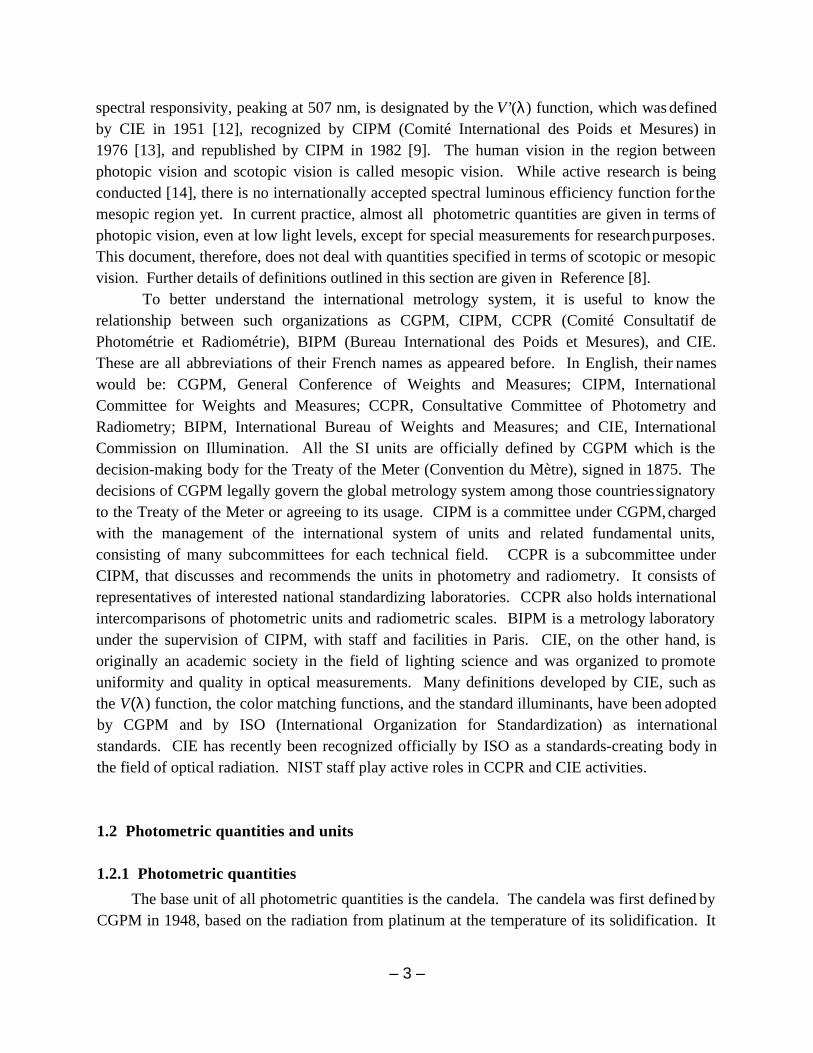
spectral responsivity, peaking at 507 nm, is designated by the V’(λ) function, which was definedby CIE in 1951 [12], recognized by CIPM (Comité International des Poids et Mesures) in1976 [13], and republished by CIPM in 1982 [9]. The human vision in the region betweenphotopic vision and scotopic vision is called mesopic vision. While active research is beingconducted [14], there is no internationally accepted spectral luminous efficiency function for themesopic region yet. In current practice, almost all photometric quantities are given in terms ofphotopic vision, even at low light levels, except for special measurements for research purposes.This document, therefore, does not deal with quantities specified in terms of scotopic or mesopicvision. Further details of definitions outlined in this section are given in Reference [8].
To better understand the international metrology system, it is useful to know therelationship between such organizations as CGPM, CIPM, CCPR (Comité Consultatif dePhotométrie et Radiométrie), BIPM (Bureau International des Poids et Mesures), and CIE.These are all abbreviations of their French names as appeared before. In English, their nameswould be: CGPM, General Conference of Weights and Measures; CIPM, InternationalCommittee for Weights and Measures; CCPR, Consultative Committee of Photometry andRadiometry; BIPM, International Bureau of Weights and Measures; and CIE, InternationalCommission on Illumination. All the SI units are officially defined by CGPM which is thedecision-making body for the Treaty of the Meter (Convention du Mètre), signed in 1875. Thedecisions of CGPM legally govern the global metrology system among those countries signatoryto the Treaty of the Meter or agreeing to its usage. CIPM is a committee under CGPM, chargedwith the management of the international system of units and related fundamental units,consisting of many subcommittees for each technical field. CCPR is a subcommittee underCIPM, that discusses and recommends the units in photometry and radiometry. It consists ofrepresentatives of interested national standardizing laboratories. CCPR also holds internationalintercomparisons of photometric units and radiometric scales. BIPM is a metrology laboratoryunder the supervision of CIPM, with staff and facilities in Paris. CIE, on the other hand, isoriginally an academic society in the field of lighting science and was organized to promoteuniformity and quality in optical measurements. Many definitions developed by CIE, such asthe V(λ) function, the color matching functions, and the standard illuminants, have been adoptedby CGPM and by ISO (International Organization for Standardization) as internationalstandards. CIE has recently been recognized officially by ISO as a standards-creating body inthe field of optical radiation. NIST staff play active roles in CCPR and CIE activities.
1.2 Photometric quantities and units
1.2.1 Photometric quantities
The base unit of all photometric quantities is the candela. The candela was first defined byCGPM in 1948, based on the radiation from platinum at the temperature of its solidification. It
– 3 –

became one of the base SI (Système International) units when SI was established in 1960. Mostrecently, the candela was redefined by CGPM in 1979 [9] as
“The candela is the luminous intensity, in a given direction, of a source that emitsmonochromatic radiation of frequency 540 x 1012 hertz and that has a radiant intensity inthat direction of (1/683) watt per steradian.”
Table 1 lists photometric quantities and their corresponding radiometric quantities side by side,with units and symbols. The precise definition of each quantity is given by CCPR [10] andCIE [15].
Table 1. Quantities and units used in photometry and radiometry––––––––––––––––––––––––––––––––––––––––––––––––––––––––––––––––––––
relationshipPhotometric quantity Unit with lumen Radiometric Quantity Unit––––––––––––––––––––––––––––––––––––––––––––––––––––––––––––––––––––Luminous flux lm (lumen) Radiant flux W (watt)Luminous intensity cd (candela) lm sr-1 Radiant intensity W sr-1
Illuminance lx (lux) lm m-2 Irradiance W m-2
Luminance cd m-2 lm sr-1 m-2 Radiance W sr-1 m-2
Luminous exitance lm m-2 Radiant exitance W m-2
Luminous exposure lx s Radiant exposure W m-2 sLuminous energy lm s Radiant energy J (joule)Color temperature K (kelvin) Radiance temperature K––––––––––––––––––––––––––––––––––––––––––––––––––––––––––––––––––––
Although the candela is defined as an SI base unit, luminous flux (lumen) is perhaps the mostfundamental photometric quantity, as the four other photometric quantities are defined in termsof lumen with appropriate geometric factors.
Luminous flux (Φv) is the time rate of flow of light as weighted by V(λ). It is defined as
ΦV = Km Φe, λ V(λ) dλλ
, (2)
where Φe,λ is the spectral concentration of radiant flux in (W/nm) as a function of wavelength λ innm.
Luminous intensity (Iv) is the luminous flux (from a point source) emitted per unit solidangle in a given direction. It is defined as
IV =
dΦV
dΩ , (3)
where dΦv is the luminous flux leaving the source and propagating in an element of solid angledΩ containing the given direction.
– 4 –

Illuminance (Ev) is the density of the luminous flux incident on a given point of a surfaceor a plane. It is defined as
EV =
dΦV
dA, (4)
where dΦv is the luminous flux incident on an element dA of the surface containing the point.Luminance (Lv) is the luminous flux from an element of a surface surrounding a given
point, emitted into a small solid angle containing the given direction, per unit area of the elementprojected on a plane perpendicular to that given direction. It is defined as
LV =
d2Φ V
dΩ d A cos θ , (5)
where dΦv is the luminous flux emitted (reflected or transmitted) by an elementary beam passingthrough the given point and propagating in the solid angle dΩ containing the given direction; dA isthe area of a section of that beam containing the given point; θ is the angle between the normal tothat section and the direction of the beam.
Luminous exitance (Mv) is the density of luminous flux leaving a surface at a point. Theequation is the same as equation (4), with dΦv meaning the luminous flux leaving a surface. Thisquantity is rarely used in the general practice of photometry.
Luminous exposure (Hv) is the time integral of illuminance Ev(t) over a given duration ∆t,as defined by
Hv = Ev(t)
∆tdt . (6)
Luminous energy (Qv) is the time integral of the luminous flux (Φv) over a given duration∆t, as defined by
Qv = Φv(t)
∆tdt . (7)
Color temperature (Tc) is the temperature of a Planckian radiator with radiation of thesame chromaticity as that of the light source in question. However, the chromaticity coordinatesof most lamps do not fall on the Planckian locus, and in actual lamp calibrations, eitherdistribution temperature or correlated color temperature is used. “Color temperature” is oftenused informally for the correlated color temperature.
Distribution temperature (Td) is the temperature of a blackbody with a spectral powerdistribution closest to that of the light source in question, and it is a useful concept for quasi-Planckian sources.
Correlated color temperature (Tcp) is a concept used for sources with a spectral powerdistribution significantly different from that of Planckian radiation, for example, discharge lamps.
– 5 –
Correlated color temperature is the temperature of the Planckian radiator whose perceived colormost closely resembles that of the light source in question. The distribution temperature andcorrelated color temperature are explained further in Section 7.
General information (definitions, symbols, and expressions) on many other physicalquantities and units including photometric and radiometric quantities are given in Reference [16].
1.2.2 Relationship between SI units and English units
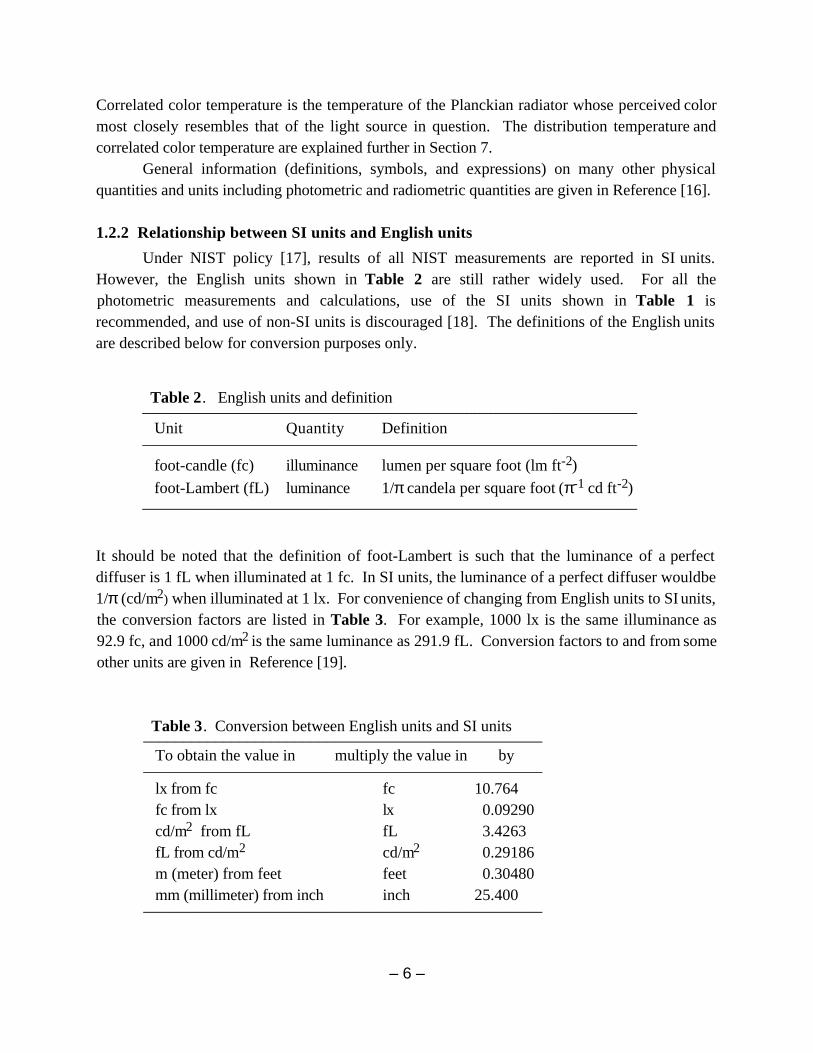
Under NIST policy [17], results of all NIST measurements are reported in SI units.However, the English units shown in Table 2 are still rather widely used. For all thephotometric measurements and calculations, use of the SI units shown in Table 1 isrecommended, and use of non-SI units is discouraged [18]. The definitions of the English unitsare described below for conversion purposes only.
Table 2. English units and definition––––––––––––––––––––––––––––––––––––––––––––––––––––––––––––––
Unit Quantity Definition––––––––––––––––––––––––––––––––––––––––––––––––––––––––––––––
foot-candle (fc) illuminance lumen per square foot (lm ft-2)foot-Lambert (fL) luminance 1/π candela per square foot (π-1 cd ft-2)
––––––––––––––––––––––––––––––––––––––––––––––––––––––––––––––
It should be noted that the definition of foot-Lambert is such that the luminance of a perfectdiffuser is 1 fL when illuminated at 1 fc. In SI units, the luminance of a perfect diffuser would be1/π (cd/m2) when illuminated at 1 lx. For convenience of changing from English units to SI units,the conversion factors are listed in Table 3. For example, 1000 lx is the same illuminance as92.9 fc, and 1000 cd/m2 is the same luminance as 291.9 fL. Conversion factors to and from someother units are given in Reference [19].
Table 3. Conversion between English units and SI units––––––––––––––––––––––––––––––––––––––––––––––––––
To obtain the value in multiply the value in by ––––––––––––––––––––––––––––––––––––––––––––––––––
lx from fc fc 10.764fc from lx lx 0.09290cd/m2 from fL fL 3.4263fL from cd/m2 cd/m2 0.29186m (meter) from feet feet 0.30480mm (millimeter) from inch inch 25.400
––––––––––––––––––––––––––––––––––––––––––––––––––
– 6 –

1.3 NIST photometric units
1.3.1 NIST Luminous intensity unit
Until 1991, the NIST luminous intensity unit was derived from the NIST spectralirradiance scale [20], which was based on a gold-point blackbody, and therefore, dependent onthe temperature scale. In 1990, the international temperature scale was revised [21], and the goldpoint temperature changed from 1337.58 K to 1337.33 K. Due to this change, the magnitude ofNIST luminous intensity unit increased by 0.35 %.
In 1992 at NIST, a new luminous intensity unit (candela) was realized based on theabsolute responsivity of detectors (using a 100 % Q.E. silicon detectors [2] and subsequently acryogenic electrical substitution radiometer [3]). The old luminous intensity unit was replacedwith the new unit in 1992.
The new candela is realized and maintained on a group of standard photometers (referredto as the NIST standard photometers) which are calibrated for illuminance responsivity in A/lx.These standard photometers also embody the NIST illuminance unit, and allow luminousintensity to be determined from measured illuminance and distance. The realization andmaintenance of the photometric units at NIST are shown in Figure 2. The NIST cryogenic
– 7 –
Absolute Spectral Responsivity Scale
(Silicon Photodiodes)
Luminous Intensity Unit(Transfer Lamps)
Illuminance Responsivity Scale
(Standard Photometers)
Absolute Cryogenic
Radiometer (HACR)
Absolute Spectral Response Transfer
Absolute Spectral Response TransferAperture Area MeasurementCalculation based on Candela Definition
[A/W]
[ A/lx ]
[ cd ]
Distance Measurement
Interpolation
Luminous Flux Unit( Primary / Working Standard Lamps )
Luminous FluxTransfer Lamps
Measurements with 2 m Integrating Sphere
Integrating SphereMethod
[ lm ]
Luminance Unit(Primary / Working Standard Sources)
Distance Measurement Aperture Area
TransferLuminance Sources /
Luminance Meters
Measurements with Reference Luminance Meter
[W]
Figure 2 Realization and maintenance of the NIST photometric units.
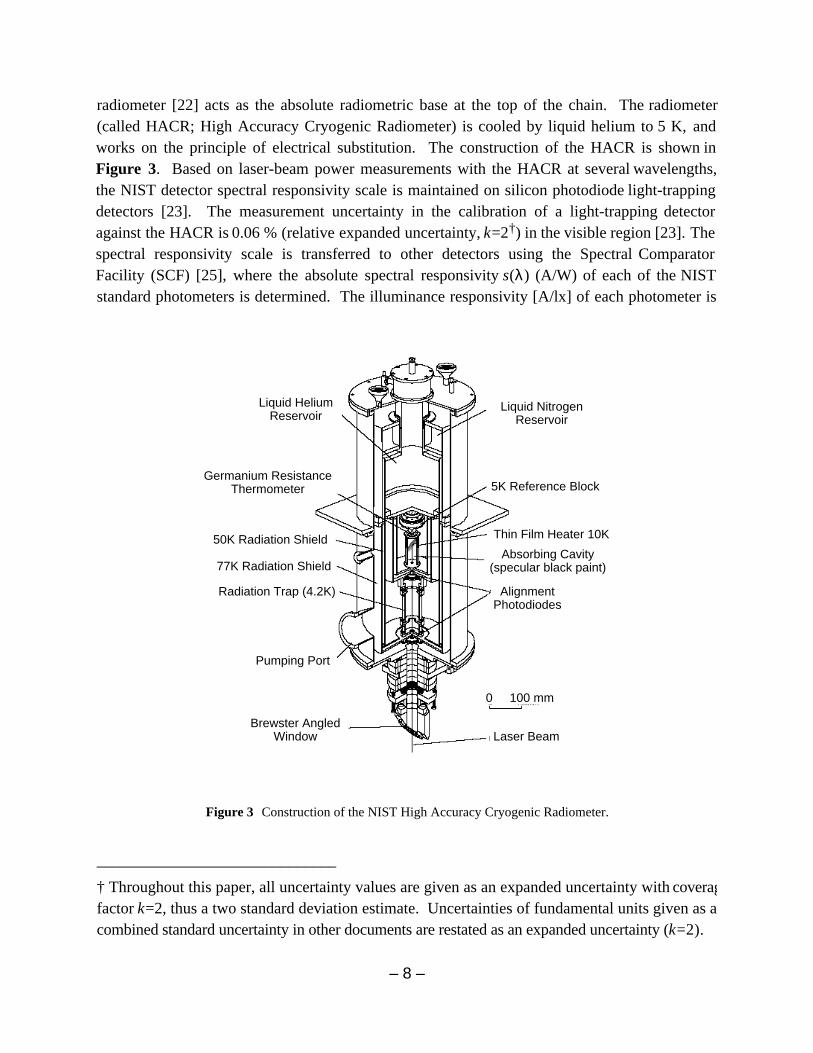
radiometer [22] acts as the absolute radiometric base at the top of the chain. The radiometer(called HACR; High Accuracy Cryogenic Radiometer) is cooled by liquid helium to 5 K, andworks on the principle of electrical substitution. The construction of the HACR is shown inFigure 3. Based on laser-beam power measurements with the HACR at several wavelengths,the NIST detector spectral responsivity scale is maintained on silicon photodiode light-trappingdetectors [23]. The measurement uncertainty in the calibration of a light-trapping detectoragainst the HACR is 0.06 % (relative expanded uncertainty, k=2†) in the visible region [23]. Thespectral responsivity scale is transferred to other detectors using the Spectral ComparatorFacility (SCF) [25], where the absolute spectral responsivity s(λ) (A/W) of each of the NISTstandard photometers is determined. The illuminance responsivity [A/lx] of each photometer is
– 8 –
Brewster AngledWindow
Liquid HeliumReservoir
Germanium ResistanceThermometer
50K Radiation Shield
77K Radiation Shield
Radiation Trap (4.2K)
Pumping Port
Laser Beam
Liquid Nitrogen Reservoir
5K Reference Block
Thin Film Heater 10K
Absorbing Cavity(specular black paint)
AlignmentPhotodiodes
0 100 mm
Figure 3 Construction of the NIST High Accuracy Cryogenic Radiometer.
––––––––––––––––––––––––––––––† Throughout this paper, all uncertainty values are given as an expanded uncertainty with coveragefactor k=2, thus a two standard deviation estimate. Uncertainties of fundamental units given as acombined standard uncertainty in other documents are restated as an expanded uncertainty (k=2).
then calculated from s(λ), the area of the aperture, and other correction factors. The relativeexpanded uncertainty of the illuminance responsivity determination is 0.39 % [2]. The standardphotometers are recalibrated annually utilizing the detector spectral responsivity scale. Thedetails of the candela realization are described in Section 3.1 and in Reference [2].
As the result of the candela realization in 1992, the magnitude of the NIST luminousintensity unit changed (increased) by approximately 0.3 %. With the effect of the change of theinternational temperature scale in 1990 included, the magnitude of the NIST candela is larger(measured values are smaller) by approximately 0.6 % than that reported before 1990. At thelatest CCPR international intercomparison [26] in 1985, the NIST candela was 0.6 % smallerthan the world mean. The changes of the NIST candela occurred in the direction to reduce itsdifference from the world mean. At the time of the 1985 intercomparison, the candela and thelumen standards disseminated in different countries varied by ± 1 %. The most recent status ofthe differences in the magnitude of photometric units for different countries in the world was lastpublished by BIPM in 1988 [27], the copy of which is attached in the Appendix A. The nextinternational intercomparison of photometric units by CCPR is planned to be completed by1998. In the mean time, NIST occasionally conducts bilateral intercomparisons of photometricunits with other national laboratories [28].
1.3.2 NIST luminous flux unit
Until 1994, the NIST luminous flux unit was derived from the previous luminousintensity unit which was based on blackbody radiation. The previous luminous flux unit waslast realized in 1985 by goniophotometric measurements [1], and was maintained on a group ofsix incandescent standard lamps. The unit was periodically transferred to groups of workingstandard lamps used for routine calibrations.
In 1995, a new NIST luminous flux unit was derived, based on the detector-based candelaintroduced in 1992, with a new method using an integrating sphere and an external source. Thebasic principle of this method (Absolute Integrating Sphere Method) is to measure the total fluxof a lamp inside the sphere compared to a known amount of flux introduced into the sphere froma source outside the sphere.
This method was first studied theoretically using a computer simulation technique [29],then experimentally verified [30] using a 0.5 m integrating sphere. Utilizing this method with a2 m integrating sphere, the new NIST luminous flux unit was established in 1995 [31, 32].Primary standard lamps and working standard lamps are calibrated periodically against the NISTilluminance unit in order to maintain the luminous flux unit and to provide routine calibrations.The details of the luminous flux unit realization are described in Section 5.1.
The realization of the 1995 luminous flux unit has resulted in a change (increase) of themagnitude of NIST luminous flux unit by approximately 1.1 %. The measured lumen valuesreported by NIST are smaller by that percentage than those previously reported. At the time of the1985 CCPR international intercomparison [26], the NIST lumen value was 1.0 % smaller than the
– 9 –
world mean. The new luminous flux unit has been disseminated in NIST calibrations sinceJanuary 1, 1996.
2. Outline of the calibration services
This section provides a list of the photometric calibration services currently available atNIST. The complete description of these services is reported in the NIST Calibration ServicesUsers Guide (SP250) [5]. Chapter 7 (Optical Radiation Measurements) of the SP250 is attachedas Appendix B. The details of the artifacts and measurement procedures for calibration are
– 10 –
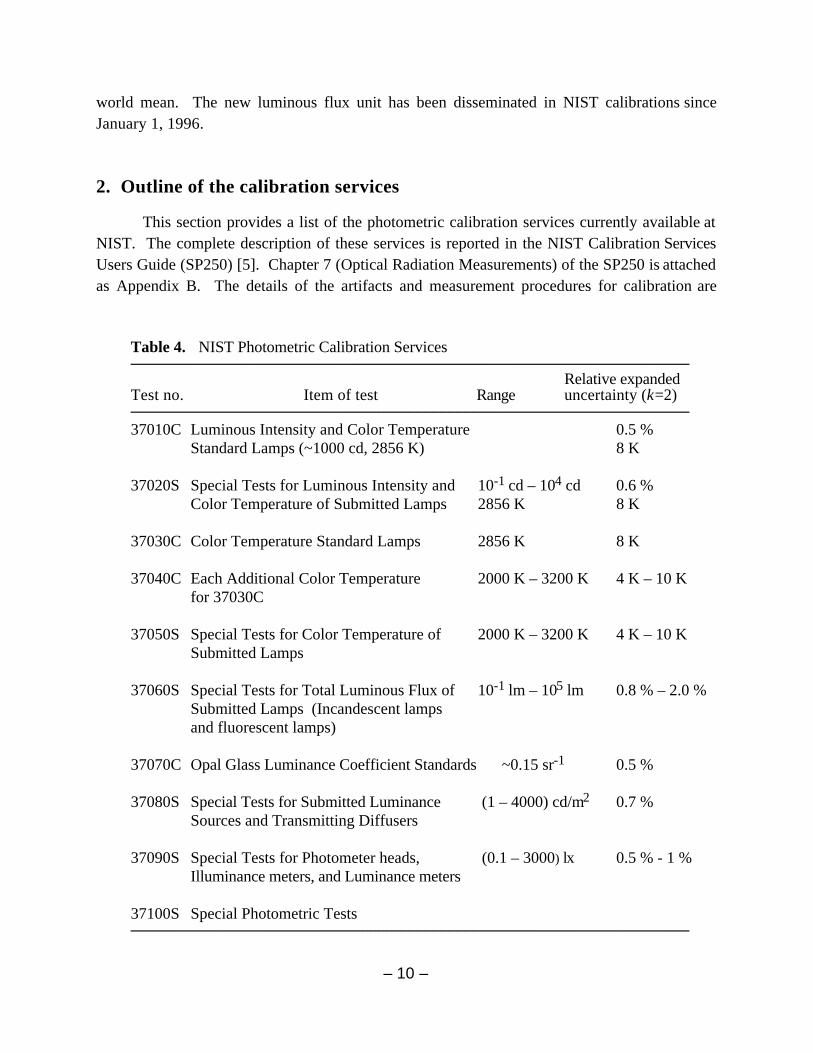
Table 4. NIST Photometric Calibration Services––––––––––––––––––––––––––––––––––––––––––––––––––––––––––––––––––––––
Relative expandedTest no. Item of test Range uncertainty (k=2)––––––––––––––––––––––––––––––––––––––––––––––––––––––––––––––––––––––37010C Luminous Intensity and Color Temperature 0.5 %
Standard Lamps (~1000 cd, 2856 K) 8 K
37020S Special Tests for Luminous Intensity and 10-1 cd – 104 cd 0.6 %Color Temperature of Submitted Lamps 2856 K 8 K
37030C Color Temperature Standard Lamps 2856 K 8 K
37040C Each Additional Color Temperature 2000 K – 3200 K 4 K – 10 Kfor 37030C
37050S Special Tests for Color Temperature of 2000 K – 3200 K 4 K – 10 KSubmitted Lamps
37060S Special Tests for Total Luminous Flux of 10-1 lm – 105 lm 0.8 % – 2.0 % Submitted Lamps (Incandescent lamps and fluorescent lamps)
37070C Opal Glass Luminance Coefficient Standards ~0.15 sr-1 0.5 %
37080S Special Tests for Submitted Luminance (1 – 4000) cd/m2 0.7 % Sources and Transmitting Diffusers
37090S Special Tests for Photometer heads, (0.1 – 3000) lx 0.5 % - 1 %Illuminance meters, and Luminance meters
37100S Special Photometric Tests––––––––––––––––––––––––––––––––––––––––––––––––––––––––––––––––––––––
described in Sections 3 through 7. Table 4 lists the NIST photometric calibration services withtypical measurement ranges and typical uncertainties. All the items listed here, including theSpecial Tests, are provided routinely. Fixed services (Test Numbers ending in the letter C) arethose in which NIST issues calibrated artifacts to customers. Special Tests (Test Number endingwith the letter S), on the other hand, are those in which NIST calibrates artifacts submitted bycustomers.
The fees for the fixed services are listed in the Fee Schedule (SP250 Appendix). The feesfor Special Tests depend on the type of artifacts, number of artifacts, measurement rangerequested, etc. A cost estimate will be given for each request for a Special Test.
Calibrations on special test items or under special conditions, other than listed below,may be available after consultation as Special Photometric Tests 37100S.
3. Luminous intensity (candela) calibrations
3.1 NIST illuminance unit and the NIST candela
3.1.1 Principles of the detector-based candela realization
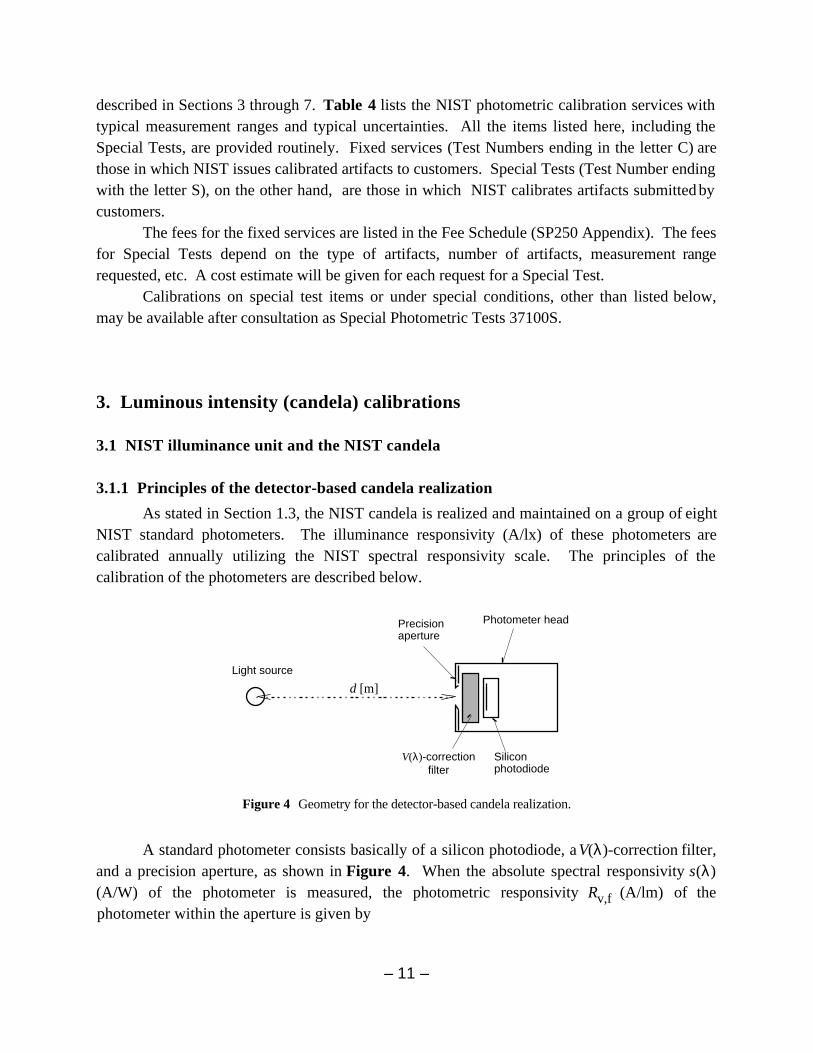
As stated in Section 1.3, the NIST candela is realized and maintained on a group of eightNIST standard photometers. The illuminance responsivity (A/lx) of these photometers arecalibrated annually utilizing the NIST spectral responsivity scale. The principles of thecalibration of the photometers are described below.
Precisionaperture
Photometer head
V(λ)-correction filter
Silicon photodiode
Light source
d [m]
Figure 4 Geometry for the detector-based candela realization.
A standard photometer consists basically of a silicon photodiode, a V(λ)-correction filter,and a precision aperture, as shown in Figure 4. When the absolute spectral responsivity s(λ)(A/W) of the photometer is measured, the photometric responsivity Rv,f (A/lm) of thephotometer within the aperture is given by
– 11 –

Rv,f =
P(λ) s(λ)dλλ
Km P(λ) V(λ)dλλ
(8)
where P(λ) is the spectral power distribution of light to be measured, V(λ) is the spectralluminous efficiency function, and Km is the maximum spectral efficacy (683 lm/W). Usually aPlanckian radiator at 2856 K (CIE Illuminant A) is used to provide the light flux P(λ). If the areaA (m2) of the aperture is known and the responsivity Rv,f is uniform over the aperture, theilluminance responsivity Rv,i (A/lx) of the photometer is given by
Rv,i = A · Rv,f (9)
When a photometer calibrated for Rv,i is used to measure the illuminance from a pointsource, the luminous intensity Iv (cd) of the source is given by
Iv = d 2 · y / Rv,i , (10)
where d is the distance (m) from the light source to the aperture surface of the photometer and yis the output current (A) of the photometer. In practice, d must be larger than the minimumdistance where the deviation from the inverse square law of the light source is negligibly small.
3.1.2 Design of the NIST standard photometers
Figure 5 shows the design of the NIST standard photometers. A silicon photodiode, aV(λ)-correction filter, and a precision aperture are mounted in a cylindrical housing. Thephotodiode is plugged into a socket with a teflon base of low electrical conductivity. TheV(λ)–correction filter is made of several layers of glass filters, and affixed to the photodiode. Onthe front side of the filter, the precision aperture is glued to a holder which is carefully machinedso that its front surface (the reference surface of the photometer) is 3.0 mm from the plane of theaperture knife edge.
An electronic assembly containing a current-to-voltage converter circuit having a highsensitivity and a wide dynamic range [33] is mounted directly behind the photodiode tominimize noise. The circuit has a switchable gain setting from 104 V/A to 1010 V/A ( 1011 V/Afor two of the photometers). An input equivalent noise of ~1 fA is achieved at the gain settingof 1011 V/A with an integration time of 1.67 s, and a bandwidth of 0.3 Hz. This high sensitivityfeature allows precise measurement of s(λ) even in the wings of the V(λ) curve.
Since the characteristics of the filter and photodiode can change with temperature, atemperature sensor is installed in the front piece of the housing to monitor the photometertemperature [34].
– 12 –
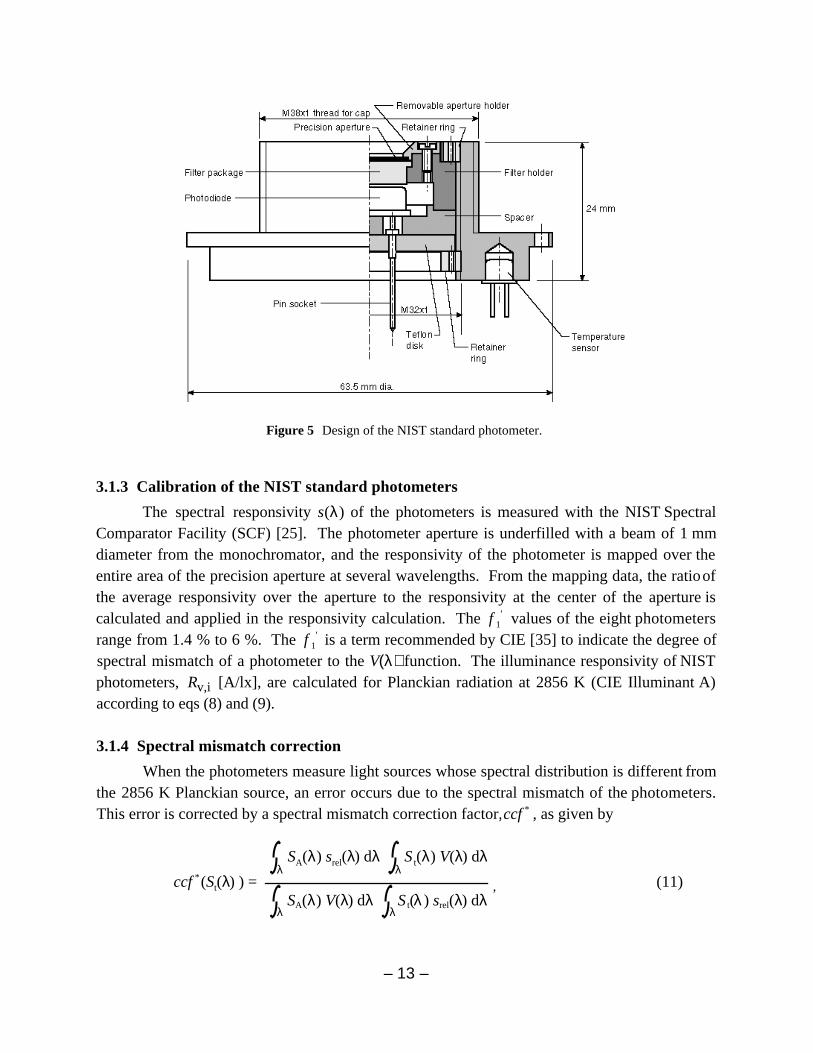
Figure 5 Design of the NIST standard photometer.
3.1.3 Calibration of the NIST standard photometers
The spectral responsivity s(λ) of the photometers is measured with the NIST SpectralComparator Facility (SCF) [25]. The photometer aperture is underfilled with a beam of 1 mmdiameter from the monochromator, and the responsivity of the photometer is mapped over theentire area of the precision aperture at several wavelengths. From the mapping data, the ratio ofthe average responsivity over the aperture to the responsivity at the center of the aperture iscalculated and applied in the responsivity calculation. The f 1
′ values of the eight photometersrange from 1.4 % to 6 %. The f 1
′ is a term recommended by CIE [35] to indicate the degree ofspectral mismatch of a photometer to the V(λ) function. The illuminance responsivity of NISTphotometers, Rv,i [A/lx], are calculated for Planckian radiation at 2856 K (CIE Illuminant A)according to eqs (8) and (9).
3.1.4 Spectral mismatch correction
When the photometers measure light sources whose spectral distribution is different fromthe 2856 K Planckian source, an error occurs due to the spectral mismatch of the photometers.This error is corrected by a spectral mismatch correction factor, ccf * , as given by
ccf *(St(λ) ) =
SA(λ) srel(λ) dλλ
S t(λ) V(λ) dλλ
SA(λ) V(λ) dλλ
S t(λ) srel(λ) dλλ
, (11)
– 13 –
where St(λ) is the spectral power distribution of the test lamp, SA(λ) is the spectral data of theCIE Illuminant A, and srel(λ) is the relative spectral responsivity of the photometer. Using thisequation, the correction factor can be obtained for any light source with known spectral powerdistribution.
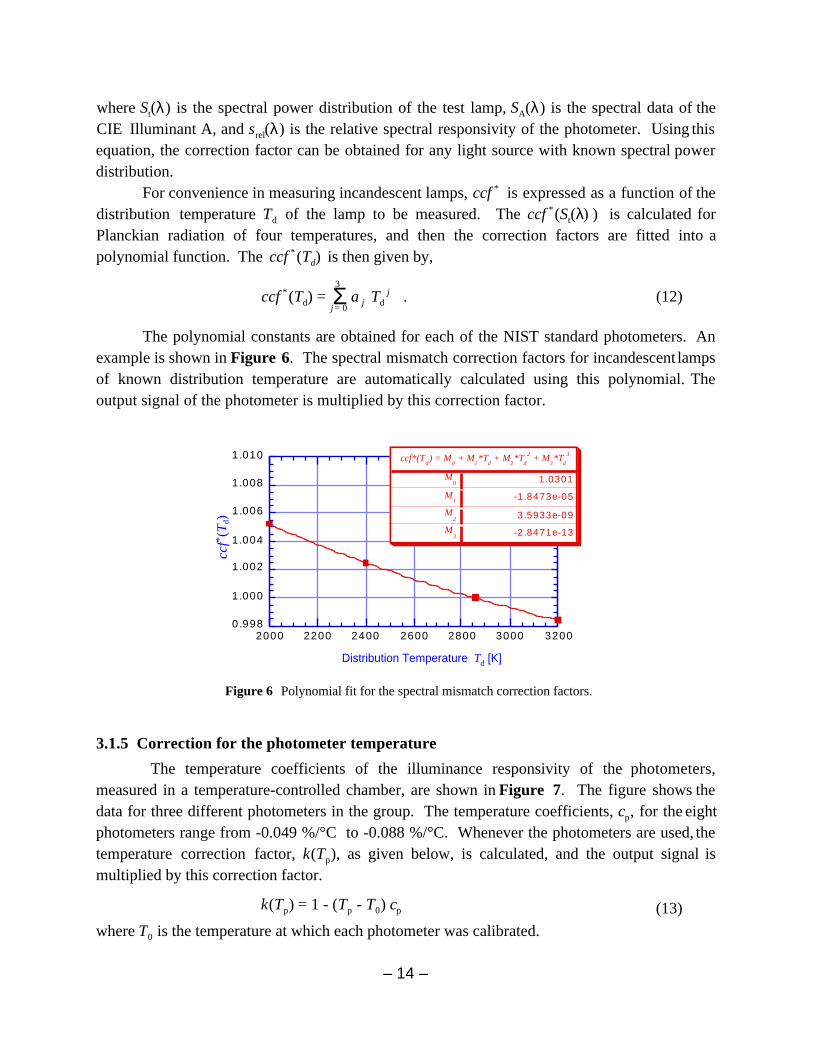
For convenience in measuring incandescent lamps, ccf * is expressed as a function of thedistribution temperature Td of the lamp to be measured. The ccf *(St(λ) ) is calculated forPlanckian radiation of four temperatures, and then the correction factors are fitted into apolynomial function. The ccf *(Td) is then given by,
ccf *(Td) = a j TdjΣ
j = 0
3
. (12)
The polynomial constants are obtained for each of the NIST standard photometers. Anexample is shown in Figure 6. The spectral mismatch correction factors for incandescent lampsof known distribution temperature are automatically calculated using this polynomial. Theoutput signal of the photometer is multiplied by this correction factor.
0.998
1.000
1.002
1.004
1.006
1.008
1.010
2000 2200 2400 2600 2800 3000 3200
ccf*(Td) = M
0 + M
1*T
d + M
2*T
d
2 + M
3*T
d
3
1.0301M0
-1.8473e-05M1
3.5933e-09M2
-2.8471e-13M3
ccf*
(Td)
Distribution Temperature Td [K]
Figure 6 Polynomial fit for the spectral mismatch correction factors.
3.1.5 Correction for the photometer temperature
The temperature coefficients of the illuminance responsivity of the photometers,measured in a temperature-controlled chamber, are shown in Figure 7. The figure shows thedata for three different photometers in the group. The temperature coefficients, cp, for the eightphotometers range from -0.049 %/°C to -0.088 %/°C. Whenever the photometers are used, thetemperature correction factor, k(Tp), as given below, is calculated, and the output signal ismultiplied by this correction factor.
k(Tp) = 1 - (Tp - T0) cp (13)
– 14 –
where T0 is the temperature at which each photometer was calibrated.

0.993
0.994
0.995
0.996
0.997
0.998
0.999
1.000
0 2 4 6 8
Rel
ativ
e R
espo
nsiv
ity
Temperature Increase [°C]
Figure 7 The temperature dependence of the photometers’ illuminance responsivity.
3.1.6 Linearity of the NIST standard photometers
The linearity of the photometers was measured using a beam conjoiner instrument [36],
which is a ratio-and-additive beam device designed to test the linearity of photodetectors.Figure 8 shows the result from one of the NIST standard photometers for a 2856 K source.These data indicate that the photometer is linear over an output current range of 10– 10 A to
10– 4 A. This corresponds to an illuminance range of 10– 2 lx to 104 lx, and means thephotometers can be used to measure a luminous intensity as low as 10 mcd at 1 m, and as high as105 cd at 3 m, without significantly increasing the uncertainty. If the integration time for thesignal is longer, the photometer can be used for even lower levels [33]. The linearity data alsoassures negligible non-linearity error in the spectral responsivity measurements.
– 15 –
0.996
0.998
1.000
1.002
1.004
10-12 10-10 10-8 10-6 10-4
Rel
ativ
e R
espo
nsiv
ity
Photocurrent [A]
AverageDecade
1.00016-10 – -9
1.00001-9 – -8
0.99999-8 – -7
1.00001-7 – -6
0.99993-6 – -5
1.00003-5 – -4
Figure 8 Linearity of one of the NIST standard photometers.
3.1.7 Uncertainty of the NIST illuminance unit and the candela realization
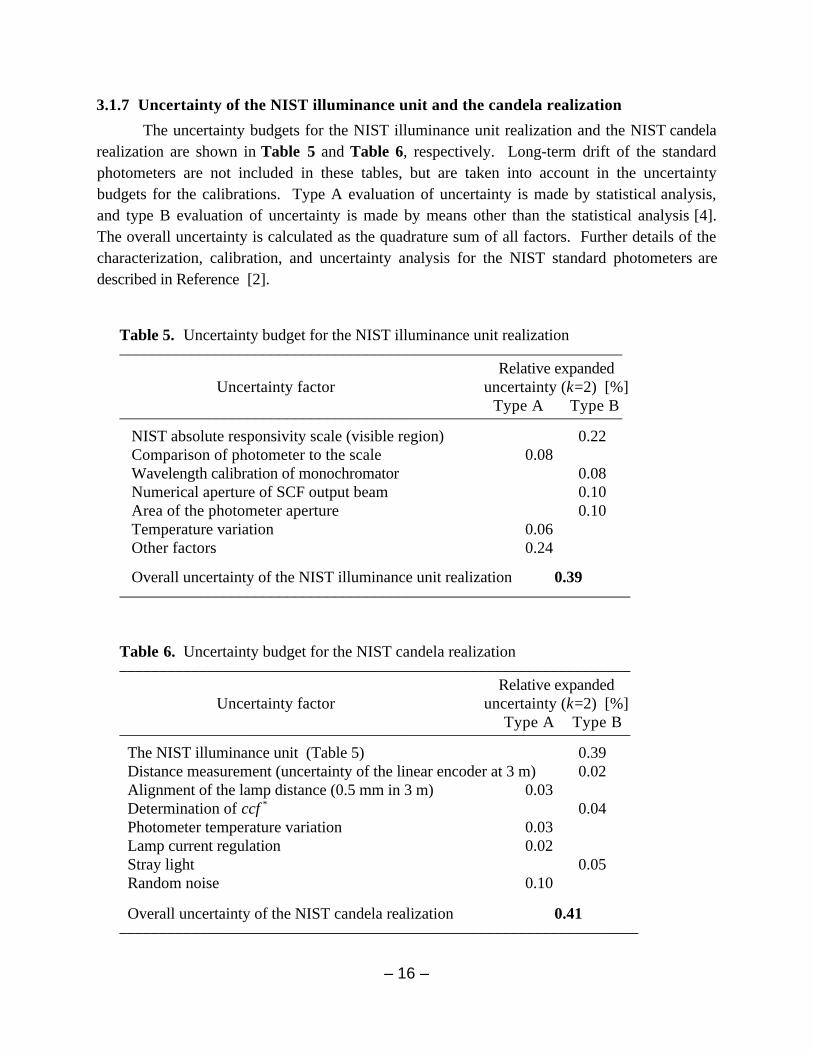
The uncertainty budgets for the NIST illuminance unit realization and the NIST candelarealization are shown in Table 5 and Table 6, respectively. Long-term drift of the standardphotometers are not included in these tables, but are taken into account in the uncertaintybudgets for the calibrations. Type A evaluation of uncertainty is made by statistical analysis,and type B evaluation of uncertainty is made by means other than the statistical analysis [4].The overall uncertainty is calculated as the quadrature sum of all factors. Further details of thecharacterization, calibration, and uncertainty analysis for the NIST standard photometers aredescribed in Reference [2].
Table 5. Uncertainty budget for the NIST illuminance unit realization–––––––––––––––––––––––––––––––––––––––––––––––––––––––––––––––
Relative expandedUncertainty factor uncertainty (k=2) [%]
Type A Type B–––––––––––––––––––––––––––––––––––––––––––––––––––––––––––––––
NIST absolute responsivity scale (visible region) 0.22Comparison of photometer to the scale 0.08Wavelength calibration of monochromator 0.08Numerical aperture of SCF output beam 0.10Area of the photometer aperture 0.10Temperature variation 0.06Other factors 0.24
Overall uncertainty of the NIST illuminance unit realization 0.39––––––––––––––––––––––––––––––––––––––––––––––––––––––––––––––––
Table 6. Uncertainty budget for the NIST candela realization ––––––––––––––––––––––––––––––––––––––––––––––––––––––––––––––––
Relative expandedUncertainty factor uncertainty (k=2) [%]
Type A Type B––––––––––––––––––––––––––––––––––––––––––––––––––––––––––––––––The NIST illuminance unit (Table 5) 0.39Distance measurement (uncertainty of the linear encoder at 3 m) 0.02Alignment of the lamp distance (0.5 mm in 3 m) 0.03Determination of ccf * 0.04 Photometer temperature variation 0.03Lamp current regulation 0.02Stray light 0.05Random noise 0.10
Overall uncertainty of the NIST candela realization 0.41–––––––––––––––––––––––––––––––––––––––––––––––––––––––––––––––––
– 16 –
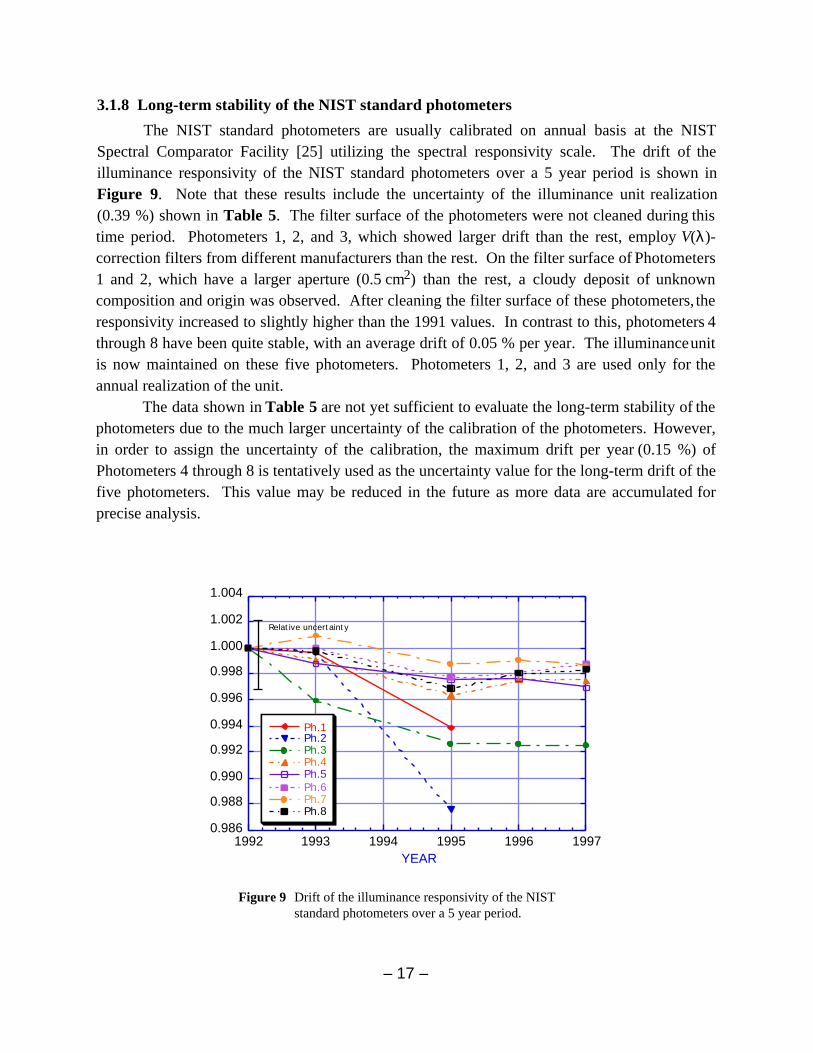
3.1.8 Long-term stability of the NIST standard photometers
The NIST standard photometers are usually calibrated on annual basis at the NISTSpectral Comparator Facility [25] utilizing the spectral responsivity scale. The drift of theilluminance responsivity of the NIST standard photometers over a 5 year period is shown inFigure 9. Note that these results include the uncertainty of the illuminance unit realization(0.39 %) shown in Table 5. The filter surface of the photometers were not cleaned during thistime period. Photometers 1, 2, and 3, which showed larger drift than the rest, employ V(λ)-correction filters from different manufacturers than the rest. On the filter surface of Photometers1 and 2, which have a larger aperture (0.5 cm2) than the rest, a cloudy deposit of unknowncomposition and origin was observed. After cleaning the filter surface of these photometers, theresponsivity increased to slightly higher than the 1991 values. In contrast to this, photometers 4through 8 have been quite stable, with an average drift of 0.05 % per year. The illuminance unitis now maintained on these five photometers. Photometers 1, 2, and 3 are used only for theannual realization of the unit.
The data shown in Table 5 are not yet sufficient to evaluate the long-term stability of thephotometers due to the much larger uncertainty of the calibration of the photometers. However,in order to assign the uncertainty of the calibration, the maximum drift per year (0.15 %) ofPhotometers 4 through 8 is tentatively used as the uncertainty value for the long-term drift of thefive photometers. This value may be reduced in the future as more data are accumulated forprecise analysis.
0.986
0.988
0.990
0.992
0.994
0.996
0.998
1.000
1.002
1.004
1992 1993 1994 1995 1996 1997
Ph.1Ph.2Ph.3Ph.4Ph.5Ph.6Ph.7Ph.8
YEAR
Relative uncertainty
Figure 9 Drift of the illuminance responsivity of the NIST standard photometers over a 5 year period.
– 17 –
3.2 Artifacts for calibration
3.2.1 Type of test lamps and their characteristics
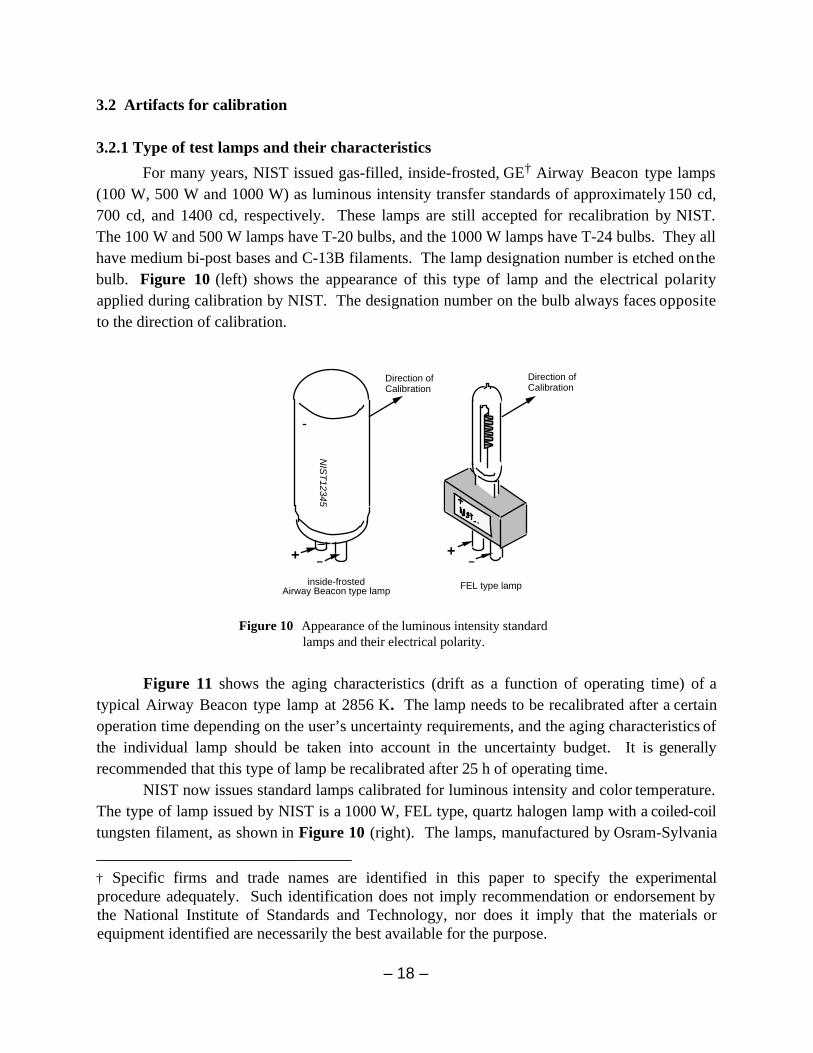
For many years, NIST issued gas-filled, inside-frosted, GE† Airway Beacon type lamps(100 W, 500 W and 1000 W) as luminous intensity transfer standards of approximately 150 cd,700 cd, and 1400 cd, respectively. These lamps are still accepted for recalibration by NIST.The 100 W and 500 W lamps have T-20 bulbs, and the 1000 W lamps have T-24 bulbs. They allhave medium bi-post bases and C-13B filaments. The lamp designation number is etched on thebulb. Figure 10 (left) shows the appearance of this type of lamp and the electrical polarityapplied during calibration by NIST. The designation number on the bulb always faces oppositeto the direction of calibration.
inside-frostedAirway Beacon type lamp FEL type lamp
NIS
T1
23
45
Direction ofCalibration
Direction ofCalibration
+ –+
–
Figure 10 Appearance of the luminous intensity standardlamps and their electrical polarity.
Figure 11 shows the aging characteristics (drift as a function of operating time) of atypical Airway Beacon type lamp at 2856 K. The lamp needs to be recalibrated after a certainoperation time depending on the user’s uncertainty requirements, and the aging characteristics ofthe individual lamp should be taken into account in the uncertainty budget. It is generallyrecommended that this type of lamp be recalibrated after 25 h of operating time.
NIST now issues standard lamps calibrated for luminous intensity and color temperature.The type of lamp issued by NIST is a 1000 W, FEL type, quartz halogen lamp with a coiled-coiltungsten filament, as shown in Figure 10 (right). The lamps, manufactured by Osram-Sylvania
– 18 –
––––––––––––––––––––––––––––––––† Specific firms and trade names are identified in this paper to specify the experimentalprocedure adequately. Such identification does not imply recommendation or endorsement bythe National Institute of Standards and Technology, nor does it imply that the materials orequipment identified are necessarily the best available for the purpose.

Inc., are potted on a medium bi-post base, and seasoned with DC power for 48 h at 8.5 A andthen for 72 h at 7.2 A. Lamps are operated and calibrated at a color temperature of 2856 K withan operating current of ~7.2 A and voltage of ~85 V. The lamp designation numbers and theelectrical polarity are engraved on an identification plate affixed to the lamp base (See Fig. 10).
Figure 12 shows the aging characteristics of a typical selected FEL type lamp at2856 K. The luminous intensity lamps issued by NIST are screened to obtain a luminousintensity drift of smaller than 0.3 % during a continuous 24 h period of operation. It can be
– 19 –
0.994
0.996
0.998
1.000
1.002
0 5 10 15 20
CurrentVoltageLuminous intensity
Rela
tive
Val
ue
Operating Time (h)
Figure 11 Aging characteristics of a typical Airway Beacon type lamp at 2856 K.
0.994
0.996
0.998
1.000
1.002
0 5 10 15 20
CurrentVoltageLuminous intensity
Rela
tive
Val
ue
Operating time (h)
Figure 12 Aging characteristics of a selected FEL type lamp at 2856 K.
assumed that the lamp changes at a similar rate in ensuing hours of operation. It is generallyrecommended that this type of lamp be recalibrated after no longer than 50 h of operating time.Further details of the characteristics of these FEL type lamps are described in Reference [37].
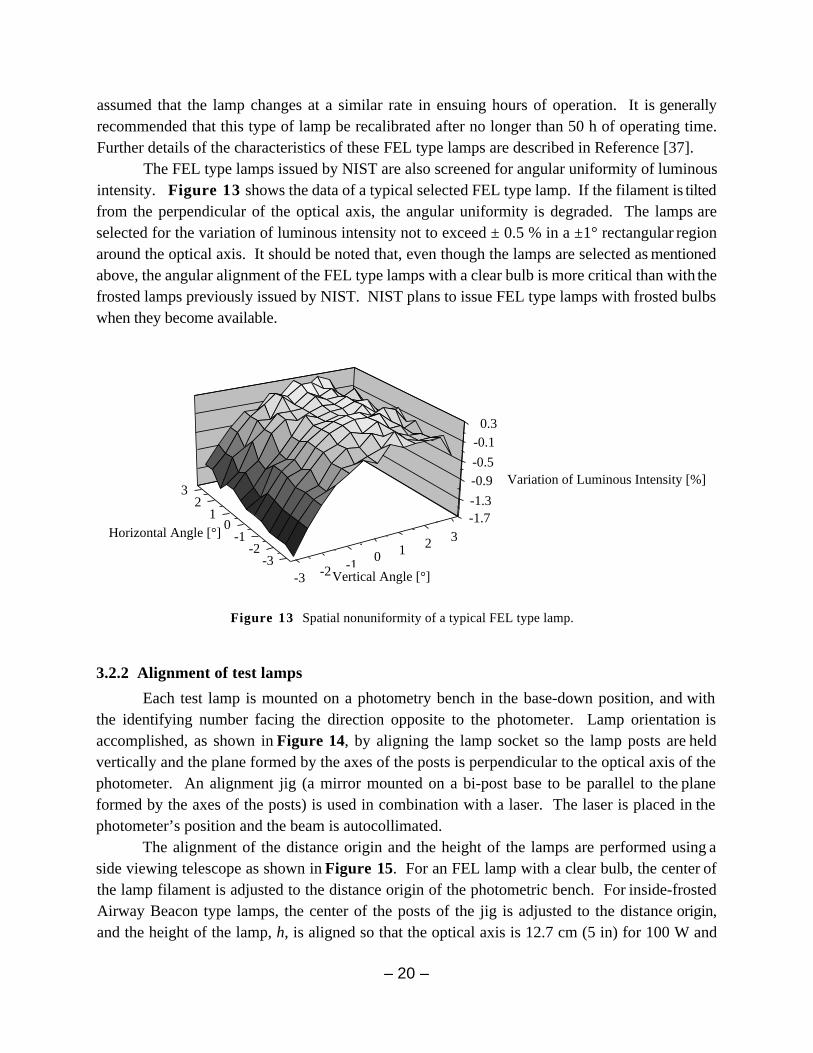
The FEL type lamps issued by NIST are also screened for angular uniformity of luminousintensity. Figure 13 shows the data of a typical selected FEL type lamp. If the filament is tiltedfrom the perpendicular of the optical axis, the angular uniformity is degraded. The lamps areselected for the variation of luminous intensity not to exceed ± 0.5 % in a ±1° rectangular regionaround the optical axis. It should be noted that, even though the lamps are selected as mentionedabove, the angular alignment of the FEL type lamps with a clear bulb is more critical than with thefrosted lamps previously issued by NIST. NIST plans to issue FEL type lamps with frosted bulbswhen they become available.
-3 -2 -10 1 2 3
Vertical Angle [°]-3
-2-1
01
23
Horizontal Angle [°]-1.7-1.3
-0.9-0.5
-0.10.3
Variation of Luminous Intensity [%]
Figure 13 Spatial nonuniformity of a typical FEL type lamp.
3.2.2 Alignment of test lamps
Each test lamp is mounted on a photometry bench in the base-down position, and withthe identifying number facing the direction opposite to the photometer. Lamp orientation isaccomplished, as shown in Figure 14, by aligning the lamp socket so the lamp posts are heldvertically and the plane formed by the axes of the posts is perpendicular to the optical axis of thephotometer. An alignment jig (a mirror mounted on a bi-post base to be parallel to the planeformed by the axes of the posts) is used in combination with a laser. The laser is placed in thephotometer’s position and the beam is autocollimated.
The alignment of the distance origin and the height of the lamps are performed using aside viewing telescope as shown in Figure 15. For an FEL lamp with a clear bulb, the center ofthe lamp filament is adjusted to the distance origin of the photometric bench. For inside-frostedAirway Beacon type lamps, the center of the posts of the jig is adjusted to the distance origin,and the height of the lamp, h, is aligned so that the optical axis is 12.7 cm (5 in) for 100 W and
– 20 –
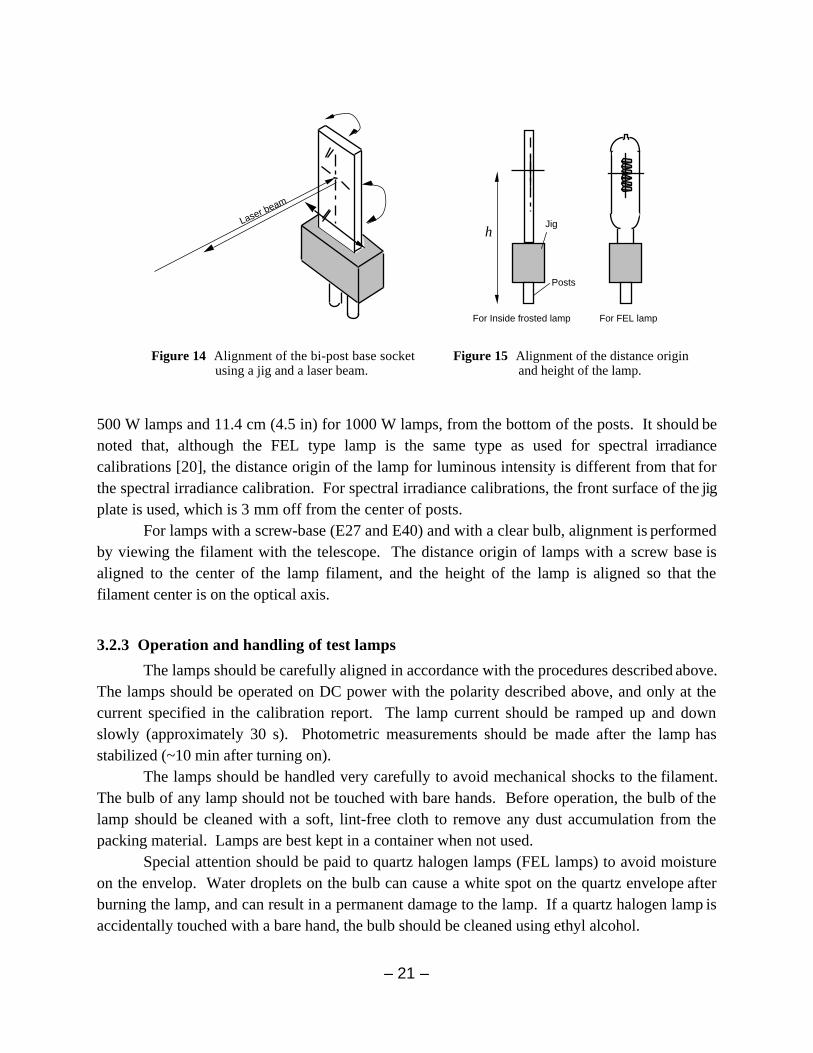
500 W lamps and 11.4 cm (4.5 in) for 1000 W lamps, from the bottom of the posts. It should benoted that, although the FEL type lamp is the same type as used for spectral irradiancecalibrations [20], the distance origin of the lamp for luminous intensity is different from that forthe spectral irradiance calibration. For spectral irradiance calibrations, the front surface of the jigplate is used, which is 3 mm off from the center of posts.
For lamps with a screw-base (E27 and E40) and with a clear bulb, alignment is performedby viewing the filament with the telescope. The distance origin of lamps with a screw base isaligned to the center of the lamp filament, and the height of the lamp is aligned so that thefilament center is on the optical axis.
3.2.3 Operation and handling of test lamps
The lamps should be carefully aligned in accordance with the procedures described above.The lamps should be operated on DC power with the polarity described above, and only at thecurrent specified in the calibration report. The lamp current should be ramped up and downslowly (approximately 30 s). Photometric measurements should be made after the lamp hasstabilized (~10 min after turning on).
The lamps should be handled very carefully to avoid mechanical shocks to the filament.The bulb of any lamp should not be touched with bare hands. Before operation, the bulb of thelamp should be cleaned with a soft, lint-free cloth to remove any dust accumulation from thepacking material. Lamps are best kept in a container when not used.
Special attention should be paid to quartz halogen lamps (FEL lamps) to avoid moistureon the envelop. Water droplets on the bulb can cause a white spot on the quartz envelope afterburning the lamp, and can result in a permanent damage to the lamp. If a quartz halogen lamp isaccidentally touched with a bare hand, the bulb should be cleaned using ethyl alcohol.
– 21 –
Laser beam
For Inside frosted lamp For FEL lamp
Jig
Posts
h
Figure 14 Alignment of the bi-post base socket Figure 15 Alignment of the distance originusing a jig and a laser beam. and height of the lamp.
3.3 Equipment for calibration
3.3.1 Photometry bench
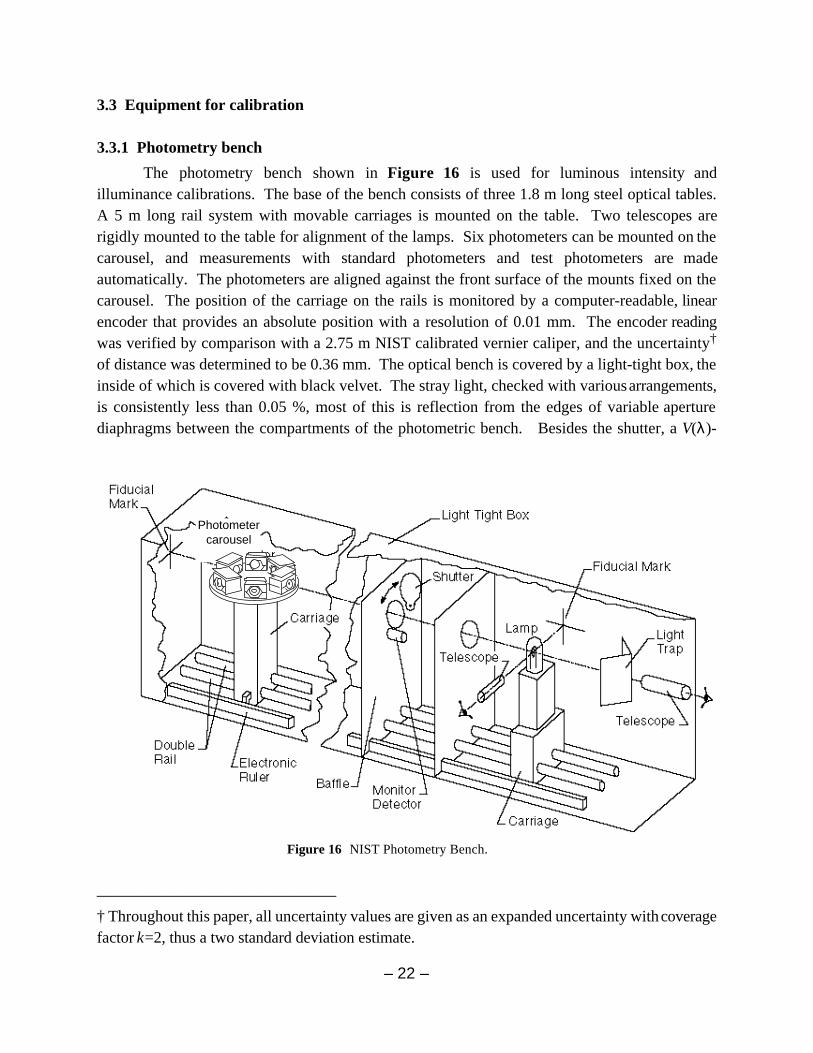
The photometry bench shown in Figure 16 is used for luminous intensity andilluminance calibrations. The base of the bench consists of three 1.8 m long steel optical tables.A 5 m long rail system with movable carriages is mounted on the table. Two telescopes arerigidly mounted to the table for alignment of the lamps. Six photometers can be mounted on thecarousel, and measurements with standard photometers and test photometers are madeautomatically. The photometers are aligned against the front surface of the mounts fixed on thecarousel. The position of the carriage on the rails is monitored by a computer-readable, linearencoder that provides an absolute position with a resolution of 0.01 mm. The encoder readingwas verified by comparison with a 2.75 m NIST calibrated vernier caliper, and the uncertainty†
of distance was determined to be 0.36 mm. The optical bench is covered by a light-tight box, theinside of which is covered with black velvet. The stray light, checked with various arrangements,is consistently less than 0.05 %, most of this is reflection from the edges of variable aperturediaphragms between the compartments of the photometric bench. Besides the shutter, a V(λ)-
– 22 –
Photometercarousel
Figure 16 NIST Photometry Bench.
––––––––––––––––––––––––––––––† Throughout this paper, all uncertainty values are given as an expanded uncertainty with coveragefactor k=2, thus a two standard deviation estimate.
corrected monitor detector is mounted to monitor the stability of the lamp during calibration ofphotometers. This monitor detector gives a consistent signal regardless of the shutter positionand the photometer mounted or not on the carriage.
3.3.2 Electrical power supply
All the standard lamps and test lamps are operated at a specified current rather than aspecified voltage because lamp voltage, in general, does not reproduce well due to the variation ofsockets used among customers. However, if the socket is designed well, the lamp voltagereproduces fairly well on the same socket, and the lamp voltage is useful to monitor for changesin the lamp.
The NIST photometric bench is equipped with a medium bipost-base socket which hasfour separate contacts, two for the current supply, and the other two for voltage measurements.For luminous intensity calibrations, the lamp voltage is reported, only for reference, without anuncertainty value. The bench is also equipped with a medium screw-base socket (E27) whichhas four contacts. Screw-based lamps submitted by a customer can be calibrated.
A DC constant-current power supply is used to operate standard lamps and test lamps.The lamp current is measured as the voltage across a reference current shunt (0.1 Ω), using a61/2 digit DVM, with an uncertainty better than 0.01 %. The DVM is on a one year calibrationcycle. The current shunt is periodically calibrated at three different current levels with anuncertainty of 0.005 %.
The lamp current is automatically controlled by a computer feedback system to keep thecurrent drift within ± 0.002 %. The power supply is operated in an external control mode, inwhich the output current is regulated by an external reference voltage. The external voltage issupplied by an 18 bit D-to-A converter controlled by the computer.
3.4 Calibration procedures
When a new lamp is calibrated for luminous intensity, the operating current of the lamp isfirst determined for a color temperature of 2856 K. When a submitted lamp is calibrated withthe lamp current specified by the customer, the color temperature of the lamp is measured andreported. The procedures for color temperature measurements are described in Section 7.
After the operating current of the lamp is assigned, the luminous intensity of the lamp iscalibrated using the following procedures. The test lamp is mounted on the photometry bench,and its orientation and position are aligned precisely according to the procedures described inSection 3.2.2. The lamp is operated on DC power with the electrical polarity as shown inFigure 10. The lamp current is ramped up slowly (~30 s) to the specified value, and allowed tostabilize (typically for 10 min). Then the illuminance from the test lamp at a distance ofapproximately 3.5 m is measured using three of the NIST standard photometers. The averageilluminance measured by the three photometers and the lamp-to-photometer distance are used todetermine the luminous intensity of the test lamp.
– 23 –
The measured illuminance is usually the average of five readings taken between 10 min to15 min after turning on the lamp. Each reading consists of twenty DVM samples with theshutter open, and ten DVM samples with the shutter closed. This process takes approximately0.5 min. The dark signal is subtracted from each reading. As soon as the measurement isfinished, the lamp current is ramped down and turned off. The operating time of the test lampis usually less than 15 min. The test lamp is operated and measured three times, and the averagevalue is reported.
When a luminous intensity measurement is made, the color temperature of the test lampis also measured if it is not known, and the spectral mismatch correction factor, as described inSection 3.1.4, is calculated and applied to the results. The temperature of the photometer duringcalibration is monitored and the correction factor, as described in Section 3.1.5, is applied to theresults. This correction is made automatically by the measurement program.
3.5 Uncertainty of calibration
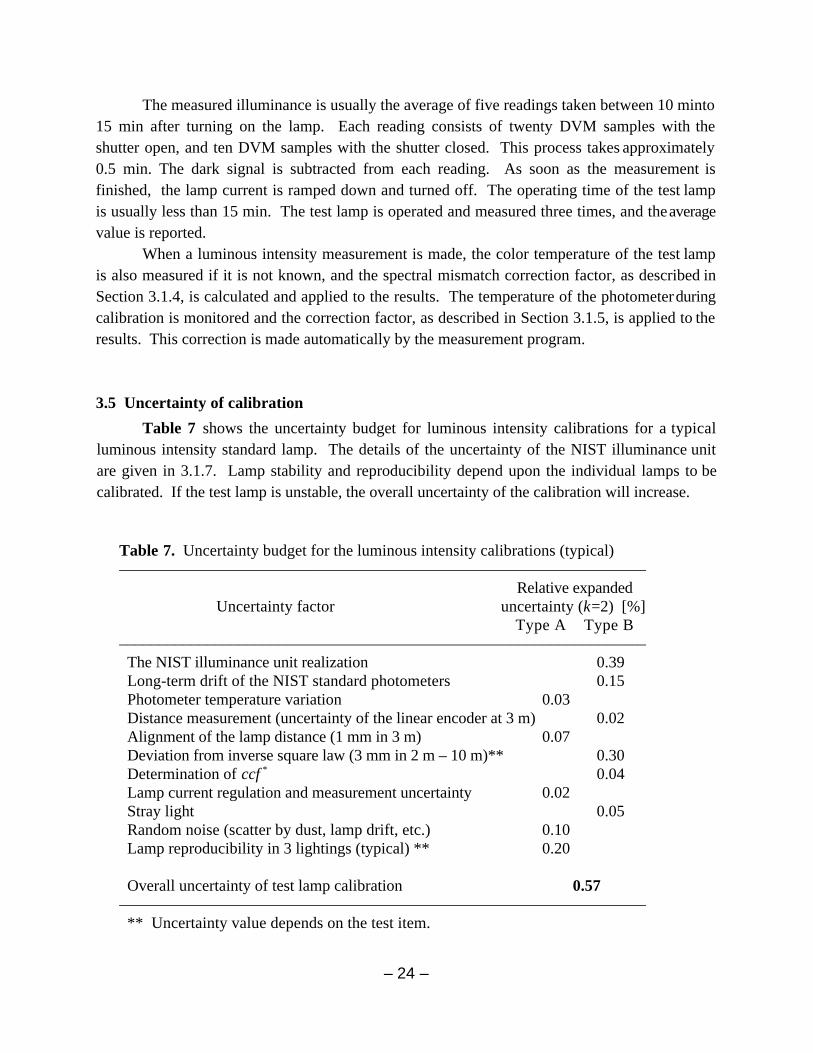
Table 7 shows the uncertainty budget for luminous intensity calibrations for a typicalluminous intensity standard lamp. The details of the uncertainty of the NIST illuminance unitare given in 3.1.7. Lamp stability and reproducibility depend upon the individual lamps to becalibrated. If the test lamp is unstable, the overall uncertainty of the calibration will increase.
Table 7. Uncertainty budget for the luminous intensity calibrations (typical)––––––––––––––––––––––––––––––––––––––––––––––––––––––––––––––––––
Relative expandedUncertainty factor uncertainty (k=2) [%]
Type A Type B––––––––––––––––––––––––––––––––––––––––––––––––––––––––––––––––––The NIST illuminance unit realization 0.39Long-term drift of the NIST standard photometers 0.15Photometer temperature variation 0.03Distance measurement (uncertainty of the linear encoder at 3 m) 0.02Alignment of the lamp distance (1 mm in 3 m) 0.07Deviation from inverse square law (3 mm in 2 m – 10 m)** 0.30Determination of ccf * 0.04 Lamp current regulation and measurement uncertainty 0.02Stray light 0.05Random noise (scatter by dust, lamp drift, etc.) 0.10Lamp reproducibility in 3 lightings (typical) ** 0.20
Overall uncertainty of test lamp calibration 0.57––––––––––––––––––––––––––––––––––––––––––––––––––––––––––––––––––** Uncertainty value depends on the test item.
– 24 –

4. Illuminance calibrations
Significant improvement in the quality of commercial photometers and illuminance metershas been made due to availability of high quality silicon photodiodes. As a result, many types ofcommercially available photometers can be used as photometric standards instead of traditionalluminous intensity standard lamps. Standard lamps are sensitive to mechanical shocks, changewith burning time, and drift during the stabilization period. Experience shows that wellmaintained photometers are less subject to such problems, and provide a dynamic range ofseveral orders of magnitude. NIST experience indicates that the short-term stability ofphotometers is superior to lamps, and although the long-term stability has not been tested formany types of photometers, a few particular types tested have shown satisfactory stability(~0.1 % per year). It should be noted that some photometers have shown changes greater than1 % in a year, making their use as standards difficult. In general, for luminous intensity andilluminance measurements, the use of standard photometers is recommended, but thephotometers should be calibrated frequently (at least once a year) until the long-term stabilitydata are accumulated for the particular photometers a user laboratory may employ.
4.1 Equipment for calibration
The equipment used for the calibration of photometers and illuminance meters is the sameequipment used in the luminous intensity calibrations described in 3.3.
4.2 Artifacts for calibration
Photometer heads or photometers (photometer heads with a display unit) and illuminancemeters are accepted for calibration by NIST. The requirements and recommendations forphotometers used as transfer standards and reference standards are described below.
4.2.1 Types of photometers and illuminance meters
A standard photometer head should have either a limiting aperture (whose area is muchsmaller than the photodiode area) or a flat diffuser such as an opal glass in front of the V(λ)-correction filter so that the reference plane of the photometer is accurately and clearly defined.Some commercial photometer heads only have a V(λ)-correction filter attached in front of thesilicon photodiode. If a photometer head does not have an aperture or a diffuser, the photodiodesurface might be used as the reference plane of the photometer head. In this case, due to therefraction index of the V(λ)-correction filter which is usually several mm in thickness, theeffective reference plane can be several mm from the photodiode surface. Sometimes, the frontsurface of the filter is simply defined as the reference plane of such photometer heads, in whichcase the true reference plane can be more than 1 cm from the filter surface. When the referenceplane is not correctly defined, the departure from the inverse square law causes the responsivityof the photometer to vary depending on the distance to the source, and serious errors may occur
– 25 –
when the photometer is used at close distances to the source. This is the same problem with alarge-size lamp, for which the inverse square law does not hold well at close distances. To avoidthese difficulties, standard photometers having a limiting aperture or a flat diffuser on the frontare recommended.
Some illuminance meter heads employ a dome-shaped or mesa-shaped diffuser in thefront. In this case, it is usually difficult to define the correct reference plane. Such illuminancemeters are not recommended to be used as standard photometers unless the meters are alwaysused at the same distance from the source. Also, illuminance meters with poor spectral matchand (or) with only a 3 digit display are not adequate for use as standard photometers.
Illuminance meters may have various structure of the light-receiving surface for cosinecorrection. The reference plane of the illuminance meter heads should be provided by thecustomer. Upon request, the reference plane of photometer heads (without an aperture or adiffuser) and illuminance meter heads can be experimentally determined.
4.2.2 Operation and handling of photometer heads and illuminance meters
Illuminance meters are generally not designed to measure illuminance at very closedistances to a source. It should be noted that the measurement error may increase greatly if anilluminance meter whose reference plane is not correctly defined is placed very close to a lightsource (e.g., less than 0.5 m).
As described in 3.1.5, the responsivity of a photometer can be a function of temperature.If the photometer is neither a temperature-controlled type nor a temperature-monitored type,the photometer must be used close to the calibration temperature to avoid errors. If not, thetemperature coefficient of the photometer should be measured, and correction factors should beapplied as appropriate. The photometer should be placed in the laboratory several hours inadvance of use so that the photometer’s temperature equilibrates to the ambient temperature.
At NIST, photometers and illuminance meters are calibrated using incandescent lampsoperated at 2856 K unless otherwise requested by the customer. In this case, when thephotometers are used to measure light sources other than incandescent lamps of that colortemperature, spectral mismatch errors occur, and in order to quantify or correct for this error, therelative spectral responsivity of the photometers or illuminance meters must be measured. Thedetails of this calibration are described in 4.3.2.
4.3 Calibration procedures
4.3.1 Illuminance responsivity of photometers
Photometers and photometer heads are calibrated for illuminance responsivity in A/lx,V/lx or readings/lx. Calibration is performed on the NIST photometry bench using a 1000 WFEL type lamp operated at 2856 K (CIE Illuminant A). The calibration is performed by direct
– 26 –

comparison with three of the NIST standard photometers. The responsivity is usually measuredat two distances, 2.5 m and 3.5 m from the lamp, at illuminance levels of 85 lx and 150 lx.Calibrations can also be made at other illuminance levels from 0.1 lx to 3000 lx for a linearitycheck, if requested by customers, using procedures described in 4.3.2. The procedure for regularcalibration is described below.
After the lamp has been stabilized, the illuminance on a reference point ~3 m from thelamp is first determined by three NIST standard photometers. This measurement is performedin the same manner as described in 3.4. Then the third NIST standard photometer is replaced bythe photometer under test, and the readings are recorded. If the reference plane of thephotometer head is located different from that of the NIST standard photometers, the distanceoffset is measured and recorded. The illuminance on the reference plane of the test illuminancemeter is calculated from the corrected distance to the lamp and the luminous intensity of thelamp. Data are usually taken within 5 min at each illuminance level. During the comparison, theluminous intensity stability of the lamp is monitored by the monitor detector installed in thephotometry bench (See 3.3.1). The ambient temperature during the calibration (usually ~25 °C)is measured and reported.
4.3.2 Illuminance meter calibration
Calibrations for illuminance meters are performed basically the same way as described in4.3.1, using an FEL type lamp at 2856 K, with various illuminance levels from 100 lx to 3000 lxat distances from 0.6 m to 3 m. Since the distance from the lamp to the photometer is small athigher illuminance levels, the definition of the reference plane of the illuminance meter head isimportant as discussed previously. For lower illuminance levels, a variable slit is used in front ofthe FEL lamp so that the illuminance levels can be lowered with negligible change of colortemperature, and without changing the lamp.
At each illuminance level, the NIST standard photometer is replaced by the illuminancemeter head under test with their reference planes positioned at the same location. During thecomparison, the luminous intensity stability of the lamp is monitored by the monitor detectorinstalled in the photometry bench. The ambient temperature of the photometer under test duringthe calibration (usually ~25 °C) is measured and reported.
When an illuminance meter is calibrated, the errors of the reading at each illuminance levelare reported. The meter reading is usually not adjusted. However, if the illuminance meter is somanufactured that the user can adjust the readings easily, the meter can be adjusted by NISTupon request by customers. In this case the instructions for the reading adjustment should beprovided by the customer.
Illuminance meters can be calibrated for specific sources other than 2856 K source uponrequest by customers. In this case, the calibration is first performed using the 2856 K source asdescribed in 4.3.1. Then, the spectral mismatch correction factors for the specific sources areobtained by the following procedure.
– 27 –
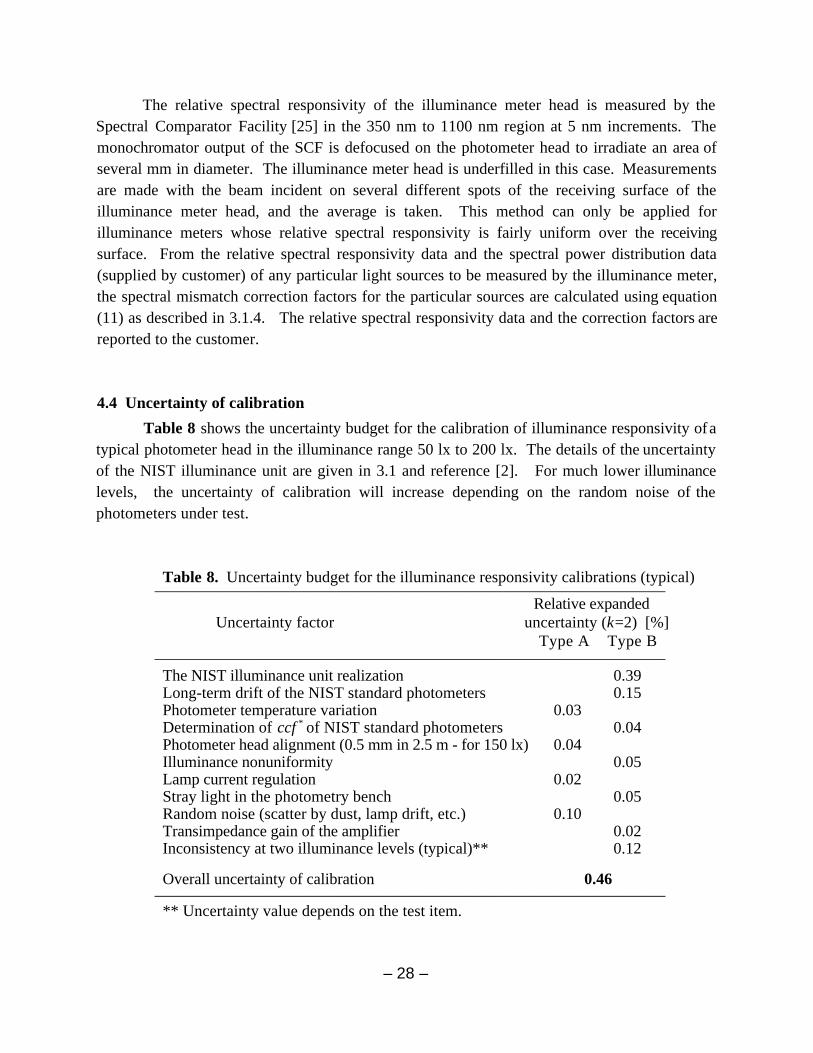
The relative spectral responsivity of the illuminance meter head is measured by theSpectral Comparator Facility [25] in the 350 nm to 1100 nm region at 5 nm increments. Themonochromator output of the SCF is defocused on the photometer head to irradiate an area ofseveral mm in diameter. The illuminance meter head is underfilled in this case. Measurementsare made with the beam incident on several different spots of the receiving surface of theilluminance meter head, and the average is taken. This method can only be applied forilluminance meters whose relative spectral responsivity is fairly uniform over the receivingsurface. From the relative spectral responsivity data and the spectral power distribution data(supplied by customer) of any particular light sources to be measured by the illuminance meter,the spectral mismatch correction factors for the particular sources are calculated using equation(11) as described in 3.1.4. The relative spectral responsivity data and the correction factors arereported to the customer.
4.4 Uncertainty of calibration
Table 8 shows the uncertainty budget for the calibration of illuminance responsivity of atypical photometer head in the illuminance range 50 lx to 200 lx. The details of the uncertaintyof the NIST illuminance unit are given in 3.1 and reference [2]. For much lower illuminancelevels, the uncertainty of calibration will increase depending on the random noise of thephotometers under test.
Table 8. Uncertainty budget for the illuminance responsivity calibrations (typical)––––––––––––––––––––––––––––––––––––––––––––––––––––––––––––––––
Relative expandedUncertainty factor uncertainty (k=2) [%]
Type A Type B––––––––––––––––––––––––––––––––––––––––––––––––––––––––––––––––The NIST illuminance unit realization 0.39Long-term drift of the NIST standard photometers 0.15Photometer temperature variation 0.03Determination of ccf * of NIST standard photometers 0.04 Photometer head alignment (0.5 mm in 2.5 m - for 150 lx) 0.04Illuminance nonuniformity 0.05Lamp current regulation 0.02Stray light in the photometry bench 0.05Random noise (scatter by dust, lamp drift, etc.) 0.10Transimpedance gain of the amplifier 0.02Inconsistency at two illuminance levels (typical)** 0.12
Overall uncertainty of calibration 0.46––––––––––––––––––––––––––––––––––––––––––––––––––––––––––––––––** Uncertainty value depends on the test item.
– 28 –
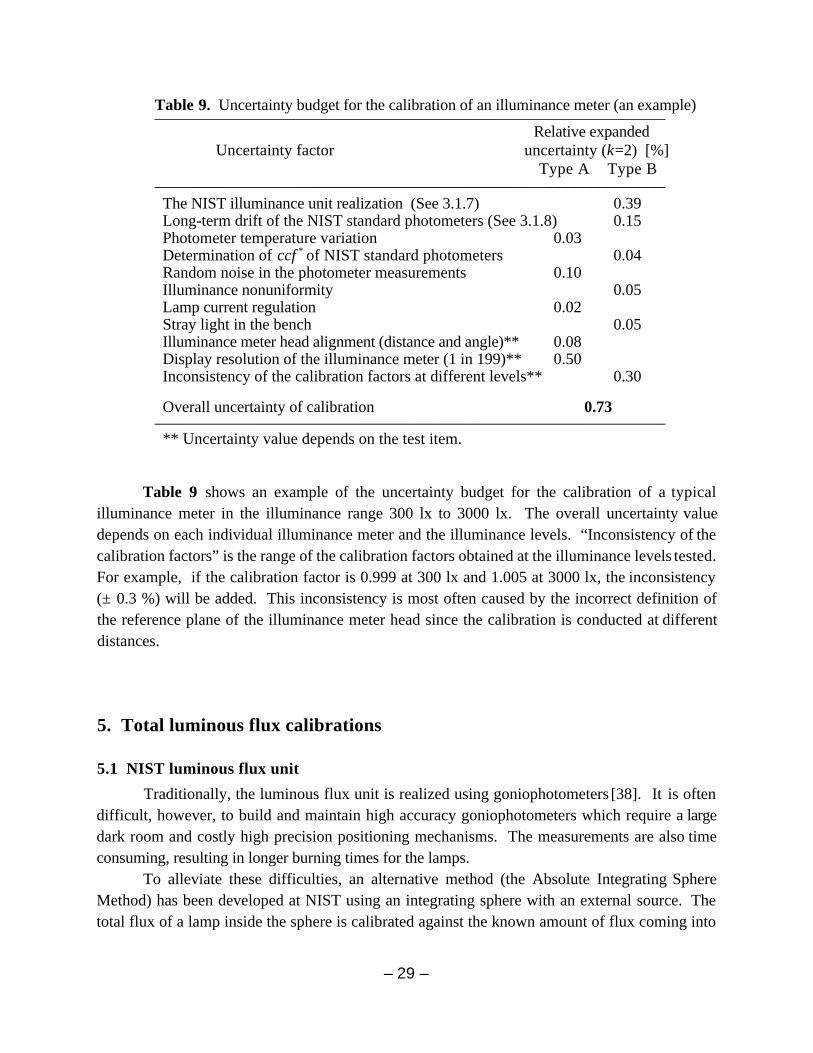
Table 9. Uncertainty budget for the calibration of an illuminance meter (an example) ––––––––––––––––––––––––––––––––––––––––––––––––––––––––––––––––
Relative expandedUncertainty factor uncertainty (k=2) [%]
Type A Type B––––––––––––––––––––––––––––––––––––––––––––––––––––––––––––––––The NIST illuminance unit realization (See 3.1.7) 0.39Long-term drift of the NIST standard photometers (See 3.1.8) 0.15Photometer temperature variation 0.03Determination of ccf * of NIST standard photometers 0.04 Random noise in the photometer measurements 0.10Illuminance nonuniformity 0.05Lamp current regulation 0.02Stray light in the bench 0.05Illuminance meter head alignment (distance and angle)** 0.08Display resolution of the illuminance meter (1 in 199)** 0.50Inconsistency of the calibration factors at different levels** 0.30
Overall uncertainty of calibration 0.73––––––––––––––––––––––––––––––––––––––––––––––––––––––––––––––––** Uncertainty value depends on the test item.
Table 9 shows an example of the uncertainty budget for the calibration of a typicalilluminance meter in the illuminance range 300 lx to 3000 lx. The overall uncertainty valuedepends on each individual illuminance meter and the illuminance levels. “Inconsistency of thecalibration factors” is the range of the calibration factors obtained at the illuminance levels tested.For example, if the calibration factor is 0.999 at 300 lx and 1.005 at 3000 lx, the inconsistency(± 0.3 %) will be added. This inconsistency is most often caused by the incorrect definition ofthe reference plane of the illuminance meter head since the calibration is conducted at differentdistances.
5. Total luminous flux calibrations
5.1 NIST luminous flux unit
Traditionally, the luminous flux unit is realized using goniophotometers [38]. It is oftendifficult, however, to build and maintain high accuracy goniophotometers which require a largedark room and costly high precision positioning mechanisms. The measurements are also timeconsuming, resulting in longer burning times for the lamps.
To alleviate these difficulties, an alternative method (the Absolute Integrating SphereMethod) has been developed at NIST using an integrating sphere with an external source. Thetotal flux of a lamp inside the sphere is calibrated against the known amount of flux coming into
– 29 –

the sphere from the external source through an aperture. This method has the advantage that aconventional integrating sphere can be used with minor modifications, and the sphere can still beused for ordinary substitution measurements. Measurements are accomplished faster, resultingin shorter burning times for the lamps. Corrections are needed for the spatial nonuniformity andthe incident angle dependence of the sphere response and the spectral mismatch of the integratingsphere system. The NIST luminous flux unit has been maintained using the integrating spheremethod since 1995, and is directly tied to the NIST detector-based candela established in 1992.
5.1.1 Principles of the Absolute Integrating Sphere Method [30-32]
Figure 17 shows the geometry of an integrating sphere designed originally for thismethod. An opening is placed at an angle of 135° away from the detector, and the flux from theexternal source is introduced through a calibrated aperture placed in front of the opening. Twobaffles are used to shield the detector and the opening from direct illumination by the internalsource. The detector is exposed to the first reflection of the introduced flux from the externalsource in order to equalize the sphere responsivity for the internal source and that for theexternal source.
Detector
Baffle 1
Baffle 2Internalsource
External source
IlluminanceE
area A
Φv,i
Φv,e
Limitingaperture
a
Figure 17 Basic geometry of the Absolute Integrating Sphere Method
The luminous flux Φv,e (lm) from the external source introduced into the sphere is given by
Φv,e = Ea A , (14)
where Ea is the average illuminance (lx) over the limiting aperture of known area A. The internalsource or the external source is turned on alternately. The introduced flux Φv,e is used as areference, and the luminous flux of the internal source Φv,i is measured in comparison with theflux Φv,e as given by
– 30 –
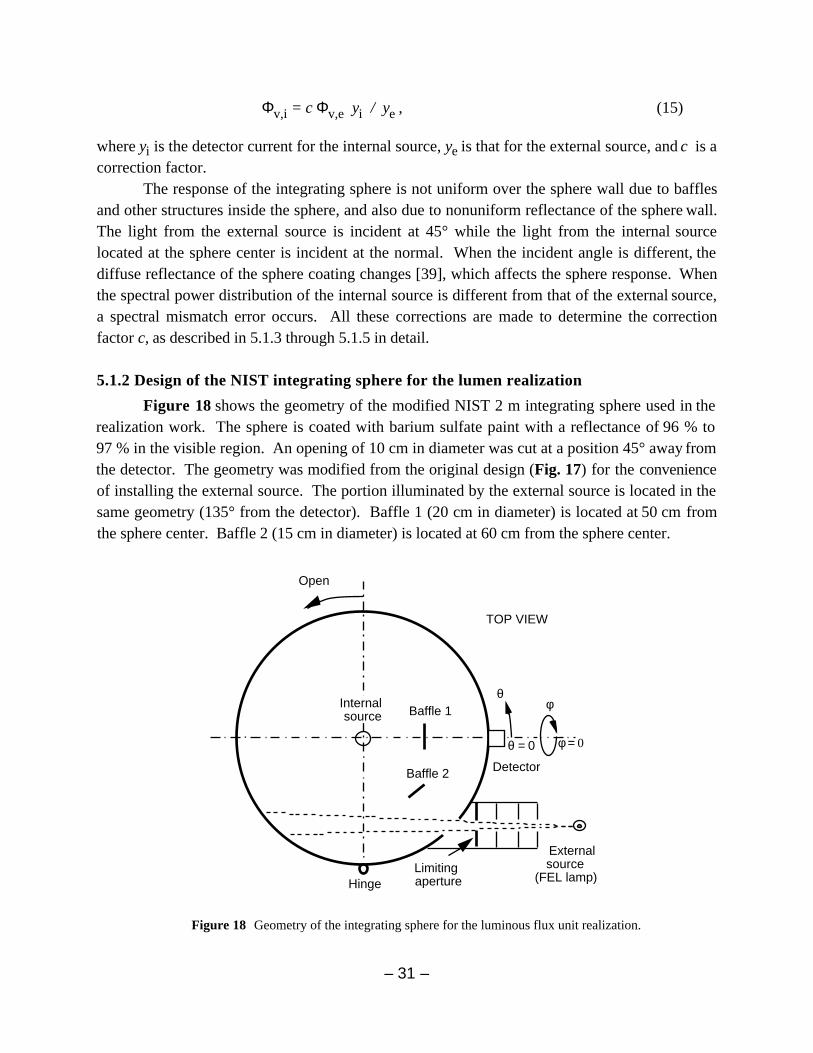
Φv,i = c Φv,e yi / ye , (15)
where yi is the detector current for the internal source, ye is that for the external source, and c is acorrection factor.
The response of the integrating sphere is not uniform over the sphere wall due to bafflesand other structures inside the sphere, and also due to nonuniform reflectance of the sphere wall.The light from the external source is incident at 45° while the light from the internal sourcelocated at the sphere center is incident at the normal. When the incident angle is different, thediffuse reflectance of the sphere coating changes [39], which affects the sphere response. Whenthe spectral power distribution of the internal source is different from that of the external source,a spectral mismatch error occurs. All these corrections are made to determine the correctionfactor c, as described in 5.1.3 through 5.1.5 in detail.
5.1.2 Design of the NIST integrating sphere for the lumen realization
Figure 18 shows the geometry of the modified NIST 2 m integrating sphere used in therealization work. The sphere is coated with barium sulfate paint with a reflectance of 96 % to97 % in the visible region. An opening of 10 cm in diameter was cut at a position 45° away fromthe detector. The geometry was modified from the original design (Fig. 17) for the convenienceof installing the external source. The portion illuminated by the external source is located in thesame geometry (135° from the detector). Baffle 1 (20 cm in diameter) is located at 50 cm fromthe sphere center. Baffle 2 (15 cm in diameter) is located at 60 cm from the sphere center.
– 31 –
Baffle 1
Detector
External source(FEL lamp)
Baffle 2
Internal source
Limitingaperture
Open
Hinge
φ
θ = 0
θ
TOP VIEW
φ = 0
Figure 18 Geometry of the integrating sphere for the luminous flux unit realization.

The detector is a V(λ)-corrected and cosine-corrected photometer with an opal diffuser(20 mm diameter) attached in front. It has a built-in transimpedance amplifier with gain settingsfrom 104 V/A to 1010 V/A calibrated at each range (except 1010 range) with an uncertainty of0.02 %. A built-in temperature sensor allows for corrections of the photometer temperaturedrift. The linearity of the photometer was measured, using a beam conjoiner instrument [36], tobe constant over a luminous flux range of 10-1 lm to 105 lm to within 0.05 %.
A 1000 W frosted FEL type quartz halogen lamp operated at 2856 K is used as theexternal source. The lamp is placed 70 cm from the limiting aperture, introducing a flux of~2.7 lm through the 40 mm aperture. Two stainless steel limiting apertures of 40 mm and 50 mmdiameter and 3 mm thick, having sharp edges, are used. The area of the apertures was determinedby the NIST Fabrication Technology Division with an uncertainty of 0.03 %. The apertures areplaced as close to the opening as possible to minimize diffraction losses [40]. This facility isbeing reconstructed employing a new 2.5 m integrating sphere.
5.1.3 Correction for the spatial nonuniformity of the sphere responsivity
The responsivity of the integrating sphere is not uniform over the sphere wall. Thespatial response distribution function (SRDF), K(θ, φ), of the sphere is defined as the sphereresponse at a point (θ, φ) of the sphere wall (or on a baffle surface) divided by the sphereresponse at (0, 0). K(θ, φ) can be obtained by measuring the detector signal while rotating anarrow beam inside the sphere. K(θ, φ) is then normalized for the sphere response to anisotropic point source. The normalized SRDF, K*(θ, φ), is defined as
K*(θ,φ) = 4π K(θ,φ) /
φ =0
2π
K(θ,φ)sin θ dθ dφθ =0
π
. (16)
Using K*(θ,φ), the spatial correction factor scfe for the external source with respect to anisotropic point source is given by
scfe = 1 / K*(θe,φe) , (17)
where (θe,φe) is the point on which the center of the illuminated area by the external source islocated. It is assumed that the area illuminated by the external source is small enough so that
K*(θe,φe) represents the average SRDF over the area. The spatial correction factor, scfi, for theinternal source with respect to an isotropic point source is given by
scf i = 1 /
φ =0
2π
I *(θ ,φ) K *(θ,φ) sinθ dθ dφθ =0
π
, (18)
where I *(θ,φ) is the normalized luminous intensity distribution of the internal source given by
– 32 –
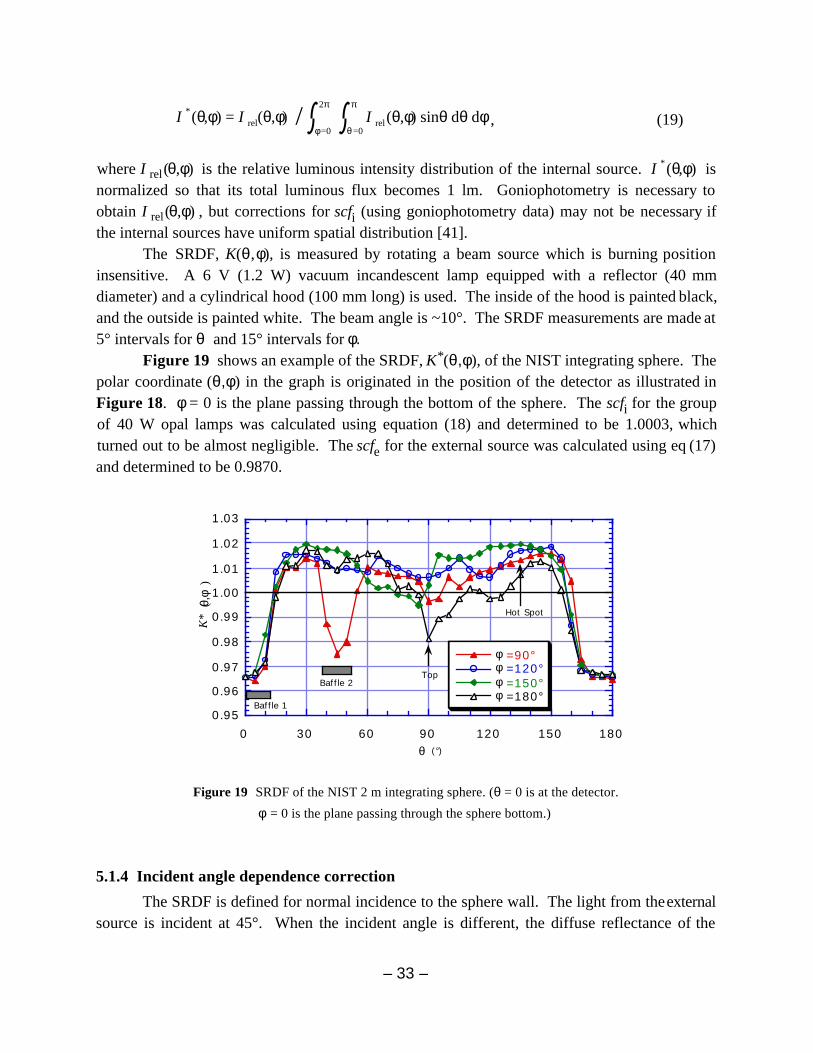
I *(θ,φ) = I rel(θ,φ) /
φ =0
2πI rel(θ,φ) sinθ dθ dφ
θ =0
π
, (19)
where I rel(θ,φ) is the relative luminous intensity distribution of the internal source. I *(θ,φ) isnormalized so that its total luminous flux becomes 1 lm. Goniophotometry is necessary toobtain I rel(θ,φ) , but corrections for scfi (using goniophotometry data) may not be necessary ifthe internal sources have uniform spatial distribution [41].
The SRDF, K(θ,φ), is measured by rotating a beam source which is burning positioninsensitive. A 6 V (1.2 W) vacuum incandescent lamp equipped with a reflector (40 mmdiameter) and a cylindrical hood (100 mm long) is used. The inside of the hood is painted black,and the outside is painted white. The beam angle is ~10°. The SRDF measurements are made at5° intervals for θ and 15° intervals for φ.
Figure 19 shows an example of the SRDF, K*(θ,φ), of the NIST integrating sphere. Thepolar coordinate (θ,φ) in the graph is originated in the position of the detector as illustrated inFigure 18. φ = 0 is the plane passing through the bottom of the sphere. The scfi for the groupof 40 W opal lamps was calculated using equation (18) and determined to be 1.0003, whichturned out to be almost negligible. The scfe for the external source was calculated using eq (17)and determined to be 0.9870.
0.95
0.96
0.97
0.98
0.99
1.00
1.01
1.02
1.03
0 30 60 90 120 150 180
=90° =120° =150° =180°
K*
θ (°)
φφφφ
θ,φ
(
)
Baffle 2
Hot Spot
Baffle 1
Top
Figure 19 SRDF of the NIST 2 m integrating sphere. (θ = 0 is at the detector.
φ = 0 is the plane passing through the sphere bottom.)
5.1.4 Incident angle dependence correction
The SRDF is defined for normal incidence to the sphere wall. The light from the externalsource is incident at 45°. When the incident angle is different, the diffuse reflectance of the
– 33 –
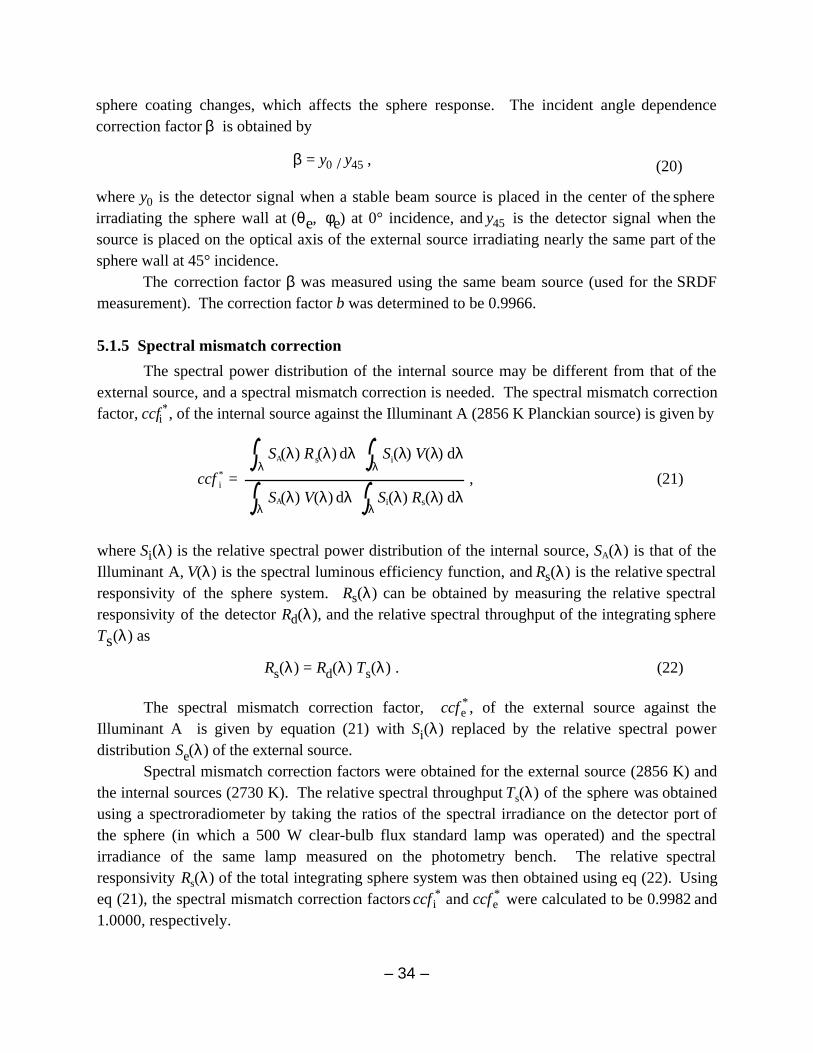
sphere coating changes, which affects the sphere response. The incident angle dependencecorrection factor β is obtained by
β = y0 / y45 , (20)
where y0 is the detector signal when a stable beam source is placed in the center of the sphereirradiating the sphere wall at (θe, φe) at 0° incidence, and y45 is the detector signal when thesource is placed on the optical axis of the external source irradiating nearly the same part of thesphere wall at 45° incidence.
The correction factor β was measured using the same beam source (used for the SRDFmeasurement). The correction factor b was determined to be 0.9966.
5.1.5 Spectral mismatch correction
The spectral power distribution of the internal source may be different from that of theexternal source, and a spectral mismatch correction is needed. The spectral mismatch correctionfactor, ccfi
*, of the internal source against the Illuminant A (2856 K Planckian source) is given by
ccf i* =
SA(λ) R s(λ) dλλ
Si(λ) V(λ) dλλ
SA(λ) V(λ) dλλ
Si(λ) Rs(λ) dλλ
, (21)
where Si(λ) is the relative spectral power distribution of the internal source, SA(λ) is that of theIlluminant A, V(λ) is the spectral luminous efficiency function, and Rs(λ) is the relative spectralresponsivity of the sphere system. Rs(λ) can be obtained by measuring the relative spectralresponsivity of the detector Rd(λ), and the relative spectral throughput of the integrating sphereTs(λ) as
Rs(λ) = Rd(λ) Ts(λ) . (22)
The spectral mismatch correction factor, ccfe* , of the external source against the
Illuminant A is given by equation (21) with Si(λ) replaced by the relative spectral powerdistribution Se(λ) of the external source.
Spectral mismatch correction factors were obtained for the external source (2856 K) andthe internal sources (2730 K). The relative spectral throughput Ts(λ) of the sphere was obtainedusing a spectroradiometer by taking the ratios of the spectral irradiance on the detector port ofthe sphere (in which a 500 W clear-bulb flux standard lamp was operated) and the spectralirradiance of the same lamp measured on the photometry bench. The relative spectralresponsivity Rs(λ) of the total integrating sphere system was then obtained using eq (22). Usingeq (21), the spectral mismatch correction factors ccf i
* and ccfe* were calculated to be 0.9982 and
1.0000, respectively.
– 34 –

5.1.6 Calibration of the primary standard lamps
The illuminance from the external source at the aperture plane was measured using atransfer photometer which was calibrated against the NIST standard photometers underillumination by the same frosted FEL lamp (used as the external source, operated at 2856 K), at adistance of ~3.5 m. The transfer photometer, with an opal diffuser (10 mm in diameter) in front,is equipped with a built-in temperature sensor which allow for compensation of the photometertemperature drift.
The illuminance distribution over the aperture area was measured by spatially scanningthe transfer photometer to determine the average illuminance factor, ka, which is a ratio of theaverage illuminance Ea to the illuminance on the aperture center, Ec. Once ka is determined, onlyEc needs to be measured to obtain Ea.
The transfer photometer is attached to a holding plate which can be mountedinterchangeably with the aperture. The position of the photometer on the holding plate isaligned, using an alignment telescope, so that the reference plane of the photometer and that ofthe limiting aperture coincide when they are mounted. After measuring the illuminance Ec, theaperture is mounted, and the signal of the integrating sphere photometer, ye, is taken. Theintegrating sphere responsivity, Rs’, is then determined by
Rs’= ye ccfe
* scfe β / ( Ec ka S ) . (23)
Rs’ is determined with a particular internal source (a representative lamp) inside the sphere. If adifferent test lamp is measured, a self-absorption correction must be applied. The self-absorption correction factor α is obtained by
α = yr,e / yt,e , (24)
where yr,e is the detector signal with the representative lamp inside the sphere, and yt,e is thedetector signal with the test lamp inside the sphere, when only the external source is operated.Then the total luminous flux Φi (lm) of an internal source (test lamp) is obtained by
Φi = yi ccf i
* scfi α / Rs’. (25)
According to this procedure, a group of twelve 40 W opal-bulb incandescent lamps arecalibrated to serve as the total luminous flux primary standards. At the same time, eight 60 Winside frosted incandescent lamps are also calibrated to serve as working standards. Routinecalibrations for luminous flux are performed using these working standard lamps. The workingstandard lamps are recalibrated at every 10 h of total operating time. The uncertainty budget forthe luminous flux realization is shown in Table 10.
– 35 –

Table 10. Uncertainty budget for the NIST 1995 luminous flux unit–––––––––––––––––––––––––––––––––––––––––––––––––––––––––––––––––––
Relative expandedUncertainty factor uncertainty (k=2) [%]
Type A Type B–––––––––––––––––––––––––––––––––––––––––––––––––––––––––––––––––––Uncertainty of the determination of Φe composed of:
The NIST Illuminance unit realization 0.39Ave. long-term drift of the standard photometers (2 months) 0.03Transfer to the transfer photometer 0.07Transfer photometer position alignment (±0.2 mm) 0.06Aperture alignment (difference of the two apertures) 0.05Aperture area 0.03Average illuminance factor ka 0.03Stray light 0.05Drift of the external source during calibration 0.02
Uncertainty of the lamp luminous flux with respect to Φe composed of:Spatial nonuniformity correction factor scf i / scfe 0.30Incident angle dependence correction factor β 0.06Spectral mismatch correction factor ccf i
* / ccfe* 0.03
Self-absorption correction factor α 0.03Random variation in the Rs determination 0.04Detector linearity 0.05Reproducibility of the standard lamps 0.06
Overall uncertainty of the NIST 1995 luminous flux unit 0.53–––––––––––––––––––––––––––––––––––––––––––––––––––––––––––––––––––
5.2 Artifacts for calibration
5.2.1 Types of test lamps
For many years NIST has issued gas-filled, incandescent lamps (100 W, 200 W, 500 W,and 1000 W) with medium screw base or mogul screw base and miniature lamps ranging from1.2 W to 30 W as luminous flux transfer standards. These lamps and other standard qualityincandescent lamps, including miniature lamps, ranging from 0.1 lm to 105 lm are accepted forcalibration at NIST.
Four foot linear fluorescent lamps of any color submitted by customers are also acceptedfor calibration at NIST, and while other types of fluorescent lamps are currently not accepted,there are plans to expand the types of fluorescent lamps approved for calibration.
At the moment, NIST does not provide luminous flux standard lamps due tounavailability of standard quality lamps, although a search for commercially available lamps forthis purpose is underway.
– 36 –
When lamps are submitted to NIST for calibration, the lamps must be seasoned andtested for stability by the customer. In case of new lamps, the lamps usually have to beseasoned for 5 % of the rated life time, at the current to be used for calibration. The operatingcurrent, or operating color temperature, and burning position must be specified by the customer.
For miniature lamps, the size of the sockets tend to be much larger relative to the size ofthe lamps. When a miniature lamps is mounted in a socket, the total flux may decreasesignificantly due to the absorption by the socket surfaces. Sometimes miniature lamps arecalibrated in combination with a particular socket, and in such cases, a combination of lamp andsocket is required as a calibration artifact.
5.2.2 Operation and handling of test lamps
As with other standard lamps, care must be shown in the handling of luminous fluxlamps. Lamps should be handled very carefully to avoid mechanical shocks to the filament, andthe bulb of the lamps should not be touched with bare hands. Before calibration, the bulb of thelamps should be cleaned with a soft, lint-free cloth to remove any dust from the packing material.Lamps should be kept in a container when not used.
Incandescent standard lamps should be operated on DC power with the specifiedpolarity, and only at the current specified in the calibration report. The lamp current should beramped up and down slowly (approximately 30 s). Photometric measurements should be madeafter the lamp has stabilized (approximately 10 min after turning on).
Most of the lamps, including gas-filled tungsten lamps, are sensitive to burning position.The calibrated lamps must be operated in the same burning position as described in thecalibration report. Linear fluorescent lamps are always operated in the horizontal position.Linear fluorescent lamps should be operated on AC power at a specified current, using areference ballast as described in the calibration report. Calibration can be performed with thecathode power either on or off by request from the customer. The luminous flux of fluorescentlamps changes significantly with ambient temperature. The ambient temperature (usuallymeasured at the back side of the baffle) must be controlled within 25 °C ± 1 °C. Before startingthe measurements, the lamps should be stabilized for 15 min with the integrating sphere open.When the measurement starts, the sphere should be closed very slowly to avoid drafts.
5.3 Equipment for calibration
5.3.1 2 m integrating sphere
Figure 20 shows the geometry of the NIST 2 m integrating sphere in the routinecalibration setting. The integrating sphere is equipped with a V(λ)-corrected, cosine-correcteddetector, a baffle screen, an auxiliary lamp, a temperature sensor, and a spectroradiometer.
– 37 –

TOP VIEW
λBaffle
Auxiliary lamp
Barium Sulfate
V( ) detector
Open
Incandescnetlamp
Fluorescentlamp
(20 cm diam.)For Inc.
For FL(8 cmx 75 cm)
Temp.sonsor
Diode-arrayspectroradiometer
Figure 20 NIST 2 m integrating sphere set up for routine calibrations.
A baffle of 20 cm or 30 cm diameter is used for incandescent lamps. A rectangular baffle(8.5 cm x 75 cm) is used for fluorescent lamps. The rectangular baffle has a circular part of15 cm in diameter in the center so that either standard lamps or fluorescent lamps can be baffled.The baffles are placed at 1/2 the sphere radius from the lamp.
The V(λ)-corrected detector is of the same design as the NIST standard photometers forthe illuminance unit, but equipped with an opal glass diffuser. The detector has a linearityresponse in the range 10-10 A to 10 -4 A. Based on these characteristics, total luminous flux from10-1 lm to 105 lm can be measured in direct substitution with total luminous flux standard lampsof any wattage.
The sphere wall is coated with barium sulfate paint with diffuse reflectanceapproximately 0.97 in the visible region. However, the reflectance of the coating drops slightlyin the shorter wavelength region, resulting in a significant drop of sphere throughput in thatregion, which affects the total spectral response of the sphere system. The spectral throughputof the sphere is obtained by measuring the relative spectral irradiance of a tungsten lampoperated inside and outside the sphere with a spectroradiometer. The distribution temperatureof this lamp, as a function of emitting angle, is fairly uniform (within ±10 K) over the entire solidangle. The measured spectral throughput of the sphere is shown in Figure 21 (solid line).
The spectral throughput data are multiplied by the spectral responsivity of the detector(broken line) to obtain the spectral responsivity of the total system as shown in the dotted line.This data is used to obtain the spectral mismatch correction factors for the test lamps as givenby eq (21). For incandescent lamps, the spectral mismatch correction factors, ccf *(Td) , arefitted to a polynomial function of the distribution temperature Td as
– 38 –

ccf *(Td) = M j TdjΣ
j = 0
2
. (26)
This function obtained for the NIST 2 m integrating sphere is shown in Figure 22. Theintegrating sphere is also equipped with an auxiliary lamp (30 W tungsten) on the sphere wall.The auxiliary lamp is used to measure the self-absorption effects of a lamp in the sphere.
0
0.2
0.4
0.6
0.8
1
1.2
400 450 500 550 600 650 700 750
Photometer
Overall system
CIE V( )
Sphere
Rela
tive
Res
pons
e
Wavelength (nm)
λ
Figure 21 Spectral characteristics of the NIST integrating sphere.
0.97
0.98
0.99
1
1.01
1.02
1.03
2000 2200 2400 2600 2800 3000 3200
Cor
rect
ion
fact
or
Distribution temperature [K]
ccf* = M0 + M
1*T
d +M
2*T
d2
0.92195M0
4.0198e-05M1
-4.499e-09M2
ccf*
Td
Figure 22 Spectral mismatch correction factor of the NIST 2 m integrating sphereas a function of the distribution temperature of a Planckian source.
– 39 –

The room temperature of the Photometry Laboratory at NIST is controlled to beapproximately 24 °C. A temperature sensor is mounted at the back side of the baffle, and the airtemperature inside the sphere during measurement is monitored. The temperature inside thesphere tends to increase when a lamp is operated in the sphere. This provides for an ambienttemperature in the sphere of approximately 25 °C.
5.3.2 Electrical facility for incandescent lamps
All the standard lamps and test lamps are operated at a specified current rather than aspecified voltage because the lamp voltage, in general, does not reproduce well due to theconstruction of the sockets used among customers. However, lamp voltages reproduce fairlywell on the same socket, and the lamp voltage is a useful indicator of changes in the lamps.
The NIST 2 m integrating sphere can be equipped with a medium screw base socket,mogul screw base socket, medium bi-post base socket, or a special small socket (top surface is3 mm in diameter) for miniature lamps with leads. These are two-contact sockets, but fourseparate wires, two for the current supply and the other two for voltage measurements, aresoldered to separate parts of the socket. For luminous flux calibration, the lamp voltage isreported, only for reference purposes, without an uncertainty value.
A DC constant-current power supply is used to operate standard lamps and test lamps.The lamp current is measured as the voltage across a reference current shunt (0.1 Ω), using a61/2 digit DVM with a stated uncertainty better than 0.01 %. The DVM is calibrated every12 months. The current shunt is periodically calibrated with an uncertainty of 0.005 %.
The lamp current is automatically controlled by a computer feedback system to keep thecurrent drift within ± 0.002 %. The power supply is operated in an external control mode, inwhich the output current is regulated by an external reference voltage. The external voltage issupplied by an 18 bit D-to-A converter which is controlled by the computer.
5.3.3 Electrical facility for fluorescent lamp
The electrical circuits for fluorescent lamp measurements are constructed according to theIES Guide LM-9-1988 [42] and ANSI standards [43, 44]. A regulated AC power supply(1 kVA, 60 Hz) is used as the main power supply. The output voltage is transformed intohigher voltage (400 V maximum) by using a variac and a step-up transformer. The high voltage isfed to a measurement circuit with a reference ballast. Figure 23 shows the measurement circuitfor rapid start type linear fluorescent lamps.
Prior to photometric measurements, the electrical parameters of the measurement circuitare set up according to the specification of the lamp to be tested. The cathode transformer iscalibrated, in advance, in terms of the primary voltage needed to provide the desired secondaryvoltage under normal load conditions, and the power loss in the transformer under this normalload condition. The input voltage on V3 is adjusted to the calibrated value. Input power for thecathode transformer is read on W2. The impedance (reactance and resistance) of the reference
– 40 –

ballast is set in accordance with the specification of the lamp. The lamp is mounted on thesocket, and turned on, and the supply voltage V1 is adjusted so that the lamp current A1 equalsthe specified value. When the lamp current is adjusted, the cathode power is usually kept on.Measurements can be made with the cathode power off if requested by customer. Duringphotometric measurements, the supply voltage, V1, the lamp current, A1, the lamp voltage, V2,and the lamp power, W1, and the cathode power, W2 are measured and recorded. If the cathodepower is kept on during the measurements, the sum of W1 and W2 (corrected by the power lossof the cathode transformer) is reported as the total lamp power.
5.4 Calibration procedures
5.4.1 Correction for the sphere detector temperature
When a lamp is turned on in the integrating sphere, the sphere detector is heated due toheat from the lamp. For a 1000 W incandescent lamp that is turned on for 10 min in the NIST2 m integrating sphere, the detector temperature increases by ~3 °C. The responsivity of thesphere detector slightly changes with its temperature and is monitored with a temperature sensorinstalled in the detector package. The temperature coefficient cp, of the photometric responsivityof the detector was measured in a temperature chamber, and found to be - 0.088 %/°C, and thedetector signal is corrected (multiplied) by the temperature correction factor, k(Tp), as given by
k(Tp) = 1 - (Tp - Tr) cp , (27)
– 41 –
Step-uptransformer
Cathodetransformer
AC regulated power supply
Wattmeter W
Reference ballast
Wattmeter W
A1
V1
V3
V2
LAM
P
1
2
Figure 23 Measurement circuit for a rapid start fluorescent lamp.

where Tp is the detector temperature at the measurement, Tr is a reference temperature that canbe chosen arbitrary. At NIST, Tr = 298 K is used. In other words, the detector signal is alwayscorrected to the value at 298 K.
5.4.2 Self-absorption correction
As the first step of the luminous flux calibration, the self-absorption of the lamps ismeasured. The auxiliary lamp (30 W miniature lamp) in the 2 m integrating sphere is turned onand allowed to stabilize for 15 min. The detector signal y01 is first taken with the test lamps andlamp holders removed from the sphere (null condition). Then the detector signal, yi, is takenwith each standard lamp and test lamp (1,...,i,..,n ) plus appropriate holders installed in thesphere. These lamps are not turned on during self-absorption measurements. Then the detectorsignal, y02 , is taken for the null condition again, and the self-absorption factor, αi , of lamp i isobtained by,
αi = yi / (y01 + y02)/ 2. (28)
The measured detector signal for lamp i is divided by αi for the self-absorption correction.
5.4.3 Spectral mismatch correction
The spectral power distributions of all the standard lamps and test lamps are measuredusing the spectroradiometer described in Section 7.4. The spectroradiometer is first calibrated bymeasuring a relative spectral radiant flux standard lamp operated in the sphere, and subsequentlythe test lamps are measured. For incandescent lamps, only the color temperature of the lamp isrecorded.
The spectral mismatch correction factor ccf(St, Ss) of the integrating sphere system, for atest lamp with spectral distribution St(λ) against a standard lamp with spectral distribution Ss(λ)is given by
ccf (St , Ss) =
Ss(λ) Rs(λ) dλλ
St(λ) V(λ) dλλ
Ss(λ) V(λ) dλλ
St(λ) Rs(λ) dλλ
, (29)
where Rs(λ) is the relative spectral responsivity of the sphere system, and V(λ) is the spectralluminous efficiency function.
However, luminous flux working standard lamps often have different color temperatures,depending on wattage, and these standard lamps are often used in combination. Calculation byeq (29) will be confusing when more than two different types of standard lamps are used.Therefore, at NIST, a normalized spectral mismatch correction factor, ccf * , is introduced. Thetheory is given below.
– 42 –
The relationship between ccf ’s for three arbitrary sources with spectral distributionsS1(λ), S2(λ), and S3(λ) is given by
ccf (S3,S1) =
ccf (S3,S2)
ccf (S1,S2). (30)
The total flux of test lamp Φt is given by
Φ t = Φs ⋅ yt / ys , (31)
where Φs is the total flux of the standard lamp, yt is the signal for the test lamp, ys is the signalfor the standard lamp. The correction factor, ccf (St, Ss), can be applied as
Φt = Φs ⋅
y t
ysccf (St , Ss)
=Φs ⋅yt ⋅ ccf (St,SA)
ys ⋅ ccf (Ss ,SA)
, (32)
where SA(λ) is the spectral distribution of CIE Illuminant A (2856 K blackbody). Withccf(St,SA) defined as ccf *(St) , eq (32) is expressed as
Φt = Φs ⋅
y t ⋅ ccf *(S t)
ys ⋅ ccf *(Ss). (33)
This means that the spectral mismatch correction factors for all the standard lamps and testlamps can be calculated against CIE Illuminant A as given by ccf *(St) . All the detector readingsare simply multiplied by this factor.
5.4.4 Correction for the spatial nonuniformity of the sphere response
The response of the sphere is not spatially uniform because of various objects in thesphere, contamination of the sphere wall, gaps between the hemispheres, etc. Therefore, whenmeasuring a test lamp whose luminous intensity distribution is different from the standard lamp,an error can occur and can be corrected using the following theory.
Total luminous flux, Φv, of a lamp is obtained from the luminous intensity distribution ofthe lamp, I (θ,φ), by the following equation:
Φv= E dA
A=
φ=0
2π
I (θ,φ) sin θ dθ dφθ=0
π
. (34)
A normalized luminous intensity distribution, I *(θ,φ) , is defined as
I *(θ,φ) = (4 π/Φv) ⋅ I (θ,φ) . (35)
– 43 –

Then, the spatial nonuniformity correction factor, scf*, of the lamp against an isotropic pointsource is calculated by
scf *=φ=0
2π
K(θ,φ) sin θ dθ dφθ=0
π
φ=0
2π
I *(θ,φ) K(θ,φ) sin θ dθ dφθ =0
π , (36)
where K(θ,φ) is the spatial response distribution function. K(θ,φ) can be measured by rotating abeam lamp (which is burning-position insensitive) at the center of the sphere. I *(θ,φ) does notneed to be highly accurate. Manufacturer’s typical data is usually sufficient to calculate scf*
accurately enough for this correction.
5.4.5 Determination of luminous flux
Incandescent lamps are operated in the sphere center with the base up position unlessotherwise stated. The lamps are operated at the lamp current or at the color temperaturespecified by the customer. When the color temperature is specified, the lamp current is firstdetermined by color temperature measurements as described in Section 7.5. When the lampcurrent is specified, the color temperature of the lamp is measured and reported together with theluminous flux value. The lamps are allowed to stabilize, usually for 10 min. The colortemperature values are used for the spectral mismatch corrections.
Linear fluorescent lamps are operated horizontally in the center of the integrating sphere.The lamp is operated at a specified current using the electric circuit described in 5.3.3. The lampis stabilized for at least 15 min with the sphere open, and the sphere is closed very slowlyimmediately before the measurements. The ambient temperature inside the sphere is kept at25 ° C ± 1 °C.
The photometer output voltage is measured with a DVM. The average of 20 DVMreadings is recorded. The measurement program records the electrical parameters and the burningtime of the lamp, the signal and temperature of the detector, the ambient temperature of the lampinside the sphere, and the correction factors. After the data are taken, the lamp is turned off(ramped down slowly for incandescent lamps), and the dark readings are taken. Finally, thedetector signal, y, for a standard lamp or a test lamp is corrected by
y’ = y · k (Tp) · ccf *· scf * / αi , (37)
where k (Tp) is the temperature correction factor, ccf* is the spectral mismatch correction factor,scf* is the spatial nonuniformity correction factor, and αi is the self-absorption factor. Thespatial nonuniformity correction factor, scf *, is usually not applied in the routine calibrations forregular incandescent lamps. The scf * is applied for special types of lamps such as reflector typelamps.
– 44 –

The luminous flux of test lamps is determined by substitution with the standard lamps.First, two standard lamps are measured, then the test lamps are measured three times (remountedand relighted), and at the end, the same two standard lamps are measured. Let the correctedsignals of the standard lamp 1 be y1,1’ and y1,2’ and the corrected signals of standard lamp 2 bey2,1’ and y2,2’, the total luminous flux of the standard lamps 1 and 2 be Φ1 and Φ2, respectively,and the corrected signals for test lamp i be yi,1’,yi,2’,and yi,3’. The total luminous flux Φi of testlamp i is obtained by,
Φi = 1
3 yi, j′Σ
j= 1
3
/ 14
y j,k′
Φ jΣ
k = 1
2
Σj= 1
2
. (38)
A two standard deviation of the luminous flux values of each test lamp in the three lightings iscalculated and included in the uncertainty for the calibration. The voltage across the lamp socketis reported only for reference information because the measured voltage usually does notreproduce well on other sockets used by customers.
5.5 Uncertainty of calibration
The uncertainty budgets for the luminous flux calibration of incandescent lamps and of4 ft linear fluorescent lamps are shown in Table 11 and Table 12, respectively.
Table 11. Uncertainty budget for total luminous flux calibrations of standard incandescent lamps (typical)
Relative expanded
Uncertainty factor uncertainty (k=2) [%]Type A Type B
NIST luminous flux unit (primary/working standard lamps) 0.53Aging of the working standard lamps between calibrations 0.30Transfer from working standards to test lamps:
Geometric differences 0.30 Self-absorption correction 0.10Spectral mismatch correction 0.20Reproducibility of test lamps (typical)** 0.20
Overall uncertainty of test lamp calibration 0.74 ** Uncertainty value depends on test item
– 45 –
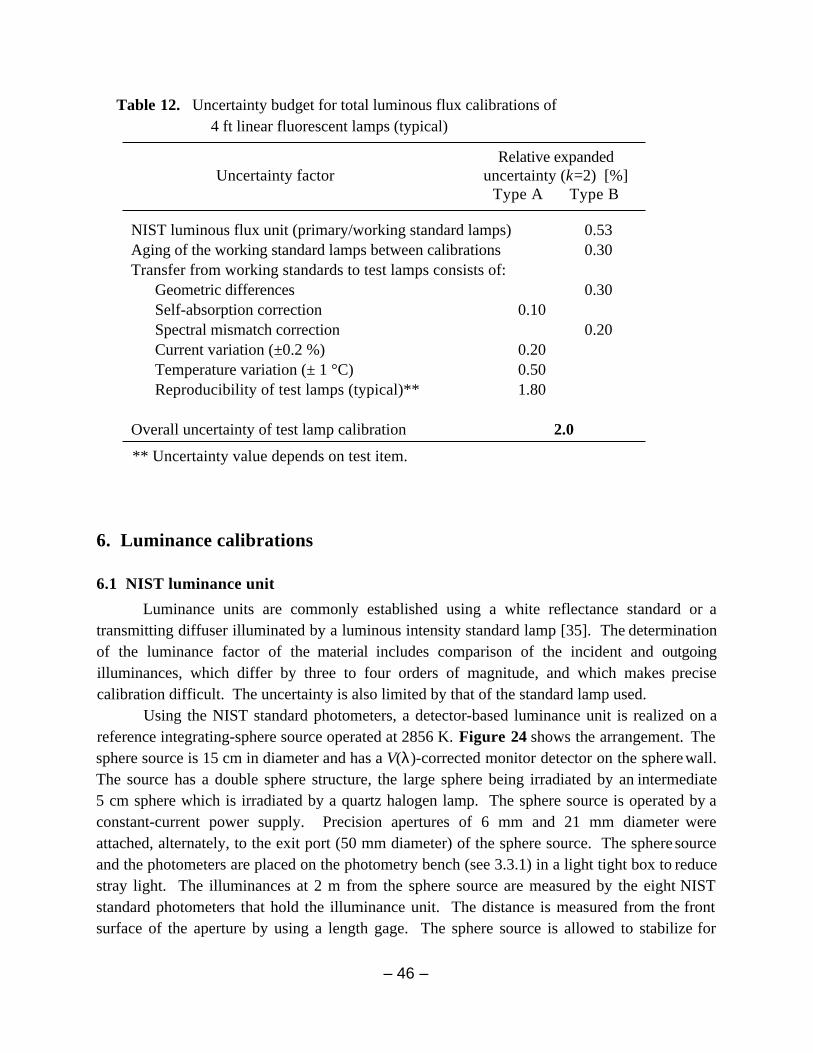
Table 12. Uncertainty budget for total luminous flux calibrations of 4 ft linear fluorescent lamps (typical)
Relative expanded
Uncertainty factor uncertainty (k=2) [%]Type A Type B
NIST luminous flux unit (primary/working standard lamps) 0.53Aging of the working standard lamps between calibrations 0.30Transfer from working standards to test lamps consists of:
Geometric differences 0.30 Self-absorption correction 0.10Spectral mismatch correction 0.20Current variation (±0.2 %) 0.20Temperature variation (± 1 °C) 0.50Reproducibility of test lamps (typical)** 1.80
Overall uncertainty of test lamp calibration 2.0
** Uncertainty value depends on test item.
6. Luminance calibrations
6.1 NIST luminance unit
Luminance units are commonly established using a white reflectance standard or atransmitting diffuser illuminated by a luminous intensity standard lamp [35]. The determinationof the luminance factor of the material includes comparison of the incident and outgoingilluminances, which differ by three to four orders of magnitude, and which makes precisecalibration difficult. The uncertainty is also limited by that of the standard lamp used.
Using the NIST standard photometers, a detector-based luminance unit is realized on areference integrating-sphere source operated at 2856 K. Figure 24 shows the arrangement. Thesphere source is 15 cm in diameter and has a V(λ)-corrected monitor detector on the sphere wall.The source has a double sphere structure, the large sphere being irradiated by an intermediate5 cm sphere which is irradiated by a quartz halogen lamp. The sphere source is operated by aconstant-current power supply. Precision apertures of 6 mm and 21 mm diameter wereattached, alternately, to the exit port (50 mm diameter) of the sphere source. The sphere sourceand the photometers are placed on the photometry bench (see 3.3.1) in a light tight box to reducestray light. The illuminances at 2 m from the sphere source are measured by the eight NISTstandard photometers that hold the illuminance unit. The distance is measured from the frontsurface of the aperture by using a length gage. The sphere source is allowed to stabilize for
– 46 –
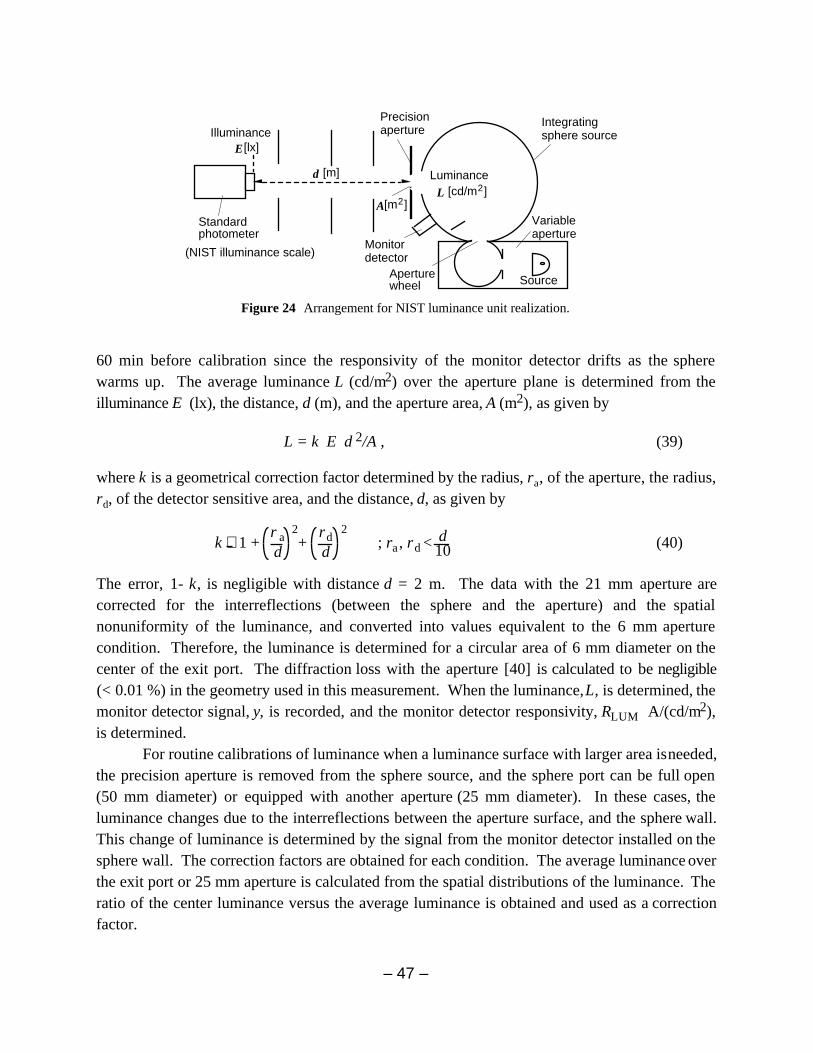
60 min before calibration since the responsivity of the monitor detector drifts as the spherewarms up. The average luminance L (cd/m2) over the aperture plane is determined from theilluminance E (lx), the distance, d (m), and the aperture area, A (m2), as given by
L = k E d 2/A , (39)
where k is a geometrical correction factor determined by the radius, ra, of the aperture, the radius,rd, of the detector sensitive area, and the distance, d, as given by
k ∼ 1 +
r ad
2+
rdd
2; ra , rd < d
10 (40)
The error, 1- k, is negligible with distance d = 2 m. The data with the 21 mm aperture arecorrected for the interreflections (between the sphere and the aperture) and the spatialnonuniformity of the luminance, and converted into values equivalent to the 6 mm aperturecondition. Therefore, the luminance is determined for a circular area of 6 mm diameter on thecenter of the exit port. The diffraction loss with the aperture [40] is calculated to be negligible(< 0.01 %) in the geometry used in this measurement. When the luminance, L, is determined, themonitor detector signal, y, is recorded, and the monitor detector responsivity, RLUM A/(cd/m2),is determined.
For routine calibrations of luminance when a luminance surface with larger area is needed,the precision aperture is removed from the sphere source, and the sphere port can be full open(50 mm diameter) or equipped with another aperture (25 mm diameter). In these cases, theluminance changes due to the interreflections between the aperture surface, and the sphere wall.This change of luminance is determined by the signal from the monitor detector installed on thesphere wall. The correction factors are obtained for each condition. The average luminance overthe exit port or 25 mm aperture is calculated from the spatial distributions of the luminance. Theratio of the center luminance versus the average luminance is obtained and used as a correctionfactor.
– 47 –
Standardphotometer
[m]
IlluminancePrecisionaperture
Integratingsphere source
Variableaperture
Source
Monitordetector
d
E
[m ]2A
[lx]
LuminanceL [cd/m ]2
(NIST illuminance scale)
Aperturewheel
Figure 24 Arrangement for NIST luminance unit realization.
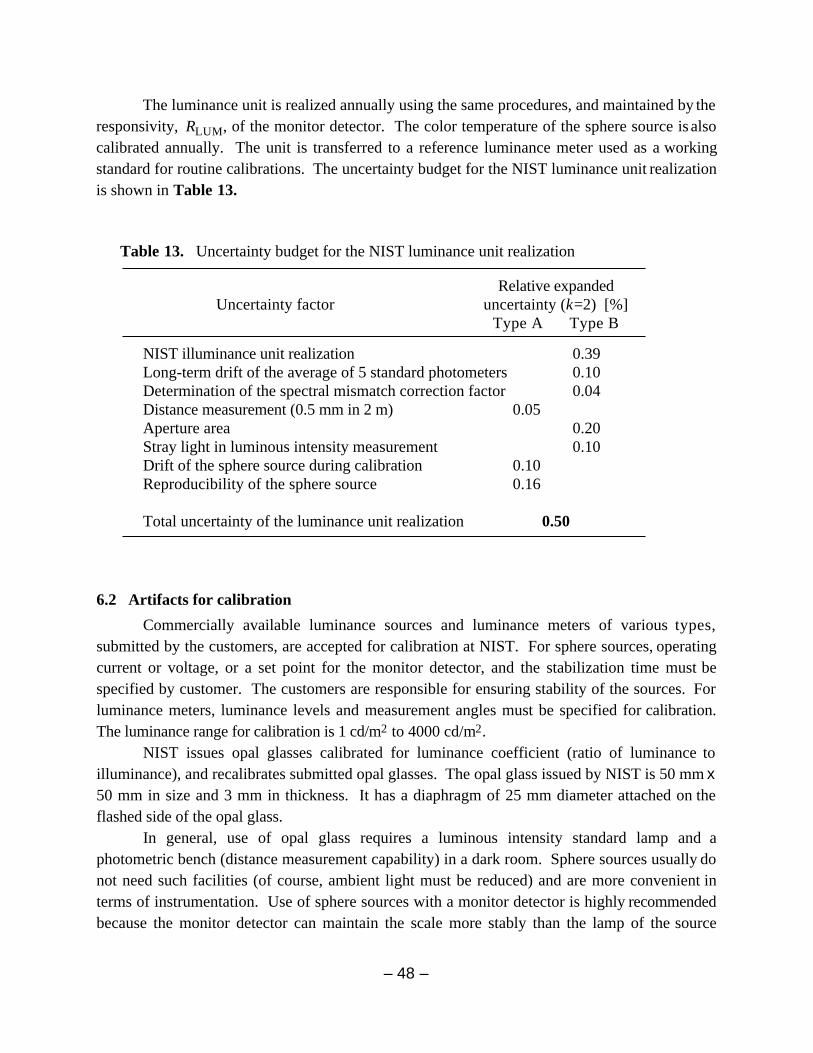
The luminance unit is realized annually using the same procedures, and maintained by theresponsivity, RLUM, of the monitor detector. The color temperature of the sphere source is alsocalibrated annually. The unit is transferred to a reference luminance meter used as a workingstandard for routine calibrations. The uncertainty budget for the NIST luminance unit realizationis shown in Table 13.
Table 13. Uncertainty budget for the NIST luminance unit realization
Relative expandedUncertainty factor uncertainty (k=2) [%]
Type A Type B
NIST illuminance unit realization 0.39 Long-term drift of the average of 5 standard photometers 0.10 Determination of the spectral mismatch correction factor 0.04Distance measurement (0.5 mm in 2 m) 0.05 Aperture area 0.20 Stray light in luminous intensity measurement 0.10 Drift of the sphere source during calibration 0.10Reproducibility of the sphere source 0.16
Total uncertainty of the luminance unit realization 0.50
6.2 Artifacts for calibration
Commercially available luminance sources and luminance meters of various types,submitted by the customers, are accepted for calibration at NIST. For sphere sources, operatingcurrent or voltage, or a set point for the monitor detector, and the stabilization time must bespecified by customer. The customers are responsible for ensuring stability of the sources. Forluminance meters, luminance levels and measurement angles must be specified for calibration.The luminance range for calibration is 1 cd/m2 to 4000 cd/m2.
NIST issues opal glasses calibrated for luminance coefficient (ratio of luminance toilluminance), and recalibrates submitted opal glasses. The opal glass issued by NIST is 50 mm x50 mm in size and 3 mm in thickness. It has a diaphragm of 25 mm diameter attached on theflashed side of the opal glass.
In general, use of opal glass requires a luminous intensity standard lamp and aphotometric bench (distance measurement capability) in a dark room. Sphere sources usually donot need such facilities (of course, ambient light must be reduced) and are more convenient interms of instrumentation. Use of sphere sources with a monitor detector is highly recommendedbecause the monitor detector can maintain the scale more stably than the lamp of the source
– 48 –
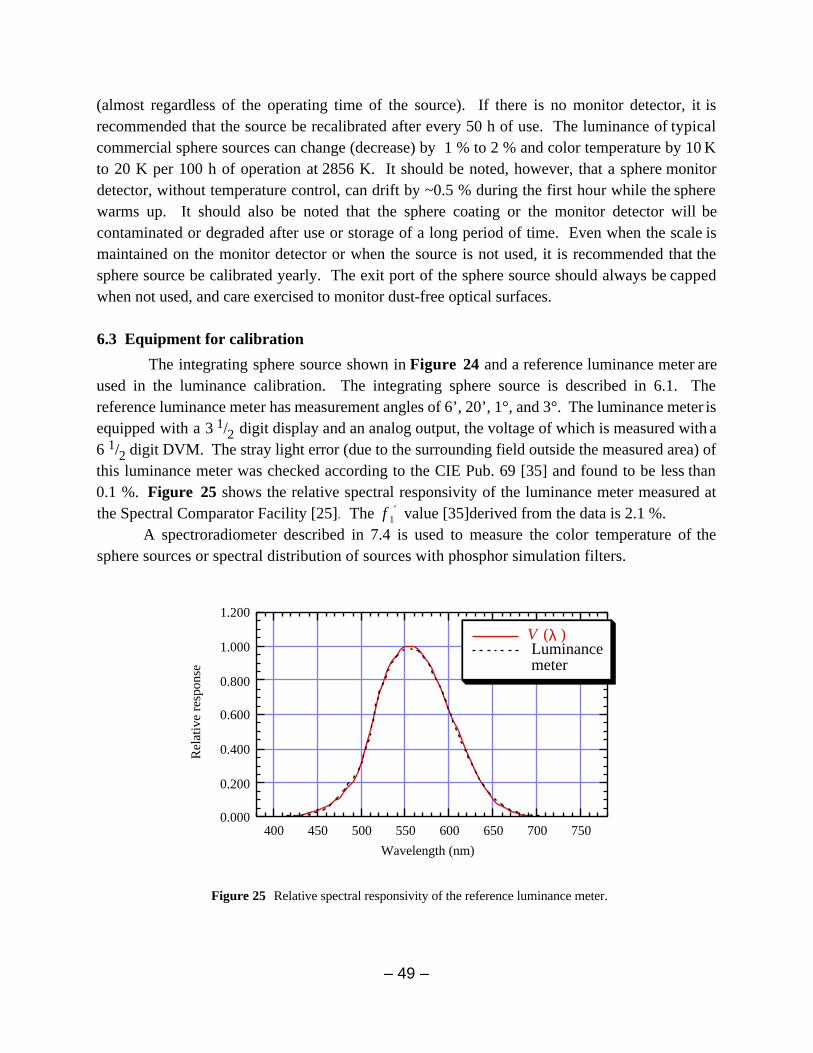
(almost regardless of the operating time of the source). If there is no monitor detector, it isrecommended that the source be recalibrated after every 50 h of use. The luminance of typicalcommercial sphere sources can change (decrease) by 1 % to 2 % and color temperature by 10 Kto 20 K per 100 h of operation at 2856 K. It should be noted, however, that a sphere monitordetector, without temperature control, can drift by ~0.5 % during the first hour while the spherewarms up. It should also be noted that the sphere coating or the monitor detector will becontaminated or degraded after use or storage of a long period of time. Even when the scale ismaintained on the monitor detector or when the source is not used, it is recommended that thesphere source be calibrated yearly. The exit port of the sphere source should always be cappedwhen not used, and care exercised to monitor dust-free optical surfaces.
6.3 Equipment for calibration
The integrating sphere source shown in Figure 24 and a reference luminance meter areused in the luminance calibration. The integrating sphere source is described in 6.1. Thereference luminance meter has measurement angles of 6’, 20’, 1°, and 3°. The luminance meter isequipped with a 3 1/2 digit display and an analog output, the voltage of which is measured with a6 1/2 digit DVM. The stray light error (due to the surrounding field outside the measured area) ofthis luminance meter was checked according to the CIE Pub. 69 [35] and found to be less than0.1 %. Figure 25 shows the relative spectral responsivity of the luminance meter measured atthe Spectral Comparator Facility [25]. The f 1
′ value [35]derived from the data is 2.1 %. A spectroradiometer described in 7.4 is used to measure the color temperature of the
sphere sources or spectral distribution of sources with phosphor simulation filters.
0.000
0.200
0.400
0.600
0.800
1.000
1.200
400 450 500 550 600 650 700 750
( ) Luminance meter
Rel
ativ
e re
spon
se
Wavelength (nm)
λV
Figure 25 Relative spectral responsivity of the reference luminance meter.
– 49 –
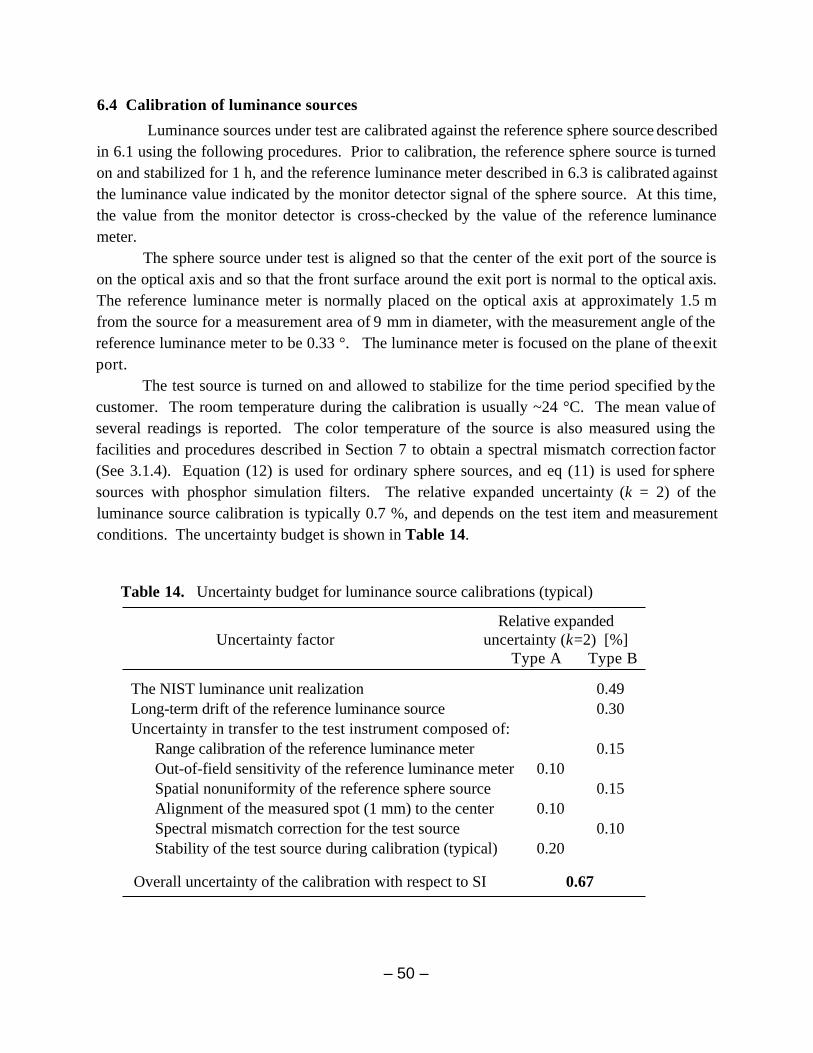
6.4 Calibration of luminance sources
Luminance sources under test are calibrated against the reference sphere source describedin 6.1 using the following procedures. Prior to calibration, the reference sphere source is turnedon and stabilized for 1 h, and the reference luminance meter described in 6.3 is calibrated againstthe luminance value indicated by the monitor detector signal of the sphere source. At this time,the value from the monitor detector is cross-checked by the value of the reference luminancemeter.
The sphere source under test is aligned so that the center of the exit port of the source ison the optical axis and so that the front surface around the exit port is normal to the optical axis.The reference luminance meter is normally placed on the optical axis at approximately 1.5 mfrom the source for a measurement area of 9 mm in diameter, with the measurement angle of thereference luminance meter to be 0.33 °. The luminance meter is focused on the plane of the exitport.
The test source is turned on and allowed to stabilize for the time period specified by thecustomer. The room temperature during the calibration is usually ~24 °C. The mean value ofseveral readings is reported. The color temperature of the source is also measured using thefacilities and procedures described in Section 7 to obtain a spectral mismatch correction factor(See 3.1.4). Equation (12) is used for ordinary sphere sources, and eq (11) is used for spheresources with phosphor simulation filters. The relative expanded uncertainty (k = 2) of theluminance source calibration is typically 0.7 %, and depends on the test item and measurementconditions. The uncertainty budget is shown in Table 14.
Table 14. Uncertainty budget for luminance source calibrations (typical)
Relative expandedUncertainty factor uncertainty (k=2) [%]
Type A Type B The NIST luminance unit realization 0.49 Long-term drift of the reference luminance source 0.30Uncertainty in transfer to the test instrument composed of:
Range calibration of the reference luminance meter 0.15 Out-of-field sensitivity of the reference luminance meter 0.10Spatial nonuniformity of the reference sphere source 0.15Alignment of the measured spot (1 mm) to the center 0.10Spectral mismatch correction for the test source 0.10Stability of the test source during calibration (typical) 0.20
Overall uncertainty of the calibration with respect to SI 0.67
– 50 –
6.5 Calibration of luminance meters
A luminance meter under test is calibrated against the reference luminance source(described in 6.3) operated at 2856 K using the following procedures. Prior to calibration, thereference sphere source is turned on and allowed to stabilize for 1 h, and the luminance valuedetermined from the monitor detector signal is cross-checked by the value of the referenceluminance meter.
The reference sphere source is aligned so that the center of the exit port of the source ison the optical axis, and that the front surface around the exit port is normal to the optical axis.The luminance meter under test is placed and aligned on the optical axis, using a laser beam, at1 m to 3 m from the source depending on the measurement angle of the luminance meter. If themeasurement area is more than 10 mm in diameter on the exit port of the reference sphere source,the luminance value is corrected for the spatial nonuniformity. The luminance meter is focusedon the plane of the exit port, aiming at the center of the exit port of the reference sphere source.
The luminance values indicated by the luminance meter under test are compared with theluminance values determined from the monitor detector signal of the reference sphere source.The room temperature at calibration is usually ~24 °C.
Luminance meters used for particular sources other than incandescent sources can becalibrated for those specific sources (e.g., color displays) upon request by customers. In thiscase, the calibration is first performed using the 2856 K source as described above. Then, thespectral mismatch correction factors for the sources are obtained using the following procedures.
The relative spectral responsivity of the NIST luminance meter is measured by theSpectral Comparator Facility [25] in the 350 nm to 1100 nm region. The monochromator outputof the SCF is defocused on an PTFE (polytetrafluoroethylene) plaque to irradiate an area ofseveral mm in diameter. The luminance meter under test is placed so that it will measure theluminance of the spot on the PTFE plaque at 0/45 geometry, and that the irradiated spotunderfills the measurement area of the luminance meter. This method can only be applied forluminance meters whose relative spectral responsivity is fairly spatially uniform within themeasurement angle. From the relative spectral responsivity data and the spectral powerdistribution data (supplied by customer) of the light sources to be measured by the luminancemeter, the spectral mismatch correction factors are calculated using equation (11) as described in3.1.4. The relative spectral responsivity data and the correction factors are reported to thecustomer.
The uncertainty budget for the calibration of a typical luminance meter is shown inTable 15. This budget does not include the uncertainty factor for the out-of-field sensitivity ofthe test instrument. If the luminance meter’s out-of-field blocking is poor, the responsivity ofthe instrument is affected by the illuminance of the area outside the measurement angle.Therefore, the calibration value is reported with the measurement geometry used at thecalibration, and may not be valid with other geometry.
– 51 –
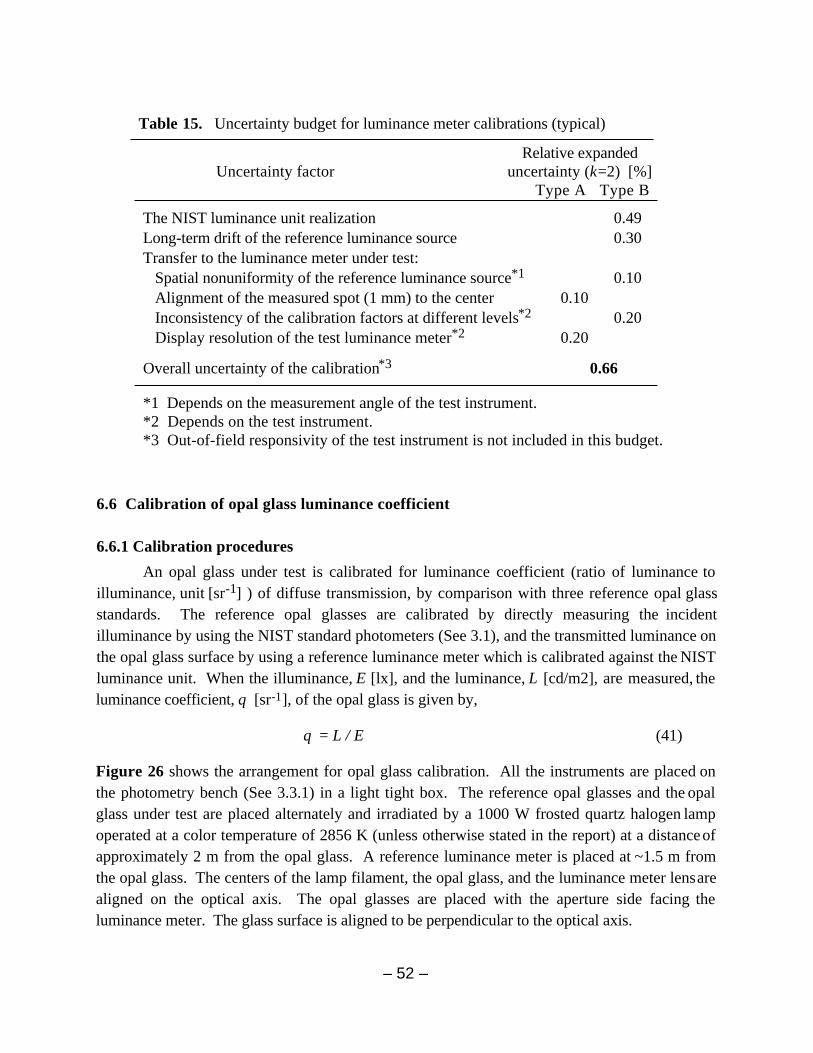
Table 15. Uncertainty budget for luminance meter calibrations (typical)
Relative expandedUncertainty factor uncertainty (k=2) [%]
Type A Type B The NIST luminance unit realization 0.49 Long-term drift of the reference luminance source 0.30Transfer to the luminance meter under test:
Spatial nonuniformity of the reference luminance source*1 0.10Alignment of the measured spot (1 mm) to the center 0.10Inconsistency of the calibration factors at different levels*2 0.20 Display resolution of the test luminance meter*2 0.20
Overall uncertainty of the calibration*3 0.66 *1 Depends on the measurement angle of the test instrument.*2 Depends on the test instrument. *3 Out-of-field responsivity of the test instrument is not included in this budget.
6.6 Calibration of opal glass luminance coefficient
6.6.1 Calibration procedures
An opal glass under test is calibrated for luminance coefficient (ratio of luminance toilluminance, unit [sr-1] ) of diffuse transmission, by comparison with three reference opal glassstandards. The reference opal glasses are calibrated by directly measuring the incidentilluminance by using the NIST standard photometers (See 3.1), and the transmitted luminance onthe opal glass surface by using a reference luminance meter which is calibrated against the NISTluminance unit. When the illuminance, E [lx], and the luminance, L [cd/m2], are measured, theluminance coefficient, q [sr-1], of the opal glass is given by,
q = L / E (41)
Figure 26 shows the arrangement for opal glass calibration. All the instruments are placed onthe photometry bench (See 3.3.1) in a light tight box. The reference opal glasses and the opalglass under test are placed alternately and irradiated by a 1000 W frosted quartz halogen lampoperated at a color temperature of 2856 K (unless otherwise stated in the report) at a distance ofapproximately 2 m from the opal glass. A reference luminance meter is placed at ~1.5 m fromthe opal glass. The centers of the lamp filament, the opal glass, and the luminance meter lens arealigned on the optical axis. The opal glasses are placed with the aperture side facing theluminance meter. The glass surface is aligned to be perpendicular to the optical axis.
– 52 –

Referenceluminancemeter
Opal glassunder test
Referenceopal glass
Color temperaturestandard lamp
[m]d
NIST standardphotometer
Figure 26 Configuration for opal glass calibration.
The luminance meter is aimed at the center of the circular apertured area and set to ameasurement angle of 20’(1/3)°. With these dimensions, the luminance of the center area of9 mm in diameter is measured. The luminance coefficient of the opal glass under test iscalculated by comparison to the reference opal glasses.
It should be noted that the color temperature of the transmitted light is shifted due to thespectral transmittance of the opal glass and decreases typically by 100 K to 200 K. As anoption, if a set of a luminous intensity standard lamp and an opal glass are submitted forcalibration, the operating current of the lamp can be set so that the transmitted light from theopal glass produces color temperature of 2856 K (See Section 7 for color temperaturecalibration), and the luminance coefficient of the opal glass can be calibrated under that condition.
6.6.2 Use of opal glass standards for luminance coefficient
NIST issues opal glasses of 50 mm square, 3 mm thick, having an aperture of 25 mm indiameter, as calibrated standards for luminance coefficient. A luminance standard can be obtainedby combining these standards and an incandescent lamp operated at approximately 2856 K. Theopal glass should be placed so that the transparent glass side (with no aperture) faces the lamp.The luminance standard will be on the opal side with the aperture. The luminance, L [cd/m2], ofthe illuminated opal glass is obtained by
L = q · E, (42)
where q is the luminance coefficient [sr-1] and E is the illuminance [lx] on the reference plane ofthe opal glass. The reference plane is 2 mm inside from the surface of the transparent glass side.Illuminance E can be measured by placing a standard photometer on the reference plane of theopal glass. Illuminance E can also be determined by using a luminous intensity standard lampapplying the inverse square law. In this case the distance should be measured from the referenceplane of the opal glass.
– 53 –
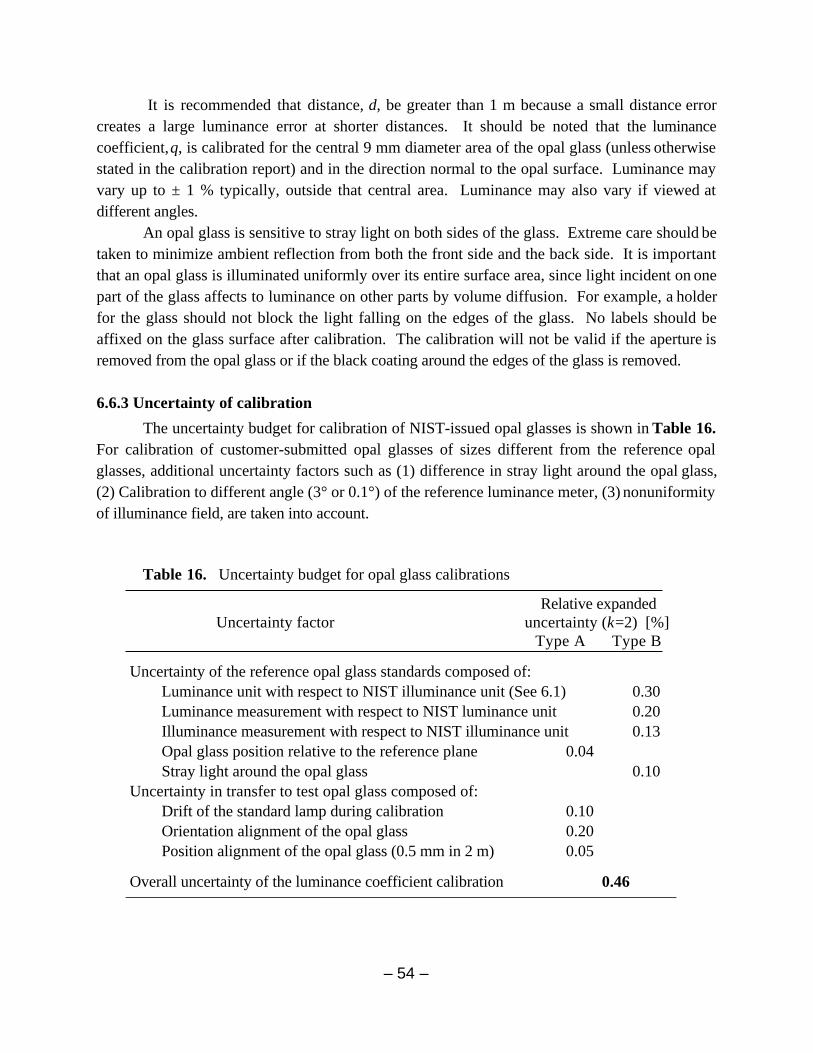
It is recommended that distance, d, be greater than 1 m because a small distance errorcreates a large luminance error at shorter distances. It should be noted that the luminancecoefficient, q, is calibrated for the central 9 mm diameter area of the opal glass (unless otherwisestated in the calibration report) and in the direction normal to the opal surface. Luminance mayvary up to ± 1 % typically, outside that central area. Luminance may also vary if viewed atdifferent angles.
An opal glass is sensitive to stray light on both sides of the glass. Extreme care should betaken to minimize ambient reflection from both the front side and the back side. It is importantthat an opal glass is illuminated uniformly over its entire surface area, since light incident on onepart of the glass affects to luminance on other parts by volume diffusion. For example, a holderfor the glass should not block the light falling on the edges of the glass. No labels should beaffixed on the glass surface after calibration. The calibration will not be valid if the aperture isremoved from the opal glass or if the black coating around the edges of the glass is removed.
6.6.3 Uncertainty of calibration
The uncertainty budget for calibration of NIST-issued opal glasses is shown in Table 16.For calibration of customer-submitted opal glasses of sizes different from the reference opalglasses, additional uncertainty factors such as (1) difference in stray light around the opal glass,(2) Calibration to different angle (3° or 0.1°) of the reference luminance meter, (3) nonuniformityof illuminance field, are taken into account.
Table 16. Uncertainty budget for opal glass calibrations
Relative expandedUncertainty factor uncertainty (k=2) [%]
Type A Type B Uncertainty of the reference opal glass standards composed of:
Luminance unit with respect to NIST illuminance unit (See 6.1) 0.30Luminance measurement with respect to NIST luminance unit 0.20Illuminance measurement with respect to NIST illuminance unit 0.13Opal glass position relative to the reference plane 0.04Stray light around the opal glass 0.10
Uncertainty in transfer to test opal glass composed of:Drift of the standard lamp during calibration 0.10Orientation alignment of the opal glass 0.20Position alignment of the opal glass (0.5 mm in 2 m) 0.05
Overall uncertainty of the luminance coefficient calibration 0.46–––––––––––––––––––––––––––––––––––––––––––––––––––––––––––––––––––––
– 54 –
7. Color temperature calibrations
7.1 General descriptions
Color temperature is a concept used to express the color of a light source in a simplemanner using just one number. According to CIE [15], color temperature is defined as “thetemperature of a Planckian radiator whose radiation has the same chromaticity as that of a givenstimulus.” The spectral power distribution of the test source is not necessarily identical or evensimilar to that of a blackbody. Strictly speaking, however, the chromaticity coordinate of mostof the light sources including incandescent lamps do not fall on the Planckian locus. The CIEdefinition does not say how close the chromaticity should be to be considered as “the same.”Therefore, the definition of color temperature is somewhat vague, and this term is considered tobe a general term to introduce the concept.
For practical calibration of sources used in photometry, either “distribution temperature”or “correlated color temperature” is used. Another similar concept is a radiance temperature,which is defined as “Temperature of the Planckian radiator for which the radiance at thespecified wavelength has the same spectral concentration as for the thermal radiator considered”[15]. Radiance temperature is used only for blackbodies and transfer lamps to blackbodies.
Distribution temperature is defined as “Temperature of the Planckian radiator whoserelative spectral distribution St(λ) is the same or nearly the same as that of the radiationconsidered in the spectral range of interest” by CIE [15]. Practically speaking, distributiontemperature is a concept to represent the relative spectral power distribution of a near Planckiansource, such as an incandescent lamp, by one number. CIE [45] gives more precise definition ofdistribution temperature (Td) given by the equation;
minimum 1 – St λ / a Sb λ,Td
2
dλλ 1
λ2
where Sb λ ,Td = λ– 5 exp c2 / λTd – 1– 1 (43)
The distribution temperature of the source St(λ) is the temperature T of the Planckian radiationSb(λ,Τ) when the value of equation (43) is minimized by varying T and a (a normalizationfactor). CIE also specifies that the wavelength region shall be 380 nm to 780 nm, and thewavelength interval for calculation shall be less than 10 nm. It is also specified that thedifference of the relative spectral power distribution of the radiation considered and that of aPlanckian radiation should be less than 10 % in order to use distribution temperature.
Correlated color temperature (Tcp) is used for sources whose spectral power distributionis significantly different from that of Planckian radiation; such as discharge lamps. Correlatedcolor temperature is defined as “Temperature of the Planckian radiator whose perceived colormost closely resembles that of a given stimulus at the same brightness and under specified
– 55 –
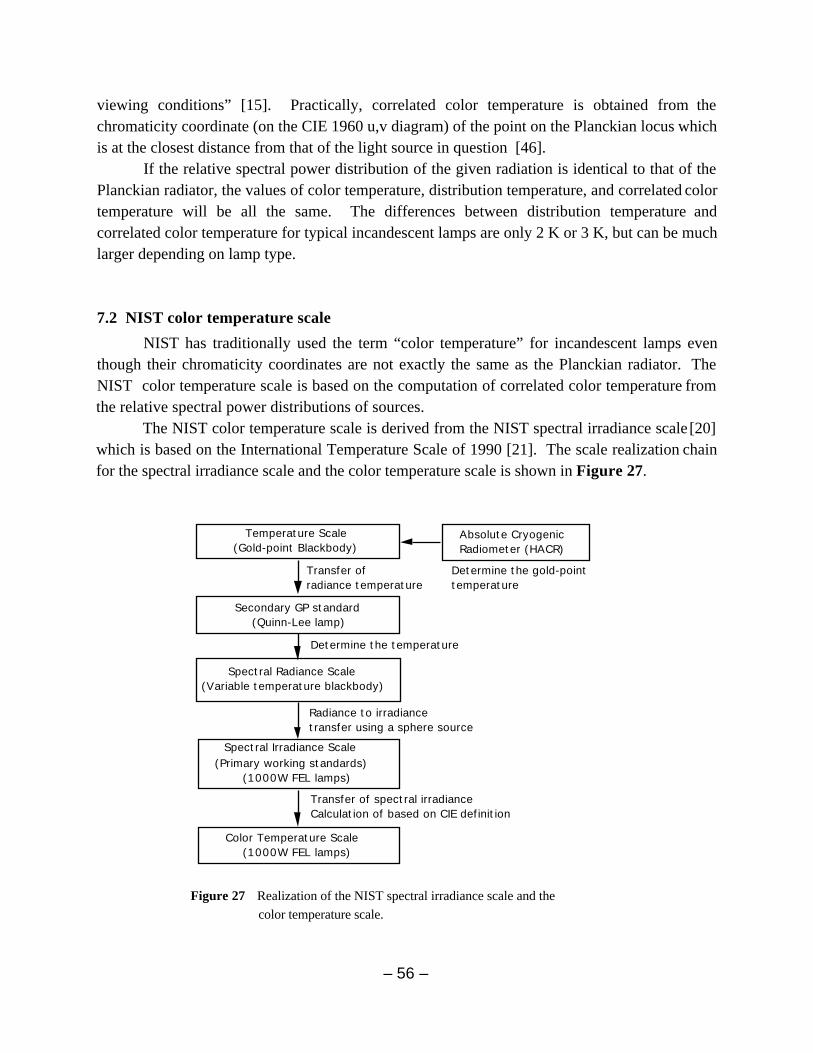
viewing conditions” [15]. Practically, correlated color temperature is obtained from thechromaticity coordinate (on the CIE 1960 u,v diagram) of the point on the Planckian locus whichis at the closest distance from that of the light source in question [46].
If the relative spectral power distribution of the given radiation is identical to that of thePlanckian radiator, the values of color temperature, distribution temperature, and correlated colortemperature will be all the same. The differences between distribution temperature andcorrelated color temperature for typical incandescent lamps are only 2 K or 3 K, but can be muchlarger depending on lamp type.
7.2 NIST color temperature scale
NIST has traditionally used the term “color temperature” for incandescent lamps eventhough their chromaticity coordinates are not exactly the same as the Planckian radiator. TheNIST color temperature scale is based on the computation of correlated color temperature fromthe relative spectral power distributions of sources.
The NIST color temperature scale is derived from the NIST spectral irradiance scale [20]which is based on the International Temperature Scale of 1990 [21]. The scale realization chainfor the spectral irradiance scale and the color temperature scale is shown in Figure 27.
Temperature Scale(Gold-point Blackbody)
Spectral Irradiance Scale(Primary working standards)
(1000W FEL lamps)
Determine the temperature
Radiance to irradiance transfer using a sphere source
Spectral Radiance Scale(Variable temperature blackbody)
Color Temperature Scale(1000W FEL lamps)
Determine the gold-point temperature
Secondary GP standard(Quinn-Lee lamp)
Absolute CryogenicRadiometer (HACR)
Transfer ofradiance temperature
Transfer of spectral irradianceCalculation of based on CIE definition
Figure 27 Realization of the NIST spectral irradiance scale and thecolor temperature scale.
– 56 –
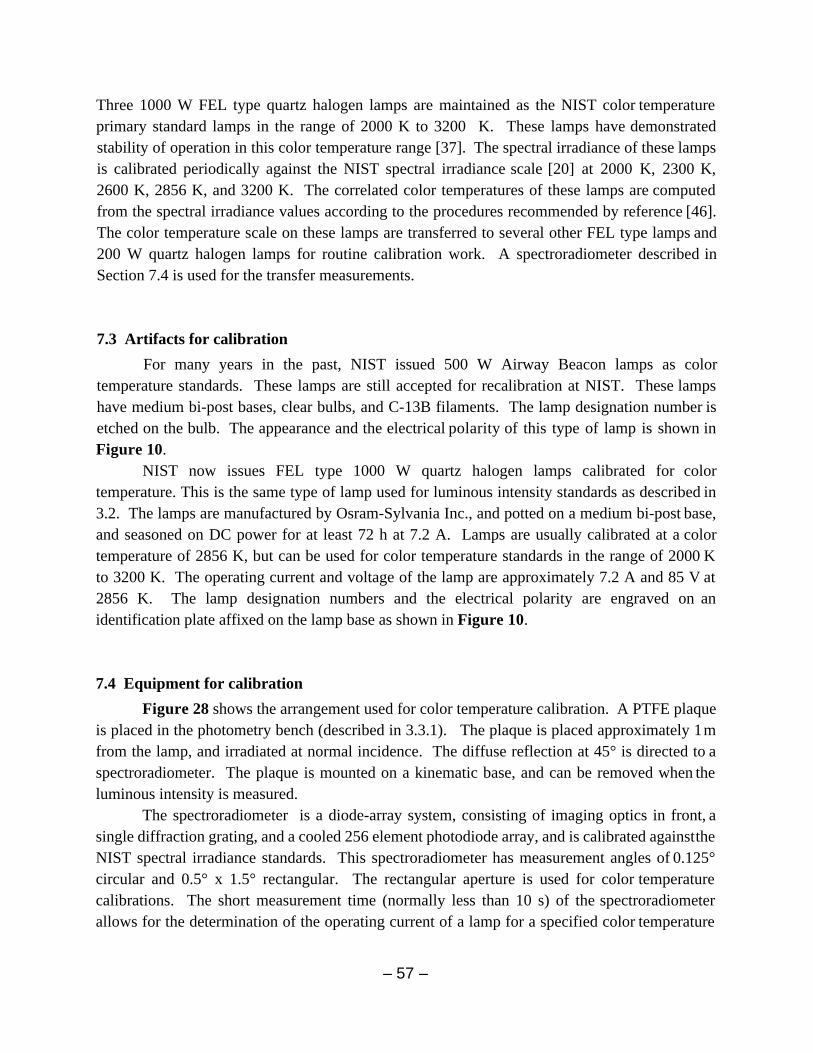
Three 1000 W FEL type quartz halogen lamps are maintained as the NIST color temperatureprimary standard lamps in the range of 2000 K to 3200 K. These lamps have demonstratedstability of operation in this color temperature range [37]. The spectral irradiance of these lampsis calibrated periodically against the NIST spectral irradiance scale [20] at 2000 K, 2300 K,2600 K, 2856 K, and 3200 K. The correlated color temperatures of these lamps are computedfrom the spectral irradiance values according to the procedures recommended by reference [46].The color temperature scale on these lamps are transferred to several other FEL type lamps and200 W quartz halogen lamps for routine calibration work. A spectroradiometer described inSection 7.4 is used for the transfer measurements.
7.3 Artifacts for calibration
For many years in the past, NIST issued 500 W Airway Beacon lamps as colortemperature standards. These lamps are still accepted for recalibration at NIST. These lampshave medium bi-post bases, clear bulbs, and C-13B filaments. The lamp designation number isetched on the bulb. The appearance and the electrical polarity of this type of lamp is shown inFigure 10.
NIST now issues FEL type 1000 W quartz halogen lamps calibrated for colortemperature. This is the same type of lamp used for luminous intensity standards as described in3.2. The lamps are manufactured by Osram-Sylvania Inc., and potted on a medium bi-post base,and seasoned on DC power for at least 72 h at 7.2 A. Lamps are usually calibrated at a colortemperature of 2856 K, but can be used for color temperature standards in the range of 2000 Kto 3200 K. The operating current and voltage of the lamp are approximately 7.2 A and 85 V at2856 K. The lamp designation numbers and the electrical polarity are engraved on anidentification plate affixed on the lamp base as shown in Figure 10.
7.4 Equipment for calibration
Figure 28 shows the arrangement used for color temperature calibration. A PTFE plaqueis placed in the photometry bench (described in 3.3.1). The plaque is placed approximately 1 mfrom the lamp, and irradiated at normal incidence. The diffuse reflection at 45° is directed to aspectroradiometer. The plaque is mounted on a kinematic base, and can be removed when theluminous intensity is measured.
The spectroradiometer is a diode-array system, consisting of imaging optics in front, asingle diffraction grating, and a cooled 256 element photodiode array, and is calibrated against theNIST spectral irradiance standards. This spectroradiometer has measurement angles of 0.125°circular and 0.5° x 1.5° rectangular. The rectangular aperture is used for color temperaturecalibrations. The short measurement time (normally less than 10 s) of the spectroradiometerallows for the determination of the operating current of a lamp for a specified color temperature
– 57 –
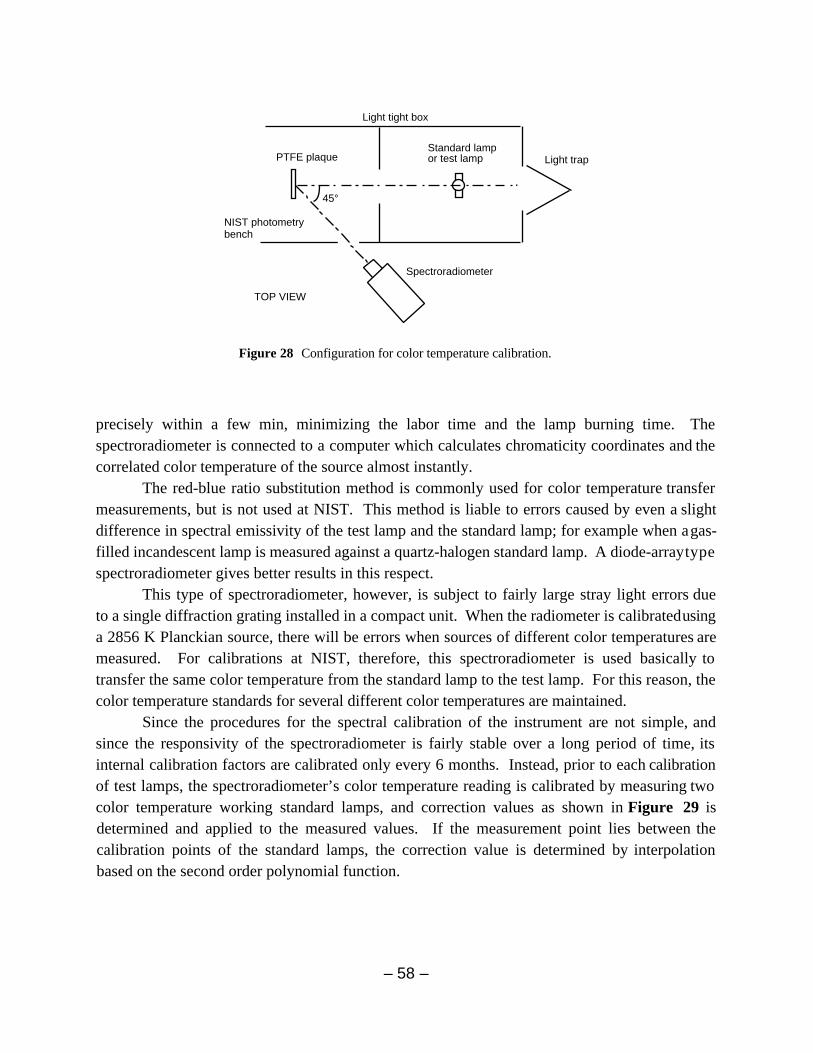
precisely within a few min, minimizing the labor time and the lamp burning time. Thespectroradiometer is connected to a computer which calculates chromaticity coordinates and thecorrelated color temperature of the source almost instantly.
The red-blue ratio substitution method is commonly used for color temperature transfermeasurements, but is not used at NIST. This method is liable to errors caused by even a slightdifference in spectral emissivity of the test lamp and the standard lamp; for example when a gas-filled incandescent lamp is measured against a quartz-halogen standard lamp. A diode-array typespectroradiometer gives better results in this respect.
This type of spectroradiometer, however, is subject to fairly large stray light errors dueto a single diffraction grating installed in a compact unit. When the radiometer is calibrated usinga 2856 K Planckian source, there will be errors when sources of different color temperatures aremeasured. For calibrations at NIST, therefore, this spectroradiometer is used basically totransfer the same color temperature from the standard lamp to the test lamp. For this reason, thecolor temperature standards for several different color temperatures are maintained.
Since the procedures for the spectral calibration of the instrument are not simple, andsince the responsivity of the spectroradiometer is fairly stable over a long period of time, itsinternal calibration factors are calibrated only every 6 months. Instead, prior to each calibrationof test lamps, the spectroradiometer’s color temperature reading is calibrated by measuring twocolor temperature working standard lamps, and correction values as shown in Figure 29 isdetermined and applied to the measured values. If the measurement point lies between thecalibration points of the standard lamps, the correction value is determined by interpolationbased on the second order polynomial function.
– 58 –
45°
PTFE plaqueStandard lampor test lamp
Spectroradiometer
Light tight box
TOP VIEW
Light trap
NIST photometry bench
Figure 28 Configuration for color temperature calibration.

-1
0
1
2
3
4
5
1800 2000 2200 2400 2600 2800 3000 3200
Corr
ecti
on
valu
e
(K
)
Color Temperature (K)
∆T = M0 + M
1*T + M
2*T
2
30.714M0
-0.019766M1
3.1737e-06M2
T
∆T
Figure 29 Color temperature correction values for the NIST diode-array spectroradiometer.
7.5 Calibration procedures
Prior to the measurement of test lamps, the spectroradiometer’s color temperaturereading is calibrated against two color temperature working standard lamps at the colortemperature points required for the calibration. The test lamp is mounted on the photometrybench and aligned with the same procedure as the luminous intensity measurements. The lamp isoperated in the base-down position, with the identifying number on the opposite side from thespectroradiometer. Lamp orientation is accomplished by aligning the lamp socket so that thelamp posts are held vertically, and the plane formed by the axes of the posts is perpendicular tothe optical axis of the spectroradiometer. An alignment jig (a mirror mounted on a bi-post baseto be parallel to the plane formed by the axes of the posts) is used in combination with a laserand an end-viewing telescope. The distance from the lamp to the input optics (a PTFE plaque)of the spectroradiometer is approximately 1 m.
The lamp is operated on DC power. The electrical polarity is marked on theidentification plate of the lamp. The test lamp is slowly (~30 s) ramped up to the specifiedcurrent, and allowed to stabilize for at least ten minutes before calibration. When a lamp currentis to be determined for a specified color temperature, the lamp current is adjusted repeatedlyuntil the spectroradiometer indicates the specified color temperature. The lamp current andvoltage are recorded when the lamp reaches that color temperature. When the same lamp iscalibrated for different color temperatures, at least 3 min are allowed before any measurementsafter the lamp current is changed from one color temperature to another.
Color temperature calibrations at NIST are most often done at 2856 K. Requests forcalibration at any other color temperatures between 2000 K to 3200 K are accepted.
– 59 –
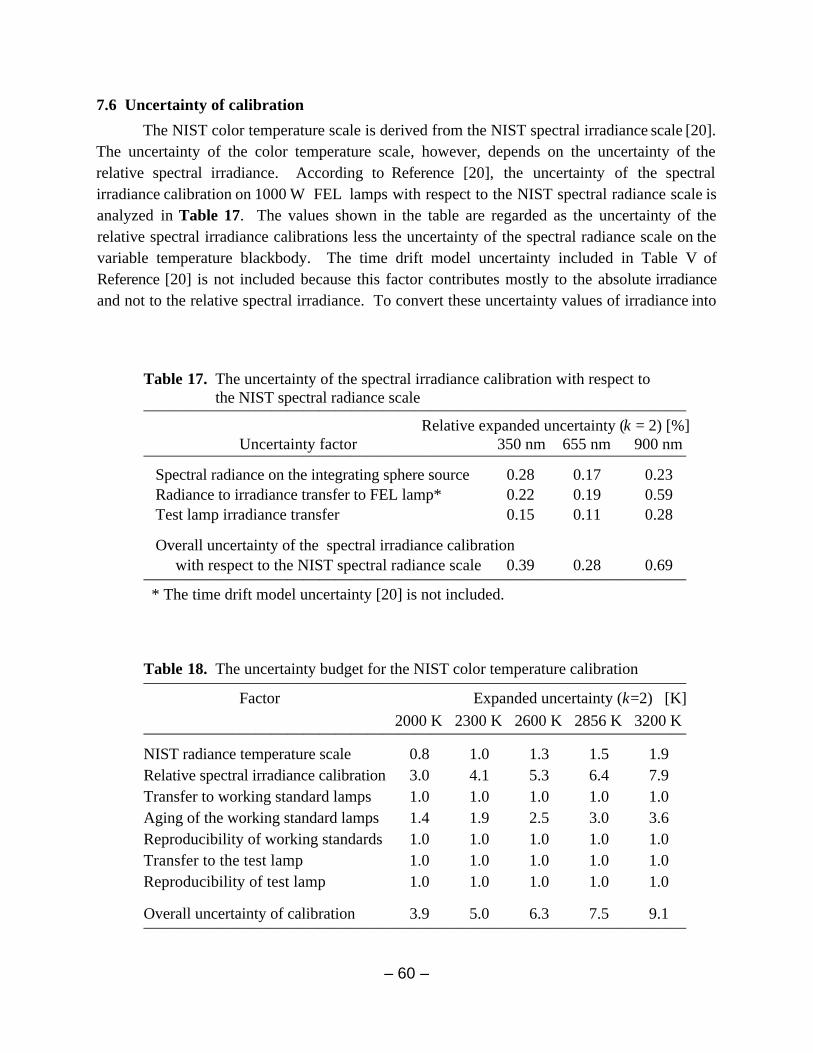
7.6 Uncertainty of calibration
The NIST color temperature scale is derived from the NIST spectral irradiance scale [20].The uncertainty of the color temperature scale, however, depends on the uncertainty of therelative spectral irradiance. According to Reference [20], the uncertainty of the spectralirradiance calibration on 1000 W FEL lamps with respect to the NIST spectral radiance scale isanalyzed in Table 17. The values shown in the table are regarded as the uncertainty of therelative spectral irradiance calibrations less the uncertainty of the spectral radiance scale on thevariable temperature blackbody. The time drift model uncertainty included in Table V ofReference [20] is not included because this factor contributes mostly to the absolute irradianceand not to the relative spectral irradiance. To convert these uncertainty values of irradiance into
– 60 –
Table 17. The uncertainty of the spectral irradiance calibration with respect to the NIST spectral radiance scale
——————————————————————————————————Relative expanded uncertainty (k = 2) [%]
Uncertainty factor 350 nm 655 nm 900 nm——————————————————————————————————
Spectral radiance on the integrating sphere source 0.28 0.17 0.23Radiance to irradiance transfer to FEL lamp* 0.22 0.19 0.59Test lamp irradiance transfer 0.15 0.11 0.28
Overall uncertainty of the spectral irradiance calibration with respect to the NIST spectral radiance scale 0.39 0.28 0.69
——————————————————————————————————* The time drift model uncertainty [20] is not included.
Table 18. The uncertainty budget for the NIST color temperature calibration——————————————————————————————————
Factor Expanded uncertainty (k=2) [K]2000 K 2300 K 2600 K 2856 K 3200 K
——————————————————————————————————NIST radiance temperature scale 0.8 1.0 1.3 1.5 1.9Relative spectral irradiance calibration 3.0 4.1 5.3 6.4 7.9Transfer to working standard lamps 1.0 1.0 1.0 1.0 1.0Aging of the working standard lamps 1.4 1.9 2.5 3.0 3.6Reproducibility of working standards 1.0 1.0 1.0 1.0 1.0 Transfer to the test lamp 1.0 1.0 1.0 1.0 1.0Reproducibility of test lamp 1.0 1.0 1.0 1.0 1.0
Overall uncertainty of calibration 3.9 5.0 6.3 7.5 9.1——————————————————————————————————
an uncertainty value of color temperature, a worst case is assumed where the errors are at thehigh (low) end of the uncertainty at wavelengths shorter than 555 nm and at the low (high) endof the uncertainty at wavelengths longer than 555 nm. This computation has the nature of alimit-of-error calculation and thus is approximately an estimate in an expanded uncertainty withcoverage factor k = 3. Therefore, the results are restated in an expanded uncertainty withcoverage factor k = 2, and are shown in Table 18. The overall uncertainty of the colortemperature calibration is calculated as the quadrature sum of the uncertainty factors listed inthis table. The NIST radiance temperature scale (on the variable temperature blackbody) is givenin Reference [47].
8. Future work
8.1 Total spectral radiant flux scale realization
Total spectral radiant flux is the geometrically total radiant flux of a given bandwidth at agiven wavelength. The unit is W/nm. This quantity is often used to evaluate the total power oflight sources at given wavelengths, especially in UV and IR, or to determine the color of lightsources. Total spectral radiant flux standards are most often used in an integrating sphere tocalibrate a spectroradiometer which is connected to the integrating sphere. For colormeasurement, only the relative values of total spectral radiant flux are required.
At NIST, work is underway to establish a total spectral radiant flux scale based on theintegrating sphere method described in Section 5.1. A double monochromator is installed at theNIST 2 m integrating sphere. A 1000 W FEL type lamp calibrated for spectral irradiance againstthe NIST spectral irradiance scale [20] is used as an external source. The distance from thelamp to the aperture is set to be exactly the same as that at the spectral irradiance calibration.The total spectral radiant flux Φi(λ) of the internal source is then obtained by
Φi(λ) = c(λ) S E(λ) yi(λ)/ ye(λ) , (44)
where E(λ) is the average spectral irradiance (W m-2 nm-1) over the limiting aperture of knownarea S(m2), ye (λ) is the detector current for the external source, and yi(λ) is the detector currentfor the internal source. c(λ) is a correction factor which consists of the spatial nonuniformitycorrection and the incident angle dependence correction factor which are determined spectrallyusing the method described in subsections 5.1.3 and 5.1.4.
When the total spectral radiant flux is established in the near future, NIST plans to startproviding calibration services for this quantity from the near UV to near the IR region.
– 61 –

8.2 Total luminous flux calibration of other discharge lamps
At the time of publication, for total luminous flux, NIST routinely provides calibrationservices only for incandescent lamps and 4 ft linear fluorescent lamps. Basically, NIST entrustsindustrial laboratories to transfer the luminous flux unit of incandescent lamps (provided byNIST) to other discharge lamps by themselves. NIST develops calibration procedures forindustrial laboratories to do such transfer measurement as accurately as possible by applyingcorrection techniques. However, luminous flux standards of various types of discharge lamps arestill needed in order to allow direct substitution measurements. Even though most of thedischarge lamps are not satisfactory in terms of reproducibility of light output, NIST plans toexpand the calibration services for several more types of discharge lamps, such as linearfluorescent lamps of other sizes, compact fluorescent lamps, and limited types of HID (HighIntensity Discharge) lamps if they have acceptable reproducibility.
8.3 Issuing calibrated standard lamps
As of September 1995, standard quality incandescent lamps for total luminous flux arenot commercially available with reasonable cost. The luminous intensity standards issued byNIST are limited to 1000 W FEL type lamps. The unavailability of standard lamps is a world-wide concern. However, there is some hope that a few lamp companies are preparing to producestandard quality lamps again. When high quality lamps are available, NIST will investigate thestability and reproducibility of these newly available lamps, and if satisfactory, will plan to issueluminous flux standard lamps and more types of luminous intensity standard lamps.
8.4 Flashing light photometric standards
All the photometric standards now available at NIST are in the form of steady light.NIST has entrusted flashing light industries to transfer from steady light standards (such ascandela) to flashing light standards (such as candela·second). However, there are rather largeuncertainties in the transfer measurements in industrial laboratories. Needs for much higheraccuracies are addressed as the flashing light sources are used for safety purposes such as theanti-collision lights of aircraft. Driven by such circumstances, work on developing flashing lightstandards has started at NIST. A group of standard photometers to measure flashing light (inlux·second) will be developed, and NIST plans to start providing calibration services forsubmitted flashing light meters in the near future.
8.5 High Illuminance Calibration
The range of calibration of illuminance meters and luminance meters has been normallylimited to levels up to several thousand lx and several thousand cd/m2 using a high-powerluminous intensity standard lamp. The calibration of instruments at much higher levels isrequired in applications such as daylight measurement, evaluation of solar simulators, and testing
– 62 –
of lighting optics in imaging devices. A calibration facility and procedures are being developed atNIST to provide calibration services at illuminance levels up to 100 klx.
Acknowledgments
There have been tremendous efforts by many staff members of Optical TechnologyDivision in establishing the new photometric units and reconstructing the NIST photometrylaboratory. Albert Parr and Chris Cromer developed the concept of the NIST detector-basedcandela, and established the project. George Eppeldauer played a key role in designing andconstructing the NIST standard photometers and characterizing them. Jonathan Hardiscontributed with theoretical studies and detailed analyses on the candela realization. TomLarason contributed with the absolute spectral responsivity measurements, computerautomation, and other calibration work. Sally Bruce now provides the annual calibration of thespectral responsivities of the NIST standard photometers. Magdalena Navarro is now engagedin photometric calibration work and keeps improving the facilities. The author is grateful tothese and other staff members in the Division who have contributed and is contributing to thephotometry work at NIST. Thanks are also due to Tom Larason, Jack Hsia, Bob Saunders,Albert Parr, Chris Kuyatt, and Georg Sauter, who kindly reviewed this document and gaveprecious comments and discussions.
– 63 –

References
[1] Booker, R. L. and McSparron, D. A., Photometric Calibrations, NBS Special Publication250-15 (1987).
[2] Cromer, C. L., Eppeldauer, G., Hardis, J. E., Larason, T. C. and Parr, A. C., “NationalInstitute of Standards and Technology detector-based photometric scale,” Applied Optics32-16, 2936-2948 (1993).
[3] Ohno, Y., Cromer, C.L., Hardis, J.E., and Eppeldauer, G., “The Detector-based CandelaScale and Related Photometric Calibration Procedures at NIST,” J. IES, 23-1, 88-98 (1994).
[4] Taylor, B. N. and Kuyatt, C. E., Guidelines for Evaluating and Expressing the Uncertaintyof NIST Measurement Results, NIST Technical Note 1297 (1994).
[5] NIST Special Publication 250, NIST Calibration Services Users Guide
[6] CIE Compte Rendu, p.67, (1924).
[7] CIE Compte Rendu, Table II, pp.25-26 (1931).
[8] CIE Publication No.18.2, The Basis of Physical Photometry (1983).
[9] CIPM, Comité Consultatif de Photométrie et Radiométrie 10e Session–1982, BureauInternational Des Poids et Mesures, Pavillon de Breteuil, F-92310, Sèvres, France (1982).
The same content is published in BIPM Monographie - Principles Governing Photometry(1983), Bureau International Des Poids et Mesures, Pavillon de Breteuil, F-92310, Sèvres,France.
[10]CIE Disk D001 Photometric and Colorimetric Tables (1988).
[11] CGPM, Comptes Rendus des Séances de la 16e Conférence Générale des Poids et Mesures,Paris 1979, p.100, Bureau International des Poids et Mesures, F-92310 Sèvres, France.
[12]CIE Compte Rendu, Vol. 3, Table II, pp.37-39 (1951).
[13]CIPM Procés-Verbaux 44, 4 (1976).
[14] CIE Publication No. 81, Mesopic photometry: History, special problems and practicalsolutions (1989).
[15]CIE Publication No.17.4, CIE International Lighting Vocabulary (1987).
[16]ISO, Quantities and units, ISO Standards Handbook, Third edition (1993).
[17] Taylor, B.N., Editor, NIST Special Publication 814, Interpretation of the SI for the UnitedStates and Metric Conversion Policy for Federal Agencies (1991).
[18] Taylor, B.N., NIST Special Publication 811, Guide for the use of the International Systemof Units (SI) (1995).
– 64 –

[19] Lighting Handbook 8th Edition, Illuminating Engineering Society of North America,Appendix, pp. 946-949 (1993).
[20] Walker, J.H., Saunders, R.D., Jackson, J.K., and McSparron, D.A., Spectral IrradianceCalibrations, NBS Special Publication 250-20 (1987).
[21] Mielenz, K.D., Saunders, R. D., Parr, A. C., and Hsia, J. J., “The new internationaltemperature scale of 1990 and its effect on radiometric, photometric, and colorimetricmeasurements and standards,” CIE Proceedings 22nd Session 1-1, Melbourne 1991, Div.2,65-68 (1991).
[22] Gentile, T. R., Houston, J. M., Hardis, J. E., Cromer, C. L., and Parr, A. C., “The NISTHigh-Accuracy Cryogenic Radiometer,” Applied Optics 35-7, 1056-1068 (1996).
[23] Gentile, T. R., Houston, J. M., and Cromer, C. L., “Realization of a scale of absolutespectral response using the NIST High Accuracy Cryogenic Radiometer,” Applied Optics35-22, 4392-4403 (1996).
[24] Houston, J. M., Cromer, C. L., Hardis, J. E., and Larason, T. C., “Comparison of the NISTHigh-Accuracy Cryogenic Radiometer and the NIST Scale of Detector Spectral Response,”Metrologia 30-4, 285-290 (1993).
[25] T. C. Larason, S. S. Bruce, and C. L. Cromer, “The NIST High Accuracy Scale for AbsoluteSpectral Response from 406 nm to 920 nm,” J. Res. NIST, 100-2, 133-140 (1996)
[26] CCPR Rapport de la 11e session 1986, BIPM, Pavillon de Breteuil, F-92312, Sèvres Cedex,France.
[27] Bonhoure, J., “Photometric Standards of the National Laboratories,” Metrologia 25, 125(1988).
[28] Ohno, Y. and Sauter, G., “1993 Intercomparison of Photometric Units Maintained at NIST(USA) and PTB (Germany),” J. Res. NIST, 100-3, 227-239 (1995).
[29] Ohno, Y., “Integrating Sphere Simulation - Application to Total Flux Scale Realization,”Applied Optics, 33-13, 2637-2647 (1994).
[30] Ohno, Y., “New Method for Realizing a Total Luminous Flux Scale using an IntegratingSphere with an External Source,” J. IES, 24-1, 106-115 (1995).
[31] Ohno, Y., “Realization of NIST Luminous Flux Scale Using an Integrating Sphere with anExternal Source,” the CIE Proceedings, 23rd Session, New Delhi (1995).
[32] Ohno, Y., “Realization of NIST 1995 Luminous Flux Scale using Integrating SphereMethod,” J. IES, 25-1, 13-22 (1996).
[33] Eppeldauer, G. and Hardis, J.E., “Fourteen-decade photocurrent measurements with large-area silicon photodiodes at room temperature,” Applied Optics, 30-22, 3091-3099 (1991).
– 65 –
[34] Eppeldauer, G., “Temperature Monitored/Controlled Silicon Photodiodes forStandardization,” Surveillance Technologies, SPIE Proceedings 1479: 71-77 (1991).
[35] CIE Publication No. 69, Methods of characterizing illuminance meters and luminance meters(1987).
[36] Thompson, A. and Chen, H., “Beamcon III, a Linearity Measurement Instrument forOptical Detectors,” J. Res. NIST, 99-6: 751-755 (1994).
[37] Ohno, Y. and Jackson, J. K., “Characterization of modified FEL quartz-halogen lamps forphotometric standards,” Metrologia, 32-6, 693-696 (1996)
[38]CIE Publication No.84, Measurements of Luminous Flux (1987).
[39] Venable, W. H., Hsia, J. J., and Weidner, V. R., “Establishing a Scale of Directional-Hemispherical Reflectance Factor I: The Van den Akker Method,” J.R.NBS, 82-1:29-55(1977)
[40] Blevin, W. R., “Diffraction Losses in Radiometry and Photometry,” Metrologia 7, 39-44(1970)
[41] Ohno, Y., Lindemann, M., and Sauter, G., “Analysis of integrating sphere errors for lampshaving different angular intensity distributions”, 1996 IESNA Conference Proceedings: 895-906 (1996)
[42] IES LM-9-1988, IES Approved Method for the Electrical and Photometric Measurementsof Fluorescent Lamps.
[43]ANSI C78.1-1991, Rapid Start Types Dimensional and Electrical Characteristics.
[44]ANSI C82.2-1984, Fluorescent Lamp Ballasts – Methods of Measurement.
[45]CIE Publication No.114, CIE Collection in Photometry and Radiometry (1994).
[46]CIE Publication No.15.2, Colorimetry– Second Edition (1986)
[47] Mielenz, K.D., Saunders, R. D., Parr, A. C., and Hsia, J. J., “The 1990 NIST Scale ofThermal Radiometry,” J. Res. NIST, 95-6, 621 (1990).
– 66 –
Attached below is a reprint published by BIPM in 1988. Note that NIST (NBS then) and someother national laboratories revised their photometric units after this publication.
Appendix A - Relationship between national photometric units in 1988.
– A1 –
A. Photometric Measurements
Technical Contacts:
Yoshi OhnoTel: (301) 975-2321E-mail: [email protected]
Mailing Address:
A320 MetrologyNational Institute of Standards and TechnologyGaithersburg, MD 20899-0001
Test No. Items37010C Luminous Intensity and Color Temperature Standard Lamps37020S Special Tests for Luminous Intensity and Color Temperature of
Submitted Lamps37030C Color Temperature Standard Lamps37040C Each Additional Color Temperature for 37030C37050S Special Tests for Color Temperature of Submitted Lamps37060S Special Tests for Total Luminous Flux of Submitted Incandescent Lamps
and Fluorescent Lamps37070C Opal Glass Luminance Coefficient Standards37080S Special Tests for Submitted Luminance Sources and Transmitting
Diffusers37090S Special Tests for Submitted Photometers, Illuminance meters, and Luminance
meters37100S Special Photometric Tests
General Information
Calibration services in this area provide access to the photometric units realized and maintainedat NIST. Lamp standards of luminous intensity, luminous flux, and color temperature as well asreference photometers and materials as described below are issued or calibrated on a routinebasis.
Appendix B - SP250, Optical Radiation Measurements, Chapter 7
– A2 –
Luminous Intensity and Color Temperature Standard Lamps (37010C)
NIST will issue to the customer 1000 W modified FEL quartz halogen lamps calibrated forluminous intensity (candela) and color temperature (kelvin). The lamps have a double coilfilament with a clear bulb, and are potted on a medium bi-post base. The lamps are usuallyoperated at approximately 7A (85V) DC, at a color temperature of 2856 K. The relativeexpanded uncertainty (k = 2) of the luminous intensity of these lamps is 0.6 %, and theexpanded uncertainty (k = 2) of the color temperature is 8 K at 2856 K with respect to the SIunits.
Special Tests for Luminous Intensity and Color Temperature of Submitted Lamps (37020S)
NIST will calibrate the luminous intensity and color temperature of incandescent lamps with amedium bi-post base submitted by customers. The inside frosted lamps, the airway beaconlamps, and the 1000 W FEL lamps previously issued from NIST can be submitted forrecalibration. Customers can either specify the lamp current or the color temperature of the lamp(normally 2856 K) for calibration. The uncertainty of calibration is described above.
Color Temperature Standard Lamps (37030C)
NIST will issue to the customer 1000 W modified FEL quartz halogen lamps as described in37010C calibrated for color temperature. The lamps are usually calibrated for a color temperatureof 2856 K. The expanded uncertainty (k = 2) of the color temperature of these lamps is 8 K at2856 K with respect to the SI units.
Each Additional Color Temperature for 37040C
The color temperature standard lamps requested for 37030C can be calibrated for additional colortemperature points in a range from 2000 K to 3200 K. The expanded uncertainty (k = 2) of thiscalibration is 4 K to 11 K in the range from 2000 K to 3200 K.
Special Tests for Color Temperature of Submitted Lamps (37050S)
NIST will calibrate the color temperature of incandescent lamps with a medium bi-post basesubmitted by customers. The inside frosted lamps, the airway beacon lamps, and the 1000 WFEL lamps previously issued from NIST can be submitted for recalibration. The expandeduncertainty (k = 2) of this calibration is 4 K to 11 K in the range from 2000 K to 3200 K.
Special Tests for Total Luminous Flux of Submitted Incandescent lamps and Fluorescent Lamps(37060S)
NIST will calibrate the total luminous flux (lumen) of incandescent lamps and fluorescent lampssubmitted by customers. The standard lamps previously issued from NIST can be submitted forrecalibration. Miniature lamps may also be accepted. Customers should contact NIST before
– A3 –

submitting lamps. The relative expanded uncertainty (k = 2) of this calibration, which dependson the reproducibility of test lamps, is typically 0.8 % for incandescent lamps and 1.8 % forfluorescent lamps, with respect to the SI units.
Opal Glass Luminance Coefficient Standards (37070C)
NIST will issue flashed opal glasses, 51 mm x 51 mm, calibrated for luminance coefficient (ratioof luminance / illuminance, unit: sr-1) for CIE Illuminant A (2856 K source). The glasses, maskedwith a circular aperture of 25 mm in diameter, are calibrated for the luminance within a circulararea of 1 cm in diameter in the center of the aperture. The relative expanded uncertainty (k = 2)of this calibration is 0.5 %.
Special Tests for Submitted Luminance Sources and Transmitting Diffusers (37080S)
NIST will calibrate the luminance (cd/m2) of submitted sources and luminance coefficient (sr-1)of submitted transmitting diffusers including opal glasses previously issued from NIST.Customers should contact NIST before sending sources or diffusers. The relative expandeduncertainty (k = 2) of the luminance calibration is 0.7 % with respect to the SI units.
Special Tests for Submitted Photometers, Illuminance meters, and Luminance meters (37090S)
NIST will calibrate photometers, illuminance meters, and luminance meters submitted bycustomers. Calibration is usually made with the CIE illuminance A (2856 K incandescentsource) in a range from 0.001 lx to 3000 lx for illuminance and 0.1 cd/m2 to 4000 cd/m2 forluminance. The relative expanded uncertainty (k = 2) of calibration is 0.5 % for illuminance and0.7 % for luminance at normal levels, which will increase at low levels. As an option, NIST canmeasure the relative spectral responsivity of submitted instruments and calculate spectralmismatch correction factors for a source of known spectral power distribution.
Special Photometric Tests (37100S)
NIST can provide special tests for sources, detectors, and photometric instruments other thanthose stated above under limited conditions with special arrangements of the NIST facility.Customers should contact NIST for consultation.
– A4 –
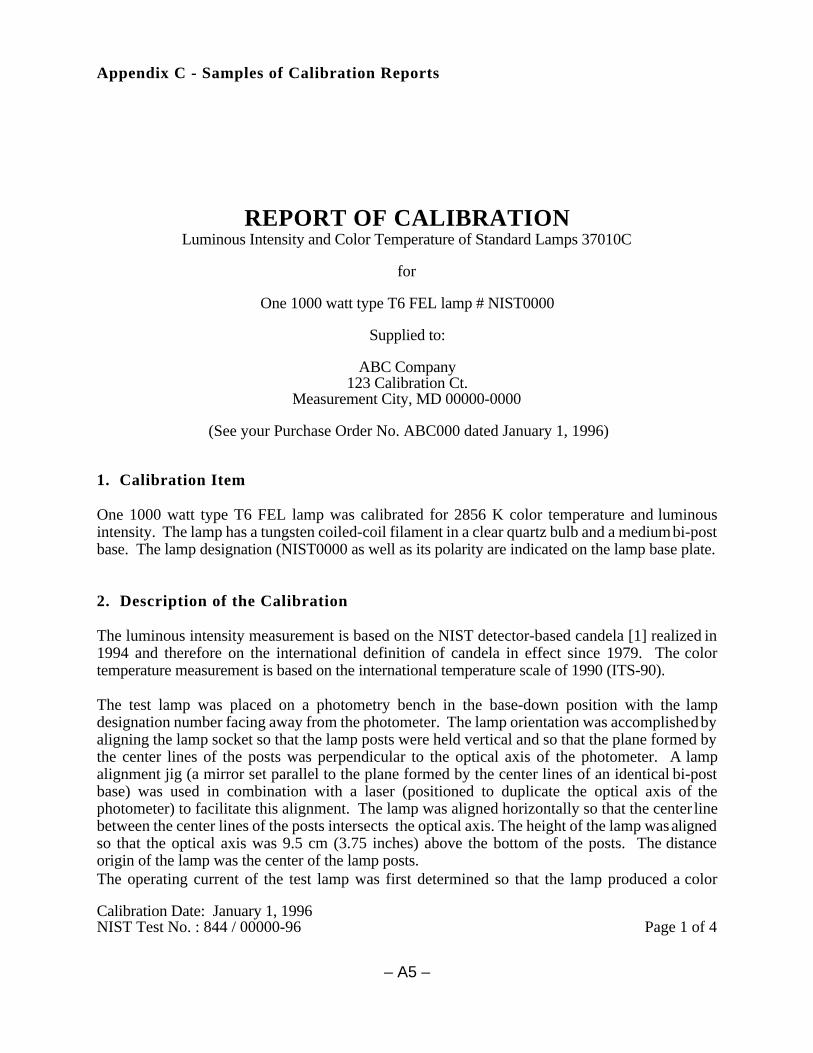
REPORT OF CALIBRATIONLuminous Intensity and Color Temperature of Standard Lamps 37010C
for
One 1000 watt type T6 FEL lamp # NIST0000
Supplied to:
ABC Company123 Calibration Ct.
Measurement City, MD 00000-0000
(See your Purchase Order No. ABC000 dated January 1, 1996)
1. Calibration Item
One 1000 watt type T6 FEL lamp was calibrated for 2856 K color temperature and luminousintensity. The lamp has a tungsten coiled-coil filament in a clear quartz bulb and a medium bi-postbase. The lamp designation (NIST0000 as well as its polarity are indicated on the lamp base plate.
2. Description of the Calibration
The luminous intensity measurement is based on the NIST detector-based candela [1] realized in1994 and therefore on the international definition of candela in effect since 1979. The colortemperature measurement is based on the international temperature scale of 1990 (ITS-90).
The test lamp was placed on a photometry bench in the base-down position with the lampdesignation number facing away from the photometer. The lamp orientation was accomplished byaligning the lamp socket so that the lamp posts were held vertical and so that the plane formed bythe center lines of the posts was perpendicular to the optical axis of the photometer. A lampalignment jig (a mirror set parallel to the plane formed by the center lines of an identical bi-postbase) was used in combination with a laser (positioned to duplicate the optical axis of thephotometer) to facilitate this alignment. The lamp was aligned horizontally so that the center linebetween the center lines of the posts intersects the optical axis. The height of the lamp was alignedso that the optical axis was 9.5 cm (3.75 inches) above the bottom of the posts. The distanceorigin of the lamp was the center of the lamp posts. The operating current of the test lamp was first determined so that the lamp produced a color
Appendix C - Samples of Calibration Reports
Calibration Date: January 1, 1996NIST Test No. : 844 / 00000-96 Page 1 of 4
– A5 –
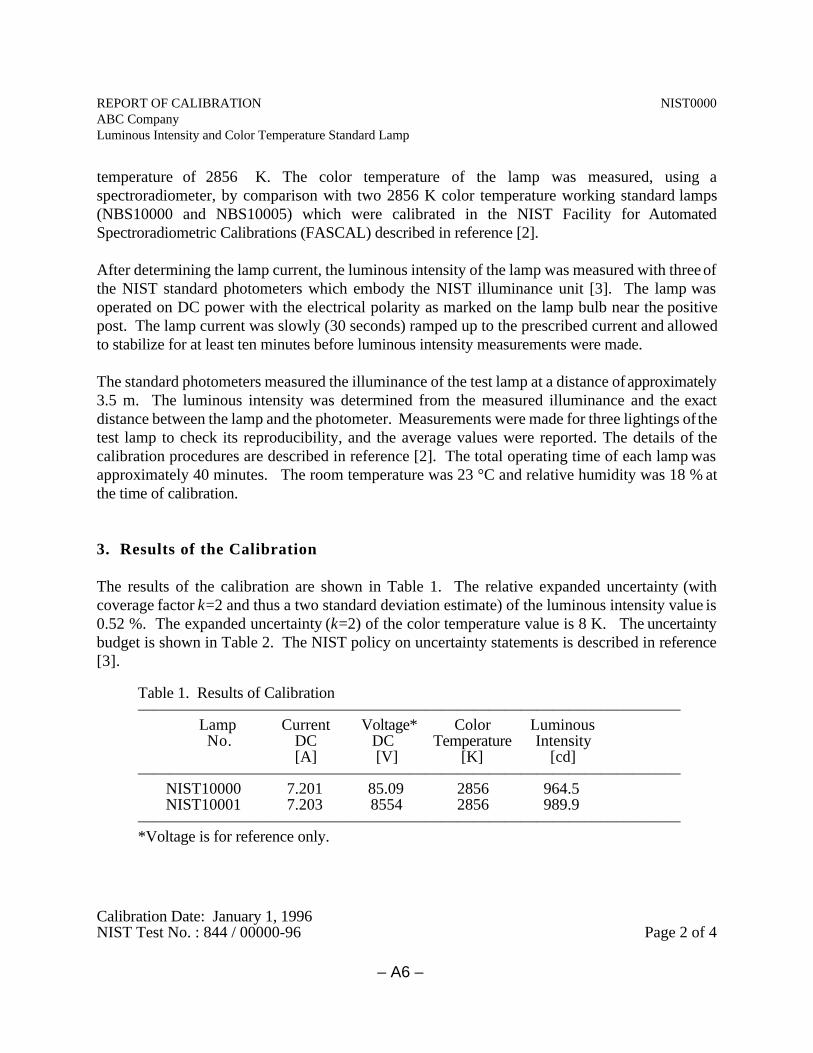
temperature of 2856 K. The color temperature of the lamp was measured, using aspectroradiometer, by comparison with two 2856 K color temperature working standard lamps(NBS10000 and NBS10005) which were calibrated in the NIST Facility for AutomatedSpectroradiometric Calibrations (FASCAL) described in reference [2].
After determining the lamp current, the luminous intensity of the lamp was measured with three ofthe NIST standard photometers which embody the NIST illuminance unit [3]. The lamp wasoperated on DC power with the electrical polarity as marked on the lamp bulb near the positivepost. The lamp current was slowly (30 seconds) ramped up to the prescribed current and allowedto stabilize for at least ten minutes before luminous intensity measurements were made.
The standard photometers measured the illuminance of the test lamp at a distance of approximately3.5 m. The luminous intensity was determined from the measured illuminance and the exactdistance between the lamp and the photometer. Measurements were made for three lightings of thetest lamp to check its reproducibility, and the average values were reported. The details of thecalibration procedures are described in reference [2]. The total operating time of each lamp wasapproximately 40 minutes. The room temperature was 23 °C and relative humidity was 18 % atthe time of calibration.
3. Results of the Calibration
The results of the calibration are shown in Table 1. The relative expanded uncertainty (withcoverage factor k=2 and thus a two standard deviation estimate) of the luminous intensity value is0.52 %. The expanded uncertainty (k=2) of the color temperature value is 8 K. The uncertaintybudget is shown in Table 2. The NIST policy on uncertainty statements is described in reference[3].
Table 1. Results of Calibration——————————————————————————————————
Lamp Current Voltage* Color LuminousNo. DC DC Temperature Intensity
[A] [V] [K] [cd]——————————————————————————————————
NIST10000 7.201 85.09 2856 964.5NIST10001 7.203 8554 2856 989.9
——————————————————————————————————*Voltage is for reference only.
REPORT OF CALIBRATION NIST0000ABC CompanyLuminous Intensity and Color Temperature Standard Lamp
Calibration Date: January 1, 1996NIST Test No. : 844 / 00000-96 Page 2 of 4
– A6 –
4. General Information
The lamp should be carefully aligned in accordance with the procedures described above. Thelamp should be operated on DC power at the reported current and at the prescribed polarity.Photometric measurements should be made after the lamp has stabilized (approximately 10 minutesafter turn on).
Further details of the NIST photometric units, calibration procedures, and uncertainty analysis aredescribed in reference [3].
The Calibration Report shall not be reproduced except in full, without the written approval ofNIST.
Prepared by :
Yoshihiro OhnoOptical Technology DivisionPhysics Laboratory(301) 975-2321
References:[1] C. L. Cromer, G. Eppeldauer, J. E. Hardis, T. C. Larason, and A. C. Parr, “NationalInstitute of Standards and Technology detector-based photometric scale,” Applied Optics, 32-16,2936-2948 (1993)[2] NBS Special Publication 250-20 (1987), Spectral Irradiance Calibrations[3] NIST Special Publication 250-15 (1995), Photometric Calibrations [4] B. N. Taylor and C. E. Kuyatt, "Guidelines for Evaluating and Expressing the Uncertainty ofNIST Measurement Results," NIST Technical Note 1297 (1993).
REPORT OF CALIBRATION NIST0000ABC CompanyLuminous Intensity and Color Temperature Standard Lamp
Approved by :
Joseph L. DehmerFor the Director,National Institute of Standards and Technology(301) 975-3216
Calibration Date: January 1, 1996NIST Test No. : 844 / 00000-96 Page 3 of 4
– A7 –

Table 2. Uncertainty budget for this luminous intensity calibration ––––––––––––––––––––––––––––––––––––––––––––––––––––––––––––––––––
Relative expandedUncertainty factor uncertainty (k=2) [%]
Type A Type B––––––––––––––––––––––––––––––––––––––––––––––––––––––––––––––––––The NIST illuminance unit realization 0.38Long-term drift of the NIST standard photometers 0.26Photometer temperature variation 0.03Distance measurement (uncertainty of the linear encoder at 3 m) 0.02Alignment of the lamp distance (0.5 mm in 3 m) 0.03Determination of ccf* 0.04 Lamp current regulation 0.02Stray light 0.05Random noise (scatter by dust, lamp drift, etc.) 0.10Test lamp reproducibility in 3 lightings 0.20
Overall uncertainty of test lamp calibration with respect to SI 0.52––––––––––––––––––––––––––––––––––––––––––––––––––––––––––––––––––
REPORT OF CALIBRATION 000-001ABC Company 000-002 Luminous Flux of Submitted Lams 000-003
Calibration Date: January 1, 1996NIST Test No. : 844 / 00000-96 Page 4 of 4
– A8 –
REPORT OF CALIBRATIONSpecial Test for Luminous Flux of Submitted Lamps 37060S
for
Three Incandescent Lamps with s/n: 000-001, 000-001, 000-003
Submitted by:
ABC Company123 Calibration Ct.
Measurement City, MD 00000-0000
(See your Purchase Order No. ABC123 dated January 1, 1996)
1. Description of Calibration Item
Three 1000 W gas-filled, frosted-bulb incandescent lamps with designation numbers; 000-001,000-002, and 000-003 were calibrated for total luminous flux.
2. Description of Calibration
This total luminous flux measurement is based on the NIST luminous flux unit [1] realized in 1995which has been derived from the NIST detector-based candela [2] realized in 1994 and thereforebased on the international definition of candela in effect since 1979.
The test lamps were calibrated in a 2 m integrating sphere by comparison with the 60 W totalluminous flux working standard lamps (TF6-1, TF6-2, and TF6-3). The working standard lampsare calibrated periodically using the integrating sphere against the NIST primary total luminousflux standard lamps (40 W, TF4 Group). The primary standard lamps are calibrated using theprocedures described in reference [1]. The details of the 2 m integrating sphere system aredescribed in reference [3].
The lamps were operated in the base up position. The operating current for each lamp was firstdetermined for a color temperature of approximately 2856 K by measuring the relative spectralirradiance in one direction using a spectroradiometer. The total luminous flux measurements were
Calibration Date: January 1, 1996NIST Test No. : 844 / 00000-96 Page 1 of 3
– A9 –
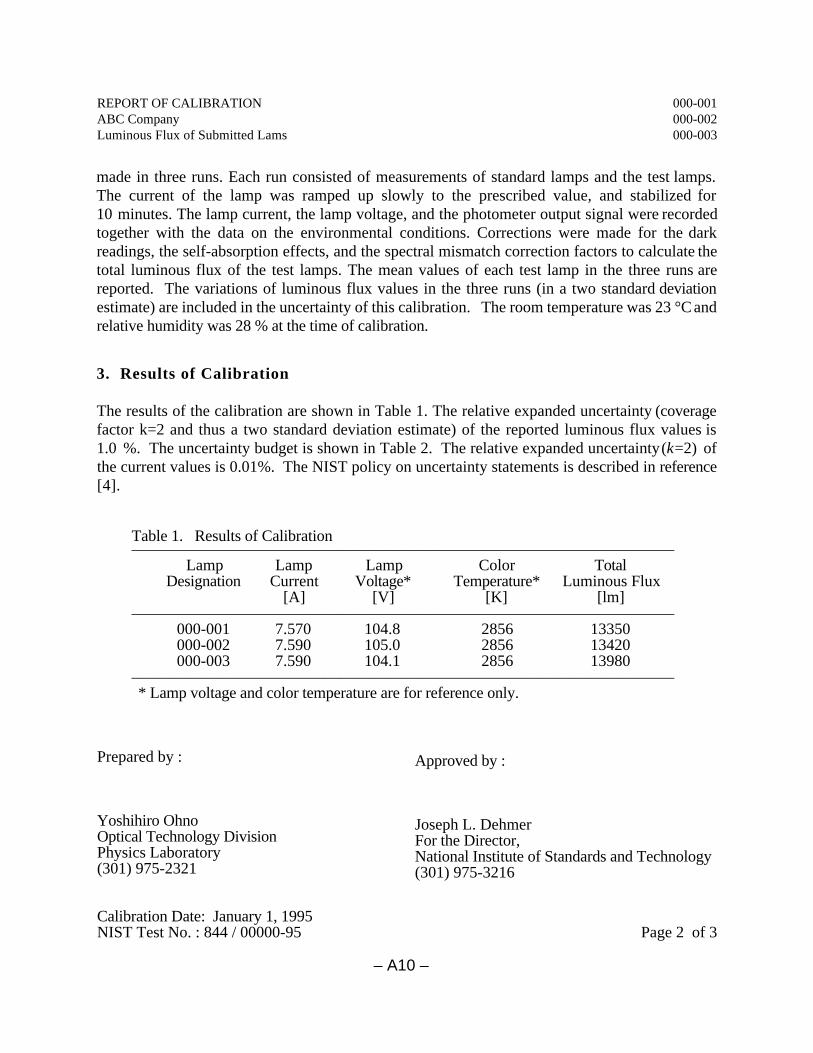
made in three runs. Each run consisted of measurements of standard lamps and the test lamps.The current of the lamp was ramped up slowly to the prescribed value, and stabilized for10 minutes. The lamp current, the lamp voltage, and the photometer output signal were recordedtogether with the data on the environmental conditions. Corrections were made for the darkreadings, the self-absorption effects, and the spectral mismatch correction factors to calculate thetotal luminous flux of the test lamps. The mean values of each test lamp in the three runs arereported. The variations of luminous flux values in the three runs (in a two standard deviationestimate) are included in the uncertainty of this calibration. The room temperature was 23 °C andrelative humidity was 28 % at the time of calibration.
3. Results of Calibration
The results of the calibration are shown in Table 1. The relative expanded uncertainty (coveragefactor k=2 and thus a two standard deviation estimate) of the reported luminous flux values is1.0 %. The uncertainty budget is shown in Table 2. The relative expanded uncertainty (k=2) ofthe current values is 0.01%. The NIST policy on uncertainty statements is described in reference[4].
Table 1. Results of Calibration——————————————————————————————————
Lamp Lamp Lamp Color TotalDesignation Current Voltage* Temperature* Luminous Flux
[A] [V] [K] [lm]——————————————————————————————————
000-001 7.570 104.8 2856 13350000-002 7.590 105.0 2856 13420000-003 7.590 104.1 2856 13980
——————————————————————————————————* Lamp voltage and color temperature are for reference only.
Prepared by :
Yoshihiro OhnoOptical Technology DivisionPhysics Laboratory(301) 975-2321
REPORT OF CALIBRATION 000-001ABC Company 000-002 Luminous Flux of Submitted Lams 000-003
Calibration Date: January 1, 1995NIST Test No. : 844 / 00000-95 Page 2 of 3
Approved by :
Joseph L. DehmerFor the Director,National Institute of Standards and Technology(301) 975-3216
– A10 –
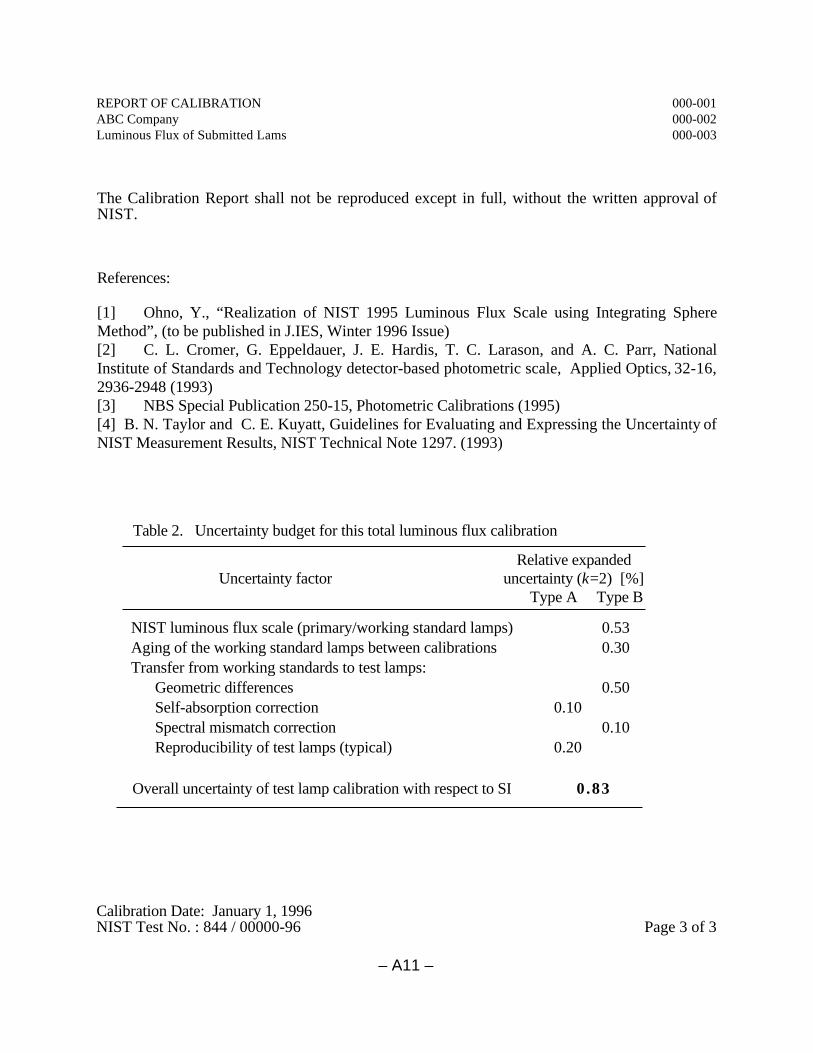
The Calibration Report shall not be reproduced except in full, without the written approval ofNIST.
References:
[1] Ohno, Y., “Realization of NIST 1995 Luminous Flux Scale using Integrating SphereMethod”, (to be published in J.IES, Winter 1996 Issue)[2] C. L. Cromer, G. Eppeldauer, J. E. Hardis, T. C. Larason, and A. C. Parr, NationalInstitute of Standards and Technology detector-based photometric scale, Applied Optics, 32-16,2936-2948 (1993)[3] NBS Special Publication 250-15, Photometric Calibrations (1995)[4] B. N. Taylor and C. E. Kuyatt, Guidelines for Evaluating and Expressing the Uncertainty ofNIST Measurement Results, NIST Technical Note 1297. (1993)
Table 2. Uncertainty budget for this total luminous flux calibration
Relative expandedUncertainty factor uncertainty (k=2) [%]
Type A Type B NIST luminous flux scale (primary/working standard lamps) 0.53Aging of the working standard lamps between calibrations 0.30Transfer from working standards to test lamps:
Geometric differences 0.50 Self-absorption correction 0.10Spectral mismatch correction 0.10Reproducibility of test lamps (typical) 0.20
Overall uncertainty of test lamp calibration with respect to SI 0.83
REPORT OF CALIBRATION 000-001ABC Company 000-002 Luminous Flux of Submitted Lams 000-003
Calibration Date: January 1, 1996NIST Test No. : 844 / 00000-96 Page 3 of 3
– A11 –