NIPA Corporate Profits and Reported Earnings: A … · NIPA Corporate Profits and Reported...
28
1 NIPA Corporate Profits and Reported Earnings: A Comparison and Measurement Issues Charles Ian Mead, Brent R. Moulton, and Kenneth Petrick * January 2004 Abstract B The users of the national income and product accounts (NIPAs) often compare the growth rates of NIPA profit measures with those of other publically available measures of reported earnings, such as Standard & Poor =s 500 earnings. Differences between the NIPA profit measures and the other reported earnings measures reflect differences in purpose, definitions, and methodologies. Reported earnings are used by the Bureau of Economic Analysis, however, in preparing the quarterly estimates of profits based on the extrapolation of the tax-accounting measures published by the Internal Revenue Service. In recent years there have been large revisions to NIPA corporate profits when tax-return-based measures have become available. Differences between financial accounting and tax accounting in the treatment of employee stock options have contributed to the revisions. This paper explores these differences and examines possible improvements to the methods used for extrapolating NIPA corporate profits estimates that would incorporate more current information on employee stock options. The users of the national income and product accounts (NIPAs) often compare the growth rates of NIPA profit measures with those of other publically available measures of reported earnings, such as Standard & Poor=s (S&P) 500 earnings. As a result, many have noticed a divergence between the growth rates of these two types of measures in more recent years. The Bureau of Economic Analysis= (BEA=s) use of financial-based reported earnings measures in the creation of its preliminary NIPA corporate profits estimates has also resulted in large revisions in recent years as the use of these data has been replaced with the use of newly available tax information. This paper explores the differences between the two types of profit measures and examines possible improvements to the methods used to * U.S Department of Commerce, Bureau of Economic Analysis, Washington, DC, 20230. The authors would like to acknowledge the major contributions of Ernie Wilcox to developing the new NIPA adjustment for employee stock options. The authors would also like thank the participants of the Bureau of Economic Analysis Advisory Committee Meeting and the Brookings Economic Measurement Workshop, in which portions of the material presented in this paper were presented. Any errors are the authors = own. In addition, the opinions expressed in this paper are those of the authors and not necessarily those of the Bureau of Economic Analysis or the U.S. Department of Commerce.
Transcript of NIPA Corporate Profits and Reported Earnings: A … · NIPA Corporate Profits and Reported...

1
NIPA Corporate Profits and Reported Earnings: A Comparison and Measurement Issues
Charles Ian Mead, Brent R. Moulton, and Kenneth Petrick* January 2004
Abstract B The users of the national income and product accounts (NIPAs) often compare the growth rates of NIPA profit measures with those of other publically available measures of reported earnings, such as Standard & Poor=s 500 earnings. Differences between the NIPA profit measures and the other reported earnings measures reflect differences in purpose, definitions, and methodologies. Reported earnings are used by the Bureau of Economic Analysis, however, in preparing the quarterly estimates of profits based on the extrapolation of the tax-accounting measures published by the Internal Revenue Service. In recent years there have been large revisions to NIPA corporate profits when tax-return-based measures have become available. Differences between financial accounting and tax accounting in the treatment of employee stock options have contributed to the revisions. This paper explores these differences and examines possible improvements to the methods used for extrapolating NIPA corporate profits estimates that would incorporate more current information on employee stock options.
The users of the national income and product accounts (NIPAs) often compare the growth rates
of NIPA profit measures with those of other publically available measures of reported earnings, such as
Standard & Poor=s (S&P) 500 earnings. As a result, many have noticed a divergence between the
growth rates of these two types of measures in more recent years. The Bureau of Economic Analysis=
(BEA=s) use of financial-based reported earnings measures in the creation of its preliminary NIPA
corporate profits estimates has also resulted in large revisions in recent years as the use of these data
has been replaced with the use of newly available tax information. This paper explores the differences
between the two types of profit measures and examines possible improvements to the methods used to
* U.S Department of Commerce, Bureau of Economic Analysis, Washington, DC, 20230. The authors would
like to acknowledge the major contributions of Ernie Wilcox to developing the new NIPA adjustment for employee stock options. The authors would also like thank the participants of the Bureau of Economic Analysis Advisory Committee Meeting and the Brookings Economic Measurement Workshop, in which portions of the material presented in this paper were presented. Any errors are the authors = own. In addition, the opinions expressed in this paper are those of the authors and not necessarily those of the Bureau of Economic Analysis or the U.S. Department of Commerce.

2
produce preliminary NIPA corporate profits estimates by incorporating more current information on
employee stock options.
Although it has traditionally been argued that the long-term trends between NIPA profit
measures and other reported earnings measures have roughly been similar over time, questions about
the strength of this relationship have recently been raised. For example, Nordhaus (2002) observes that
S&P 500 earnings per share grow at an annual rate of 15 percent over the period of 1992-2000, while
NIPA corporate profits only grow at an annual rate of 8 percent over the same period. Related
literature on the growing differences between financial and taxable income also indirectly places the
strength of this relationship in question. This is because NIPA corporate profit measures are ultimately
based on data collected from corporate income tax returns, whereas S&P 500 earnings measures are
based on data collected from financial reports.
Interest in the growing difference between reported financial and taxable income has increased
in recent years due to concerns over corporate tax sheltering activity. Examples of work that solely
focus on the growing differences between financial and tax accounting measures include Mills, Newbury
and Trautman (2002). By comparing Compustat financial statement data to Internal Revenue Service
(IRS) Form 1120 tax return data, these authors find that differences between the financial and taxable
income of public corporations grows over the period of 1991-1998. Another example of this work
includes Plesko (2002b). Using data collected from Schedule M-1 of the Form 1120 series of
corporate income tax returns, he finds that 65.6 percent of a $66.5 billion increase in the differences
between financial and taxable income over the period of 1996-1998 is associated with corporations
reporting negative net income to the Internal Revenue Service (IRS).

3
Examples of work that primarily focus on corporate tax sheltering activity include Desai (2002).
He finds that the differential treatment of employee stock options across the separate accounting
systems create the largest distinction between financial and taxable income for large corporations over
the period of 1996-2000. However, he also argues that corporate tax sheltering activity has likely
increased in recent years as less of the differences between financial and taxable income can be
explained by the differential treatment of stock options.
Although studies of the differences between financial and taxable income provide some insight
into the possible causes of the differences between NIPA profit and reported earnings measures, they
do not directly explain the differences between their growth rates. Not only do these differences result
from variation in accounting concepts, but they also result from variation in the sets of corporations
covered by each measure. These studies also do not explain why the use of reported earnings measures
has led to large revisions in the NIPA profit measures in more recent years.1
This paper begins by discussing differences in the definitions and methodologies used to create
the NIPA profits and reported earnings measures. Afterwards, evidence is presented which indicates
that much of the difference in their growth rates is the result of both variation in accounting concepts and
coverage. Since the effects of differences in coverage cannot be accurately predicted for future periods,
the last portion of this paper focuses on the differential treatment of employee stock options. This is one
area in which improvements in preliminary NIPA corporate profit estimates are continuing to be made
through the incorporation of more current information on employee stock options.
1 For example, in the July 2002 annual revision of the NIPAs the preliminary NIPA estimates of profits from
current production for 2000 and 2001 were revised downward by $88.3 and $35.5 billion, respectively.

4
I. Differences in Definition and Methodology
Much of the difference between the NIPA profit measures and alternative earnings measures
reflect differences in their definitions that result from the purposes for which they are intended to serve.
NIPA profit measures are fashioned to provide as a consistent time series of the income earned from
the current production of all U.S. corporations in a manner that fits into the framework provided by the
NIPAs. On the other hand, reported earnings measures are generally fashioned to serve as benchmarks
for assessing the performance of individual companies or groups of companies.
NIPA Estimates of Profits
The NIPAs are summarized in a series of seven accounts that aggregate economic activity into
broad sectors and types of transactions.2 The first of these accounts, the Domestic Income and Product
Account, provides two separate measures of the output of final goods and services in the U.S.
economy. The expenditures side measures Gross Domestic Product as the sum of goods and services
produced by labor and property located in the United States and sold to final users. The income side
measures the conceptual equivalent, Gross Domestic Income (GDI), as the sum of the incomes earned
in that production. NIPA net operating surplus, a new component, is a profits-like measure that
2 The presentation in seven summary accounts was introduced in the 2003 comprehensive revision of the
NIPAs, replacing an earlier set of five summary accounts. For a discussion of the new set of seven summary accounts, see Mayerhauser, Smith, and Sullivan (2003), and for an earlier discussion of the integrated system of national accounts, go to BEA =s web site at <www.bea.gov>, click on AMethodologies,@ and see AMP-1: Introduction to National Economic Accounting.@

5
shows business income after subtracting the costs of compensation of employees, taxes on production
and imports (less subsidies), and consumption of fixed capital (economic depreciation) from value
added, but before subtracting financing costs (such as net interest) and business transfer payments. Net
operating surplus is therefore conceptually similar to the financial accounting concept of earnings before
interest and taxes.
The second summary account, the Private Enterprise Income Account, summarizes the sources
and uses of income of private enterprises. (Private enterprises consist of corporations, non-corporate
private businesses, owner-occupied housing, and -- for purposes of estimating monetary interest
payments and imputed interest receipts -- nonprofit institutions serving households.) The Asources@ side
of this account shows the sources of income, both from domestic production (as summarized by the net
operating surplus) and from foreign sources or from interest or dividend income on financial assets. The
Auses@ side of this account shows financing expenses (interest paid, profits accruing to foreign owners)
and business transfer payments, as well as the residual claims on income in the forms of proprietors=
income, rental income of persons, and corporate profits. NIPA corporate profits with inventory
valuation and capital consumption adjustments (or profits from current production) is based on
depreciation of fixed assets and inventory withdrawals valued at current cost, rather than at historical
cost.
Since the NIPAs are intended measure only the economic activity associated with current
production, the NIPA definition of corporate profits is limited to the receipts arising from current
production less associated expenses. The NIPA definition therefore excludes transactions that merely
reflect the acquisition or disposition of assets or liabilities. The acquisition or disposition of fixed assets

6
and inventories are recorded in the NIPA domestic capital account, while the acquisition or disposition
of financial assets or liabilities are recorded in the Federal Reserve Board=s flow of funds accounts,
which are a companion to the NIPAs. It is for these reasons that receipts exclude the income resulting
and capital gains. Dividend receipts from domestic corporations (for example, dividends received by
mutual funds or insurance carriers) are also excluded from receipts to avoid a double-counting of
profits. Similarly, expenses exclude bad debts, natural resource depletion, and capital losses.
An understanding of the differences between financial and tax accounting at this point of the
discussion will help to illuminate many of the differences between the NIPA profit measures and
reported earnings measures. Financial accounting is practiced to provide useful information to creditors
and investors. Rather than being based on a uniform set of accounting rules to be applied across all
companies, financial accounting is based on Generally Accepted Accounting Principles (GAAP), which
are governed by the Financial Accounting Standards Board. The flexibility allowed by GAAP is seen as
a benefit to the system because it allows management to tailor financial statements that reveal useful
information which is particular to an individual company.3 Tax accounting is practiced to allow for the
timely and uniform completion of corporate income tax returns. Thus, there is a much more uniform set
of rules used across all corporations in tax accounting.
The differences between financial and tax accounting practices create two separate types
dissimilarities between earnings measures. First, intertemporal differences exist because the timing of
revenue and expense recognition often differs between the two accounting systems. Depreciation
3 Plesko (2002a) advances this point in a more detailed explanation of the differences between financial and
tax accounting than that which is presented in this paper.

7
serves as a notable example because physical capital is often depreciated more slowly under GAAP
than in tax accounting. Second, permanent differences exist because some revenues and expenses are
recognized under one accounting system but not the other. An important example is the treatment of
employee stock options. In tax accounting, non-qualified employee stock options are taxed as ordinary
income to recipients and expensed by corporations as compensation once the options are exercised.
While a number of corporations have voluntarily recognized stock options as an expense in their
financial statements, most corporations only show stock option activity in a footnote on their financial
statements.4
BEA uses the tax-accounting measures published annually by the IRS in Statistics of Income:
Corporation Income Tax Returns (SOI) as its primary source of information on corporate profits for
two reasons. First, the SOI tabulations cover the entire universe of active corporations, while the
alternative earnings measures only cover a sample of publicly traded corporations.5 The coverage of the
SOI tabulations is consistent with the coverage of the NIPA profit measures. Second, the SOI
tabulations are based on a tax accounting framework that provides a greater degree of uniformity in the
4 The Financial Accounting Standards Board (FASB) is currently conducting a project to improve the
accounting and disclosures related to stock-based compensation. Although FASB would ultimately like to see stock options included in the expenses reported in financial statements, there has been much debate over which method of valuation should be consistently used. It is unclear when an agreed upon method will become effective.
5 The SOI tabulations are based on a stratified sample of unaudited tax returns that currently includes all active corporations with more than $50 million of assets (with a few exceptions) as well as a sample of smaller firms. Weights based on inverse sampling probabilities are used to provide estimates of universe totals, by industry, for many items in the corporate income tax return. The S&P earnings measures are based on the S&P 500 corporations. Weights related to the sampling probability of the corporate universe are not used in the construction of the S&P earnings measures. As a result, these measures are not representative of the complete universe of active corporations.

8
application of accounting methods across companies than the financial accounting framework. Greater
uniformity is thought to improve the accuracy of the NIPA profit estimates.
Even though the BEA uses the tax-accounting data published annually by the IRS, it is important
to note that NIPA corporate profits before tax are not equivalent to taxable income. In particular, the
starting point for annual NIPA profits estimates is IRS Atotal receipts less total deductions.@ The
following adjustments are then made to this figure before arriving at a final estimate of NIPA profits
before tax: an allowance for the misreporting of corporate income is added; deductions that are not
part of current production (depletion on domestic minerals, expending for mineral exploration, state and
local corporate tax accruals, and bad debt expense) is added; elements of current production that are
not current IRS deductions (interest payments of regulated investment companies, costs of trading or
issuing corporate securities, and taxes paid by domestic corporations) are subtracted; elements of
domestic income from current production that are not in IRS income (profits of certain types of profit
institutions) are added; elements of IRS income that are not domestic income from current production
(capital gains, dividend income, and income on equities in foreign companies and branches) are
subtracted; and rest-of-the-world profits, derived from BEA=s international transactions accounts, are
added.6
NIPA corporate profits after tax are formed by subtracting an estimate of the NIPA profits tax
liability from an estimate of NIPA corporate profits before tax. The starting point for the estimate of the
NIPA profits tax liability is IRS Federal income and excess profits taxes as published by the IRS. The
6 A reconciliation between NIPA corporate profits and the corresponding measures published by IRS will be
published in NIPA table 7.16.

9
following adjustments are then made to this figure before arriving at the NIPA profits tax liability: tax
liabilities disclosed by IRS audit, renegotiation and carryback refunds are added; elements of tax
liabilities that are not included in IRS federal income and excess profits taxes (payments to the U.S.
Treasury by Federal Reserve Banks, and State and local corporate profits tax accruals) are added; and
IRS tax credits deducted in arriving at NIPA tax liabilities (foreign tax credits, investment tax credits,
and other tax credits) are subtracted.
The drawbacks associated with the use of the SOI tabulations is that they are only available on
an annual basis and with a considerable time lag. As a result, quarterly NIPA profits estimates are
obtained by interpolation between annual estimates, and for more recent quarters, by extrapolation.7
The extrapolation and interpolation is done at an industry level where most industry-level indicator series
come from the U.S. Census Bureau Quarterly Financial Report (QFR) and data collected from
various regulatory agencies.8 However, QFR and regulatory data are only available for a set of
industries that roughly account for 75 percent of an NIPA total profits before tax estimate. As a result,
financial-based earnings from the Compustat database are used to prepare matched panels of reported
earnings for the transportation and warehousing, information, finance and insurance, real estate and
rental and leasing, and other nonfinancial services industries. These are then used to prepare industry-
7 Interpolation is a method that is used to prepare estimates between two periods; it applies a mathematical
formula to preserve the quarterly pattern of the indicator series consistent with the annual level of the source data. Extrapolation is a method that is used to extend estimates forward (or backward) from a given estimate; in simple terms, it applies a percentage change in an indicator series to the level of an estimate.
8 A complete list of source data that are used to complete the various vintages and types of NIPA profits measures can be found in U.S. Department of Commerce, Bureau of Economic Analysis, ACorporate Profits: Profits Before Tax, Profit Tax Liability, and Dividends: Methodology Paper@ (Washington, D.C.: U.S. Government Printing Office).

10
level profits estimates for the aforementioned industries before all industry-level profit estimates are
totaled to form an aggregate estimate. Unlike the QFR and regulatory data which can be readily
adjusted to closely conform to the NIPA definition of corporate profits, the Compustat earnings
measures might not move in close correspondence with the concept of NIPA profits.9
S&P 500 Profits
There are a number of different earnings measures that are based on data reported on financial
statements. However, this section focuses on S&P 500 earnings measures because they are the
measures that are most often compared to NIPA profits measures.10 The general concepts presented in
this paper will carry over to other earning measures because all of the reported earnings measures rely
on the financial data filed by publically-traded companies.
The S&P 500 measures of reported earnings reflect the aggregate earnings of the 500
corporations that compose the S&P stock index. Reported earnings are based on the after-tax earnings
that are publically reported by corporations in accordance with GAAP, whereas operating earnings are
reported earnings that exclude the impacts of accumulated accounting changes, discontinued operations,
extraordinary items, and special items.
9 Although the QFR and regulatory source data can be adjusted to more closely conform to the concept of
NIPA profits, the cost associated with employee stock options are not included in these source data. Adjustments to include the cost associated with employee stock option are discussed in the third section of this paper.
10 Other organizations, such as Thompson=s Financial Reports First Call, also produce earnings measures.

11
The purpose of the S&P 500 stock index is to gauge changes in the total market value of the
500 leading corporations chosen by S&P. The inclusion of a corporation in the index is based on its
market value, capitalization, trading activity, and industry-group representation. The S&P 500 universe
is continually changing due to corporate actions such as mergers and acquisitions, bankruptcy, or
restructuring. In addition, compositional changes sometimes reflect market actions that limit liquidity or
desires to change industry representation.11 In order to prevent discontinuities in the overall S&P index,
a scaling factor is used to derive the index.12
Because the S&P 500 earnings measures reflect a shifting market basket of corporations, the
series of reported earnings are discontinuous over time. Thus, the estimates of growth derived from
these series that are used to interpolate and extrapolate tax-based measures of NIPA corporate profits
reflect changes in the composition of the index as well.
II. Empirical Differences
Although much of the literature discusses the differences between financial and tax accounting,
very little discussion has occurred as to the effects that differences in coverage have on the differences
between the growth rates of the NIPA profits and reported earnings measures. The NIPA profit
11 Specific details as to the selection criteria used to choose the S&P 500 is available at
<www.spglobal.com/indexmain500.html>.
12 The actual index is calculated as the overall market capitalization of the 500 corporations divided by a divisor. The divisor assumes an arbitrary value and is a scaling factor that equates adjacent-period estimates of S&P 500 total market capitalization.

12
measures cover the economic activity reported on roughly 5.7 million corporate income tax returns,
while reported earnings measures essentially cover the economic activity of only the largest of
corporations. Because the earnings of small and mid-sized corporations do not necessarily move in
concert with the earnings of large corporations, the rate of growth in NIPA profits measures are likely to
differ from the rate of growth in reported earnings measures.
This section presents the results associated with an examination of the main causes for
differences between the growth rates of the NIPA profits after tax and the S&P 500 earnings measures.
NIPA profits after tax (without inventory valuation and capital consumption allowances) are used
because they are the NIPA profits measure that are most similar to the S&P earnings measures.
Although there are still differences in depreciation rates between the two measures, at least the charges
for depreciation across the two sets of measures are based on the historic cost of assets. The first set of
results shows that substantial differences exist between the growth rates of these two measures even
before 1992. The second set of results shows that large portions of the differences over the period of
1992-2001 can be explained by both differences in accounting concepts and corporate coverage. The
third set of results shows that increases in the deficits of corporations located within particular industries
are likely to explain some of the recently observed differences. An additional factor affecting the
differences in more recent years is the growth of chapter S corporations in the economy over the past
decade. The last set of results shows that the growth of chapter S corporations mitigates some of the
effects that increased in deficits has on differences between the growth rates of the NIPA profits and
reported earnings measures.

13
Chart 1 demonstrates that substantial year-to-year differences between the NIPA profits after
taxes without inventory valuation and capital consumption adjustments and the S&P 500 earnings
measures are not limited to recent time periods.13 This chart presents S&P 500 earnings as a
percentage share of this measure of NIPA profits over the period of 1988-2001.14 For reported
earnings, the share ranges from 38 percent in 1991 to 85 percent in 2000; for operating earnings, the
share ranges from 45 percent in 1991 to 96 percent in 2000. These findings are indeed consistent with
observations that NIPA profits have grow more slowly than S&P 500 earnings over the period of
1992-2000. However, the dramatic drop in shares over the period of 1989-1991 are over half as large
in magnitude as the increase in shares over the entire period of 1991-2000. There is also a dramatic
drop in shares after 2000 even with the retroactive accelerated depreciation provisions created by the
Job Creation and Worker Assistance Act of 2002 that affect the fourth quarter of 2001. These last two
findings suggest that more than the just differences between accounting concepts are influencing the
differences between the growth rates of NIPA profits and reported earnings measures.
Although examining the change in shares over time might provide some insight into effects of the
conceptual and methodological differences between the growth rates of NIPA profits and reported
earnings, further considerations should to taken into account because each of the measures are designed
13 The NIPA measure without these adjustments, which convert the measure of profits from one which is
based on charges for depreciation of fixed assets and for inventory withdrawals valued at historical cost to measures based on current costs, is used for this analysis to improve consistency with financial accounting measures, which are also based on historical cost valuation.
14 The time period analyzed in this section ends in 2001 because this is the last year currently covered by the corporate tax data published in the Internal Revenue Service Statistics of Income series.

14
for a different purpose. NIPA profits, however, can be compared with reported earnings with the use
of additional estimates that provide some conceptual bridges between the two sets of measures.
Table 1 shows the year-to-year growth rates of various NIPA, SOI, and S&P measures of
profits over the period of 1992-2001. The adjusted NIPA profits before tax estimates which add back
capital gains and losses and bad debt expenses provide one conceptual bridge to understand the
differences in the growth rates between the various profit measures. In table 1, the differences between
the annual growth rate of S&P 500 earnings and the annual growth rate of S&P 500 earnings per share,
along with the differences between the annual growth rate of S&P 500 operating earnings and the
annual growth rate of S&P operating earnings per share, reflect the impact of corporate turnover in the
S&P 500. The differences between the annual growth rate of S&P 500 operating earnings and the
annual growth rate of SOI total receipts less deductions reflect differences in coverage, industry
representation, and accounting principles between the S&P 500 and SOI tax return tabulations. The
differences between the annual growth rate of SOI total receipts less deductions and the annual growth
rate of adjusted NIPA profits before tax reflect the adjustments that are made to the SOI data to
prepare NIPA profit before tax estimates. The difference between the annual growth rate of adjusted
NIPA profits before tax and the annual growth rate of NIPA profits before tax reflect the adjustments
to remove capital gains and losses and bad debt expenses. The difference between the annual growth
rate of NIPA profits before tax and NIPA profits after tax reflect the removal of tax liabilities.
The estimates in table 1 indicate that the changing composition of the S&P 500 does not seem
to have much effect on the growth of S&P earnings over a period of two adjoining years. With the
exception of 2000, the annual growth rates of S&P earnings and S&P earnings per share are usually

15
within about 3 to 4 percent of each other. The same is true when comparing the annual growth rates of
S&P operating earnings and S&P operating earnings per share. This result is not surprising in light of
the fact that year-to-year changes in the composition of the S&P 500 usually affects about 10 percent
of the sample.15
The effects of differences in accounting concepts on the growth rates of the various profit and
earnings measures are also apparent from the estimates in table l. Some of these effects can be seen by
comparing the annual growth rates of adjusted NIPA profits before tax with NIPA profits before tax.
The only difference between these two series is that adjusted NIPA profits before tax include capital
gains and bad debt expenses. Two notable differences occur in 1995 and 2001. In 1995, the annual
growth rate of adjusted NIPA profits before tax is 7.6 percentage points higher than that of NIPA
profits before tax; in 2001, the annual growth rate of adjusted NIPA profits before tax is 14.9
percentage points lower than that of NIPA profits before tax. Both of these differences are primarily
the result of large changes in capital gains from the previous year. In particular, capital gains increased
substantially in 1995, while capital gains decreased substantially in 2001. Since both capital gains and
bad debt expenses are included in the reported earnings measures, the observed changes in capital gains
also affect differences between NIPA profit measures and the alternative earnings measures to a similar
degree.
Although it is clear from the table that changes in capital gains influence the differences between
the growth rates of NIPA profits and reported earnings, table 1 also suggests that other factors often
15 For instance, the S&P 500 index reflected 48, 42, and 58 corporate compositional changes in 1998, 1999,
and 2000, respectively.

16
play an important role in determining the differences. This can be seen by observing that the differences
between the annual growth rates of the estimates in the S&P 500 and SOI measure are usually higher
than the differences between in the growth rates of adjusted NIPA profits and NIPA profits. This is
particularly true in more recent years. Since the SOI measures form the base for the NIPA estimates,
many of these differences translate over into differences between the NIPA profit measures and the
reported earnings measures. However, it is unclear whether these differences are only determined by
further accounting differences between the measures without examining the detail of corporations that
are likely to not be well-covered in reported earnings.
Table 2 presents evidence that it is likely that at least some of the relative coverage of
corporations affects the differences between the growth rates of NIPA profits and reported earnings.
This table presents the distribution of the total deficits associated with loss corporations (i.e.,
corporations reporting negative net income on their corporate income tax returns) included in NIPA
profit measures across selected industries. The selected industries are those whose inclusion in reported
earnings estimates is likely to be limited because they are generally not publically-traded. In 1992 there
were $168.8 billion in deficits, of which 12.0 percent was attributable to the selected industries. In
2000, the total deficits had grown to $510.7 billion, and the share of the selected industries had
increased to 38.2 percent. Most of this increase occurs in the business services industry. It is also
worth noting that the growing deficits in these industries is consistent with the notion that differences in
coverage explain some of the lower growth rate of NIPA profits relative to the growth rates of the S&P
reported earnings measures.

17
The effects that growing shares of deficits have on the NIPA profit measures over the period of
1992-2000 are likely mitigated by increases in the amount of business activity associated with chapter S
corporations over the same period. These business entities are included in NIPA profit measures but
not in S&P earnings measures because they cannot offer publically traded stock. Since the income of
chapter S corporation passes through to shareholders who pay a tax on this income, the way to see the
potential effect of the growth of these types of entities on the difference between the growth rates of
NIPA profits and reported earnings is to look at their cash distributions.
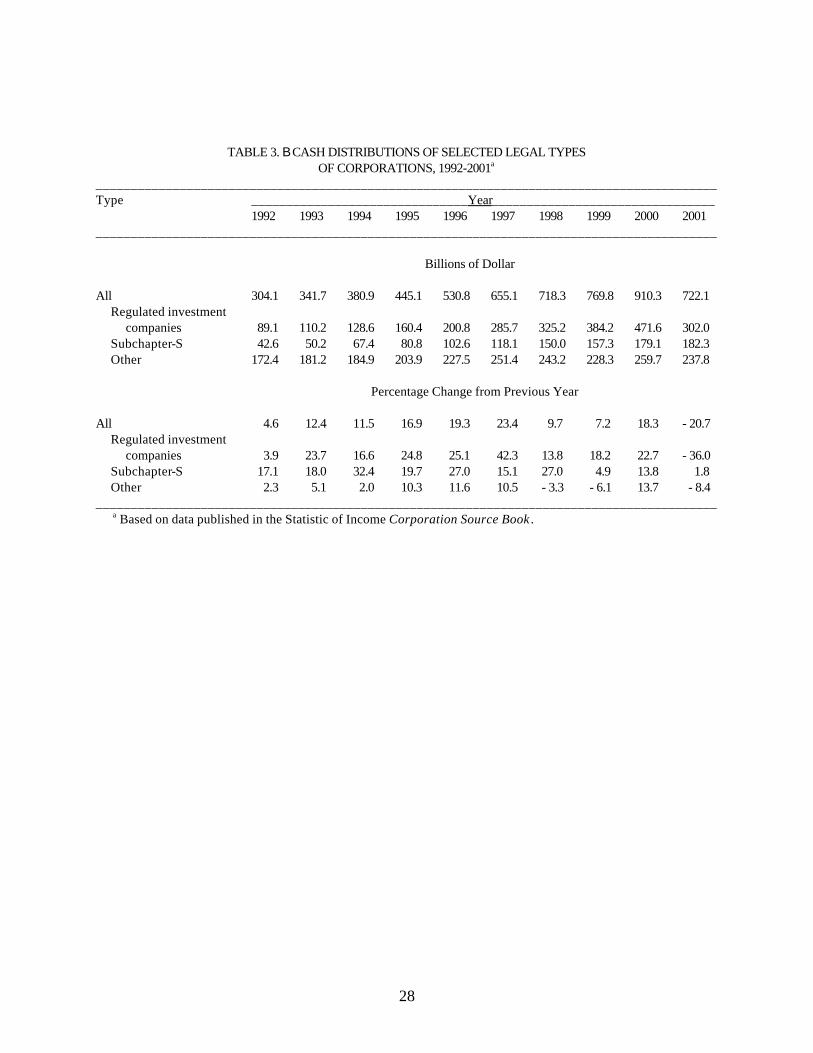
Table 3 presents the change cash distributions from the previous year by legal form of
organization. In order to accurately compare the behavior of Chapter S corporations with most other
types of corporations, the activity of regulated investment companies (that is, mutual funds) should be
taken out of the comparison. Thus, table 3 also presents estimates for all corporations other than
Chapter S corporations and regulated investment companies. As can be seen from the table, the
percentage of cash distributions associated with Chapter S corporations grows much more rapidly than
the other corporations over the entire period of 1992-2001. In fact, the Chapter S corporation growth
rate is 30.4 percent greater than that for other corporations in 1994. The growth in Chapter S activity,
however, is only likely to mitigate some of difference between the growth rates of the NIPA profits and
S&P 500 earnings measures that is created by deficit growth. In 2000, deficits (expenses less income)
associated with loss companies total $409.1 billion, whereas cash distributions (the largest component
of Chapter S income) associated with Chapter S corporations are $179.1 billion.

18
III. Treatment of Stock Options
One of the differences in accounting concepts that is not explicitly discussed in the previous
section is the treatment of employee stock options. The expenses associated with the exercise of non-
qualified employee stock options are included in the NIPA profit estimates, but are typically not
reflected in the expenses provided in financial reports. Since the data in financial reports are used in the
creation of NIPA profits estimates when IRS data are not available, changes in the expenses associated
with the exercise of non-qualified stock options must be incorporated into these estimates through the
use of additional source data.
BEA recently revised the method by which it extrapolates from its tax-accounting measures to
form it profit estimates as part of its 2003 Comprehensive Revision. The new method incorporates
more current information on corporate stock options that is collected from the footnotes provided on
financial reports. This remainder of this section discusses the new methodology and identifies where
continued work needs to focused in order to improve its closely watched quarterly NIPA profits
estimates.
NIPA methodology
NIPA profits include the net gain on the exercise of non-qualified employee stock options as it
is deducted in corporate tax returns filed with the IRS. This net gain is calculated as the market price at
exercise minus the exercise price times the number of shares exercised. When tax data are not

19
available, estimates of NIPA profits are formed in a two step process. The first step uses financial data
from various sources to extrapolate or interpolate tax-based measures to create an initial value of an
estimate. The second step adjusts this value by adding an estimate of the change in the net gain on the
exercise of non-qualified employee stock options offered by S&P 500 corporations between periods.
The adjustment made by BEA is based on a time series for the net value of employee stock
options. This series is created from data reported in the footnotes of the financial reports for a sample
of 97 corporations that appear in the S&P 500. Since these corporations are not required to disclose a
weighted average market price at exercise for all of its options, the weighted average market price on
options granted is used in its place to calculate the net value for each corporation.16 These values are
then summed across a given year are multiplied by a 30 percent expansion factor to form the final series.
This expansion factor is intended to capture the net value of exercised options for corporations in the
S&P 500 that are not covered in BEA=s sample.17 Since corporations do not separately identify the net
value of exercise associated with non-qualified stock options from that of incentive stock options, it is
assumed that the net value associated with the exercise of incentive stock options remains constant
across two adjoining years. If this assumption is correct, then the net value of incentive stock options
16 The weighted average market price on options granted is likely to be close to the weighted average market
price on options at exercise because stock option grants are generally priced at current market rates.
17 The amount included in the adjustment factor to account for limited coverage of the sample is based on an estimate that was created when the net value on the exercise of options for all corporations in the S&P 500 in 2000 were compared to the net value for the corporations in the mo re limited sample in the same year.

20
will not be included to any degree in the extrapolated estimates of NIPA profits.18 Unlike non-qualified
stock options, incentive stock options are taxed as personal capital gains and not currently intended for
inclusion in the definition of NIPA profits.
The estimates of the net gains on the exercise of non-qualified employee stock options are then
used to adjust annual estimates by subtracting the difference in the net gain from the prior year to the
extrapolations performed with financial data.19 Quarterly estimates of NIPA profits between years in
which both annual estimates exist incorporate these adjustments in so far as they are based on
interpolation between adjusted annual estimates. Quarterly estimates of NIPA profits between years in
which an estimate does not exist for the later year are adjusted by a judgmental trend created from
estimates for previous quarters.
Further considerations
A limitation of the methodology employed by BEA is that it does not incorporate quarterly
information on non-qualified stock employee stock options because the disclosure of this information is
not required. Although the lack of this information places limits on future improvements that can be
18 One alternative would be to assume that the percentage of the total net value of exercised employee
stock options associated with incentive stock options remained constant across adjoining years. Although Crimmel and Schildkraut (2002) find that 78 percent of the total stock options received by employees in 1999 were non-qualified stock options, it is unclear whether this percentage is accurate for corporations in the S&P 500 and whether it remains constant over time. Thus, it is also unclear whether this might be a more accurate assumption.
19 For example, this adjustment adds $27.3 billion to NIPA profits in 2002 to reflect an estimated decline in the value of exercised employee stock options since 2001.
21
made to quarterly estimates of NIPA profits, improvements can still be made by increasing the quality of
the annual estimates NIPA profits. This is because the annual estimates form the base from which the
quarterly are extrapolated and interpolated. Even though BEA recently improved it methodology to
produce preliminary estimates of NIPA profits, there are still a number of areas in which these estimates
might be further improved.
There are at two aspects associated with the definition of NIPA profits that might be
improved.20 First, the inclusion of the net gain on the exercise of employee stock options at exercise
might be replaced with an accrual-based estimate of these costs. This would eliminate a conceptual
inconsistency between the NIPA profits measures and more general national income accounting
concepts. This is because the net expense at the time of exercise is usually not related to the costs of
current production that are intended to be measured in national economic accounting. Second, the
expenses associated with incentive employee stock options might be included in the definition of NIPA
profits. The distinction between non-qualified and incentive stock options is related to tax law and not
national income accounting. The inclusion of incentive stock options would be consistent with the notion
that stock options are an economic expense to corporations regardless of whether the form they are
given to employees.
Although improvements in the definition of NIPA profits are desirable, they are primarily limited
by data availability. Even if the costs associated with employee stock options were expensed using an
20 A more detailed discussion of the conceptual issues associated with the inclusion of employee stock
options in the NIPA than that provided in this paper is available in Moylan (2000) which is available at <www.bea.gov/bea/papers/empstop.pdf>.

22
accrual method on financial reports, the availability of these data would be limited to only the subset of
publically-traded firms that are covered by the NIPA profit estimates. In addition, the ultimate
dependence of the NIPA profit measures on the availability of SOI tax data would require separate
reporting of exercised stock options under current tax laws.
Possible improvements to NIPA profits measures that use the current definition are more readily
apparent and under current investigation. The first possibly improvement involves including an
adjustment for the net gain on non-qualified employee stock options exercised for corporations in the
S&P mid cap 400. It is unclear whether the inclusion of these smaller corporations in BEA=s
adjustments would makes a substantial difference until this research is completed. The second possible
improvement involves rotating corporations in and out of the sample over time. It is unclear how
appropriate the adjustment factor that is used to form estimates for the universe of S&P 500
corporations from BEA=s sample is in more recent time periods. In other words, the degree to which
the current sample represents the universe of S&P 500 corporations over time still needs to be
conducted.
IV. Conclusions
The growth rates of NIPA corporate profits often differ substantially from the growth rates of
reported earnings, such as S&P 500 earnings. Despite evidence in the current literature that suggests
that growing differences between financial and taxable income has caused NIPA profits measures to
grow slower than reported earnings measures over the past decade, this paper demonstrates that

23
substantial differences in the growth rates have existed in other years as well. It also presents evidence
that differences between the growth rates of these two sets of measures are the result of both difference
in the accounting concepts and the coverage of corporations used to form each of the measures.
Indeed, part of the relatively low rate of growth in NIPA profits is likely the result of the growth of
deficits in industries that are not as fully represented in the reported earning measures.
The differences between the growth rates of the NIPA profits and reported earning measures
affect the quality of many of the NIPA profit estimates. This is because information from financial
reports is used to extrapolate NIPA profit estimates when tax data is not available. Although the effects
that differences in coverage have on the quality of the NIPA estimates cannot be mitigated, the adverse
effects that differences in the treatment of employee stock options on the quality of quarterly and
preliminary estimates of NIPA profits can be limited. Not only does this paper discuss the recent
methodology adopted by BEA to incorporate more current information on employee stock options, but
it also suggest research that could be used to possibly improve NIPA profit estimates. These
suggestions include investigating the use of a broader and more dynamic sample of corporations in the
calculation of its adjustments for employee stock options.

24
REFERENCES
Crimmel, Beth Levin and Jeffery L. Schildkraut. 2001. AStock Options Surveyed by NCS.@ Compensation and Working Conditions, Spring, 1-15.
Desai, Mihir A. 2002. AThe Divergence Between Book and Tax Income.@ Working Paper, NBER and
Harvard University, Boston, MA, October. Mayerhauser, Nicole, Shelly Smith, and David F. Sullivan. 2003. APreview of the 2003 Comprehensive
Revision of the National Income and Product Accounts: New and Redesigned Tables.@ Survey of Current Business, August, 7-31.
Mills, Lillian, Kaye Newberry, and William B. Trautman. 2002. ATrends in Book-Tax Income and
Balance Sheet Differences.@ memo, University of Arizona, Tucson, AZ, May. Moylan, Carol. 2000. ATreatment of Employee Stock Options in the U.S. National Economic
Accounts.@ Paper presented at the OECD Meeting of National Accounts Experts, Paris, France, September 26-29.
Nordhaus, William D. 2002. AThe American Economy in Recession and Recovery.@ Brookings Paper
on Economic Activity 1: 2002, Spring, 199-220. Plesko, George A. 2002a. ATestimony before the U.S. Senate Finance Committee,@ February 13. _____. 2002b. AReconciling Corporation Book and Tax Net Income, Tax Years 1996-1998.@ SOI
Bulletin, Spring, 111-132. U.S. Department of Commerce. 2002. ACorporate Profits: Profits Before Tax, Profit Tax Liability, and
Dividends: Methodology Paper,@ Washington, D.C., U.S. Government Printing Office, September.

25
CHART 1. – S&P EARNINGS AS A PERCENT OF NIPA PROFITS AFTER TAX
0.30
0.40
0.50
0.60
0.70
0.80
0.90
1.00
1988 1989 1990 1991 1992 1993 1994 1995 1996 1997 1998 1999 2000 2001
Reported earnings Operating earnings

26
TABLE 1. B COMPARISON OF SELECTED MEASURES OF PROFITS, 1992-2001 _________________________________________________________________________________________ Variable _______________________________Year________________________________
1992 1993 1994 1995 1996 1997 1998 1999 2000 2001 _________________________________________________________________________________________
Billions of Dollars NIPA profits before tax 461.1 517.1 577.1 674.3 733.0 798.2 718.3 775.9 773.4 696.8 Less: Bad debt expense 89.6 80.7 67.9 67.8 74.7 83.6 84.6 100.2 107.7 142.0 Plus: Capital gains 70.9 90.8 71.0 115.5 132.9 201.1 201.0 269.4 286.3 160.7 Equals: Adjusted NIPA profits before tax 442.2 527.2 580.2 722.0 791.2 915.7 839.9 945.1 952.0 715.5
Percent Change from Prodceding Year
S&P 500 reported earnings Earnings per share 19.5 14.7 39.8 11.0 14.0 2.6 - 5.1 27.7 3.8 - 50.6 Earnings 22.6 16.8 44.3 13.2 17.0 4.6 - 2.2 32.6 9.0 - 48.5 S&P 500 operating earnings Earnings per share 8.1 28.9 18.0 18.7 7.8 8.3 0.6 16.7 8.6 - 30.8 Earnings 10.9 31.3 21.7 21.2 10.5 10.6 3.7 21.0 14.2 - 27.9 SOI total receipts less deductions 18.0 22.5 15.9 22.7 11.1 13.5 - 7.8 10.9 - 1.2 - 34.8 Adjusted NIPA profits before tax 15.1 19.2 10.1 24.4 9.6 15.7 - 9.0 13.5 0.7 - 24.8 NIPA Profits before tax 9.0 12.1 11.6 16.8 8.7 8.9 - 10.0 8.0 - 0.3 - 9.9 NIPA Profits after tax 9.8 16.5 5.3 18.9 10.1 10.1 - 14.9 10.0 - 1.7 - 2.5 _________________________________________________________________________________________ NIPA National Income and Product Accounts S&P Standard & Poor=s SOI Statistics of Income

27
TABLE 2. B DISTRIBUTION OF THE DEFICITS OF LOSS CORPORATIONS BY SELECTED INDUSTRY, 1992-2001a
_________________________________________________________________________________________ Type _______________________________Year________________________________
1992 1993 1994 1995 1996 1997 1998 1999 2000 2001 _________________________________________________________________________________________
Billions of Dollars Total deficits 168.8 160.5 162.2 166.5 180.3 202.4 252.9 300.3 409.1 510.7
Industry Percentage of Total Selected industries Business services b 4.5 4.5 4.8 5.6 6.6 7.4 10.3 13.8 19.8 14.5 Electrical machinery 3.3 3.9 2.2 2.6 3.8 4.4 4.9 5.1 5.2 8.9 Industrial machinery 2.4 3.3 2.4 1.9 2.3 2.3 3.1 3.2 3.2 3.8 Security and com- modity brokers 0.6 0.7 1.0 1.2 1.1 1.3 3.1 1.9 2.5 2.0 Telephone and com- munication services 1.1 0.9 1.4 1.8 2.8 4.6 6.4 8.0 8.7 9.0 All selected industries 12.0 13.3 11.8 13.0 16.6 20.0 27.8 32.0 39.5 38.2 All other industries 88.0 86.7 88.2 87.0 83.4 80.0 72.2 68.0 60.5 61.8 _________________________________________________________________________________________ a Based on data published in Statistics of Income Corporation Source Book where loss corporations are defined as business entities reporting negative net income on either IRS Form 1120, 1120-L, 1120-PC, 1120-REIT, 1120-RIC, or 1120-S. b Includes SIC 737: Computer Programming, Data Processing, and Other Computer Related Services.
28
TABLE 3. B CASH DISTRIBUTIONS OF SELECTED LEGAL TYPES OF CORPORATIONS, 1992-2001a
_________________________________________________________________________________________ Type _______________________________Year________________________________
1992 1993 1994 1995 1996 1997 1998 1999 2000 2001 _________________________________________________________________________________________
Billions of Dollar All 304.1 341.7 380.9 445.1 530.8 655.1 718.3 769.8 910.3 722.1 Regulated investment companies 89.1 110.2 128.6 160.4 200.8 285.7 325.2 384.2 471.6 302.0 Subchapter-S 42.6 50.2 67.4 80.8 102.6 118.1 150.0 157.3 179.1 182.3 Other 172.4 181.2 184.9 203.9 227.5 251.4 243.2 228.3 259.7 237.8
Percentage Change from Previous Year All 4.6 12.4 11.5 16.9 19.3 23.4 9.7 7.2 18.3 - 20.7 Regulated investment companies 3.9 23.7 16.6 24.8 25.1 42.3 13.8 18.2 22.7 - 36.0 Subchapter-S 17.1 18.0 32.4 19.7 27.0 15.1 27.0 4.9 13.8 1.8 Other 2.3 5.1 2.0 10.3 11.6 10.5 - 3.3 - 6.1 13.7 - 8.4 _________________________________________________________________________________________ a Based on data published in the Statistic of Income Corporation Source Book .