Nigerian Bottling Company-FINAL - Nigeria’s No1 · PDF fileNigerian Bottling Company Plc...
19
0 | Page BC Nigeria Equity Research August 20, 2008 Nigerian Bottling Company Plc Initiation of Coverage Meristem Equity Research Saheed Bashir [email protected] +234-802-4546-575 Oluwakemi Adeneye kemi.ade[email protected] Abiodun Keripe [email protected] Ahmed Razaq [email protected] Kayode Tinuoye [email protected] Correspondence: info@meristemng.com
Transcript of Nigerian Bottling Company-FINAL - Nigeria’s No1 · PDF fileNigerian Bottling Company Plc...

0 | P a g e
BC
Nigeria Equity Research
August 20, 2008
Nigerian Bottling Company Plc
Initiation of Coverage
Meristem Equity Research
Saheed Bashir [email protected] +234-802-4546-575
Oluwakemi Adeneye [email protected]
Abiodun Keripe [email protected]
Ahmed Razaq [email protected]
Kayode Tinuoye [email protected]
Correspondence: [email protected]

1 | P a g e
Industry: Food/Beverages and Tobacco
FYE: December 31
Mkt Cap (N’bn): 64.11 (US$ 556.50m)
Executive Summary………………………………………………
Industry Background…………………………………………
Company Overview……………………………………………
Strategic Update…………………………………………………
Analysis of Financials…………………………………………
Stock Price Trajectory……………………………………………
Valuation Methodologies
Appendix……………………………………………………….………...
Historical Financial Statement…………………………………………
Abridged Financial Model a
Disclosures.……………………………………………………………
Content Highlight
Nigeria Equity Research August 6, 2008
M e r i s t e m R e s e a r c h
Nigeria Equity Research
August 19, 2008
Current Price (N): 49.92 Fair Price
52-Wk H/L (N): 70.00/40.00 Premium/ (Discount):
Volatility (β): 0.48 Upside/ (Downside):
ummary………………………………………………. ……..
round………………………………………….…………
erview………………………………………………………
date………………………………………………….……....
ncials………………………………………….…………
Stock Price Trajectory…………………………………………………....
and Results……………………….……….…
……………………………………………………….………...
l Statement…………………………………………
Financial Model and Forecasts……………………………...
ures.……………………………………………………………...
Highlights
M e r i s t e m R e s e a r c h
Fair Price (N): 65.77
Premium/ (Discount): -14.39%
Upside/ (Downside): 16.81%
2
3
5
6
8
14
15
17-19
17
18
19

2 | P a g e
Industry: Food/Beverages and Tobacco
FYE: December 31
Mkt Cap (N’bn): 64.11 (US$ 556.50m)
Executive Summary
• Nigerian Bottling Company Plc (NBC)
company and a sole franchisee of the
Coca-cola Inc. Spanning over six decades of operation, NBC is
a market leader in the production of non
• A softer than expected macro economic environment has
posed challenges to the manufacturing sector of which NBC, as
an integral part, has to come to grips with to stay ahead of the
pack. Major challenges facing the industry include weak
infrastructural support facilities (especially power), unfair
competition from cheaper imported products and rising cost of
fund among others.
• An analysis of the financial strength of NBC reveals an
above-par performance in 2007. H
retrospect, we observed abysmal operational
results in 2006. This was however reversed in 2007 with 13.91
percent ROE and 201.69 percent growth in PAT.
• Due to the FYE 2006 performance, NBC exhibited a very
risky financial profile, (based on Altman’s Z score). However, it
scaled through the gray areas to a health
2007 with a Z-score above the 4 year average. Q1 2008 results
show, respectively, turnover and PAT growth of 10.2 percent
and 11.7 percent. Our forecasts for FYE 2008
percent and 5.0 percent for turnover and PAT respectively
• In valuing NBC, we employed both the Discounted Cash
Flow (DCF) and relative valuation methodologies. We obtained
N13.57, N12.12 and N23.19 respectively from the Discounted
Dividend Method, Present Value of Growth Opportunities and
Residual Income valuations. Our relative v
of Price to Earnings (P/E), Price to Book Value (PBV) and
Price to Sales (P/S) yielded N55.75, N97.82 and N176.12
respectively.
• Attaching appropriate weights to each of the methodologies,
we arrived at a fair price of N65.77 with a dis
of 14.39 percent and an upside potential of 16.81 percent.
Nigeria Equity Research August 6, 2008
M e r i s t e m R e s e a r c h
Nigeria Equity Research
August 19, 2008
Current Price (N): 49.92 Fair Price
52-Wk H/L (N): 70.00/40.00 Premium/ (Discount):
Volatility (β): 0.48 Upside/ (Downside):
Nigerian Bottling Company Plc (NBC) is an indigenous
and a sole franchisee of the international brand;
Spanning over six decades of operation, NBC is
a market leader in the production of non-alcoholic beverage.
A softer than expected macro economic environment has
posed challenges to the manufacturing sector of which NBC, as
, has to come to grips with to stay ahead of the
pack. Major challenges facing the industry include weak
infrastructural support facilities (especially power), unfair
competition from cheaper imported products and rising cost of
of the financial strength of NBC reveals an
par performance in 2007. However, in a 4-year,
operational performance
reversed in 2007 with 13.91
percent ROE and 201.69 percent growth in PAT.
Due to the FYE 2006 performance, NBC exhibited a very
risky financial profile, (based on Altman’s Z score). However, it
scaled through the gray areas to a healthy financial status in
score above the 4 year average. Q1 2008 results
show, respectively, turnover and PAT growth of 10.2 percent
for FYE 2008 are 13.25
percent and 5.0 percent for turnover and PAT respectively
employed both the Discounted Cash
Flow (DCF) and relative valuation methodologies. We obtained
N13.57, N12.12 and N23.19 respectively from the Discounted
of Growth Opportunities and
Residual Income valuations. Our relative valuation techniques
of Price to Earnings (P/E), Price to Book Value (PBV) and
Price to Sales (P/S) yielded N55.75, N97.82 and N176.12
Attaching appropriate weights to each of the methodologies,
with a discount to valuation
of 14.39 percent and an upside potential of 16.81 percent.
Fig 2: NBC and NSE ASI Relative Trajectories
60
80
100
120
140
1-Aug-07 1-Dec-07
NSE ASI: 52-Wk Ret=
Source: NSE and Meristem
Key Metrics
Per Share data
Trailing EPS
Trailing SPS
BVPS*
Valuation Metrics
Trailing PE (x)
Tariling PS
P/BV (x)
Shares Outstanding (m)
Market Cap (Nb)**
Profitability
Net Profit Margin(%)
ROE (%)
ROA (%)
Earnings Yield %
* as @ last FYE
** Based on August 13 market price
Fig1: Summary of key investment statistics
M e r i s t e m R e s e a r c h
Fair Price (N): 65.77
Premium/ (Discount): -14.39%
Upside/ (Downside): 16.81%
: NBC and NSE ASI Relative Trajectories
07 1-Apr-08 1-Aug-08
Wk Ret=-3.08% NBC:52-Wk Ret=-4.91%
and Meristem Research
NBC Peer Avg
2.51 2.29
53.74 29.06
17.46 7.21
19.49 24.49
0.91 2.94
17.46 9.29
Shares Outstanding (m) 1.31 2.71
64.11 100.73
4.63% 10.54%
13.87% 38.99%
6.59% 16.04%
5.13% 4.85%
** Based on August 13 market price
Fig1: Summary of key investment statistics
3 | P a g e
Industry: Food/Beverages and Tobacco
FYE: December 31
Mkt Cap (N’bn): 64.11 (US$ 556.50m)
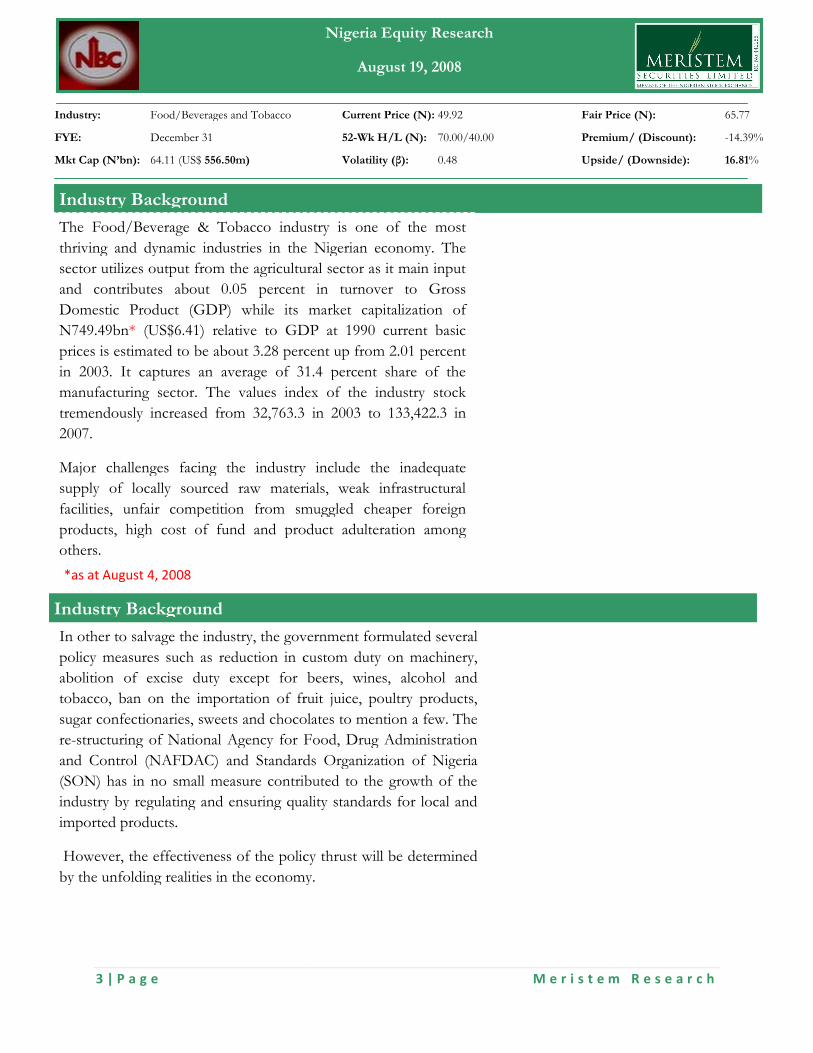
Price, Promotion and Branding
Industry Background
The Food/Beverage & Tobacco industry is one of the most
thriving and dynamic industries in the Nigerian economy. The
sector utilizes output from the agricultural sector as it main input
and contributes about 0.05 percent in turnover to Gross
Domestic Product (GDP) while its market capitalization of
N749.49bn* (US$6.41) relative to GDP at 1990 current basic
prices is estimated to be about 3.28 percent
in 2003. It captures an average of 31.4 percent share of the
manufacturing sector. The values index of the industry stock
tremendously increased from 32,763.3 in 2003 to 133,422.3 in
2007.
Major challenges facing the industry include the inadequate
supply of locally sourced raw materials,
facilities, unfair competition from smuggle
products, high cost of fund and product adulteration among
others.
In other to salvage the industry, the government formulated several
policy measures such as reduction in custom duty on machinery,
abolition of excise duty except for beers, wines, alcohol and
tobacco, ban on the importation of fruit juice, poultry products,
sugar confectionaries, sweets and chocolates to mention a few. The
re-structuring of National Agency for Food, Drug Administration
and Control (NAFDAC) and Standards Organization of Nigeria
(SON) has in no small measure contributed to the growth of the
industry by regulating and ensuring quality standards for local and
imported products.
However, the effectiveness of the policy thrust will be determined
by the unfolding realities in the economy.
Industry Background
*as at August 4, 2008
Nigeria Equity Research August 6, 2008
M e r i s t e m R e s e a r c h
Nigeria Equity Research
August 19, 2008
Current Price (N): 49.92 Fair Price
52-Wk H/L (N): 70.00/40.00 Premium/ (Discount):
Volatility (β): 0.48 Upside/ (Downside):
The Food/Beverage & Tobacco industry is one of the most
thriving and dynamic industries in the Nigerian economy. The
sector utilizes output from the agricultural sector as it main input
out 0.05 percent in turnover to Gross
Domestic Product (GDP) while its market capitalization of
relative to GDP at 1990 current basic
prices is estimated to be about 3.28 percent up from 2.01 percent
31.4 percent share of the
manufacturing sector. The values index of the industry stock
tremendously increased from 32,763.3 in 2003 to 133,422.3 in
Major challenges facing the industry include the inadequate
supply of locally sourced raw materials, weak infrastructural
facilities, unfair competition from smuggled cheaper foreign
high cost of fund and product adulteration among
salvage the industry, the government formulated several
policy measures such as reduction in custom duty on machinery,
abolition of excise duty except for beers, wines, alcohol and
tobacco, ban on the importation of fruit juice, poultry products,
fectionaries, sweets and chocolates to mention a few. The
structuring of National Agency for Food, Drug Administration
and Control (NAFDAC) and Standards Organization of Nigeria
(SON) has in no small measure contributed to the growth of the
regulating and ensuring quality standards for local and
However, the effectiveness of the policy thrust will be determined
by the unfolding realities in the economy.
M e r i s t e m R e s e a r c h
Fair Price (N): 65.77
Premium/ (Discount): -14.39%
Upside/ (Downside): 16.81%
4 | P a g e
Industry: Food/Beverages and Tobacco
FYE: December 31
Mkt Cap (N’bn): 64.11 (US$ 556.50m)
Company Overview
Nigerian Bottling Company, the largest bottler of non
beverage in Nigeria, has its operations dated
November 1951 when it was incorporated as a subsidiary of A.G
Leventis Group and given the franchise to bottle and sell Coca
cola products in Nigeria. In 1972, it became a public company
with its shares listed on the floor of the Exchange.
off as a family business and has metamorphosised into a
soft drinks Company. It is a subsidiary of the Coca
Hellenic Bottling Company (CCHBC), the emerging company in
the merger of Hellenic Bottling Company S.A and CC Beverage
Company Plc in 2000. NBC is capitalized to the tune of
N65.33bn with outstanding shares of N1.31bn and accounts for
8.72 percent of industry market capitalization.
Analysis of shareholdings reveals that CCHBC has a controlling
equity stake of 55.81 percent through Molino Soft Drinks S.A,
Luxembourg and 10.62 percent through CCBC Services Limited,
Ireland while the remaining holdings (33.57 percent)
directors and other shareholders.
From a single manually operated bottling facility with a
production capacity of a few dozen cases per day within
basement of Mainland hotel in Oyingbo, Lagos in 1953, NBC
currently operates 13 bottling plants with over 80 distribution
warehouses, 250,000 sales outlets and a staff strength of over
6,000 employees across the country.
inception has continued to soar above board and has remained
the largest bottler in Nigeria and the second largest in the
African continent commanding average a
billion bottles up from 1.0 million cases in 1960.
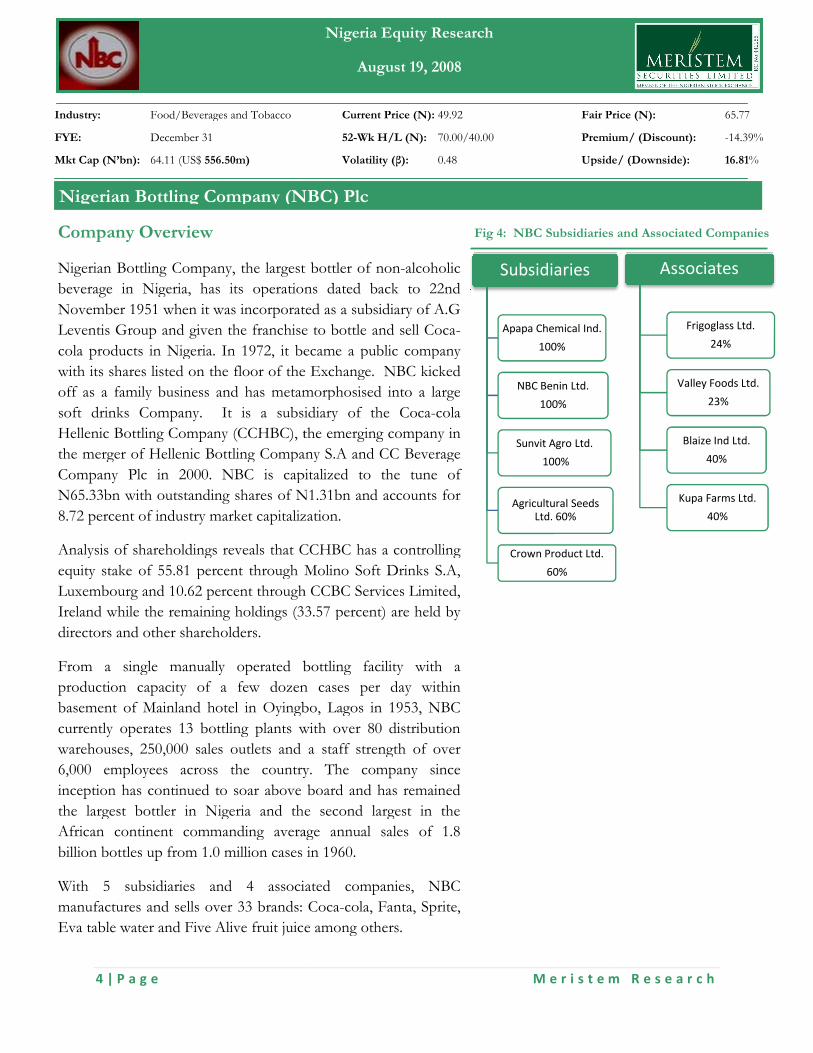
With 5 subsidiaries and 4 associated companies, NBC
manufactures and sells over 33 brands: Coca
Eva table water and Five Alive fruit juice among others.
Nigerian Bottling Company (NBC) Plc
Nigeria Equity Research August 6, 2008
M e r i s t e m R e s e a r c h
Nigeria Equity Research
August 19, 2008
Current Price (N): 49.92 Fair Price
52-Wk H/L (N): 70.00/40.00 Premium/ (Discount):
Volatility (β): 0.48 Upside/ (Downside):
Fig 4: NBC Subsidiaries and Associated Companies
largest bottler of non-alcoholic
Nigeria, has its operations dated back to 22nd
November 1951 when it was incorporated as a subsidiary of A.G
Leventis Group and given the franchise to bottle and sell Coca-
ducts in Nigeria. In 1972, it became a public company
with its shares listed on the floor of the Exchange. NBC kicked
off as a family business and has metamorphosised into a large
. It is a subsidiary of the Coca-cola
Company (CCHBC), the emerging company in
the merger of Hellenic Bottling Company S.A and CC Beverage
NBC is capitalized to the tune of
N65.33bn with outstanding shares of N1.31bn and accounts for
lization.
Analysis of shareholdings reveals that CCHBC has a controlling
equity stake of 55.81 percent through Molino Soft Drinks S.A,
Luxembourg and 10.62 percent through CCBC Services Limited,
(33.57 percent) are held by
From a single manually operated bottling facility with a
production capacity of a few dozen cases per day within
basement of Mainland hotel in Oyingbo, Lagos in 1953, NBC
currently operates 13 bottling plants with over 80 distribution
ales outlets and a staff strength of over
6,000 employees across the country. The company since
inception has continued to soar above board and has remained
the largest bottler in Nigeria and the second largest in the
African continent commanding average annual sales of 1.8
billion bottles up from 1.0 million cases in 1960.
With 5 subsidiaries and 4 associated companies, NBC
manufactures and sells over 33 brands: Coca-cola, Fanta, Sprite,
Eva table water and Five Alive fruit juice among others.
Nigerian Bottling Company (NBC) Plc
Subsidiaries
Apapa Chemical Ind.
100%
NBC Benin Ltd.
100%
Sunvit Agro Ltd.
100%
Agricultural Seeds
Ltd. 60%
Crown Product Ltd.
60%
M e r i s t e m R e s e a r c h
Fair Price (N): 65.77
Premium/ (Discount): -14.39%
Upside/ (Downside): 16.81%
NBC Subsidiaries and Associated Companies
Associates
Frigoglass Ltd.
24%
Valley Foods Ltd.
23%
Blaize Ind Ltd.
40%
Kupa Farms Ltd.
40%
5 | P a g e
Industry: Food/Beverages and Tobacco
FYE: December 31
Mkt Cap (N’bn): 64.11 (US$ 556.50m)
In August 2006, it re-acquired Schweppes franchise which hitherto
bottled Bitter Lemon, Club Soda and Tonic Water under the Krest
brand. NBC has in recent times re-launched and re
of products such as the 50cl PET bottles
additional products- Burn energy drink, can coke,
NBC like many other firms in the manufacturing sector continues to
grapple with challenges of dilapidating basic infrastructure with
particular reference to power and transport (given the brittle nature of
their products).
Strategic Updates
In an environment with low income and high marginal propensity to
consume, soaring food prices have increasingly restricted consumer
discretionary spending and to a large extent re
commodity basket in favour of necessities. This could have an adverse
effect on sales volume. In the light of this, NBC has initiated
processes and products to mitigate attendant threats likely to be posed
in the nearest future ranging from operational to economic
challenges.
In early August 2008, NBC re-launched
Eva water as part of its innovative manageme
maintain market leadership. The company
meet consumer requirement and with tamper proof and greater
resilience to prevent adulteration. In addition, the attractiveness of the
package, the ease of carriage and quality integrity is expected to boost
revenue for the firm.
Among the Company’s recent strategic moves is the product
portfolio expansion to provide quality and wider range of
products to the whole gamut of consumers across the country
while also initiating processes to enhance
working capital management.
Nigeria Equity Research August 6, 2008
M e r i s t e m R e s e a r c h
Nigeria Equity Research
August 19, 2008
Current Price (N): 49.92 Fair Price
52-Wk H/L (N): 70.00/40.00 Premium/ (Discount):
Volatility (β): 0.48 Upside/ (Downside):
acquired Schweppes franchise which hitherto
bottled Bitter Lemon, Club Soda and Tonic Water under the Krest
launched and re-branded a number
of products such as the 50cl PET bottles and also introduced
can coke, etc to the market
NBC like many other firms in the manufacturing sector continues to
with challenges of dilapidating basic infrastructure with
particular reference to power and transport (given the brittle nature of
In an environment with low income and high marginal propensity to
prices have increasingly restricted consumer
discretionary spending and to a large extent re-ordered their choice of
commodity basket in favour of necessities. This could have an adverse
effect on sales volume. In the light of this, NBC has initiated
esses and products to mitigate attendant threats likely to be posed
in the nearest future ranging from operational to economic-wide
launched one of its flagship products,
Eva water as part of its innovative management and decision to
The company re-packaged the product to
meet consumer requirement and with tamper proof and greater
resilience to prevent adulteration. In addition, the attractiveness of the
uality integrity is expected to boost
Among the Company’s recent strategic moves is the product
portfolio expansion to provide quality and wider range of
products to the whole gamut of consumers across the country
to enhance its supply chain and
Nigerian Bottling Company (NBC) Plc
M e r i s t e m R e s e a r c h
Fair Price (N): 65.77
Premium/ (Discount): -14.39%
Upside/ (Downside): 16.81%
Nigerian Bottling Company (NBC) Plc
6 | P a g e
Industry: Food/Beverages and Tobacco
FYE: December 31
Mkt Cap (N’bn): 64.11 (US$ 556.50m)
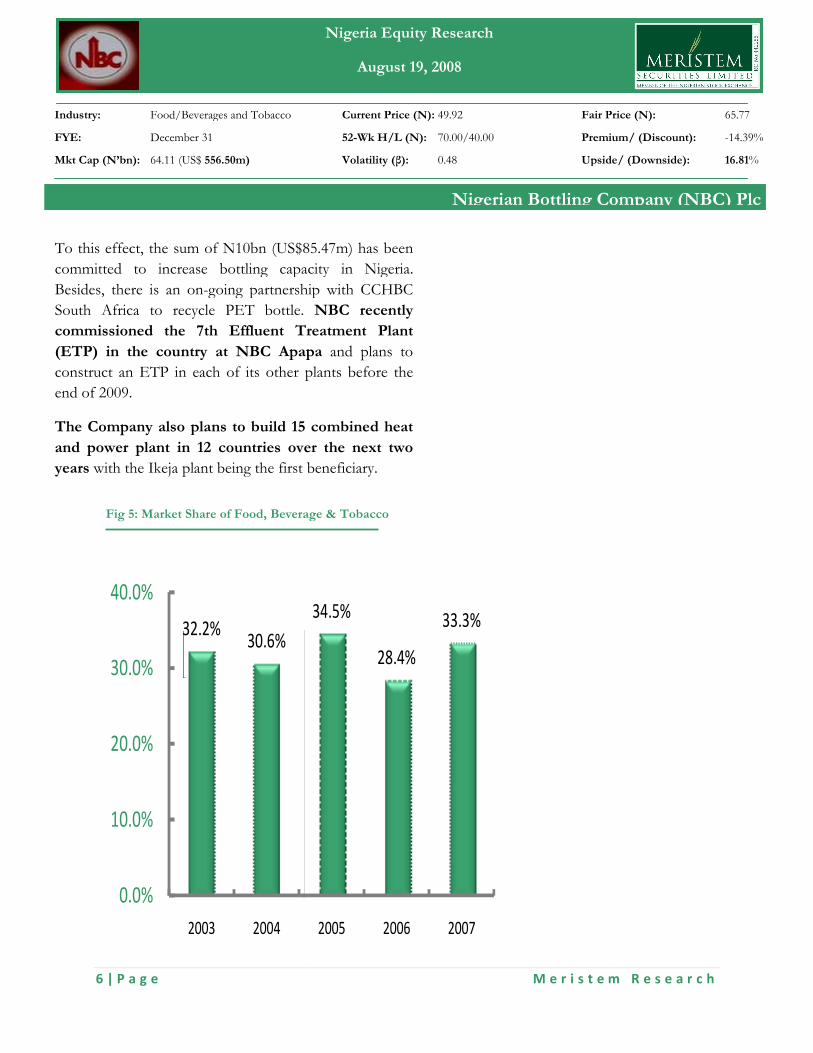
32.2%30.6%
0.0%
10.0%
20.0%
30.0%
40.0%
2003 2004
Fig 5: Market Share of Food, Beverage & Tobacco
To this effect, the sum of N10bn (US$85.47m)
committed to increase bottling capacity in Nigeria.
Besides, there is an on-going partnership with CCHBC
South Africa to recycle PET bottle.
commissioned the 7th Effluent Treatment Plant
(ETP) in the country at NBC Apapa
construct an ETP in each of its other plants before the
end of 2009.
The Company also plans to build 15 combined heat
and power plant in 12 countries over the next two
years with the Ikeja plant being the first beneficiary.
Nigeria Equity Research August 6, 2008
M e r i s t e m R e s e a r c h
Nigeria Equity Research
August 19, 2008
Current Price (N): 49.92 Fair Price
52-Wk H/L (N): 70.00/40.00 Premium/ (Discount):
Volatility (β): 0.48 Upside/ (Downside):
34.5%
28.4%
33.3%
2005 2006 2007
Nigerian Bottling Company (NBC) Plc
Share of Food, Beverage & Tobacco
(US$85.47m) has been
committed to increase bottling capacity in Nigeria.
going partnership with CCHBC
NBC recently
commissioned the 7th Effluent Treatment Plant
(ETP) in the country at NBC Apapa and plans to
construct an ETP in each of its other plants before the
plans to build 15 combined heat
and power plant in 12 countries over the next two
with the Ikeja plant being the first beneficiary.
M e r i s t e m R e s e a r c h
Fair Price (N): 65.77
Premium/ (Discount): -14.39%
Upside/ (Downside): 16.81%
Company (NBC) Plc
7 | P a g e
Industry: Food/Beverages and Tobacco
FYE: December 31
Mkt Cap (N’bn): 64.11 (US$ 556.50m)
DuPont Analysis
The swing in returns over the years has been conditioned by an
amalgam of the operating, investing, financial and tax related
decisions of the firm.
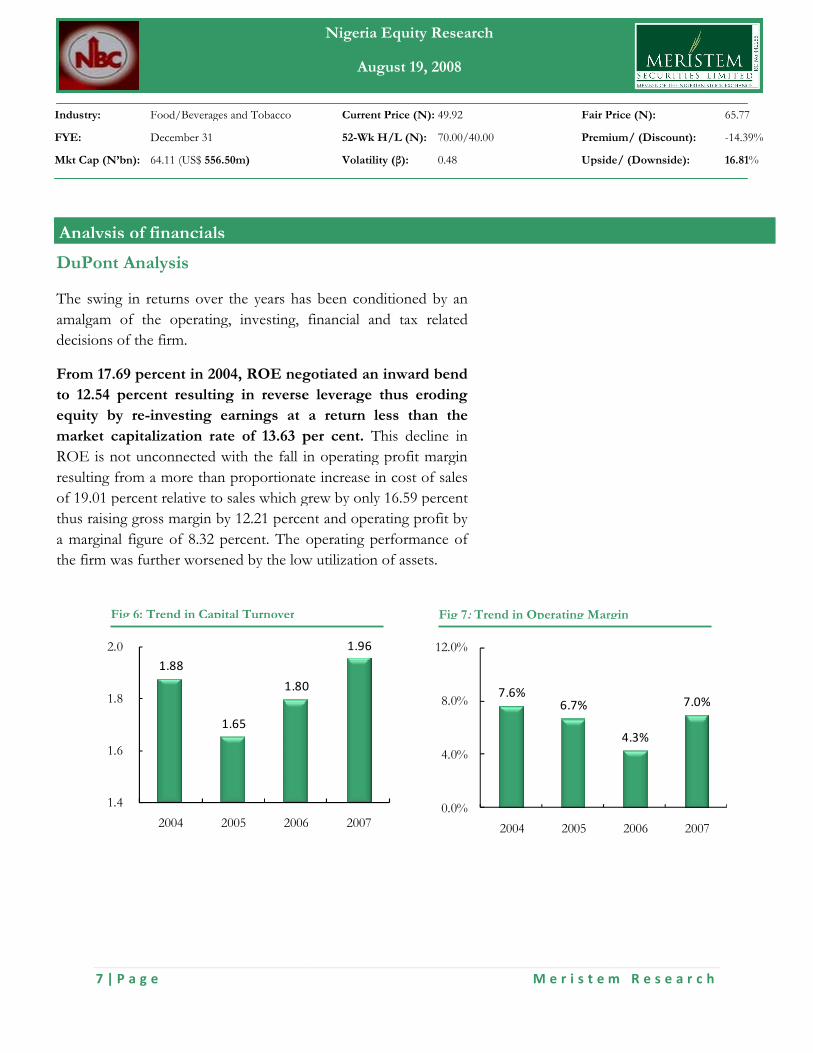
From 17.69 percent in 2004, ROE negotiated an inward bend
to 12.54 percent resulting in reverse leverage thus erodin
equity by re-investing earnings at a return less than the
market capitalization rate of 13.63 per cent.
ROE is not unconnected with the fall in operating profit margin
resulting from a more than proportionate increase in cost of sales
of 19.01 percent relative to sales which grew by only 16.59 percent
thus raising gross margin by 12.21 percent
a marginal figure of 8.32 percent. The operating performance of
the firm was further worsened by the low utilization of asse
Analysis of financials
Fig 6: Trend in Capital Turnover
1.88
1.65
1.80
1.4
1.6
1.8
2.0
2004 2005 2006
Nigeria Equity Research August 6, 2008
M e r i s t e m R e s e a r c h
Nigeria Equity Research
August 19, 2008
Current Price (N): 49.92 Fair Price
52-Wk H/L (N): 70.00/40.00 Premium/ (Discount):
Volatility (β): 0.48 Upside/ (Downside):
in returns over the years has been conditioned by an
amalgam of the operating, investing, financial and tax related
From 17.69 percent in 2004, ROE negotiated an inward bend
to 12.54 percent resulting in reverse leverage thus eroding
investing earnings at a return less than the
market capitalization rate of 13.63 per cent. This decline in
ROE is not unconnected with the fall in operating profit margin
resulting from a more than proportionate increase in cost of sales
19.01 percent relative to sales which grew by only 16.59 percent
percent and operating profit by
of 8.32 percent. The operating performance of
the firm was further worsened by the low utilization of assets.
1.80
1.96
2006 2007
Fig 7: Trend in Operating Margin
7.6%6.7%
0.0%
4.0%
8.0%
12.0%
2004 2005
M e r i s t e m R e s e a r c h
Fair Price (N): 65.77
Premium/ (Discount): -14.39%
Upside/ (Downside): 16.81%
Trend in Operating Margin
4.3%
7.0%
2006 2007
8 | P a g e
Industry: Food/Beverages and Tobacco
FYE: December 31
Mkt Cap (N’bn): 64.11 (US$ 556.50m)
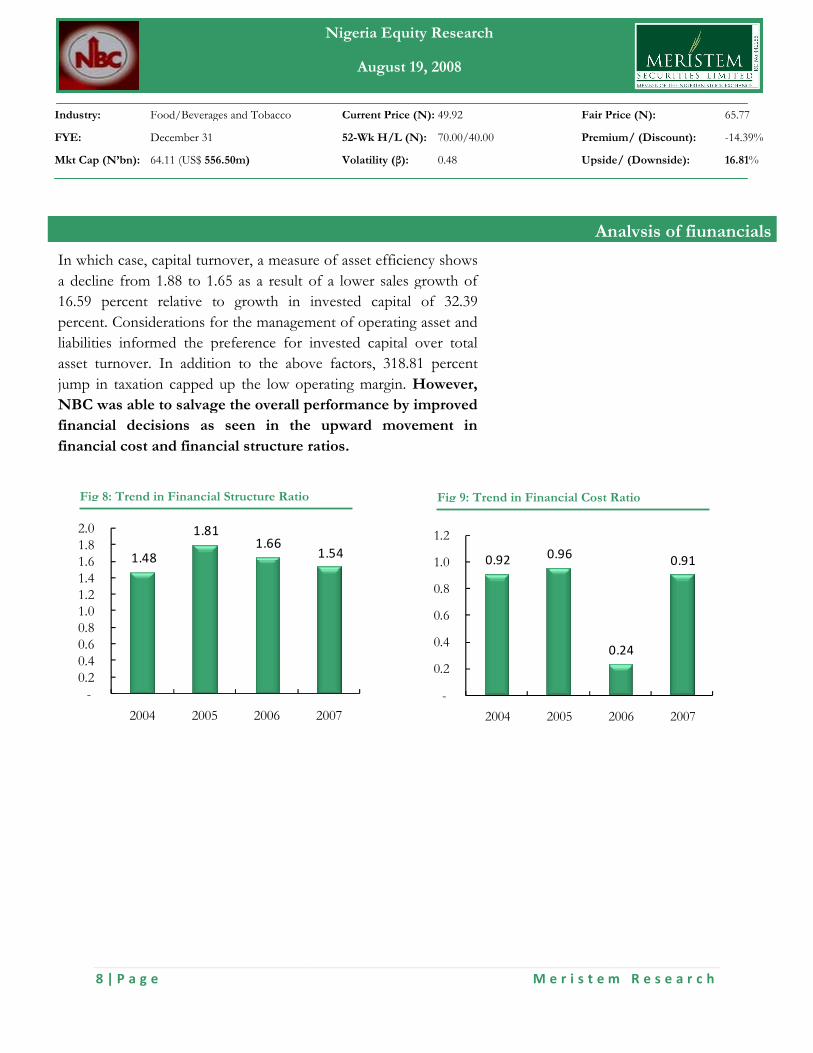
In which case, capital turnover, a measure of asset efficiency shows
a decline from 1.88 to 1.65 as a result of a lower sales growth of
16.59 percent relative to growth in invested capital of 32.39
percent. Considerations for the management of operating asset and
liabilities informed the preference for invested capital over total
asset turnover. In addition to the abo
jump in taxation capped up the low operating margin.
NBC was able to salvage the overall performance by improved
financial decisions as seen in the upward movement in
financial cost and financial structure ratios.
1.48
1.81 1.66
-0.2 0.4 0.6 0.8 1.0 1.2 1.4 1.6 1.8 2.0
2004 2005 2006
Fig 8: Trend in Financial Structure Ratio
Nigeria Equity Research August 6, 2008
M e r i s t e m R e s e a r c h
Nigeria Equity Research
August 19, 2008
Current Price (N): 49.92 Fair Price
52-Wk H/L (N): 70.00/40.00 Premium/ (Discount):
Volatility (β): 0.48 Upside/ (Downside):
Analysis of fiunancials
In which case, capital turnover, a measure of asset efficiency shows
a decline from 1.88 to 1.65 as a result of a lower sales growth of
growth in invested capital of 32.39
. Considerations for the management of operating asset and
liabilities informed the preference for invested capital over total
asset turnover. In addition to the above factors, 318.81 percent
ed up the low operating margin. However,
NBC was able to salvage the overall performance by improved
financial decisions as seen in the upward movement in
financial cost and financial structure ratios.
Fig 9: Trend in Financial Cost Ratio
0.92 0.96
-
0.2
0.4
0.6
0.8
1.0
1.2
2004 2005
1.54
2007
Trend in Financial Structure Ratio
M e r i s t e m R e s e a r c h
Fair Price (N): 65.77
Premium/ (Discount): -14.39%
Upside/ (Downside): 16.81%
Analysis of fiunancials
Trend in Financial Cost Ratio
0.24
0.91
2006 2007
9 | P a g e
Industry: Food/Beverages and Tobacco
FYE: December 31
Mkt Cap (N’bn): 64.11 (US$ 556.50m)
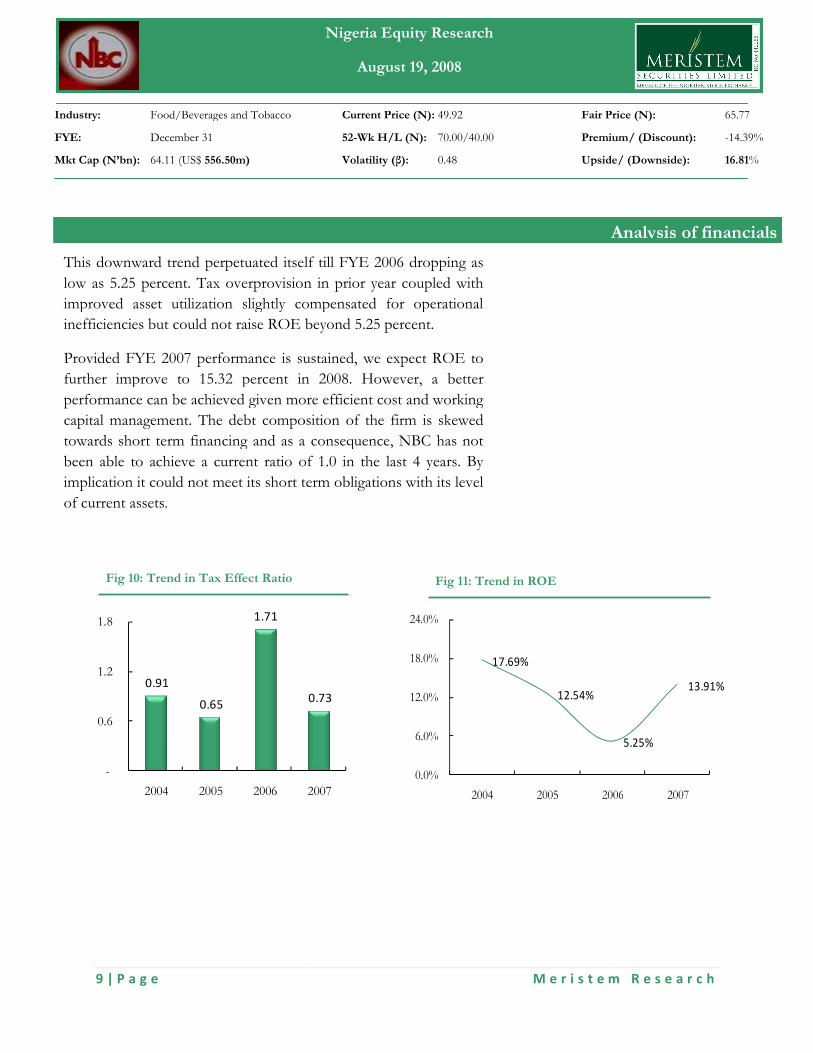
This downward trend perpetuated itself till
low as 5.25 percent. Tax overprovision in prior year coupled with
improved asset utilization slightly compensated for operational
inefficiencies but could not raise ROE bey
Provided FYE 2007 performance is sustained, we expect ROE to
further improve to 15.32 percent in 2008. However, a better
performance can be achieved given more efficient cost and working
capital management. The debt composition of the firm is skewed
towards short term financing and as a consequence, NBC has not
been able to achieve a current ratio of 1.0 in the last 4 years. By
implication it could not meet its short term obligations with its level
of current assets.
0.91
0.65
1.71
-
0.6
1.2
1.8
2004 2005 2006
Fig 10: Trend in Tax Effect Ratio
Nigeria Equity Research August 6, 2008
M e r i s t e m R e s e a r c h
Nigeria Equity Research
August 19, 2008
Current Price (N): 49.92 Fair Price
52-Wk H/L (N): 70.00/40.00 Premium/ (Discount):
Volatility (β): 0.48 Upside/ (Downside):
This downward trend perpetuated itself till FYE 2006 dropping as
low as 5.25 percent. Tax overprovision in prior year coupled with
improved asset utilization slightly compensated for operational
inefficiencies but could not raise ROE beyond 5.25 percent.
performance is sustained, we expect ROE to
further improve to 15.32 percent in 2008. However, a better
e can be achieved given more efficient cost and working
capital management. The debt composition of the firm is skewed
towards short term financing and as a consequence, NBC has not
been able to achieve a current ratio of 1.0 in the last 4 years. By
ation it could not meet its short term obligations with its level
17.69%
12.54%
0.0%
6.0%
12.0%
18.0%
24.0%
2004 2005 2006
Fig 11: Trend in ROE
0.73
2007
M e r i s t e m R e s e a r c h
Fair Price (N): 65.77
Premium/ (Discount): -14.39%
Upside/ (Downside): 16.81%
Analysis of financials
5.25%
13.91%
2006 2007
10 | P a g e
Industry: Food/Beverages and Tobacco
FYE: December 31
Mkt Cap (N’bn): 64.11 (US$ 556.50m)
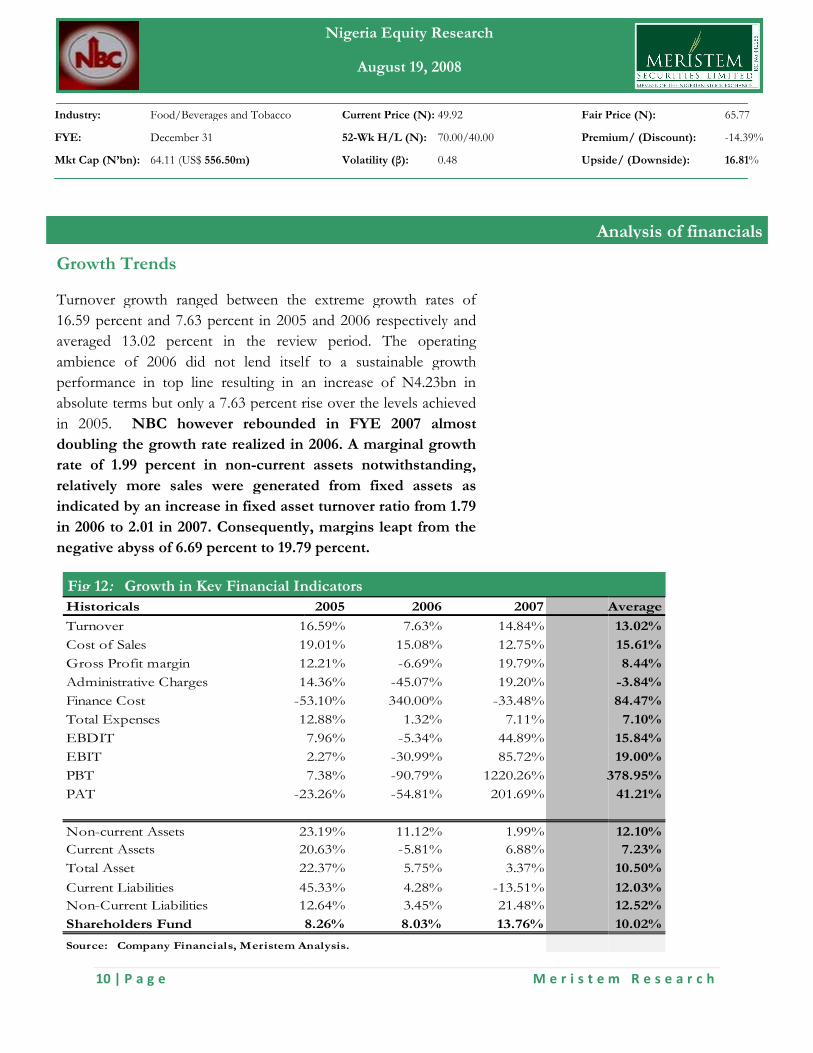
Growth Trends
Turnover growth ranged between the extreme growth rates of
16.59 percent and 7.63 percent in 2005 and 2006 respectively
averaged 13.02 percent in the review period. The operating
ambience of 2006 did not lend itself to a sustainable growth
performance in top line resulting in an
absolute terms but only a 7.63 percent rise over the levels achieved
in 2005. NBC however rebounded in FYE
doubling the growth rate realized in 2006. A marginal growth
rate of 1.99 percent in non-current assets notwithstanding,
relatively more sales were generated from fixed assets as
indicated by an increase in fixed asset turnover ratio from 1.79
in 2006 to 2.01 in 2007. Consequently, margins leapt from the
negative abyss of 6.69 percent to 19.79 percent.
Fig 12: Growth in Key Financial Indicators
Historicals
Turnover 16.59%
Cost of Sales 19.01%
Gross Profit margin 12.21%
Administrative Charges 14.36%
Finance Cost -53.10%
Total Expenses 12.88%
EBDIT
EBIT
PBT
PAT -23.26%
Non-current Assets 23.19%
Current Assets 20.63%
Total Asset 22.37%
Current Liabilities 45.33%
Non-Current Liabilities 12.64%
Shareholders Fund
Source: Company Financials, Meristem Analysis.
Nigeria Equity Research August 6, 2008
M e r i s t e m R e s e a r c h
Nigeria Equity Research
August 19, 2008
Current Price (N): 49.92 Fair Price
52-Wk H/L (N): 70.00/40.00 Premium/ (Discount):
Volatility (β): 0.48 Upside/ (Downside):
Analysis of financial
Turnover growth ranged between the extreme growth rates of
in 2005 and 2006 respectively and
averaged 13.02 percent in the review period. The operating
ambience of 2006 did not lend itself to a sustainable growth
performance in top line resulting in an increase of N4.23bn in
absolute terms but only a 7.63 percent rise over the levels achieved
NBC however rebounded in FYE 2007 almost
doubling the growth rate realized in 2006. A marginal growth
current assets notwithstanding,
relatively more sales were generated from fixed assets as
n fixed asset turnover ratio from 1.79
in 2006 to 2.01 in 2007. Consequently, margins leapt from the
negative abyss of 6.69 percent to 19.79 percent.
Growth in Key Financial Indicators
2005 2006 2007 Average
16.59% 7.63% 14.84%
19.01% 15.08% 12.75%
12.21% -6.69% 19.79%
14.36% -45.07% 19.20%
-53.10% 340.00% -33.48%
12.88% 1.32% 7.11%
7.96% -5.34% 44.89%
2.27% -30.99% 85.72%
7.38% -90.79% 1220.26% 378.95%
-23.26% -54.81% 201.69%
23.19% 11.12% 1.99%
20.63% -5.81% 6.88%
22.37% 5.75% 3.37%
45.33% 4.28% -13.51%
12.64% 3.45% 21.48%
8.26% 8.03% 13.76%
Source: Company Financials, Meristem Analysis.
M e r i s t e m R e s e a r c h
Fair Price (N): 65.77
Premium/ (Discount): -14.39%
Upside/ (Downside): 16.81%
Analysis of financials
Average
13.02%
15.61%
8.44%
-3.84%
84.47%
7.10%
15.84%
19.00%
378.95%
41.21%
12.10%
7.23%
10.50%
12.03%
12.52%
10.02%

11 | P a g e
Industry: Food/Beverages and Tobacco
FYE: December 31
Mkt Cap (N’bn): 64.11 (US$ 556.50m)
The expenses profile of the company improved in 2006 grew
slightly by 1.32 percent despite a 340 per cent increase in finance
charges. Operational efficiencies in administration
the associated expenses by 45.07 percent. Efficient asset utilization
and cost management translated into 85.72 per cent growth in
EBIT.
Nevertheless, this improvement could not birth a positive growth
in PBT as a result of the negative impact
overprovision in the prior year could only assuage negative earnings
as PAT growth rate could have been worse than
recorded in 2006. However, there was a phenomenal rebound
translating to 1,220.26 percent and 201.69 per
and PAT respectively in 2007.
Total assets have grown at an average of 10.50 percent over the
past 4 years. Both current and non-current liabilities grew at an
average of about 12 percent over the years. Current assets which in
absolute terms fell short of current liabilities was not able to meet
up with the pace of the latter save for 2007. Indeed, 2007 witnessed
a remarkable performance in most financial metrics as NBC was
able to improve on operations, finances and investments.
On the average, NBC performed comparatively fair relative to
the industry. With regards to its most recent results it
outperformed the industry in major indices with earning
yields of 5.04 percent, a P/E lower than half
average and sales per share of 53.74 relative to an industry
average of 44.31. As an income stock, NBC has consistently paid
dividend at an average payout of 38.43 percent over the past 10
years save for 2000.
Nigeria Equity Research August 6, 2008
M e r i s t e m R e s e a r c h
Nigeria Equity Research
August 19, 2008
Current Price (N): 49.92 Fair Price
52-Wk H/L (N): 70.00/40.00 Premium/ (Discount):
Volatility (β): 0.48 Upside/ (Downside):
The expenses profile of the company improved in 2006 grew
slightly by 1.32 percent despite a 340 per cent increase in finance
charges. Operational efficiencies in administration brought down
the associated expenses by 45.07 percent. Efficient asset utilization
and cost management translated into 85.72 per cent growth in
Nevertheless, this improvement could not birth a positive growth
in PBT as a result of the negative impact of gross margin. Tax
overprovision in the prior year could only assuage negative earnings
as PAT growth rate could have been worse than –54.81 percent
recorded in 2006. However, there was a phenomenal rebound
translating to 1,220.26 percent and 201.69 percent growths in PBT
Total assets have grown at an average of 10.50 percent over the
current liabilities grew at an
average of about 12 percent over the years. Current assets which in
terms fell short of current liabilities was not able to meet
2007. Indeed, 2007 witnessed
a remarkable performance in most financial metrics as NBC was
able to improve on operations, finances and investments.
average, NBC performed comparatively fair relative to
the industry. With regards to its most recent results it
outperformed the industry in major indices with earning
lower than half the industry
of 53.74 relative to an industry
As an income stock, NBC has consistently paid
dividend at an average payout of 38.43 percent over the past 10
Analysis of financials
M e r i s t e m R e s e a r c h
Fair Price (N): 65.77
Premium/ (Discount): -14.39%
Upside/ (Downside): 16.81%
Analysis of financials

12 | P a g e
Industry: Food/Beverages and Tobacco
FYE: December 31
Mkt Cap (N’bn): 64.11 (US$ 556.50m)
Solvency and Debt Management
The risk profile of NBC reveals that it has dotted the regions of
financial health, caution and ‘bankruptcy possibilities’ over the
review period. A careful analysis of events unfold that a low
current ratio of 0.67 in 2006, (unfavorable working capital
condition), a high proportion of short term fund relative to
long term debt in funding operations and plummeting EBIT
accounted for the shift in credit worthiness of the firm into the
bankruptcy region in 2006.
This is further supported by a decline in int
25.85 to 4.05 in the same year. However, the downward trend was
partly offset by an increased return on equity relative to asset; by
implication a higher financial leverage index. The unimpressive
performance recorded in 2006 took its toll on the share price with a
year return of –43.39 percent. The strategic positioning of NBC
in 2007 brought it back to a level surpassing the 2005
performance.
0.00
1.50
3.00
4.50
2004 2005 2006
Z score
Fig 13: NBC’s Key Risk Metrics and ChartKey Ratio 2004
Long term debt ratio 0.16
Short term debt ratio 0.36
Debt/Equity 1.10
Finnancial Leverage Index 2.10
Current Ratio 0.89
Interest Coverage 11.85Z score 3.95
Nigeria Equity Research August 6, 2008
M e r i s t e m R e s e a r c h
Nigeria Equity Research
August 19, 2008
Current Price (N): 49.92 Fair Price
52-Wk H/L (N): 70.00/40.00 Premium/ (Discount):
Volatility (β): 0.48 Upside/ (Downside):
Analysis of financials
Solvency and Debt Management
The risk profile of NBC reveals that it has dotted the regions of
financial health, caution and ‘bankruptcy possibilities’ over the
A careful analysis of events unfold that a low
(unfavorable working capital
ondition), a high proportion of short term fund relative to
long term debt in funding operations and plummeting EBIT
accounted for the shift in credit worthiness of the firm into the
This is further supported by a decline in interest coverage from
25.85 to 4.05 in the same year. However, the downward trend was
partly offset by an increased return on equity relative to asset; by
implication a higher financial leverage index. The unimpressive
toll on the share price with a
The strategic positioning of NBC
in 2007 brought it back to a level surpassing the 2005
2007
Bankruptcypossibilities(within 2 yrs)
High probability of financial embarrassment
Healthy
Gray Area
and Chart 2005 2006 2007 Anual Avrg.
0.15 0.15 0.17 0.16
0.43 0.42 0.35 0.39
1.37 1.32 1.11 1.22
2.37 2.32 2.11 2.22
0.74 0.67 0.83 0.78
25.85 4.05 11.32 13.27
3.46 2.41 3.51 3.33
M e r i s t e m R e s e a r c h
Fair Price (N): 65.77
Premium/ (Discount): -14.39%
Upside/ (Downside): 16.81%
Analysis of financials

13 | P a g e
Industry: Food/Beverages and Tobacco
FYE: December 31
Mkt Cap (N’bn): 64.11 (US$ 556.50m)
Stock Price Trajectory
NBC stock price has demonstrated pendulum swings in the past 4 years
undulating between successive highs and lows.
reference of a year, price movement has been gravitating upwards
with the RSI within band for most months
volumes traded in late July 2007, NBC price continued to soar high
reaching N57.75 before trending downwar
During this period the RSI fell in the overbought region but
continued to decline until it came within band and was sustained
till late June 2008 before momentarily nose
region. However, this time around it was characterized by moderate
volumes but with falling prices. NBC stock price trailed an upward path
from August 2007 to reach its all-time high of N70.00 on March 3rd,
2008. It thereafter exhibited a step-movement to stabilize at N49.92 with
an RSI of 29.03.
0
25
50
75
100
2-Jul-07 2-Oct-07 2-Jan
RSIOverbought
Fig 14: 12-Month Price-Volume and RSI Charts
0
20
40
60
80
2-Jul-07 2-Nov-07
Volume
Nigeria Equity Research August 6, 2008
M e r i s t e m R e s e a r c h
Nigeria Equity Research
August 19, 2008
Current Price (N): 49.92 Fair Price
52-Wk H/L (N): 70.00/40.00 Premium/ (Discount):
Volatility (β): 0.48 Upside/ (Downside):
NBC stock price has demonstrated pendulum swings in the past 4 years
undulating between successive highs and lows. However, within a time
reference of a year, price movement has been gravitating upwards
with the RSI within band for most months. With unusually high
volumes traded in late July 2007, NBC price continued to soar high
reaching N57.75 before trending downwards to N44.00 in early August.
During this period the RSI fell in the overbought region but
continued to decline until it came within band and was sustained
till late June 2008 before momentarily nose-diving into the oversold
nd it was characterized by moderate
volumes but with falling prices. NBC stock price trailed an upward path
time high of N70.00 on March 3rd,
movement to stabilize at N49.92 with
Jan-08 2-Apr-08 2-Jul-08
Oversold
RSI(14)= 29.03
Volume and RSI Charts
0
2,000,000
4,000,000
6,000,000
8,000,000
10,000,000
12,000,000
14,000,000
2-Mar-08 2-Jul-08
Volume Price
M e r i s t e m R e s e a r c h
Fair Price (N): 65.77
Premium/ (Discount): -14.39%
Upside/ (Downside): 16.81%
14 | P a g e
Industry: Food/Beverages and Tobacco
FYE: December 31
Mkt Cap (N’bn): 64.11 (US$ 556.50m)
A combination of Discounted Cash flow methodology and
relative valuations were adopted in valuing NBC. The former
was utilized to determine the intrinsic worth of the firm while
the later gives a valuation methodology based on its competitive
stance in the industry. In using the discounted cash flows, we
employed the 2-stage Dividend Discount Method (DDM),
Present Value of Growth Opportunities (PVGO) and the
Residual Income Model (RI). Due to high investment in fixed
capital, NBC has not been able to generate a positive free cash
flow informing the exclusion of Free Cash Flow to Equity
(FCFE) based valuation in determining NBC’s fair
We used a risk free rate of 10.75 percent based on the current
rate on 10-year Federal Government of Nigeria (FGN) bond.
Other input variables include a risk premium of 6 percent and
2-year beta of 0.48 resulting in a market capitalization rate or
cost of equity of 13.63 percent.
The intrinsic share price of NBC based on the DDM, assuming
a terminal growth rate of 7.60 percent, was estimated at N
The PVGO, assuming a growth rate based on the return on
equity of 12.68 percent and retention rate
in a negative franchise factor of 0.55 but a positive growth
factor of 1.32 culminating in a projected share price of N12.1
Similarly, we derive a price of N26.87
valuation methodology taking into consideration n
items and violations of clean surplus accounting.
A sensitivity analysis of the discounted cash flow
methodologies reveals a maximum price of N
growth rate of 12 percent based on DDM and a minimum
value of N15.46 at 5 percent growth
DDM as well.
Valuation Methodologies and Summary
Nigeria Equity Research August 6, 2008
M e r i s t e m R e s e a r c h
Nigeria Equity Research
August 19, 2008
Current Price (N): 49.92 Fair Price
52-Wk H/L (N): 70.00/40.00 Premium/ (Discount):
Volatility (β): 0.48 Upside/ (Downside):
A combination of Discounted Cash flow methodology and
relative valuations were adopted in valuing NBC. The former
determine the intrinsic worth of the firm while
the later gives a valuation methodology based on its competitive
stance in the industry. In using the discounted cash flows, we
stage Dividend Discount Method (DDM),
ortunities (PVGO) and the
Residual Income Model (RI). Due to high investment in fixed
capital, NBC has not been able to generate a positive free cash
flow informing the exclusion of Free Cash Flow to Equity
(FCFE) based valuation in determining NBC’s fair value.
We used a risk free rate of 10.75 percent based on the current
year Federal Government of Nigeria (FGN) bond.
Other input variables include a risk premium of 6 percent and
year beta of 0.48 resulting in a market capitalization rate or
The intrinsic share price of NBC based on the DDM, assuming
a terminal growth rate of 7.60 percent, was estimated at N20.23.
The PVGO, assuming a growth rate based on the return on
equity of 12.68 percent and retention rate of 61 percent resulted
in a negative franchise factor of 0.55 but a positive growth
in a projected share price of N12.12.
6.87 from the Residual
valuation methodology taking into consideration non-recurring
items and violations of clean surplus accounting.
A sensitivity analysis of the discounted cash flow
methodologies reveals a maximum price of N62.92 at a
growth rate of 12 percent based on DDM and a minimum
at 5 percent growth rate derived from the
Valuation Methodologies and Summary
M e r i s t e m R e s e a r c h
Fair Price (N): 65.77
Premium/ (Discount): -14.39%
Upside/ (Downside): 16.81%
15 | P a g e
Industry: Food/Beverages and Tobacco
FYE: December 31
Mkt Cap (N’bn): 64.11 (US$ 556.50m)
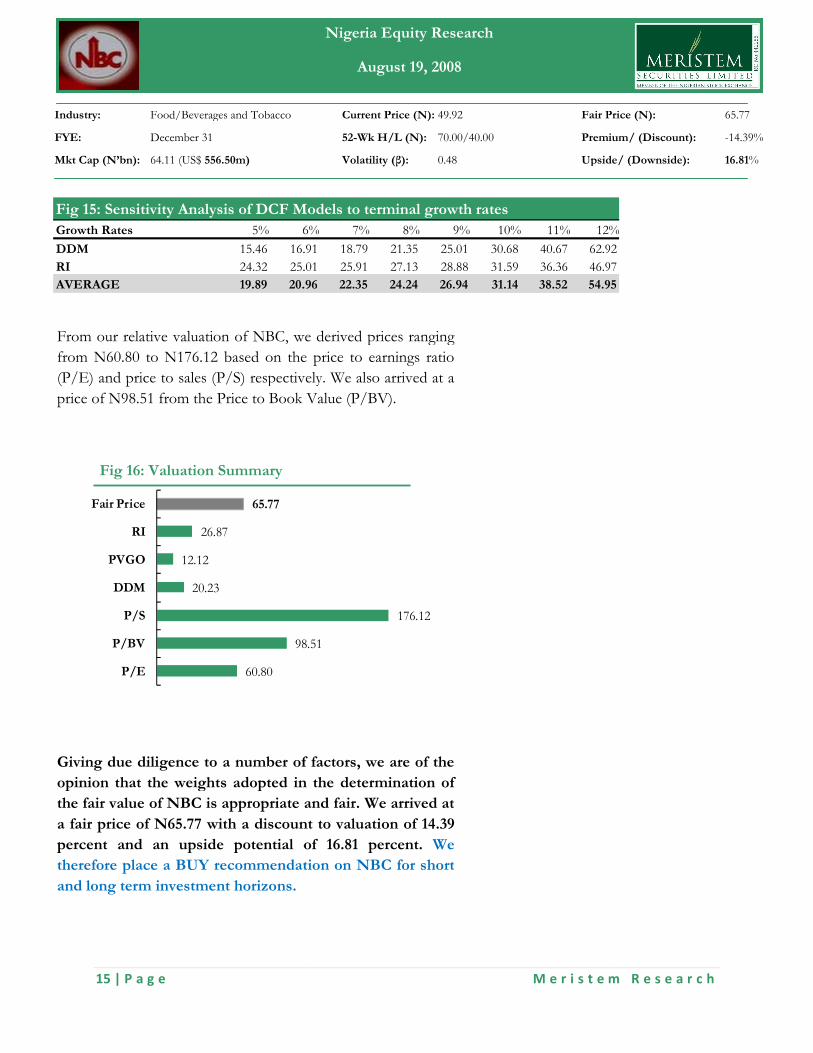
From our relative valuation of NBC, we derived prices ranging
from N60.80 to N176.12 based on the price to earnings ratio
(P/E) and price to sales (P/S) respectively. We
price of N98.51 from the Price to Book Value (P/BV).
Giving due diligence to a number of factors, we are of the
opinion that the weights adopted in the determination of
the fair value of NBC is appropriate and fair. We arrived at
a fair price of N65.77 with a discount to valuation of 14.39
percent and an upside potential of 16.81 percent.
therefore place a BUY recommendation on NBC for short
and long term investment horizons.
60.80
98.51
20.23
12.12
26.87
65.77
P/E
P/BV
P/S
DDM
PVGO
RI
Fair Price
Fig 16: Valuation Summary
Fig 15: Sensitivity Analysis of DCF Models to terminal growth rates
Growth Rates 5% 6%
DDM 15.46 16.91 RI 24.32 25.01 AVERAGE 19.89 20.96
Nigeria Equity Research August 6, 2008
M e r i s t e m R e s e a r c h
Nigeria Equity Research
August 19, 2008
Current Price (N): 49.92 Fair Price
52-Wk H/L (N): 70.00/40.00 Premium/ (Discount):
Volatility (β): 0.48 Upside/ (Downside):
From our relative valuation of NBC, we derived prices ranging
to N176.12 based on the price to earnings ratio
ales (P/S) respectively. We also arrived at a
he Price to Book Value (P/BV).
Giving due diligence to a number of factors, we are of the
opinion that the weights adopted in the determination of
the fair value of NBC is appropriate and fair. We arrived at
with a discount to valuation of 14.39
percent and an upside potential of 16.81 percent. We
therefore place a BUY recommendation on NBC for short
98.51
176.12
: Sensitivity Analysis of DCF Models to terminal growth rates
6% 7% 8% 9% 10% 11% 12%
16.91 18.79 21.35 25.01 30.68 40.67 62.92 25.01 25.91 27.13 28.88 31.59 36.36 46.97 20.96 22.35 24.24 26.94 31.14 38.52 54.95
M e r i s t e m R e s e a r c h
Fair Price (N): 65.77
Premium/ (Discount): -14.39%
Upside/ (Downside): 16.81%
12%
62.92
46.97
54.95

16 | P a g e
Industry: Food/Beverages and Tobacco
FYE: December 31
Mkt Cap (N’bn): 64.11 (US$ 556.50m)
Historical Financial Summary
Turnover
Cost of Sales
Gross Profit
Other operating incomes
Share of profit from associated companies
Expenses
Administrative(Actual)
Administrative(adjusted)
Selling and distribution
Operating Profit
Finance Charges
Total expenses
Total expenses(Actual)
EBDIT
Depreciation
EBIT
Interest
Profit before taxation and exceptional items
Exceptional Items
PBT
Taxation
PAT before Extra-Ordinary items
Extra-ordinary items
PAT
Earnings Per Share
Dividend Per Share
Appendix I
Source: Company Financials, Meristem Research
Nigeria Equity Research August 6, 2008
M e r i s t e m R e s e a r c h
Nigeria Equity Research
August 19, 2008
Current Price (N): 49.92 Fair Price
52-Wk H/L (N): 70.00/40.00 Premium/ (Discount):
Volatility (β): 0.48 Upside/ (Downside):
2004 2005 2006
47,553,874 55,444,504 59,674,516
30,638,654 36,464,205 41,963,985
16,915,220 18,980,299 17,710,531
175,758 75,247 41,729
202,880 282,825 151,233
17,293,858 19,338,371 17,903,493
5,052,354 5,778,049 3,173,637
2,353,787 2,657,661 (734,514)
8,604,025 9,840,136 12,162,588
3,434,599 3,437,361 2,416,035
306,885 143,929 633,286
10,957,812 12,497,797 11,428,074
13,963,264 15,762,114 15,969,511
6,336,046 6,840,574 6,475,419
2,698,567 3,120,388 3,908,151
3,637,479 3,720,186 2,567,268
306,885 143,929 633,286
Profit before taxation and exceptional items 3,330,594 3,576,257 1,933,982
- - (1,604,741)
3,330,594 3,576,257 329,241
298,272 1,249,197 (437,007)
3,032,322 2,327,060 766,248
- - 285,248
3,032,322 2,327,060 1,051,496
2.33 1.78 0.80
1.20 0.60 0.30 Source: Company Financials, Meristem Research.
M e r i s t e m R e s e a r c h
Fair Price (N): 65.77
Premium/ (Discount): -14.39%
Upside/ (Downside): 16.81%
2007 Average
68,529,128 57,800,506
47,313,777 39,095,155
21,215,351 18,705,350
76,719 92,363
159,737 199,169
21,451,807 18,996,882
3,782,905 4,446,736
(831,492) 861,361
12,900,844 10,876,898
4,608,321 3,474,079
421,232 376,333
12,069,352 11,738,259
17,104,981 15,699,968
9,382,455 7,258,624
4,614,397 3,585,376
4,768,058 3,673,248
421,232 376,333
4,346,826 3,296,915
- (401,185)
4,346,826 2,895,730
1,174,562 571,256
3,172,264 2,324,474
- 71,312
3,172,264 2,395,786
2.42 1.83
0.75 0.71
17 | P a g e
Industry: Food/Beverages and Tobacco
FYE: December 31
Mkt Cap (N’bn): 64.11 (US$ 556.50m)
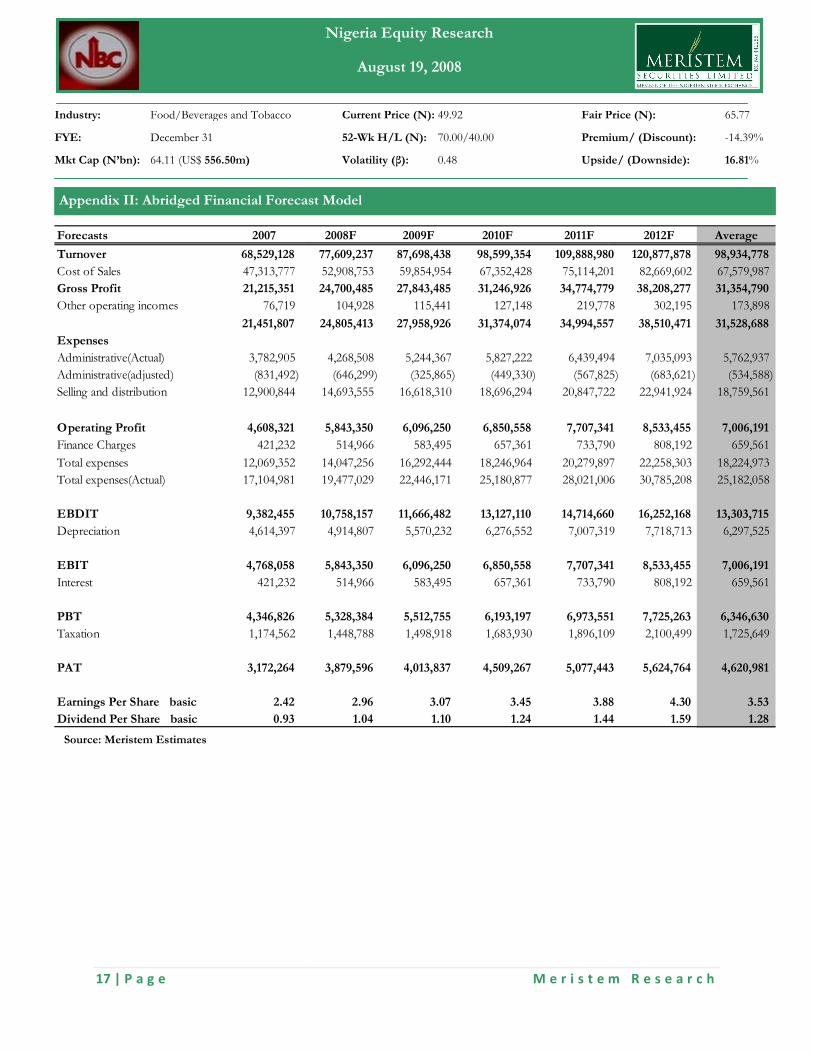
Appendix II: Abridged Financial Forecast Model
Forecasts 2007
Turnover 68,529,128
Cost of Sales 47,313,777
Gross Profit 21,215,351
Other operating incomes 76,719
21,451,807
Expenses
Administrative(Actual) 3,782,905
Administrative(adjusted) (831,492)
Selling and distribution 12,900,844
Operating Profit 4,608,321
Finance Charges 421,232
Total expenses 12,069,352
Total expenses(Actual) 17,104,981
EBDIT 9,382,455
Depreciation 4,614,397
EBIT 4,768,058
Interest 421,232
PBT 4,346,826
Taxation 1,174,562
PAT 3,172,264
Earnings Per Share basic 2.42
Dividend Per Share basic 0.93
Source: Meristem Estimates
Nigeria Equity Research August 6, 2008
M e r i s t e m R e s e a r c h
Nigeria Equity Research
August 19, 2008
Current Price (N): 49.92 Fair Price
52-Wk H/L (N): 70.00/40.00 Premium/ (Discount):
Volatility (β): 0.48 Upside/ (Downside):
: Abridged Financial Forecast Model
2008F 2009F 2010F 2011F
77,609,237 87,698,438 98,599,354 109,888,980
52,908,753 59,854,954 67,352,428 75,114,201
24,700,485 27,843,485 31,246,926 34,774,779
104,928 115,441 127,148 219,778
24,805,413 27,958,926 31,374,074 34,994,557
4,268,508 5,244,367 5,827,222 6,439,494
(646,299) (325,865) (449,330) (567,825)
14,693,555 16,618,310 18,696,294 20,847,722
5,843,350 6,096,250 6,850,558 7,707,341
514,966 583,495 657,361 733,790
14,047,256 16,292,444 18,246,964 20,279,897
19,477,029 22,446,171 25,180,877 28,021,006
10,758,157 11,666,482 13,127,110 14,714,660
4,914,807 5,570,232 6,276,552 7,007,319
5,843,350 6,096,250 6,850,558 7,707,341
514,966 583,495 657,361 733,790
5,328,384 5,512,755 6,193,197 6,973,551
1,448,788 1,498,918 1,683,930 1,896,109
3,879,596 4,013,837 4,509,267 5,077,443
2.96 3.07 3.45 3.88
1.04 1.10 1.24 1.44
M e r i s t e m R e s e a r c h
Fair Price (N): 65.77
Premium/ (Discount): -14.39%
Upside/ (Downside): 16.81%
2012F Average
109,888,980 120,877,878 98,934,778
75,114,201 82,669,602 67,579,987
34,774,779 38,208,277 31,354,790
219,778 302,195 173,898
34,994,557 38,510,471 31,528,688
6,439,494 7,035,093 5,762,937
(567,825) (683,621) (534,588)
20,847,722 22,941,924 18,759,561
7,707,341 8,533,455 7,006,191
733,790 808,192 659,561
20,279,897 22,258,303 18,224,973
28,021,006 30,785,208 25,182,058
14,714,660 16,252,168 13,303,715
7,007,319 7,718,713 6,297,525
7,707,341 8,533,455 7,006,191
733,790 808,192 659,561
6,973,551 7,725,263 6,346,630
1,896,109 2,100,499 1,725,649
5,077,443 5,624,764 4,620,981
3.88 4.30 3.53
1.44 1.59 1.28
18 | P a g e
Industry: Food/Beverages and Tobacco
FYE: December 31
Mkt Cap (N’bn): 64.11 (US$ 556.50m)
IMPORTANT DISCLOSURES
Meristem Research equity analysis stock report and its attendant
recommendations are prepared based on publicly available
information and are meant for general informative purposes.
Meristem Research can neither guarantee the accuracy nor
completeness of the information as they are an expression of
our analysts’ views and opinions. Meristem Research cannot be
held responsible for any loss suffered by relying on the said
information as this information as earlier stated is based on
estimates and opinions and is meant for general information
purposes and not as solicitation to buy securities and financial
instrument.
© Meristem Research
MERISTEM SECURITIES LTD
124, Norman William Street,
Ikoyi, Lagos.
Phone: 234-01-2717350-5, Fax: 2717356
E-mail: [email protected]
Website: www.meristemng.com
Nigeria Equity Research August 6, 2008
M e r i s t e m R e s e a r c h
Nigeria Equity Research
August 19, 2008
Current Price (N): 49.92 Fair Price
52-Wk H/L (N): 70.00/40.00 Premium/ (Discount):
Volatility (β): 0.48 Upside/ (Downside):
Meristem Research equity analysis stock report and its attendant
recommendations are prepared based on publicly available
information and are meant for general informative purposes.
Meristem Research can neither guarantee the accuracy nor
he information as they are an expression of
our analysts’ views and opinions. Meristem Research cannot be
held responsible for any loss suffered by relying on the said
information as this information as earlier stated is based on
is meant for general information
purposes and not as solicitation to buy securities and financial
5, Fax: 2717356
M e r i s t e m R e s e a r c h
Fair Price (N): 65.77
Premium/ (Discount): -14.39%
Upside/ (Downside): 16.81%